1. Introduction
Welding can be classified as an application of additive manufacturing (albeit partial and crude), as even large and geometrically complex assemblies can be produced by decreasing the number of scraps to reasonable levels. For this reason, welding continues to have a massive application in the manufacturing of engineering structures that are critical in terms of safety and reliability. This is made possible by the continuous development of welding technologies and process control systems. However, some critical issues remain, mainly related to the high and localized thermal input inherent to the process itself, which can lead to significant shape variations in the finished part [
1]. In particular, the plastic thermomechanical strain, induced by localized heating, melting, and cooling in the vicinity of the weld bead, causes permanent distortions that affect the entire welded structure. Such distortions can be detrimental to the appearance, dimensional accuracy, and strength of the welded structure [
1]. The deviation from the nominal geometry depends on the size and geometrical complexity of the assembly and can be large enough to require additional machining (e.g., to solve fit-up problems when assembling welded components to other structures).
The non-linear, irreversible nature of the welding process and the presence of residual stresses make it impractical to prevent or completely correct welding distortion. However, distortion needs to be minimized to an acceptable level in order to remain within the dimensional tolerances of the assembly. Currently, in many industrial contexts where the use of manual welding is still relevant, conventional design methodologies either ignore or use empirical techniques to evaluate the effect of welding on the structural integrity and dimensional accuracy of the welded assembly. In order to implement effective mitigation techniques to control or counteract welding distortion, robust prediction methodologies were developed [
2,
3] based on both theoretical and numerical analyses.
Most of the published work in the relevant literature focuses on finite element (FE) simulations [
2,
3,
4,
5]. Although FE can model transient non-linear coupled thermo-structural problems, the complexity of the welding process and the large uncertainty regarding the parameters involved (e.g., thermomechanical temperature-dependent material properties, thermal and mechanical boundary conditions, thermal loads, etc.) demand careful validation [
3,
6,
7,
8,
9].
Over the years, many contact and non-contact experimental methods have been proposed to measure weld distortion. The less recent experimental data come from contact techniques (dial-gauges, calipers, coordinate measuring machines -CMM- and linear variable-differential transformers-LVDT-) [
1,
6,
10,
11,
12]. With these techniques, experimental data is usually obtained by comparing the
shape of the assembly at a given set of points, before welding and in the post-weld cooled state, relative to a given reference system. The main disadvantage of contact methods is that the measurement is carried out sequentially on a limited and sparse set of points or along a few lines. In addition, the time required for the measurement precludes time-resolved measurements (e.g., shape change during cooling). Finally, the results are highly dependent on the reference system adopted (usually a flat plane) in which the two geometries –before and after welding–are measured and compared. Most of these limitations have recently been overcome with the introduction of full-field non-contact measurement techniques using lasers or camera systems for both in situ and off-line shape and deformation measurements [
13,
14,
15,
16,
17].
Among the non-contact measurement techniques, Digital Image Correlation (DIC) [
18,
19] has become very popular due to its relative ease of use, its adaptability to non-laboratory contexts, and the wide availability of both turn-key commercial systems and open-source codes for camera calibration and data analysis [
20]. Compared to the aforementioned contact methods, DIC has three clear advantages: (i) it is a full-field technique, i.e., it provides a regular and dense data set over the entire surface of the object under investigation, (ii) it is capable of time-resolved measurements at the camera frame rate, and (iii) it is not sensitive to rigid body motion, thus allowing for an accurate and unbiased measurement of shape distortion.
DIC has been applied to both in situ and post-weld measurements. In particular, the DIC method has been shown to be capable of providing full-field information on deformation and strain fields near [
21,
22,
23,
24,
25], far [
26], and on the backside [
27,
28,
29] of welds. However, most papers in the literature analyze welding-induced distortion on laboratory specimens of simple geometries (mainly butt-welded plates [
13,
22,
23,
27,
29,
30,
31,
32,
33]) and give little to no information on the hardware and software parameters of the DIC test, e.g., [
31,
32]. Indeed, experimental tests are mostly reported to complement theoretical and numerical analyses. Only a few papers report on the assessment of the accuracy of the displacement and strain measurements of the DIC system used, e.g., [
22,
23,
34], prior to using experimental data for validation purposes.
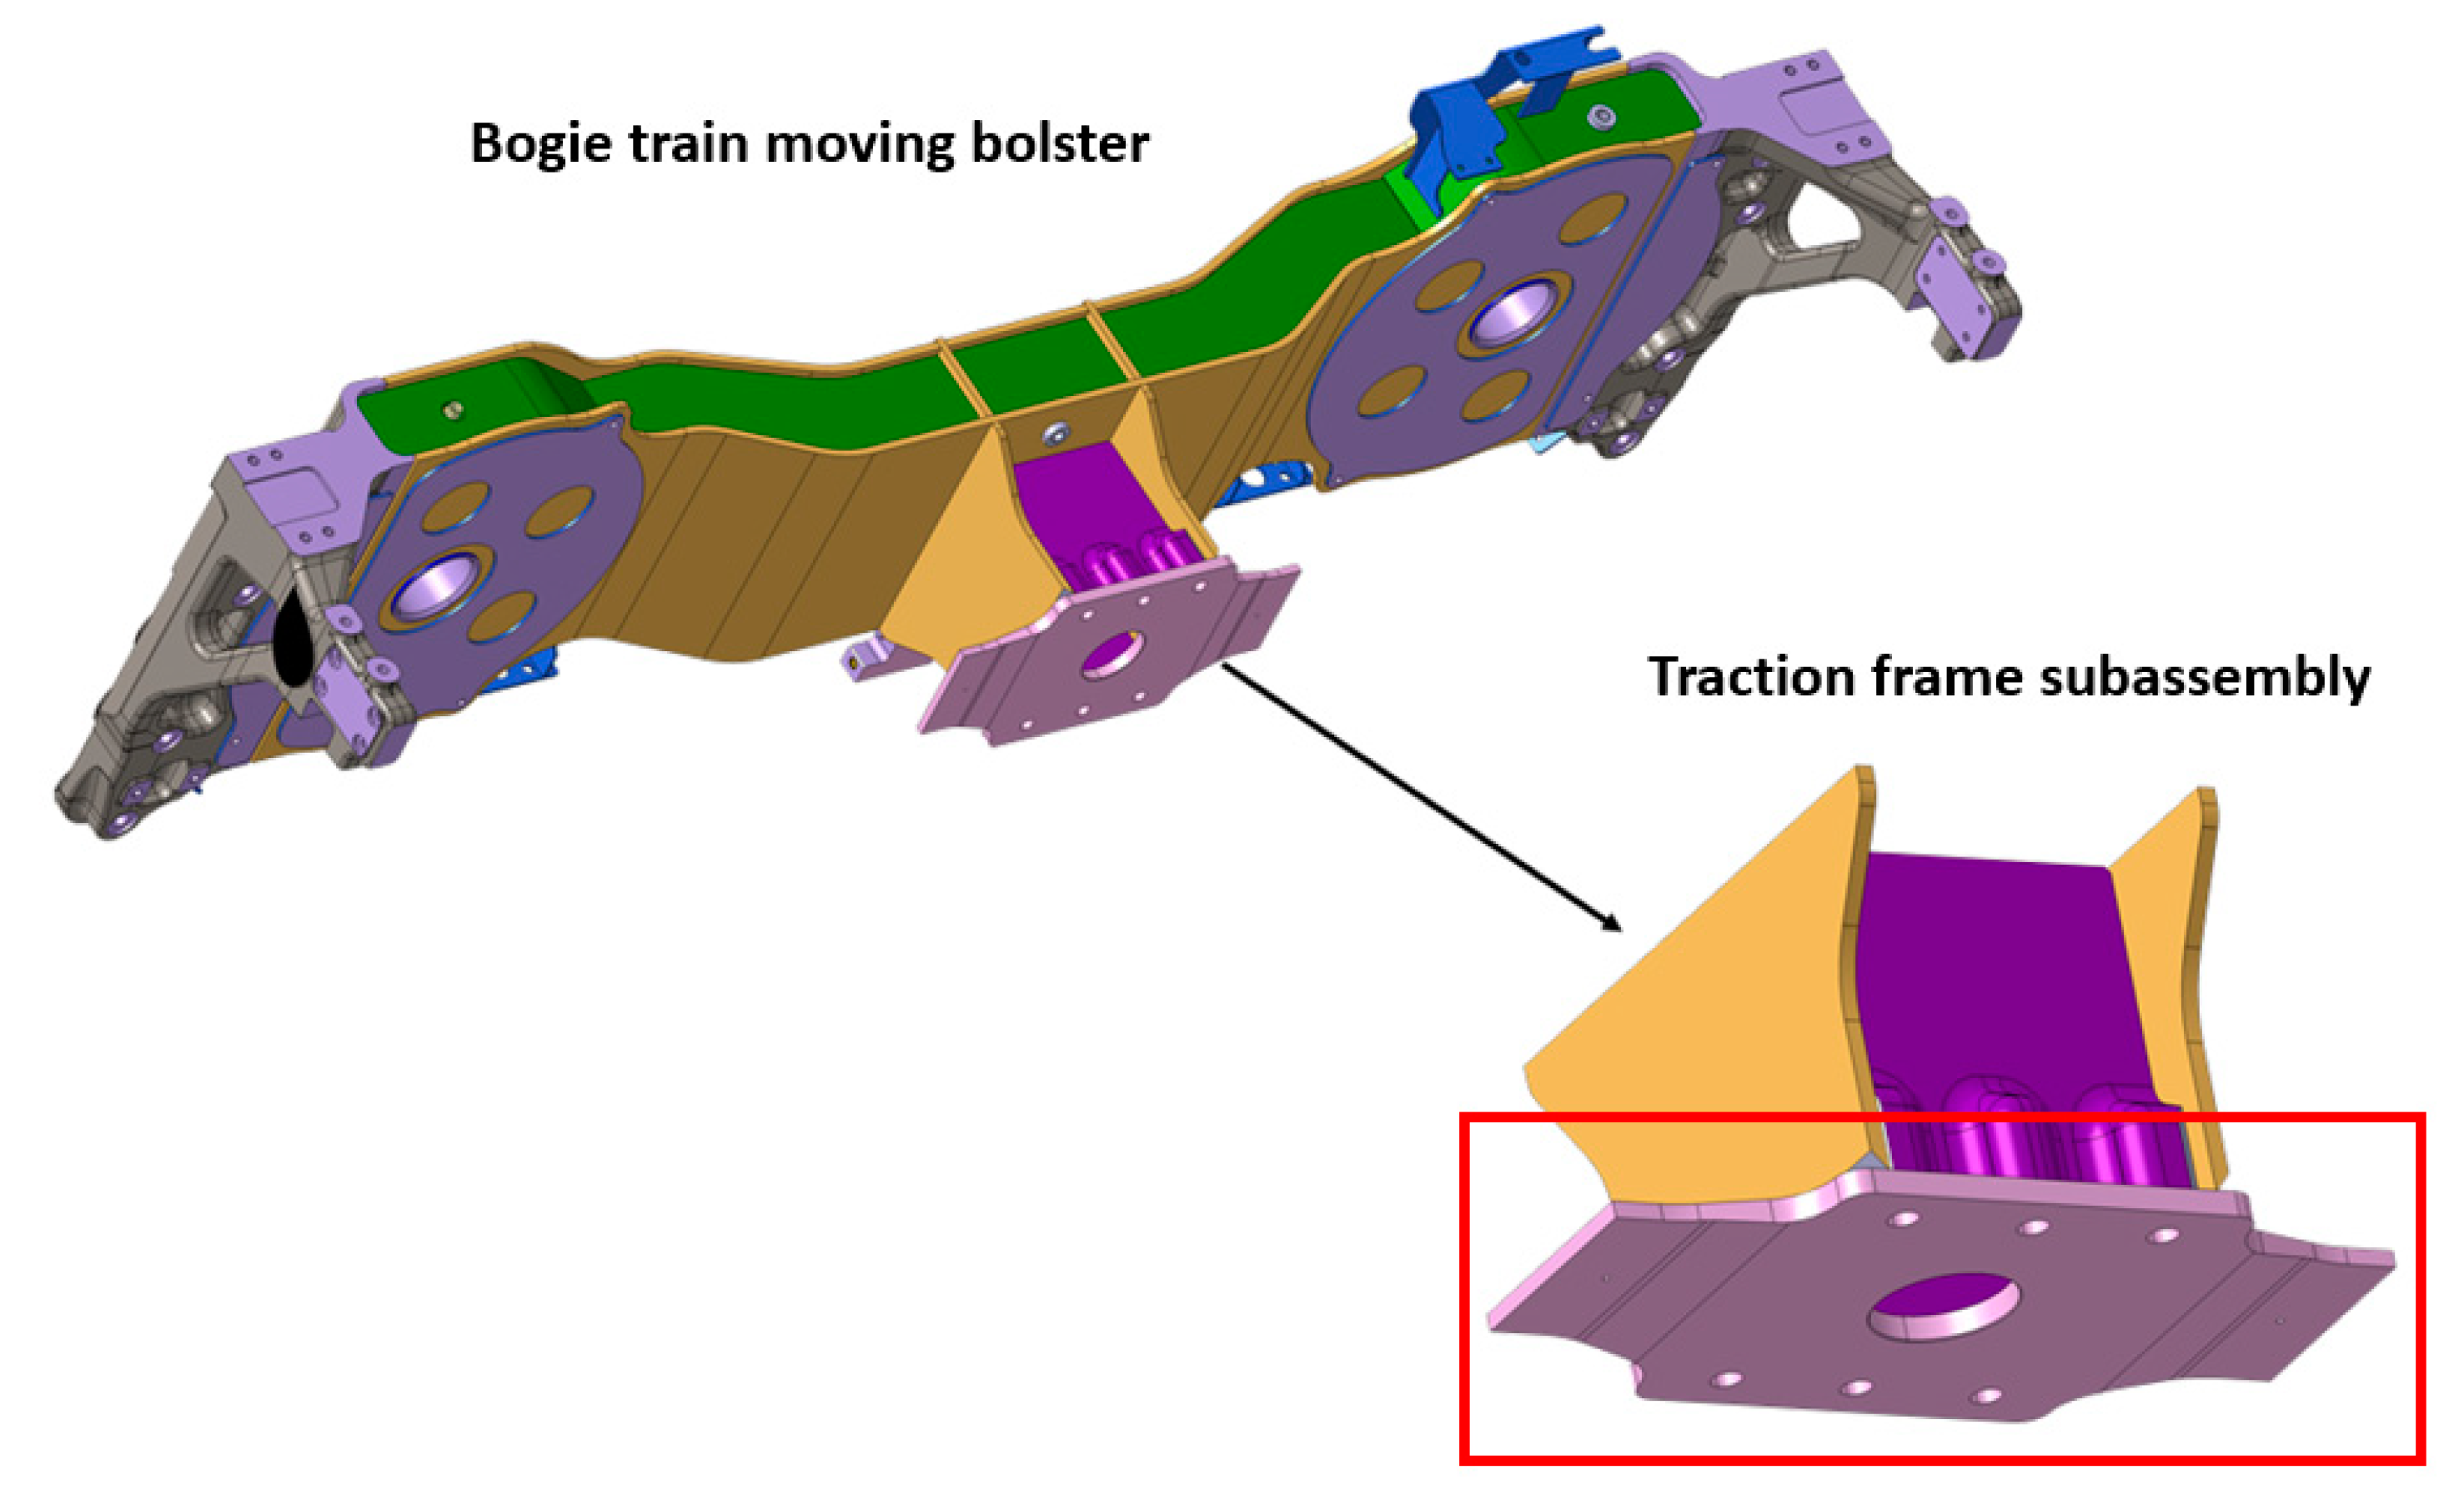
This paper reports and discusses in detail an experimental stereo–DIC test setup to address a specific industrial problem. In particular, we aimed to improve the estimation of the welding-induced distortion of a S355JR- EN10025-2:2019 steel plate of a MIG-welded bogie train bolster subassembly (
Figure 1). Minimizing the shape deviation of the front face of this plate (highlighted in
Figure 1) from its nominal design is an absolute prerequisite for the successive, correct assembly of the traction frame to the train body through a threaded flange. The flatness of the front plate is currently measured against a reference plane on 100% of the products at a limited number of points (<5) using a CMM with a depth measurement resolution of 10
−2 mm. A 2 mm machining allowance is prescribed to bring the flatness tolerance to ±0.2 mm through post-weld machining.
This work investigates the possibility of replacing the CMM measurement with a full-field DIC measurement. Indeed, the ability of DIC to provide accurate full-field data over the entire front surface of the plate could be advantageous in terms of saving time in post-weld inspection and reducing errors in the finishing process. Due to the complex 3D geometry of the traction frame and the need to repeatedly reposition the assembly during the welding process, we opted for an off-line measurement by testing the front plate before and after welding in the cooled state.
We show how the experimental data obtained with off-line DIC measurements allow for the evaluation of the full-surface deformation and strain maps induced on the front plate by the welding process. Particular attention has been paid to verifying that the resolution and accuracy of the measurement, as a result of the DIC hardware and software settings, were appropriate for the specific application [
35].
The paper is structured as follows.
Section 2 describes the DIC method, the experimental setup, and the measurement procedure.
Section 3 presents the results of the experimental tests and discusses the possible sources of errors associated with DIC measurements of weld distortion.
Section 4 summarizes the main findings of the study, compares the method with the current CMM inspection process, and outlines directions for future research.
2. DIC System and Experimental Measurements
Digital Image Correlation is a well-established non-contact technique capable of providing a high-spatially dense set of data on shape, displacement and deformation of an object surface provided with a natural or synthetic stochastic pattern [
18]. In particular, DIC allows the 3D position of a given set of material points to be tracked through a sequence of deformation states by matching homologous point pairs in the corresponding images. To perform 3D surface measurements, two cameras are used to acquire the images of the region of interest (ROI) from two angled views. The spatial matching between the reference image (e.g., right view) and the current image (left view) is performed by finding the point pairs in the two images that have the most similar grey-scale distribution within a square subset of pixels [
18]. After proper calibration of the stereo–camera system, the reconstruction of a given 3D point on the object surface is then obtained by stereo triangulation from its matched image points [
36].
During the last decades, the DIC method has proven its extreme versatility of application in terms of size, materials, geometries, type/amount of deformation, and experimental conditions [
19]. The main strength point of DIC lies in its full-field capabilities, and thus the ability to extract a highly dense set of data over the entire object surface portion captured by the cameras. In contrast to other optical methods (e.g., laser-interferometry [
37]), the measurement sensitivity of the DIC method depends strongly on the spatial resolution of the images [
38], the geometric parameters of the optical set-up (e.g., stereo angle between the cameras, working distance), and the optical settings of the camera lenses (mainly focal length and aperture). Since the result of a DIC measurement is highly dependent on the experimental conditions and on the image data analysis settings [
35], it is good practice to report the selected parameters and to assess the metrological performance of the DIC setup used for the experiments.
The experimental tests of this study were carried out in a laboratory environment (
Figure 2) on the frontal plate of the traction frame (
Figure 1) before and after welding the part to the final assembly (
Figure 2) in the PROMEC workshop. The plate’s overall dimensions are 588 mm long, 308 mm wide, and 18 mm thick (the side wings of the plate have a reduced thickness of 12 mm). Prior to testing, a stochastic speckle pattern was applied to the plate surface using a silicone scrubbing pad and a high temperature (up to 800°) resistant black paint.
The stereo–DIC setup used in this work (
Figure 2) features two scientific-grade cameras (Falcon 4M30, 2352 × 1728 pixels CMOS 8-bit sensor, Teledyne DALSA, Waterloo, ON, Canada) equipped with 28–105 mm Nikkor zoom lenses, Nikon Corporation, Tokyo, Japan and two LED panels (Yongnuo YN600L, 3200–5500 K, 4800 lumen, Yongnuo, Tsuen Wan, China). The stereo–DIC system was calibrated according to a widely-used procedure involving a closed-form solution followed by a non-linear optimization routine for the refinement of intrinsic and extrinsic parameters [
39]. An even, 4th order polynomial function was sufficient to correct for the low radial distortion of the aspherical Nikkor lenses. The two pairs of images acquired before and after welding the front plate to the rest of the traction frame are shown in
Figure 3a–d. The WD, stereo angle, and lens settings were adjusted in order to sample the surface of interest with maximum spatial resolution [
38]. The flat geometry of the surface of interest allowed for the selection of a rather large stereo angle (about 50°), which improved the resolution and reduced the uncertainty of the measurement along the depth direction. The time difference of a few days between the two tests did not affect the quality of the measurement results, as the stereo–DIC setup used for the experiments was calibrated twice, separately, to avoid the effects of a possible system drift.
3. Results and Discussion
The stereo images recorded by the DIC system were processed using an in-house developed Matlab DIC code with large deformation capabilities [
40]. A 5-pixels grid of control points was defined on the entire plate surface, and a 13 × 13 pixels subset with bicubic grey-level interpolation was used to perform a hybrid local–global DIC image registration [
40]. The Scale Invariant Feature Transform algorithm (SIFT, [
41]) served to initialize the image registration by detecting and matching a sparse distribution of features in each image pair. Unlike DIC, SIFT is not sensitive to rotation and scale transformation between images and was therefore able to effectively deal with the large perspective distortion between the right (reference) and left (current) views (
Figure 3). The sparse and noisy disparity maps obtained with SIFT were first fitted with NURBS and then used to coarsely morph the current image into its reference counterpart according to the iterative Image Morphing Method [
40]. This generated two fairly similar images, which were then easily correlated with DIC. The resulting regular and dense set of point pairs was used to generate an updated and more accurate pair of disparity maps to be used for the next iteration. The process continued until convergence, i.e., until the mean distance between the matched point grid in the morphed current image and the reference image was less than a given threshold [
40]. The correlated points in the four images of
Figure 3 were then used to reconstruct the 3D position of the same set of surface points in the non-deformed and deformed configurations. No filtering was applied to the obtained shape and deformation data reported in this paper.
The raw experimental data of the shape measurement of the undeformed plate are shown in
Figure 4. DIC data were reconstructed in the reference system attached to the 3D calibration frame used to calibrate the stereo system. The reconstructed geometry was thus repositioned into a new reference system, with the
xy plane defined as the best-fitting plane of the front plate in its undeformed configuration with its origin at the center of the circular hole (
Figure 4a). Comparison of the z-coordinate contour plots in
Figure 4c,d shows a significant deviation from the nominal geometry prior to welding. In particular, the central region around the hole is not flat and the left lateral wing of the plate shows a significant curvature in the vertical direction.
A single pair of images was sufficient to accurately retrieve the full-surface geometry of the front plate. The superiority of DIC over a CMM is evident when comparing the scarce and sparse set of depth data obtained from the latter measurement, with a regular distribution of more than 8 × 10⁴ DIC data points from which information can be extracted on the deviation from flatness and on the local slope of the surface in any direction.
The front plate was then taken to the PROMEC workshop and welded to the other parts of the final assembly according to the standard technological procedures of the industrial partner involved in this study (see the sequence of welding operations in
Figure 5). The paint used to create the speckle pattern successfully withstood the high temperatures reached during the welding operations. However, in the first welding step, the plate had to be placed face-down on the workshop bench. Friction with the bench during the welding process resulted in some deterioration of the speckle pattern on the upper and lower horizontal edges of the plate (see
Figure 4b). However, this did not affect the image correlation process and the entire surface of the plate was measured (within half the pixel subset size from the edge).
Once assembled, the final part was returned to the University laboratories to acquire the two images of the front plate of the traction frame subassembly in the deformed configuration after welding (see
Figure 3c,d), as well as to evaluate the corresponding displacement and strain maps. As the plate was moved and replaced between the two analyzed configurations, the two corresponding 3D point clouds were reconstructed in two different reference systems. As a first step, the gross rigid body motion (RBM) between the two reconstructed geometries was removed using the Iterative Closest Point algorithm (ICP) [
42]. As a step used for further refinement, an optimization-based procedure aimed at minimizing the distance between the same set of 3D points belonging to the non-deformed and deformed reconstructed shapes was applied. This procedure certainly reduces the amount of RBM between the two geometries compared to the sole application of the ICP algorithm, but it still relies on the selection of the set of points used for alignment within the areas that are assumed to have suffered the least deformation. The strain maps can remove this ambiguity and assist in the selection of the ‘non-deformed’ reference data points, as they are not sensitive to RBM.
The measured full-field displacement distribution over the plate surface is shown in
Figure 6 (see reference system in
Figure 4a). The maps show the expected folding of the side wings due to the welds #1 (
Figure 5a). Large out-of-plane distortion also occurs along the 4th weld path, with peaks at the intersections with the 5th weld paths (compare
Figure 6c with
Figure 5c).
Finally, the full-field Green–Lagrange strain maps were calculated after fitting the displacement distributions with NURBS according to the method described in detail in [
43]. Strain maps show clear pattern symmetries and reveal the existence of equivalent peaks of von Mises strain between the bulges (compare
Figure 7c with
Figure 5b). It is worth noting that the deformation and strain maps have been obtained from a regular and dense distribution of data points which can eventually be interpolated and resampled to obtain values at any point of interest for the analysis (e.g., at the nodes of the corresponding FE model).
After the tests, to verify the resolution and accuracy of the measurement, three feeler gauges of 0.1 mm, 0.5 mm, and 1 mm thickness were attached to the plate with adhesive tape at their ends and provided with a speckle pattern (
Figure 8a). Without changing the settings of the optical setup, the local topology of the region in
Figure 8a was reconstructed using stereo–DIC.
Figure 8b shows the results in the form of depth maps. The plot results are representative of the metrological performance of the DIC system and associated data processing routines used for the experiments reported in this paper. The variation in local geometry caused by the presence of the gauges was correctly retrieved, particularly for the 0.5 and 1 mm gauges. The 0.1 mm gauge was too flexible and bent out of shape in the central region; however, the measured thickness in the vicinity of the fixing tape differs by less than 2% from the nominal thickness of 0.1 mm, confirming the accuracy of the DIC system used in this study.
4. Concluding Remarks
This paper illustrated the capabilities of stereo–DIC to evaluate the full-field deformation and strain maps over large areas of welded assemblies with a real case study. As a first result, DIC revealed an unexpected deviation from the nominal geometry of the part already in the pre-assembly stage, highlighting the importance of always complementing numerical analyses based on nominal geometries with experimental data [
29].
A key issue in determining distortion between two geometries is the definition of their relative position. In fact, an RBM between the two reconstructed geometries occurs when the part is moved and replaced during and/or between measurements. The two plate geometries measured before and after welding can therefore be superimposed in a number of different ways, each resulting in a different distortion map. An optimal solution for this problem is removing the existing RBM between the two geometries using an optimization procedure aimed at finding the translation vector and the rotation matrix that minimizes the distance between homologous point pairs of the two configurations. This strategy is only possible when clouds of matched point pairs are available (as in DIC measurements) and not in the case of unrelated geometries, such as those obtained with CMM or optical 3D scanners [
44]. In the latter case, the ICP method is most commonly used, as it can automatically cope with mismatched and differently-sized point clouds. However, the effectiveness of the ICP is strongly dependent on the object geometry (e.g., for the geometry under analysis there are two possible RBMs at an angular position of 180° relative to the
z axis that cause the two reconstructions overlap). In this work, the above two approaches have been used sequentially to improve the accuracy of the results. The procedure is not fully automated since it still requires the input of the set of reference points to be overlapped, which should be selected by the user among those less unaffected by deformation. In this context, the possibility of experimentally evaluating the strain maps (which are not affected by RBM) is certainly an advantage over the most commonly used 3D scanners (either mechanical or optical).
One of the major limitations of the stereo–DIC technique is the need to prepare the surface to be examined with a stochastic pattern of appropriate characteristics [
18]. A stencil optimized for speckle size and distribution will be used in future investigations to speed up and automate the procedure. The high-temperature paint was found to be resistant to the temperatures generated by the welding process. However, wear of some areas of the pattern was observed due to the friction of the plate with the workbench in the first stage of the welding process when the plate was placed face-down to weld the rear parts. This wear could be virtually eliminated, or at least reduced, by designing a suitable support structure with an optimized distribution of contact pins.
The advantages of this measurement technique are mainly related to its full-field and non-contact nature. The sensitivity of the technique can be further increased by using cameras with higher spatial resolution and/or by increasing the magnification factor of the measurement using a multi-camera setup [
45]. Finally, the dense distribution of experimental data can be fitted with NURBS and the parameters of interest can be evaluated at any arbitrarily chosen position (e.g., at the nodes of the corresponding numerical model), allowing for a seamless full integration with finite element simulations [
34,
46].
It is important to note, however, that DIC experimental data do not necessarily represent the ground truth, as they are susceptible to errors analogous to numerical results obtained from FE analyses. As an example, there is an analogy between the two methods in terms of the representative size of the ROI discretization which is represented by the mesh element for the FEA and by the grid of pixel subsets for DIC [
47]. Analogous to FEA, in the presence of large deformation gradients, the ROI must be sampled properly, i.e., for a given size of the pixel subset (usually not less than 10 × 10 pixels), the image resolution (and hence the lens magnification factor) must increase to avoid strain underestimation [
47,
48]. This is a significant limitation for in situ DIC measurement during welding, as the high temperature and other technological process constraints (e.g., shielding from bright light, sparks, and projected melted material) impose a large distance between the stereo camera and the welding area. This underlines the importance of setting the DIC system parameters on the basis of the expected experimental conditions [
49] and to evaluate the measurement resolution and accuracy of the adopted setup before using DIC experimental data for validation purposes [
35,
47].
In conclusion, this work and related results demonstrate the feasibility of integrating laboratory methods with industrial processes and, although the procedure has not yet been transferred to the shop floor level, it certainly encourages future development.

