Article

Collision Risk Assessment and Operation Assistant Strategy for Teleoperation System

1
Qian Xuesen Laboratory of Space Technology, China Academy of Space Technology, Beijing 100094, China
2
China Academy of Aerospace Science and Technology Innovation, Beijing 100176, China
3
School of Aerospace Engineering, Beijing Institute of Technology, Beijing 100081, China
4
School of Mechanical Engineering, Xi’an Jiaotong University, Xi’an 713599, China
*
Authors to whom correspondence should be addressed.
Appl. Sci. 2023, 13(7), 4109; https://doi.org/10.3390/app13074109
Submission received: 13 February 2023 / Revised: 14 March 2023 / Accepted: 21 March 2023 / Published: 23 March 2023
(This article belongs to the Special Issue In-Space Manufacturing and Assembly)

Abstract

:
Teleoperation robots remain superior to fully automated robots in complicated and unstructured environments (e.g., in-orbit assembly). However, the collision risk is also greatly increased in these environments. Therefore, the teleoperation robot should possess the capability of collision risk perception and be configured with security assistance strategy to improve safety and efficiency. With this objective in mind, this paper proposes a collision risk assessment system based on fuzzy theory, which comprehensively considers the effects of shortest distance, operation speed, and delay time. The introduction of fuzzy theory makes the risk assessment results more accurate. Furthermore, this paper also proposes a creative discrete expandable bounding box method to make the calculation of the nearest distance between complicated obstacles and the robot more efficient and faster. Secondly, to improve the safety and efficiency of teleoperation, this paper proposes a set of teleoperation assistance strategies for teleoperation robots based on collision risk. The strategies include partial view highlighting, variation in the motion mapping ratio, and haptic risk warning, all of which are achieved in the graphical interactive interface. Finally, this paper verifies the proposed collision risk model and the operation assistant strategy through experiments. The results show that the proposed fuzzy collision risk model has a correct trend with risk factors, and the proposed operation assistance strategies can effectively reduce the robot collision risk and improve the safety of teleoperation robots. In conclusion, this research contributes to the collision risk assessment and obstacle avoidance assistance strategy of teleoperation robots.

1. Introduction

With the development of in-orbit manufacturing technology [1,2], in-orbit printing-assembly has become a trend for large spacecraft. In-orbit assembly can be divided into automatic and teleoperated assembly. Fully autonomous robots have certain drawbacks in complicated and unstructured environments, such as in-orbit assembly, due to mechanical, sensor, and control technology limitations [3]. When compared with automated robots, teleoperation robots can combine the initiative of operators with the high precision of the robot, which remain superior to the fully autonomous approach for rapid decision making and the handling of emergency cases [4].
Safety is critical in the field of teleoperation assembly. Due to limited vision, deficient control technology, and the physiological limitations of the operator, the teleoperation assembly robot can easily collide with the surrounding assembly parts, and even slight negligence may cause unnecessary loss [5], especially for high-risk, high-value aerospace exploration tasks. Therefore, collision risk assessment and obstacle avoidance strategies become primary issues in teleoperation applications. This not only boosts the safety of teleoperation systems, but also enhances the efficiency of safely accomplishing the assembly task.
The most straightforward and brief method to avoid collisions with surrounding assembly parts is the virtual fixture, which assists a teleoperation robot to accomplish assembly task by restricting the robot’s movement to certain areas [6] or guiding the robot along a preset path [7]. The virtual fixture can be custom generated [8] or automatically generated [9]. The virtual fixture ensures the safety of the robot system while maintaining a certain degree of operational freedom, but it also constrains the robot from moving beyond the allowed range, thereby limiting the flexibility of teleoperation. In addition, artificial potential field-based control [10] may be a better option to address issues in path planning and real-time control [11,12]. Each surrounding assembly part is considered as the origin of the repulsive potential field; the repulsive force is inversely proportional to the distance from the obstacle, and the risk can be directly assessed by the repulsive force. A drawback of this approach is that the classical potential field cannot capture the relative motion between the robot and the obstacle and is mostly applicable in two-dimensional space.
The above-mentioned methods are more operationally oriented and, for that reason, cannot directly capture the collision risk of the operation. Therefore, teleoperation-assisted control methods based on safety assessment are attracting increasing attention. Zanchettin et al. [13] used the minimum separation distance criterion (MSDC) to evaluate the safety of the robot and to improve operational safety by constraining the robot speed. Sun et al. [14] estimated the collision probability by obtaining the distance between the robot and the obstacle and translating it into a conservative speed limit. A so-called distance-controlled velocity was proposed [15], the key idea of which is to adjust its speed on the specified path according to the robot’s distance relative to environmental obstacles. This concept was further clarified in [16]. These studies evaluated the collision risk of the robot by calculating the closest distance between components. The evaluation results were not sufficiently accurate, because only the influence of a single factor was considered.
To comprehensively assess the collision risk, Vatcha et al. [17] considered velocity in the collision assessment model and proposed the concept of a dynamic envelope, which is a region around the surface of an obstacle whose size depends on the risk assessment results. Nevertheless, this method is only applicable to known simple-shaped obstacles, and a similar concept was proposed in [18]. Rocco and Lacevic et al. [19,20] proposed a hydrostatic and electrostatic hazard field containing information about the robot’s attitude and velocity to assess the hazard level of the robot’s surroundings. Motoi et al. [21] generated a collision prediction map by using the collision time between a robot moving at a certain speed and the surrounding obstacles. A dynamic modified SSM (speed and separation monitoring) method was presented in [22] for ensuring the safety of human–robot collaboration and added some inherent characteristics of robots that had been quantified to the risk index; the safety of the assisting robot was improved by adjusting the speed. Pan et al. [23] not only took direct factors, such as speed and position, into consideration, but they also considered indirect indicators, such as application time and operational proficiency; their work was divided into three levels based on the calculation: safe, dangerous, and very dangerous. The kinematic inverse solution with high safety was selected through the redundancy of the robot arm. This method was also demonstrated in [24], despite causing significant joint movements of the robot arm.
Although these studies considered multiple factors, they mainly used a linear formula calculation approach for risk assessment with a certain percentage of each risk factor. But this is not reasonable, because the role of different factors is not necessarily fixed in different situations. Under such circumstances, the fuzzy theory has shown excellent outcomes as an intelligent method for speed control, temperature regulation, etc. [25]. It incorporates the wisdom of experts into the decision-making process, thus making it applicable to different situations and allowing decision makers to learn and maintain it in the decisions. Fuzzy theory was used to fuzzify the input risk factors in [10], but fuzzy inference methods were not used for crash risk assessment. In [26], fuzzy theory was applied to the collision risk assessment of ships, but, currently, no application has been reported in the collision risk assessment of teleoperation processes.
To address the above issues, this paper proposes a new collision risk assessment model to address the current incomplete and inappropriate issues of collision risk assessment. Based on this model, a series of teleoperation-assisted control strategies have been presented in this paper to improve the safety and efficiency of teleoperation. In order to make a more comprehensive assessment of the collision situation, this paper developed a fuzzy-theory-based integrated collision risk assessment model, which takes three factors into consideration: closest distance, operation speed, and delay time. Moreover, compared to traditional risk evaluation methods, the process of fuzzy reference for collision risk incorporates expert experience, thus helping decision makers in extracting and keeping expert knowledge. In the calculation process of risk factors, this paper puts forward a novel discrete expandable bounding box method in calculating the shortest distance between the robot arm linkage and the surrounding assembly parts; the mechanical linkage is enveloped by a series of bounding boxes of different radii, and the smallest radius of all bounding boxes colliding with the obstacle is considered as the relatively shortest distance, thus reducing the computational difficulty. In order to achieve more effective and safer work for teleoperated robots, this study proposed a teleoperation-assisted control strategy based on the assessed collision risk: The virtual feedback force was linearly mapped to the collision risk through the development of haptic gloves to achieve intuitive physical feedback on the safety of the current operation. The introduction of risk-assessment-based variable scale motion mapping and highlighted dangerous area display method make the robot operate more reasonably and effectively in obstacle avoidance during operation, thus reducing the possibility of collision. Finally, the accuracy and effectiveness of the proposed collision risk model and assisstant strategy were verified by simulation and experiments. In brief, this study provides an effective method for collision risk assessment and the obstacle avoidance of teleoperation robots.
Apart from Section 1, the paper is organized as follows: Section 2 describes the system overview. The detail of graphical modeling is described in Section 3. Section 4 presents the collision risk assessment model. Section 5 introduces the assistant strategy of teleoperation. Next, in Section 6, the designed collision risk assessment model and assistant strategy are verified and analyzed by experiments. Finally, Section 7 summarizes the research of this paper and puts forward future work.

2. Proposed System

As is shown in 
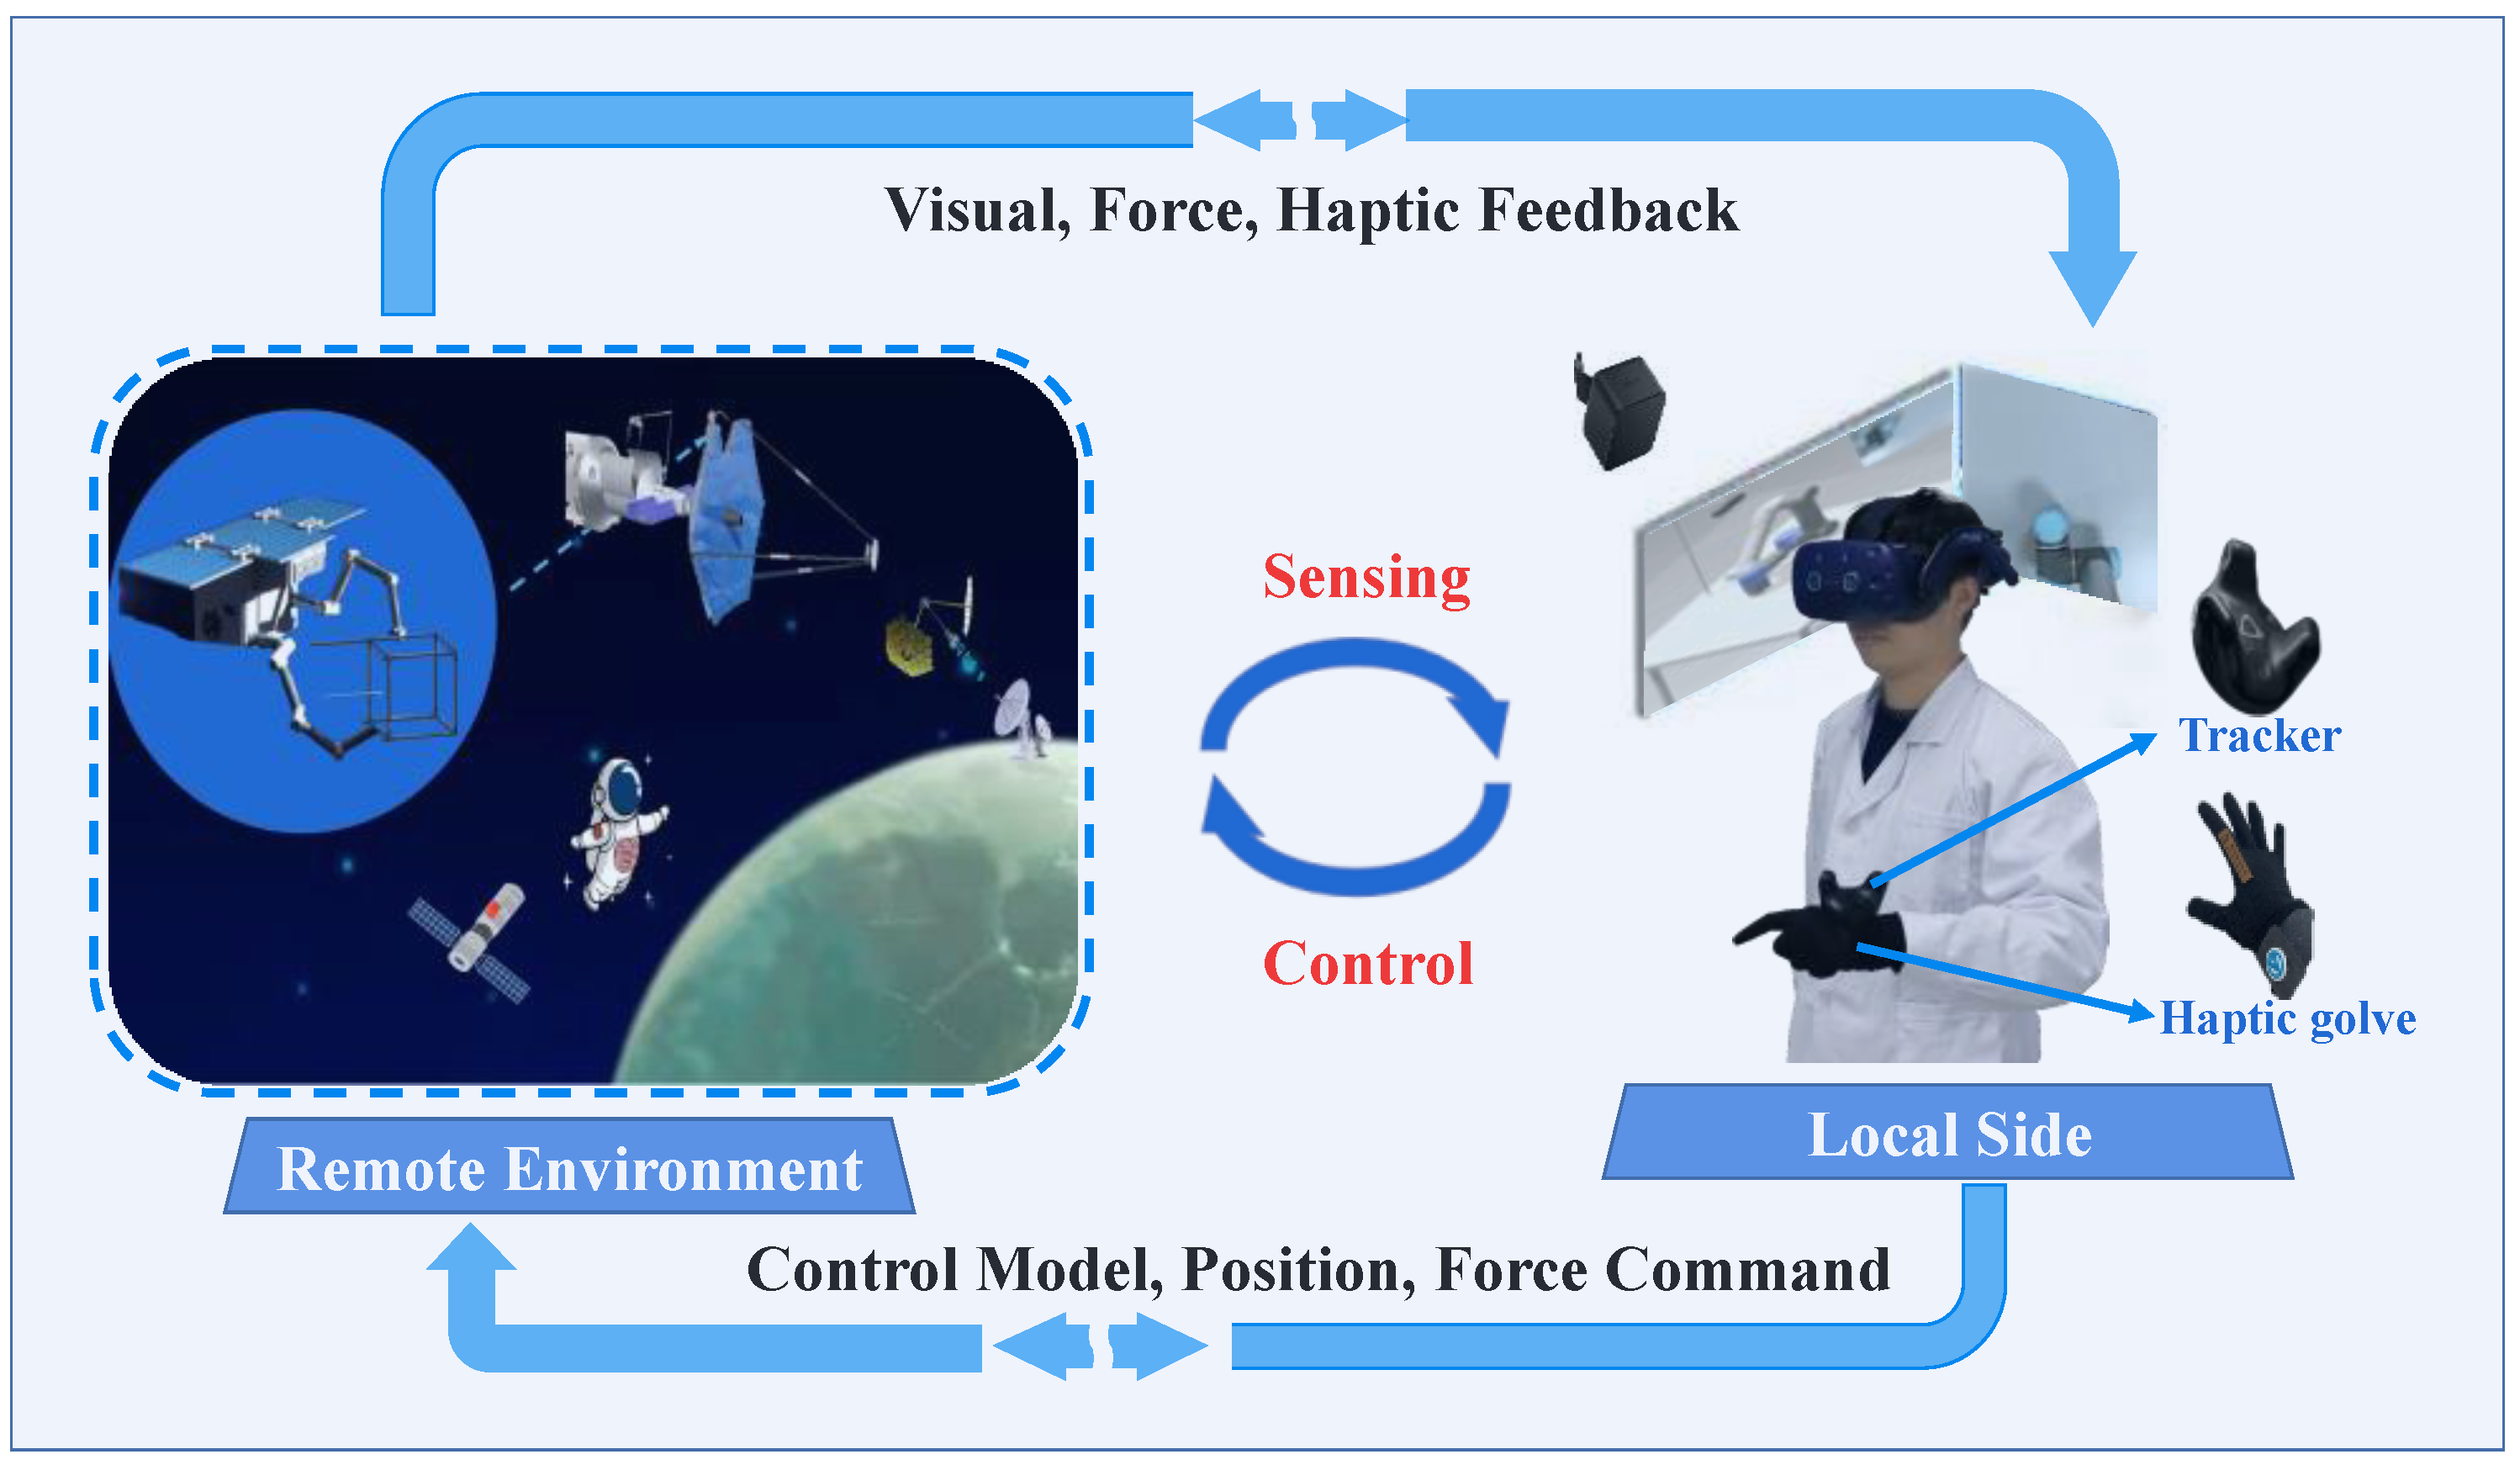
Figure 1, a typical teleoperation assembly system is constituted of a local side and a remote side. The local side is composed of an operator, a visualized interface of the remote environment, a haptic feedback glove, and a position locator. In the master subsystem, all the devices are wireless, which enables the operator to control the objects naturally and flexibly. On the remote side, a cooperative robot is installed to perform in-orbit assembly tasks. At the end of the robot, a force sensor is equipped to measure the contact force. The video streams are acquired using RGB depth (RGB-D) cameras. The communication between the local side and the teleoperation robot is performed by protocol/internet protocol (TCP/IP).
When an operator sends the command to the remote side through the position locator device, the virtual robot, as well as the teleoperation robot, follow the trajectory of the locator device. A wireless position locator device (VIVE Tracker, HTC Inc.) was adopted in this system to perform motion tracking. Following a communication delay, the teleoperation robot is controlled by the commands, and the visual, contact force information were fed back to the operator.
During teleoperation assembly, the robot must keep avoiding collisions with surrounding assembly parts. Even a minor collision can cause serious damage to the robot or workpiece. To improve the safety and efficiency of teleoperation assembly, this paper proposes a teleoperation-assisted system based on collision risk assessment. Two main procedures were implemented in the entire framework: First, a collision risk assessment model based on fuzzy inference was proposed, and motion security in the VR environment was evaluated. Secondly, assistant strategies were defined based on the evaluated collision risk to improve the manipulation safety and efficiency.
Figure 2 describes the entire framework of the teleoperation system. Based on the visual information of the depth cameras, the graphic model of the teleoperation robots and environment was built using the 3D reconstruction technique. The operator obtained the shortest distance relative to the obstacle, delay time, and operation speed in a graphical interface by controlling the virtual robot in real time in a virtual environment. In this system, the shortest distance was measured by the proposed discrete expandable bounding box method. Based on the aforementioned three elements, this paper designed a fuzzy-theory-based collision risk assessment model to evaluate the security of motion. Furthermore, three guidance strategies were defined in this paper according to the evaluated collision risk, including partial view highlighting, variation in motion mapping ratios, and haptic risk warnings. These assist strategies were implemented with the described physical interaction units.

3. The Establishment of the Virtual Environment

Due to the collision risk assessment and teleoperation assistance strategies were implemented in the VR environment. The reconstruction of the remote environment was critical for the designed teleoperation system.

3.1. The Graphical Modeling of the Robot

In the system designed in this paper, a 6-DOF lightweight robot (UR5, Universal Robot Inc.) was employed as the teleoperation robot. The master position, acquired from the localizer in a Cartesian coordinate system, was transmitted to control the virtual robot. The position of the localizer needed to be converted to a set of robot joint angles to allow an accurate description of the desired robot posture. In this paper, the D-H method based on the shortest path principle was adopted to solve the inverse-kinematics problem. Based on the calculated joints of the robot and geometric parameter, a visualized interface of the robot arm was realized as shown in Figure 3. OpenSceneGraph 3.4.0 (OSG), an object-oriented, cross-platform 3D graphics toolkit that offers the features and capability of OpenGL, was used to build the graphical modeling of the robot [27].

3.2. The Graphical Modeling of the Environment

In contrast to the teleoperation robot, there are usually no sensors arranged on the manipulated object to directly obtain location information. Therefore, we achieved the reconstruction of the geometry model by visual localization.
In this research, a camera was fixed on the table for identification and positioning of the object. Owing to the extremely low price and good performance, the Realsense (D455) vision sensor was employed in our system to locate the target objects. In order to realize accurate and stable posture detection, this research designed a marker-based posture detection method by integrating ArUco markers at the objects. The Sergio algorithm [28] was adopted to locate the posture of the markers.
The ArUco marker is a square marker composed of a wide black border and an inner binary matrix that determines its identifier (ID number), as shown in Figure 4. The main benefit is that their detection is robust, fast, and simple. By combining the ID number of the ArUco marker and the projection state of the black border in the camera image, the posture of the target relative to the camera can be calculated. Moreover, ArUco markers are not only used for component positioning, but also store and extract component assembly information for multi-component assembly task planning.
As shown in Figure 5, The following processes make up the positional estimation of ArUco markers:
(1)
Enhanced grayscale image boundary thresholding that uses a locally adaptive thresholding technique. Contour extraction was performed on the threshold image using the Suzuki algorithm [29], and, then, polygon approximation was performed using the Douglas–Peucker algorithm to detect possible candidate markers in the scene.
(2)
To evaluate if the aforementioned potential markers were “genuine” markers, the internal encoding of the markers was recovered.
(3)
To determine if the aforementioned candidate markers were actual markers or simply a byproduct of the environment, marker ID recognition and error correction were carried out.
(4)
To determine the marker’s position in relation to the camera, corner point optimization and pose estimation were performed.
(5)
Based on the relationship between the camera coordinate and the base coordinate, the posture of the marker relative to the base of the robot arm was calculated.
In this study, the 3D model of the object was constructed in SolidWorks, and then these models were assembled in OpenSceneGraph to determine the posture of the surrounding assembly parts by the acquired positioning information. Finally, the robot arm model and the reconstructed virtual environment were combined in one scene, as shown in Figure 6.

4. Collision Risk Assessment

A dynamic collision risk assessment model based on fuzzy theory was developed in this study to assess the collision risk of operational activities during teleoperation. Specifically, the collision risk assessment method consists of three steps: selecting the assessment factors, obtaining the assessment factors, and calculating collision risk in real time using fuzzy theory.

4.1. Selection of the Evaluation Factors

The accurate and appropriate selection of risk indicators is the basis for correct collision risk assessment. Currently, most studies only consider distance as a factor, which leads to less accurate assessment results. In this section, three basic factors that have a significant effect on collision risk were selected to build a fuzzy factor indicator set, which included three factors such as the relative shortest distance D, the delay time of teleoperation T, and the speed of operation V. These factors can accurately reflect the risk degree of robots. Moreover, these indicators are irrelevant to each other.
  • The relative shortest distance D:
Since collision occurs at a distance of zero, the relative shortest distance has a direct impact on the collision risk. It is also the factor of most interest in the current research. The closest distance is the shortest physical distance between each obstacle nearby and the robot arm linkage. It is not just the distance from the robot arm’s end to the workpiece’s center, but is an object-to-object distance.
2.
The delay of teleoperation T:
For teleoperation robots, the time delay is one of the critical factors affecting operation risk. The time delay includes the signal transmission delay caused by limits on the speed of radio transmission and the data processing delay at sending and receiving stations and satellite relay stations. Furthermore, the delay time of teleoperation is not a definite value, and it is very susceptible to the quality of signal transmission. The uncertain time delay will cause some uncertainty [5] in the whole teleoperation system, which directly increases the risk of collision. Therefore, the delay time of the system should also be considered as one of the factors.
3.
The operation speed V:
Operation speed is closely related to collision risk. For example, the collision risk at a high speed is much higher than that in slow conditions. Especially in the case of large latency, fast speeds can cause large deviations between the remote operation and the visual display. Consequently, teleoperation robots are prone to colliding with non-target objects. As can be seen from the above, operation speed is an important factor that has a significant effect on the collision risk.

4.2. Calculation of the Evaluation Factors

  • Calculation of the relative shortest distance
Due to the irregular shape of the obstacles and the robot, it is challenging to calculate the distance between the connecting rod of the robot and the surrounding assembly parts using the conventional method. To simplify this problem, the method of the bounding box [27] was applied in this paper. Additionally, when measuring the nearest distance with conventional techniques, the two closest positions of the robot and the obstacles must be obtained, which can be challenging to accomplish [23]. Therefore, in this study, the discrete expandable bounding box approach was proposed as a solution to tackle this issue.
To illustrate this method briefly, only one obstacle is introduced. As is shown in Figure 7, the connecting rods of the robot are wrapped with expanding capsule envelopes of various radii. The radii of the capsules are R 0 , R 0 + d 1 , R 0 + d 2 , and … R 0 + d n , respectively, where R 0 denotes the smallest radius needed to completely enclose the robot arm. These preset envelope boxes move in tandem with the robot arm as it moves. Therefore, the shortest distance between the robot connecting rod surface and the surrounding obstacles can be converted into a collision detection problem between the bounding boxes and the surrounding obstacles. The smallest radius in all bounding boxes that collides with obstacles is considered as the relative shortest distance.
The aforementioned procedure was performed utilizing the designed digital interface whose image processing function can handle the mentioned bounding box collision detection and offer feedback on the radii of contact layers. Despite the discretization method’s limitations of precision, the issue is made more solvable, and the inaccuracy is within acceptable bounds.
The specific calculation process is shown in Equations (1) and (2):
R b o x i = R 0 + d i ( d i < d i 1 )
D = min ( d i _ c o n t a c t e d )
where, R b o x i represents the radius of the i layer bounding box, R 0 denotes the smallest radius needed to completely enclose the robot arm, d i denotes the increase in the radius of the i -th bounding box compared to the minimum radius bounding box, and d i _ c o n t a c t e d indicates the increase in the radius of the bounding box where contact occurs.
2.
Calculation of delay time T
The delay time comprises the delay in signal transmission brought on by radio transmission speed restrictions as well as the delay in data processing at sending and receiving stations and satellite relay stations [30]. As a result, the delay time is the amount of time that passes between sending a response signal by the local side and getting it from the remote side. To gauge the delay time, a master signal was created. It was initially transmitted by the local side, if it was accepted by the slave, the response signal was sent back to the host. The time gap was used as the delay time of the current command period. The formula for calculating the delay time of the current command cycle is as follows:
T i = T i _ r e c e v i e T i _ s e n d
where, T i represents the delay time of the i command cycle, T i _ s e n d is the the time of sending signal, T i _ r e c e v i e presents the time of receiving response signal, and i is the command cycle.
3.
Calculation of operation speed V
The operating speed of the current state is directly proportional to the movement distance, so the speed is calculated by the movement distance, which is calculated as follows.
The operating distance of the current state is:
S i = ( p i p i 1 ) 2 + [ ( r i r i 1 ) / 6 ] 2
where, S i denotes the movement distance of the operator; p i ( p x , p y , p z ) refers to the 3D position coordinate of the operator at the sampling period i ; p i 1 indicates the position of the operator at the sampling period i 1 ; r i ( r x , r y , r z ) denotes the posture of the operator at the sampling period i ; and r i 1 indicates the posture of the operator at the sampling period i 1 . The operating speed V at this point is:
V = S / T s a m p l e
where T s i m p l e is the time of the sampling period.

4.3. Collision Risk Assessment Model

Fuzzy set theory was proposed by Zadeh in 1965 and is extensively applied to model uncertain systems when there is no complete and precise information [31,32]. As shown in Figure 8, A typical fuzzy system consists of three function layers: an input layer, a fuzzy inference layer, and an output layer. According to traditional set theory, an element either belongs to a particular set or not. However, in fuzzy set theory, the association of an element with a particular set lies between 0 and 1, which is called the membership degree. As with distance and collision risk, the degree of danger cannot be expressed precisely, but can be described in fuzzy terms, such as “extremely dangerous” or “somewhat dangerous”, Additionally, the fuzzy inference layer combines expert experience, which can help decision makers in extracting and keeping expert knowledge. Therefore, the fuzzy theory was introduced in this study.
  • Fuzzy set and fuzzification
The purpose of fuzzification is to transform the exact input variables into fuzzy variables with linguistic meaning. Before the performance of fuzzification, a scale transformation of the input values was executed to convert them into their corresponding domain ranges. The output domain was [0–5], and the transformed input domains were T = [0–5], V = [0–5], and D = [1, 2, 3, 4, 5, 6, 7, 8, 9, 10] respectively. The transformation of the shortest distance is nonlinear, which is set according to the discrete radius of the envelope and experience. The transformation formula is:
D ¯ = 1 ( 0   cm < d 1   cm ) 2 ( 1   cm < d 2   cm ) 3 ( 2   cm < d 3   cm ) 4 ( 3   cm < d 5   cm ) 5 ( 5   cm < d 7   cm ) 6 ( 7   cm < d 9   cm ) 7 ( 9   cm < d 12   cm ) 8 ( 12   cm < d 15   cm ) 9 ( 15   cm < d 20   cm ) 10 ( 20   cm < d 30   cm )
where D ¯ is the transformed distance, and d is the true distance.
In fuzzification, common membership functions include the Triangular membership function, the Trapezoidal membership function, the Gaussian membership function, the Sigmoid membership function, etc. [31]. The speed membership function was used here as an example to illustrate the setting up process. As the division of different speed fuzzy sets was symmetrical and uniformly distributed, the linear triangular membership function and linear trapezoidal membership function were utilized. The speed within the region was roughly divided into five parts, and the slope of the trapezoidal and triangular membership functions were established according to the requirement that the membership function of each speed point belonging to the fuzzy subset was greater than 0.5. The final established membership function for a uniformly symmetric distribution is shown in Figure 9, Figure 10 and Figure 11. The fuzzy sets of shortest distance in the form of linguistic rating variables were described as ‘Very close (NB)’ ‘Relatively close (NS)’, ‘Moderate (M)’, ‘Relatively far (PS)’, and ‘Far (PB)’. Similarly, as is shown in Figure 12, a set of fuzzy affiliation functions were created for the model output, which were represented as ‘Very dangerous (NB)’, ‘Relatively dangerous (NS)’, ‘Dangerous (M)’, ‘Relatively safe (PS)’, and ‘Safe (PB)’, respectively.
2.
Fuzzy rule and fuzzy inference
The basis of fuzzy inference is presented as output fuzzy variables, which are inferred from input fuzzy variables based on a set of fuzzy inference rules in linguistic terms [33], which are extracted from expert knowledge.
The fuzzy rule is expressed in the form of “If-Then”, and two components make up the “If-Then” rule: an antecedent that is compared to the input and a consequent. A fuzzy rule base contains a set of fuzzy “If-Then” rules, and these fuzzy “If-Then” rules are employed by fuzzy inference to define a mapping from input fuzzy sets to output fuzzy. In this paper, the fuzzy “If-Then” rules designed according to the expert experience were expressed as a language rule system with three inputs and one output:
R1: if “T” is NB and “V” is NB and “D” is PB, then Safety degree K is NB;
R2: if “T” is NB and “V” is NB and “D” is PS, then Safety degree K is NB;
……
Rn: if “T” is NB and “V” is PB and “D” is PB, then Safety degree K is PB;
The fuzzy reference rule tables, in the case when the delay time is NB, NS, PS, and PB, can be expressed in the forms of Table 1, Table 2, Table 3 and Table 4.
Mamdani [34] and Sugeno [35] are two frequently employed methods for fuzzy inference systems. Researchers rely heavily on Mamdani fuzzy inference method due to its practicality and efficiency. In light of this, the max-criterion Mamdani inference mechanism was implemented in this study for collision risk inference.
3.
Defuzzification
Defuzzification is used to the convert fuzzy outputs into clear outputs. There are several common defuzzification methods such as the center of the area (COA), the bisector of the area (BOA), the mean of the maximum(MOM), the smallest of the maximum (SOM) and the largest of the maximum (LOM) [25]. In the defuzzification layer, the output fuzzy numbers are converted to crisp numbers through the center of the area (COA) defuzzification method.
Center   of   area :   Z COA = Z μ A ( Z ) Z d z Z μ A ( Z ) d z

5. Teleoperation Assistant Control Strategy Based on Collision Risk Assessment

Virtual reality is a critical method to tackle the large time-delay problem [36]. The operator can control the robot directly in the virtual environment, yet safety and efficiency issues are still present. In teleoperation, the remote-end robot follows the trajectory of the local side. The robot will inevitably collide with the surrounding environment owing to factors such as planar visual errors and handshaking. Meanwhile, when approaching an obstacle (workpiece), the traditional teleoperation method applies a running step to observe and confirm a step for the sake of safety, thereby resulting in lower efficiency. To solve these problems, this paper proposed a teleoperation assistance strategy based on dynamic collision risk assessment to improve teleoperation safety and efficiency.
Based on the 3D modeling, this paper designed a graphical interface in which all the designed assistant operation methods were implemented. As is shown in Figure 13, the graphical user interface was segregated into four sub-modules: the virtual prediction sub-module, the local highlighting sub-module, the real-time image-returning sub-module, and the information-displaying and command-sending sub-module.

5.1. Graphical User Interface of Teleoperation

The top left corner of the interface is the predictive-simulation interface, which is built using the OSG based on remote environment information. In this virtual interface, the operator can control the virtual robot in real time through the wearable positioner. The “Status” sign in the lower right corner indicates whether the robot arm is malfunctioning: the green color indicates normal, and the red color indicates collision and other failures. The relative shortest distance between the robot and the surrounding obstacles can be obtained in real time during the movement by the proposed bounding box method. Moreover, the input parameters required for the dynamic collision risk assessment model, such as operation speed and delay time, can also be obtained in real time. The calculated collision risk assessment value is displayed in the information display column (lower left corner), which displays the angle information of each joint of the teleoperation robots at the same time. This column also contains several function buttons on the upper side, such as the start and end of the control program, the update of the simulation interface, etc. The video information of the remote environment acquired from the depth camera is displayed in the bottom right corner of the interface to facilitate the operator to grasp the real environment.

5.2. Assistant Strategy for Teleoperation

Based on the user interface, the teleoperation assisstant strategies include the following three aspects.
Strategy 1: Collision risk indication based on haptic feedback glove
Considerable studies have been conducted on virtual guidance force based on haptic feedback devices such as generating virtual guidance force based on artificial force field theory. This method synthesizes the integrated guiding force based on the repulsive force of the obstacle and the attractive force of the target so that the operator can intuitively feel the distance from the surrounding obstacles. This paper presented a haptic feedback strategy based on collision risk assessment. The risk assessment model not only includes the distance to the surrounding obstacles, but it also includes the operation speed and delay time. After completing the collision risk assessment of the current state, the haptic glove intuitively indicates the collision risk of the current operation to guide the operator to make reasonable decision. The feedback force exerted by the glove is proportional to the risk of collision; the higher the risk, the stronger the force. The glove used in this study is a force feedback glove developed by the laboratory [37], which can achieve a resolution of 0.02 N and a force feedback of up to 1.55 N.
Strategy 2: Variable motion mapping ratio based on collision risk assessment
Reducing the operation speed or lowering the motion mapping ratio of the master–slave is an effective means of improving operational safety. However, the continuous adjustment of the robot operating speed may also affect the task execution efficiency. Herein, the motion mapping ratio was adjusted to three levels according to whether the collision risk reached the set threshold. The motion mapping ratio of the master–slave end decreases as the risk index increases, thus improving the operating accuracy and reducing the collision risk. Risk thresholds and motion mapping ratios are obtained based on expert knowledge and experience.
The collision risk assessment index to motion mapping ratio can be expressed by the equation:
K = k 1 ( s d < s s a f e ) k 2 ( s s a f e s d s d a n g e r ) k 3 ( s d > s d a n g e r )
where s d denotes the collision risk value obtained by fuzzy theory.
The motion mapping ratio K of the master–slave is the ratio of the relative posture change of the master robot to the relative posture change of the slave robot. The relationship between the control position of the robot and the relative posture change of the operator is expressed by the following equation:
P r o b o t _ i = P r o b o t _ i 1 + K P t r a c ker = P r o b o t _ 0 + K ( P t r a c ker _ i P t r a c ker _ i 1 )
where P r o b o t _ i is the current control position, P r o b o t _ i - 1 is the robot position at control period i 1 , and P t r a c ker _ i   and     P t r a c ker _ i - 1 are the current and the last positioning position of tracker which is controlled by operator, respectively.
Strategy 3: Local highlighting display
This strategy is a further optimization based on the designed Strategy 2. In Figure 13, the top right corner of the user interface is the local highlighting sub-module whose function is to highlight the areas of high collision risk in order to assist the operator in observing the virtual environment more carefully. Objects with the highest collision risk are shown in red. The highlighted magnification of the view is aligned with the motion mapping ratio in Strategy 2 to improve coordination of the operation. The current magnification is shown as the value in the upper right corner.

6. Experiment and Discussion

A prototype of the system was developed. The correctness of the collision risk assessment model and the effectiveness of the operation assist strategies were verified by experiments. Experiments were carried out based on a physical environment that was composed of a 6 DoF UR5 robot arm, a Robotiq force sensor, a Robotiq adaptive parallel gripper, a Realsense camera, and a worktable. All of the experiments were performed on an AMD Core R5-4600 CPU and Windows 10 system.

6.1. System Evaluation

In this section, the accuracy of the designed localization method was measured. In addition, the setting of the discrete expandable bounding box method was illustrated and its effectiveness in distance measurement was verified.
  • Localization accuracy
The UR5 robot arm can provide high-precision position information, and the repeated positioning precision in the x, y, z direction was ±0.02 mm, ±0.02 mm, and ±0.05 mm, respectively. Therefore, the accuracy of the designed positioning method can be evaluated by using the localization information of the robot in different positions. As is shown in Figure 14a, the markers were fixed to the end of the robot. The end of the robot was guided to 10 different points using a point-to-point motion form (Figure 14b). The position of the target marker can be obtained by the visual algorithm. The error between the position obtained by the localization method and the information read by the robot represents the accuracy of the localization algorithm.
As is shown in Figure 15, the positioning error along X, Y, and Z-axis did not exceed 0.5 mm, and the angular error around X, Y, and Z-axis was less than 1° in the whole working space. The positioning error was no more than 1 mm and 2°. Therefore, this method has high accuracy and good stability. In the future, the marker can be printed together with the workpiece through 3D printing.
2.
Validation of the discrete expandable bounding box method
This paper proposed a new method for calculating the nearest relative distance based on the discrete expandable bounding box, where the shortest distance can be obtained by pre-setting the bounding boxes with different radius. Empirically, the bounding boxes are divided into 15 layers, and the radius of each layer is R n = R 0 + d n and d n = [1 cm, 2 cm, 3 cm, 4 cm, 5 cm, 6 cm, 7 cm, 8 cm, 9 cm, 10 cm, 12 cm, 15 cm, 20 cm, 25 cm], respectively. R 0 is the minimum radius that can just achieve the robot arm enclosing. The smallest added radius of the bounding box ( d n ) that is contacted with the surrounding obstacles represents the shortest distance. The design of the radius revealed that the radius was unevenly distributed, which is reasonable, because more precise information is needed when approaching obstacles, for example, the spacing of R 1 , R 2 , and R 3 was only 1 cm. When the distance was about 20–30 cm, the safety was high and no more effort was needed to focus on the actual distance. A screenshot of the shortest distance acquisition through this method is shown in Figure 16. As is shown in the right of the figure, the robot arm link was enclosed by multiple layers bounding box. The D in the upper right corner represents the shortest distance calculated theoretically, and the Dr represents the shortest distance calculated by the discrete expandable bounding box. Therefore, the error did not exceed d n / 2 .

6.2. Validation of the Collision Risk Assessment Model

To validate the correctness of the proposed collision risk assessment model, three scenarios were designed in the virtual environment. A different assessment factor was kept for each scenario to verify the correct relationship between the collision risk and the factors. To illustrate the problem intuitively, one obstacle was placed. The coordinate value of the obstacle was (0 mm, 600 mm, 100 mm), and the radius was 50 mm. In each scenario, the robot moves from the starting point A to the end position B according to the red line shown in Figure 17 with the robot’s end-effector posture remaining constant, and the collision risk value of each scenario is recorded.
Scenario A. This scenario verified the positive correlation between the collision risk and the nearest distance. The robot moves to the terminal position B from starting point A with a fixed speed (v = 40 mm/s) and a delay time (T = 2 s). Figure 18a depicts the results.
Scenario B. In this scenario, the robot moves to the same terminal position from the same starting point with different terminal speed; the velocity of each movement is 10 mm/s, 20 mm/s, and 40 mm/s, respectively. The delay time is all set at 2 s. The results are shown in Figure 18b.
Scenario C. In this scenario, the delay time of each robot movement was set to 1 s, 2 s, 3 s, and 4 s, respectively, and the speed of each movement was 30 mm/s. The results can be observed in Figure 18c.
As can be seen in Figure 18a, the collision risk increased with the decrease in the shortest distance for the same speed and delay time, with a more pronounced trend as the robot approached the obstacle. Moreover, the risk value did not increase linearly, because the results combined the expert experience of risk assessment in different scenarios, which is also the advantage of this method. In addition, when the robot was at the same starting position, the collision risk value of the robot with an end speed magnitude of 40 mm/s was 0.6206, which is lower than the calculated value of 1.8438 for 10 mm/s. According to the fuzzy definition of collision risk and membership function (Figure 12) the smaller the value, the higher the collision risk. Therefore, the result shows that the risk increased with the increase in the speed magnitude. It can be proven that the collision risk assessment model is not only related to the shortest distance, but it is also related to the operation speed. Figure 10c illustrates that the delay time has a similar effect on collision risk as speed.

6.3. Effectiveness of the Operation Assist Strategy

6.3.1. Experiment Setup

For evaluating the proposed operation assistance strategy, a real teleoperation system was setup in the laboratory. The graphic virtual environment was constructed based on the remote environment, and the system setup is shown in Figure 19. Five obstacles were placed on the worktable, and the ArUco marker was fixed on the workpiece.

6.3.2. Task and User Study

One robot collisionless movement task was designed to evaluate the teleoperation assistance method. The task is described as follows:
The operator manipulated the virtual robot through the wearable localization devices, and the operation assistance strategies were generated in real time. As is shown in Figure 20, the start area was labeled as point A, and five different obstacles were labeled as O1–O5. The distances between obstacles were 20 cm, 16 cm, 13 cm, and 11 cm, respectively. The operator was asked to move the robot to the target area while avoiding obstacles. The delay of teleoperation was simulated by data delay transmission, and the delay time was a random number with a mean value of 2. During this task, there were no assistance strategies but only visualization in Environment I, while the designed strategies were provided in Environment II.
As observed from Figure 21a, during the operation, it was difficult to intuitively determine whether the robot arm had collided with surrounding obstacles due to visual errors and other factors; therefore, the operator had to spend a lot of time to switch perspectives to carefully observe whether a collision had occurred. In the same case, with the assistance strategies, as is shown in Figure 21b, by the collision risk warning through the haptic (strategy 1) and by highlighting the local danger area (strategy 3), the operator could clearly identify which obstacle was closer to the robot arm and required our attention. Some risks that were ignored due to visual errors were warned.
The task was tested 10 times. The number of collisions during each test was recorded as well as the time spent on reaching the target. The results of 10 parallel experiments verified the effectiveness of the proposed method, as is shown in Figure 22. The average number of collisions with the assistant strategy was significantly lower than the without strategies by 90%. Moreover, as is shown in Figure 23, the average time required to reach point B in Environment I and Environment II was 45.2 s and 33.6 s, respectively, which was reduced significantly by 36%. Therefore, it is obvious that the designed operation-assisted strategies can significantly reduce the possibility of collisions and enhance efficiency.
Due to the fact that the designed three assistant strategies are focused on identifying operation collision risk and improving the observation of risk points (strategy 1 and 3), the ability to avoid collisions was insufficient. Therefore, the performance of the teleoperation was still influenced by the operator, and collisions could still occur due to human physiological limitations.

7. Conclusions

This paper proposed a new collision risk assessment model and designed a collision-risk-based operational assistance strategy for teleoperation. The model took into account the effects of relative shortest distance, operation speed, and delay. In addition, a discrete expandable bounding box method was proposed in this paper to make the shortest distance calculation possible. Meanwhile, this paper introduced fuzzy theory into the collision risk assessment model, which can help decision makers in extracting and keeping expert knowledge. Moreover, based on the assessment of the collision risk, three assistant strategies, including partial view highlighting, variation in motion mapping ration, and haptic risk warning, were defined in this paper. The collision risk model and the teleoperation assistance strategies were evaluated experimentally. The experimental results indicate that the discrete expandable bounding box method designed in this paper could accurately obtain the shortest distance, and the proposed fuzzy collision risk assessment model had the correct relationship with the factors to accurately quantify the collision situation. Simultaneously, the designed operation assistance strategy could effectively reduce the risk of robot collision and improve the safety and efficiency of the teleoperation robot for in-orbit assembly.
The designed assistant strategies in this paper were focused on identifying operational risk and improving the observation of risk points, while the ability to avoid collisions was insufficient. Consequently, in the future, we will continue to improve our teleoperation system, including the study of autonomous obstacle avoidance methods, virtual modeling techniques in non-structural environments to adapt to the complex and changing space environment. Additionally, we will conduct assembly tests in microgravity to explore the effects of microgravity on assembly.

Author Contributions

Conceptualization, S.P., X.C. and P.W.; methodology, S.P. and M.Y.; algorithm, S.P., S.Z. and M.Y.; experiments, S.P., X.G. and M.Y.; research, S.P. and X.C.; writing—original draft preparation, S.P., M.Y. and X.C.; writing—review and editing, X.F., S.P., M.Y., X.C. and P.W.; supervision, X.C. and P.W. All authors have read and agreed to the published version of the manuscript.

Funding

This research was funded by the National Natural Science Foundation of China (No. 51905530, 51901244, 52005494, 91748209), the advanced research project funded by CNSA (D020303), and the Program 173 of China.

Institutional Review Board Statement

Not applicable.

Informed Consent Statement

Not applicable.

Data Availability Statement

Not applicable.

Acknowledgments

Authors are grateful to Wenke Ma for providing us with the camera equipment.

Conflicts of Interest

The authors declare no conflict of interest.

References

  1. Liao, C.; Liu, M.; Zhang, Q.; Dong, W.; Zhao, R.; Li, B.; Jiao, Z.; Song, J.; Yao, W.; Zhao, S. Low-Temperature Thermoplastic Welding of Metallic Glass Ribbons for in-Space Manufacturing. Sci. China Mater. 2021, 64, 979–986. [Google Scholar] [CrossRef]
  2. Zhang, Q.; Liu, M.; Liao, C.; Luan, H.; Dong, W.; Jiao, Z.; Zhao, S.; Bai, H.; Wang, W.-H. Bioinspired Interlayer Adhesion Strategy for Additive Manufacturing in Space. Adv. Eng. Mater. 2022, 24, 2201462. [Google Scholar] [CrossRef]
  3. Bohren, J.; Guerin, K.; Xia, T.; Hager, G.D.; Kazanzides, P.; Whitcomb, L.L. Toward practical semi-autonomous teleoperation: Do what i intend, not what I do. In Proceedings of the Advanced Robotics and Its Social Impacts, Menlo Park, CA, USA, 2–4 October 2011; pp. 20–23. [Google Scholar]
  4. Ni, D.; Nee, A.; Ong, S.; Li, H.; Zhu, C.; Song, A. Point Cloud Augmented Virtual Reality Environment with Haptic Constraints for Teleoperation. Trans. Inst. Meas. Control 2018, 40, 4091–4104. [Google Scholar] [CrossRef]
  5. Xu, X.; Song, A.; Ni, D.; Li, H.; Xiong, P.; Zhu, C. Visual-Haptic Aid Teleoperation Based on 3-D Environment Modeling and Updating. IEEE Trans. Ind. Electron. 2016, 63, 6419–6428. [Google Scholar] [CrossRef]
  6. Nia Kosari, S.; Rydén, F.; Lendvay, T.S.; Hannaford, B.; Chizeck, H.J. Forbidden Region Virtual Fixtures from Streaming Point Clouds. Adv. Robot. 2014, 28, 1507–1518. [Google Scholar] [CrossRef]
  7. Bettini, A.; Marayong, P.; Lang, S.; Okamura, A.M.; Hager, G.D. Vision-Assisted Control for Manipulation Using Virtual Fixtures. IEEE Trans. Robot. 2004, 20, 953–966. [Google Scholar] [CrossRef] [Green Version]
  8. Pruks, V.; Ryu, J.-H. A Framework for Interactive Virtual Fixture Generation for Shared Teleoperation in Unstructured Environments. In Proceedings of the 2020 IEEE International Conference on Robotics and Automation (ICRA), Paris, France, 31 May–31 August 2020; pp. 10234–10241. [Google Scholar]
  9. Abi-Farraj, F.; Pacchierotti, C.; Arenz, O.; Neumann, G.; Giordano, P.R. A Haptic Shared-Control Architecture for Guided Multi-Target Robotic Grasping. IEEE Trans. Haptics 2020, 13, 270–285. [Google Scholar] [CrossRef] [Green Version]
  10. Khatib, O. Real-Time Obstacle Avoidance for Manipulators and Mobile Robots. In Proceedings of the 1985 IEEE International Conference on Robotics and Automation, St. Louis, MO, USA, 25–28 March 1985; Volume 2, pp. 500–505. [Google Scholar]
  11. Lam, T.M.; Boschloo, H.W.; Mulder, M.; van Paassen, M.M. Artificial Force Field for Haptic Feedback in UAV Teleoperation. IEEE Trans. Syst. Man Cybern. Part A Syst. Hum. 2009, 39, 1316–1330. [Google Scholar] [CrossRef]
  12. Ni, D.; Yew, A.W.W.; Ong, S.K.; Nee, A.Y.C. Haptic and Visual Augmented Reality Interface for Programming Welding Robots. Adv. Manuf. 2017, 5, 191–198. [Google Scholar] [CrossRef] [Green Version]
  13. Zanchettin, A.M.; Ceriani, N.M.; Rocco, P.; Ding, H.; Matthias, B. Safety in Human-Robot Collaborative Manufacturing Environments: Metrics and Control. IEEE Trans. Autom. Sci. Eng. 2016, 13, 882–893. [Google Scholar] [CrossRef] [Green Version]
  14. Sun, W.; Torres, L.G.; van den Berg, J.; Alterovitz, R. Safe Motion Planning for Imprecise Robotic Manipulators by Minimizing Probability of Collision. In Robotics Research: The 16th International Symposium ISRR; Inaba, M., Corke, P., Eds.; Springer Tracts in Advanced Robotics; Springer International Publishing: Cham, Switzerland, 2016; pp. 685–701. ISBN 978-3-319-28872-7. [Google Scholar]
  15. Henrich, D.; Kuhn, S. Modeling Intuitive Behavior for Safe Human/Robot Coexistence Cooperation. In Proceedings of the 2006 IEEE International Conference on Robotics and Automation, ICRA, Orlando, FL, USA, 15–19 May 2006; pp. 3929–3934. [Google Scholar]
  16. Kuhn, S.; Henrich, D. Fast Vision-Based Minimum Distance Determination between Known and Unkown Objects. In Proceedings of the 2007 IEEE/RSJ International Conference on Intelligent Robots and Systems, San Diego, CA, USA, 29 October–2 November 2007; pp. 2186–2191. [Google Scholar]
  17. Vatcha, R.; Xiao, J. Perceiving Guaranteed Continuously Collision-Free Robot Trajectories in an Unknown and Unpredictable Environment. In Proceedings of the 2009 IEEE/RSJ International Conference on Intelligent Robots and Systems, St. Louis, MO, USA, 10–15 October 2009; pp. 1433–1438. [Google Scholar]
  18. Wilkie, D.; van den Berg, J.; Manocha, D. Generalized Velocity Obstacles. In Proceedings of the 2009 IEEE/RSJ International Conference on Intelligent Robots and Systems, St. Louis, MO, USA, 10–15 October 2009; pp. 5573–5578. [Google Scholar]
  19. Lacevic, B.; Rocco, P. Kinetostatic Danger Field—A Novel Safety Assessment for Human-Robot Interaction. In Proceedings of the 2010 IEEE/RSJ International Conference on Intelligent Robots and Systems, Taipei, Taiwan, 18–22 October 2010; pp. 2169–2174. [Google Scholar]
  20. Lacevic, B.; Rocco, P.; Zanchettin, A.M. Safety Assessment and Control of Robotic Manipulators Using Danger Field. IEEE Trans. Robot. 2013, 29, 1257–1270. [Google Scholar] [CrossRef]
  21. Motoi, N.; Kobayashi, M.; Masaki, R. Remote Control Method for Mobile Robot Based on Force Feedback Generated Using Collision Prediction Map. IEEJ J. Ind. Appl. 2019, 8, 727–735. [Google Scholar] [CrossRef] [Green Version]
  22. Liu, Z.; Wang, X.; Cai, Y.; Xu, W.; Liu, Q.; Zhou, Z.; Pham, D.T. Dynamic Risk Assessment and Active Response Strategy for Industrial Human-Robot Collaboration. Comput. Ind. Eng. 2020, 141, 106302. [Google Scholar] [CrossRef]
  23. Pan, M.; Li, J.; Yang, X.; Wang, S.; Pan, L.; Su, T.; Wang, Y.; Yang, Q.; Liang, K. Collision Risk Assessment and Automatic Obstacle Avoidance Strategy for Teleoperation Robots. Comput. Ind. Eng. 2022, 169, 108275. [Google Scholar] [CrossRef]
  24. Zanchettin, A.M.; Rocco, P. A General User-Oriented Framework for Holonomic Redundancy Resolution in Robotic Manipulators Using Task Augmentation. IEEE Trans. Robot. 2012, 28, 514–521. [Google Scholar] [CrossRef]
  25. Sugeno, M. An Introductory Survey of Fuzzy Control. Inf. Sci. 1985, 36, 59–83. [Google Scholar] [CrossRef]
  26. Bukhari, A.C.; Tusseyeva, I.; Lee, B.-G.; Kim, Y.-G. An Intelligent Real-Time Multi-Vessel Collision Risk Assessment System from VTS View Point Based on Fuzzy Inference System. Expert Syst. Appl. 2013, 40, 1220–1230. [Google Scholar] [CrossRef]
  27. Mu, Z.; Xu, W.; Gao, X.; Xue, L.; Li, C. Obstacles Modeling and Collision Detection of Space Robots for Performing On-Orbit Services. In Proceedings of the 2014 4th IEEE International Conference on Information Science and Technology, Shenzhen, China, 26–28 April 2014; pp. 461–466. [Google Scholar]
  28. Daniş, F.S.; Naskali, A.T.; Cemgil, A.T.; Ersoy, C. An Indoor Localization Dataset and Data Collection Framework with High Precision Position Annotation. Pervasive Mob. Comput. 2022, 81, 101554. [Google Scholar] [CrossRef]
  29. Suzuki, S.; Be, K. Topological Structural Analysis of Digitized Binary Images by Border Following. Comput. Vis. Graph. Image Process. 1985, 30, 32–46. [Google Scholar] [CrossRef]
  30. Anderson, R.J. Advanced Dexterous Manipulation for IED Defeat: Report on the Feasibility of Using the ShadowHand for Remote Operations; Sandia National Laboratories (SNL): Albuquerque, NM, USA; Livermore, CA, USA, 2011.
  31. Klir, G.J.; Folger, T.A. Fuzzy Sets, Uncertainty, and Information; Prentice-Hall, Inc.: Hoboken, NJ, USA, 1987. [Google Scholar]
  32. Soltani, A.; Haji, R. A Project Scheduling Method Based on Fuzzy Theory. J. Ind. Syst. Eng. 2007, 1, 70–80. [Google Scholar]
  33. Pourjavad, E.; Shahin, A. The Application of Mamdani Fuzzy Inference System in Evaluating Green Supply Chain Management Performance. Int. J. Fuzzy Syst. 2018, 20, 901–912. [Google Scholar] [CrossRef]
  34. Iancu, I. A Mamdani Type Fuzzy Logic Controller. Fuzzy Log. Controls Concepts Theor. Appl. 2012, 15, 325–350. [Google Scholar]
  35. Johansen, T.A.; Shorten, R.; Murray-Smith, R. On the Interpretation and Identification of Dynamic Takagi-Sugeno Fuzzy Models. IEEE Trans. Fuzzy Syst. 2000, 8, 297–313. [Google Scholar] [CrossRef] [PubMed] [Green Version]
  36. Uddin, M.W.; Zhang, X.; Wang, D. A Pneumatic-Driven Haptic Glove with Force and Tactile Feedback. In Proceedings of the 2016 International Conference on Virtual Reality and Visualization (ICVRV), Hangzhou, China, 24–26 September 2016; pp. 304–311. [Google Scholar]
  37. Yu, M.; Cheng, X.; Peng, S.; Cao, Y.; Lu, Y.; Li, B.; Feng, X.; Zhang, Y.; Wang, H.; Jiao, Z.; et al. A Self-Sensing Soft Pneumatic Actuator with Closed-Loop Control for Haptic Feedback Wearable Devices. Mater. Des. 2022, 223, 111149. [Google Scholar] [CrossRef]
Figure 1. Schematic of the teleoperation assembly system.
Applsci 13 04109 g001
Figure 2. The framework of the teleoperation-assisted assembly system based on collision risk assessment.
Applsci 13 04109 g002
Figure 3. Graphical model of the robot.
Applsci 13 04109 g003
Figure 4. Schematic of ArUco marker.
Applsci 13 04109 g004
Figure 5. Marker-based positioning process.
Applsci 13 04109 g005
Figure 6. Construction of virtual environments and virtual robots.
Applsci 13 04109 g006
Figure 7. The discrete expandable bounding box method.
Applsci 13 04109 g007
Figure 8. Collision risk assessment model based on fuzzy inference.
Applsci 13 04109 g008
Figure 9. Membership function of the shortest distance D. Variable D: Very close (NB), Relatively close (NS), Moderate (M), Relatively far (PS), and Far (PB).
Applsci 13 04109 g009
Figure 10. Membership function of the time delay T. Variable T: Very small delay (NB), Small delay (NS), Large delay (PS), and Very large delay (PB).
Applsci 13 04109 g010
Figure 11. Membership function of the operation speed V. Variable V: Very slow speed (NB), Slow speed (NS), Moderate (M), Fast speed (PS), and Very fast speed (PB).
Applsci 13 04109 g011
Figure 12. Membership function of the collision risk K. Collision risk K: Very dangerous (NB), Relatively dangerous (NS), Dangerous (M), Relatively safe (PS), and Safe (PB).
Applsci 13 04109 g012
Figure 13. Graphical interactive interface and its sub-module.
Applsci 13 04109 g013
Figure 14. (a) The setup of the experimental system for testing localization accuracy; (b) The Cartesian spatial motion trajectory of the robot arm.
Applsci 13 04109 g014
Figure 15. Positioning error curve.
Applsci 13 04109 g015
Figure 16. Screenshot of the shortest distance calculated by the discrete expansion bounding box method. We need to further elaborate the process of theoretical calculation of the shortest distance. The reason why the theoretical distance is accessible is that the obstacle is directly in front of the end of the robot, so the distance from the end of the robot to the center of the obstacle, when removing the diameter of the obstacle, is the shortest distance. When the obstacle is not in front, the theoretical calculation is incorrect, because it is necessary to obtain the shortest distance contact point with the obstacle. This point may not be the end of the robot, and it may be in another link of the robot. Therefore, the theoretical calculation is complex and difficult.
Applsci 13 04109 g016
Figure 17. The scenarios in the virtual environment.
Applsci 13 04109 g017
Figure 18. The collision risk assessment results in virtual simulation scenario (a) results when T = 2 s, v = 20 mm/s; (b) collision risk assessment results with different speeds and T = 2 s; (c) collision risk assessment results with different delays at V = 30 mm/s. The smaller the value, the higher the collision risk.
Applsci 13 04109 g018
Figure 19. The setup of the experiment.
Applsci 13 04109 g019
Figure 20. The setup of the task.
Applsci 13 04109 g020
Figure 21. Views in the same scenario: (a) Without assist strategy; (b) with assist strategy.
Applsci 13 04109 g021
Figure 22. Number of collisions for the same task: (a) Without assist strategy; (b) with assist strategy. Collision means that the innermost collision bounding box (R0) of the robot arm is detected to have interfered with the obstacle or table at the virtual end.
Applsci 13 04109 g022
Figure 23. Time to complete the same task with and without teleoperation-assisted strategies.
Applsci 13 04109 g023
Table 1. Fuzzy rule of collision risk in case of T is NB.
SpeedDistance
PBPSMNSNB
NBNBNBNBNSNS
NSNBNBNS M M
MNSNSMPSPS
PSMMPSPBPB
PBPBPBPBPBPB
Table 2. Fuzzy rule of collision risk in case of T is NS.
SpeedDistance
PBPSMNSNB
NBNBNBNBNSNS
NSNBNBNS M M
MNBNSMMPS
PSNSNSPSPBPB
PBPSPBPBPBPB
Table 3. Fuzzy rule of collision risk in case of T is PS.
SpeedDistance
PBPSMNSNB
NBNBNBNBNBNS
NSNBNBNS NS M
MNBNSMMPS
PSNSNSMPSPS
PBMMPSPSPB
Table 4. Fuzzy rule of collision risk in case of T is PB.
SpeedDistance
PBPSMNSNB
NBNBNBNBNBNB
NSNBNBNS NS NS
MNBNBNSMM
PSNBNSMMPS
PBNSMMPSPS
Disclaimer/Publisher’s Note: The statements, opinions and data contained in all publications are solely those of the individual author(s) and contributor(s) and not of MDPI and/or the editor(s). MDPI and/or the editor(s) disclaim responsibility for any injury to people or property resulting from any ideas, methods, instructions or products referred to in the content.

