Article

Improving Magnetic Field Response of Eddy Current Magneto-Optical Imaging for Defect Detection in Carbon Fiber Reinforced Polymers

Department of School of Automation Engineering, University of Electronic Science and Technology of China, Chengdu 611731, China
*
Author to whom correspondence should be addressed.
Appl. Sci. 2023, 13(7), 4541; https://doi.org/10.3390/app13074541
Submission received: 16 March 2023 / Revised: 31 March 2023 / Accepted: 2 April 2023 / Published: 3 April 2023

Abstract

:
A large number of carbon fiber reinforced polymers have been applied to aircraft and automobiles, and many nondestructive testing methods have been studied to detect their defects. Eddy current magneto-optical imaging nondestructive testing technology has been widely used in the detection of metal materials such as aircraft skin, but it usually requires a large excitation current and, at present, can only detect metal materials with high conductivity. In order to take full advantage of the innate benefits and efficiency of eddy current magneto-optic imaging and enable it to detect defects in carbon fiber reinforced polymers with weak conductivity, it is necessary to improve the magnetic field response of the eddy current magneto-optic imaging system and explore suitable excitation and detection methods. The scanning eddy current magneto-optical imaging nondestructive testing device built in this study has improved the magnetic field response of the system, and the eddy current magneto-optical phase imaging testing method has been proposed to detect the crack defects of carbon fiber reinforced polymers. The effectiveness of the method has been verified by simulation and experiment.

1. Introduction

Carbon fiber reinforced polymer (CFRP) materials are widely used in aerospace, automotive and other industries because of their excellent properties. In application, due to various factors such as overuse and impact, CFRPs can present with various types of defects, which not only greatly affect the performance of products but also may cause fatal safety hazards. Especially in applications such as the automotive and aviation industries, timely and effective nondestructive testing and identification of defects are of great importance [1,2,3,4]. A variety of nondestructive testing (NDT) methods (ultrasonic, radiographic, thermal imaging, eddy current, etc.) have been widely used in these industries to detect the defects of CFRPs to ensure the quality and safe use of the product [5,6,7,8,9,10]. In the current applications, there are many existing nondestructive testing methods, but they all have different types of shortcomings. For example, ultrasonic testing requires high surface smoothness of the test piece and requires the use of coupling agents to fill in gaps [11]; Radiographic testing is harmful to the human body and can only be conducted in two directions, making it inconvenient to use [12]; infrared thermal imaging testing is affected by the thermal emissivity of the surface of the test piece and is easily affected by the environment, with low sensitivity for detecting internal defects [13]; and traditional coil-based eddy current testing methods have low mechanical scanning efficiency, limited spatial resolution due to coil size, and vibration noise [14]. Due to the applicable limitations of the above methods, this article aims to explore a new detection method that can make up for the above shortcomings. This nondestructive testing method based on ECMO is a non-contact, one-way testing method that is not harmful and is not affected by surface conditions, has high detection efficiency, and has a high spatial resolution. From the perspective of testing methods, it is an innovation. At present, most NDT methods are developing towards visualization, as in Ref. [15], which can show defects more visually. The research results can also be used in the field of computer vision.
EC testing [16] is an electromagnetic detection method that is usually suitable for detecting defects that cause changes in the electromagnetic properties of the tested materials. For CFRPs, cracks (fiber fractures), misalignment, wrinkling and uneven clearance, impact damage and delamination, and other defects can all be detected by the EC method [17]. The German Fraunhofer Institute for Nondestructive Testing (IZFP) uses array EC probes and multi-frequency EC to detect defects in CFRPs and achieves great results [18]. Reference [19] introduces the small signal extraction method by using lock-in amplification, which is used to realize the imaging of CFRPs with medium-frequency EC (150 kHz and 250 kHz) and successfully detect defects such as cracks and impact damage. However, EC coil detection is limited by the size of the coil, the sensitivity of the coil at low frequencies is not high either, the detection depth may be affected by the skin effect at medium and high frequencies, and the impedance characteristics of the coil are usually considered in addition to the electromagnetic characteristics of the test piece. There are several studies about using the superconducting quantum interference detector (SQUID) EC method to detect multiple defects in CFRP materials at lower frequencies [20]. However, SQUID requires refrigeration equipment, which is difficult to miniaturize and expensive.
Magneto-optical (MO) detection and imaging can detect alternating magnetic fields in a certain area. Eddy current magneto-optical (ECMO) imaging was first used to detect aircraft skin defects, and the following Refs. [21,22] further developed and improved the ECMO imaging nondestructive testing system. However, most ECMO imaging NDT systems based on the Faraday effect have low response to magnetic fields, mT is the normal level that can be reached, and only a few studies can reach less than the mT level [23]. Therefore, the EC excitation usually requires a large excitation current of one ampere or even a hundred amperes [24]. This may cause additional interference with other electronic devices and affect the promotion and application of ECMO imaging NDTs. Refs. [25,26] specialize in the magnetic responsivity and frequency range of MO detection, which can reach the levels of nT, pT, or even dozens of fT and have a wide frequency response range. However, most ECMO imaging NDT systems are not responsive enough to magnetic fields. This is mainly because in the high-sensitivity test, photodetectors are used for point detection, followed by filtering and amplification processes, which can obtain a higher signal-to-noise ratio so that weak magnetic field signals can also be identified. In real ECMO testing applications, in order to improve the efficiency of detection, cameras are primarily used for imaging. It is difficult to achieve point detection sensitivity due to camera bit limit and noise. In particular, traditional ECMO detection, considering the skin effect of ECs [27], requires a large excitation current and a lower excitation frequency when detecting metal materials, usually within 100 kHz [28], and neither the high magnetic field resolution ability of MO detection nor its wide frequency response range can be adopted.
In order to overcome the shortcomings of traditional ECMO imaging to it can be applied to the defect detection of CFRPs with weak conductivity, the magnetic field response of a traditional ECMO system is improved by point detection, lock-in amplification, and scanning imaging. The crack defects of weakly conductive CFRPs are detected with higher excitation frequency and smaller excitation current, and the relevant influencing factors are analyzed. (TmBi)3 (FeGa)5 O12 film is used as an MO sensor [29], and a reflective MO detection system is built, which uses a photodetector for detection, a lock-in amplifier to amplify the detection signal, and high-precision two-dimensional scanning for MO imaging.

2. Eddy Current Magneto-Optical Imaging System Settings

2.1. The Principle of Magneto-Optical Imaging Based on the Faraday Effect

The Faraday effect [30,31,32] is when a beam of linearly polarized light passes through the MO medium and the polarization direction of the linearly polarized light is rotated due to the influence of the magnetic field in the propagation direction. The rotation angle is shown as
β = VBL
where V is the Verdet constant reflecting the rotation performance of the MO medium, B is the corresponding magnetic induction intensity, and L is the distance of light propagation in the MO medium. MO detection and imaging are realized by using a medium with a strong Faraday effect as the sensor and combining the optical path as shown in Figure 1.
The collimated light from the light source becomes linearly polarized after passing through the polarizer. The polarization direction of this light beam is rotated by the Faraday effect through the MO medium, which changes the light intensity reaching the photodetector through the analyzer. The specific relationship is shown in Malus’ law:
I = I 0 cos 2 α β
where α is the angle between the light transmission direction of the polarizer and the analyzer, I0 is the incident light intensity to the analyzer, β is the Faraday rotation angle, and I is the light intensity to the detector. With a linear MO sensor [21], β is linear with the change of magnetic induction magnitude B in the detection range. When α is 45 degrees and β is around 0 degrees, the maximum light intensity occurs, and Formula (2) can be transformed into I = I 0 2 1 + sin 2 β . When β is small, based on the Taylor expansion of the sin function, the above formula can be approximated as I   I 0 2 1 + 2 VBL . This rate of change is influenced by the cos square term, hypothesis α − β = x. Taking the derivative of cos2x, it is found that the absolute value of −sin2x is 1 when x = 45 degrees, and it is the maximum value at this time. When x changes slightly, its derivative changes very little. For example, when x changes by 1 degree, its absolute derivative value changes from 1 to 0.9994. At the same time, the magnetic field measured in this experiment is relatively weak, β. The variation of the magnetic field is usually within 1 degree, so it can be approximated that the magnetic field changes linearly with light intensity.

2.2. Eddy Current Magneto-Optical Defect Detection System

The scanning ECMO imaging defect detection system with a small excitation current and high magnetic field responsivity is built; the system settings are shown in Figure 2. The collimated probe beam is generated by the 2 mW He-Ne laser incident to the polarizer after passing through the optical isolator, and the light polarization direction of the polarizer is set at a 90-degree angle with the analyzer. The nonpolarized beam splitter (NPBS) does not affect the polarization state of the light but only changes the transmission direction of the light. The linearly polarized light from the polarizer passes through the NPBS and is then converged by the Plano convex lens and incident on the sensor. The signal processing system provides an excitation signal of 1 mHz to 1 MHz to the excitation coil. The sample under the excitation coil generates EC. The presence of defects in the sample will affect the distribution of EC, resulting in different secondary magnetic fields, which are superimposed with the excitation magnetic field. The superimposed magnetic field affected by the defect is detected by the MO sensor. An electromagnet or permanent magnet is used to provide a bias magnetic field. When there is no external excitation magnetic field, the probe light passes through the sensor and is reflected by the reflective layer, and it rotates towards 45 degrees under the effect of the bias magnetic field. The 90-degree polarizer and analyzer angle setting can eliminate the influence of reflected light on the sensor surface, and the rotation caused by the bias magnetic field puts the magnetic field detection in a highly sensitive response range. (TmBi)3 (FeGa)5 O12 film is grown on a 0.5 mm-thick Gadolinium Gallium Garnet (GGG) substrate by the liquid phase epitaxy method, and the germanium coating is used as a reflective layer to reflect back the probe light. When passing through the sensor, the polarization direction of the probe light will rotate under the influence of the magnetic field in the vertical sample direction. The reflected light will return to NPBS and be reflected horizontally and land on the analyzer. The light intensity through the analyzer is converted into an electrical signal by the photodetector. The lock-in amplifier filters and amplifies the detected electrical signals. The imaging and signal process system controls the 2D moving platform to move the sample and reads the output of the lock-in amplifier for imaging.

3. Eddy Current Magneto-Optical Imaging Theoretical Analysis and Simulation of Carbon Fiber Reinforced Polymer Cracks

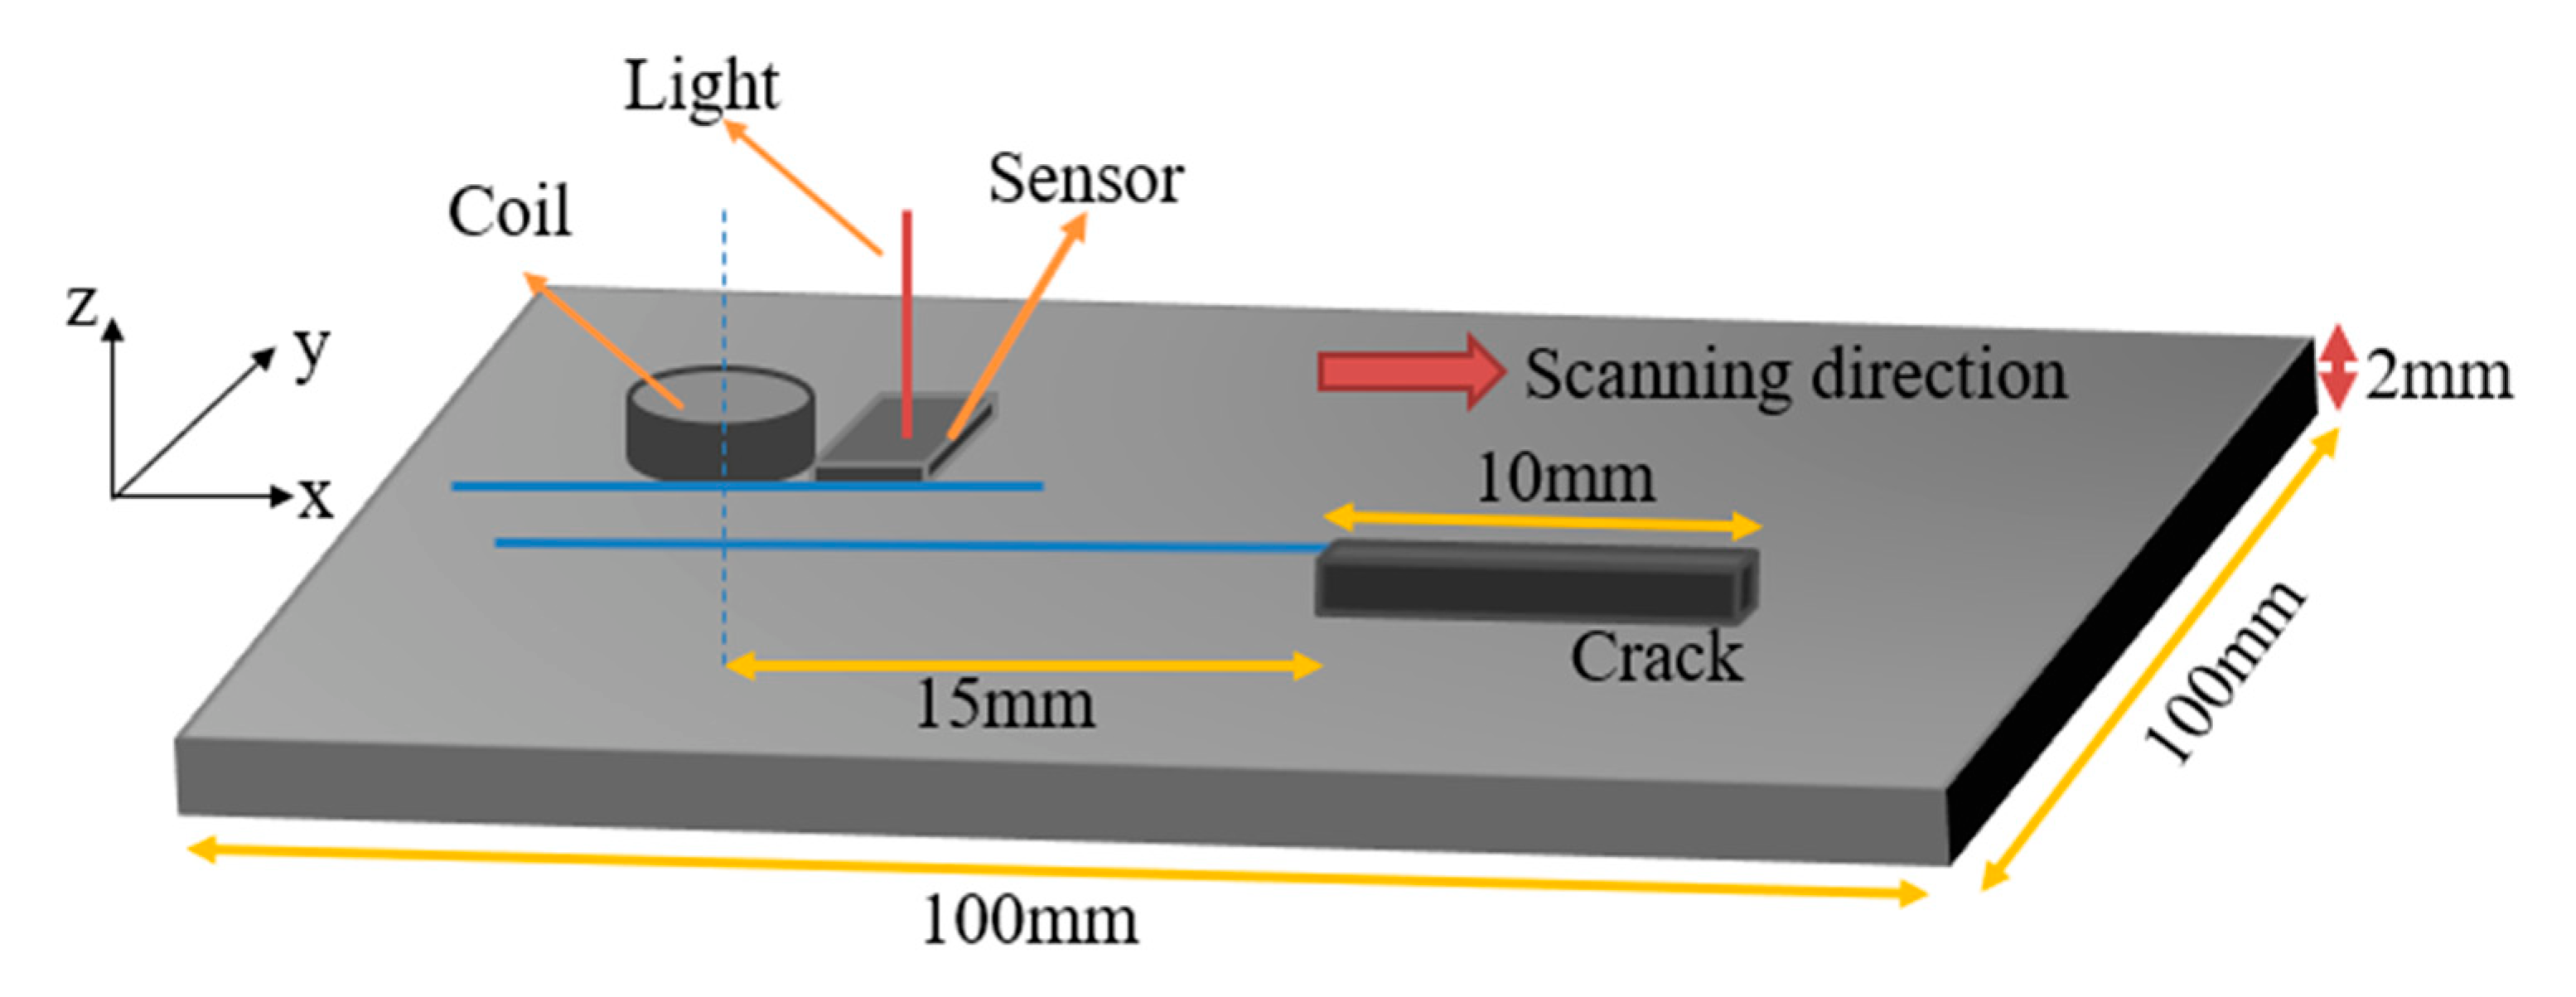
3.1. Carbon Fiber Reinforced Polymer Electromagnetic Model

CFRPs are made of a multi-layer fiber bundle in a parallel arrangement lying in a certain angle arrangement or a fiber woven cloth preform, through a certain processing technology with resin material fixed molding. Its conductivity is mainly determined by the conductivity of the fiber direction and the contact between the fibers. The complexity of fiber distribution results in complex anisotropic conductive characteristics. To simplify this complexity, the conductivity characteristics of CFRPs are often represented by uniform anisotropic conductivity tensors when studied digitally.
The σ in (3) below is the conductivity tensor, where σL is the conductivity in the carbon fiber direction, σT is the conductivity in the vertical carbon fiber direction in the carbon fiber layup, σV is the conductivity in the vertical ply direction, and θ is the angle between the carbon fiber direction and the main direction axis in the ply plane.
σ = σ L c o s 2 θ + σ T sin 2 θ 1 2 σ L σ T sin 2 θ 0 1 2 σ L σ T sin 2 θ σ L sin 2 θ + σ T cos 2 θ 0 0 0 σ V
Different fiber bundles and different processing methods used to make CFRPs have different conductivity. The following experiments study the common 3 K plain-woven carbon fiber plate. Although there are gaps between the fiber bundles, relative to the larger crack defects, they can be ignored. Therefore, in order to simplify the model, the conductivity of the fiber bundle can be considered uniform in the horizontal plane.
The system of Maxwell’s equations and the current continuity equation can be obtained by the A, V-A control equations in (4)–(6), where A is the magnetic vector potential vector, V is the potential scalar, Js is the excitation current density, Ω1 is the conductive region, and Ω2 is the non-conductive region.
× 1 μ × A + j ω σ A +   σ V = 0   ( Ω 1 )
  · j ω σ A   +   σ V = 0   Ω 1
× 1 μ × A = J s Ω 2

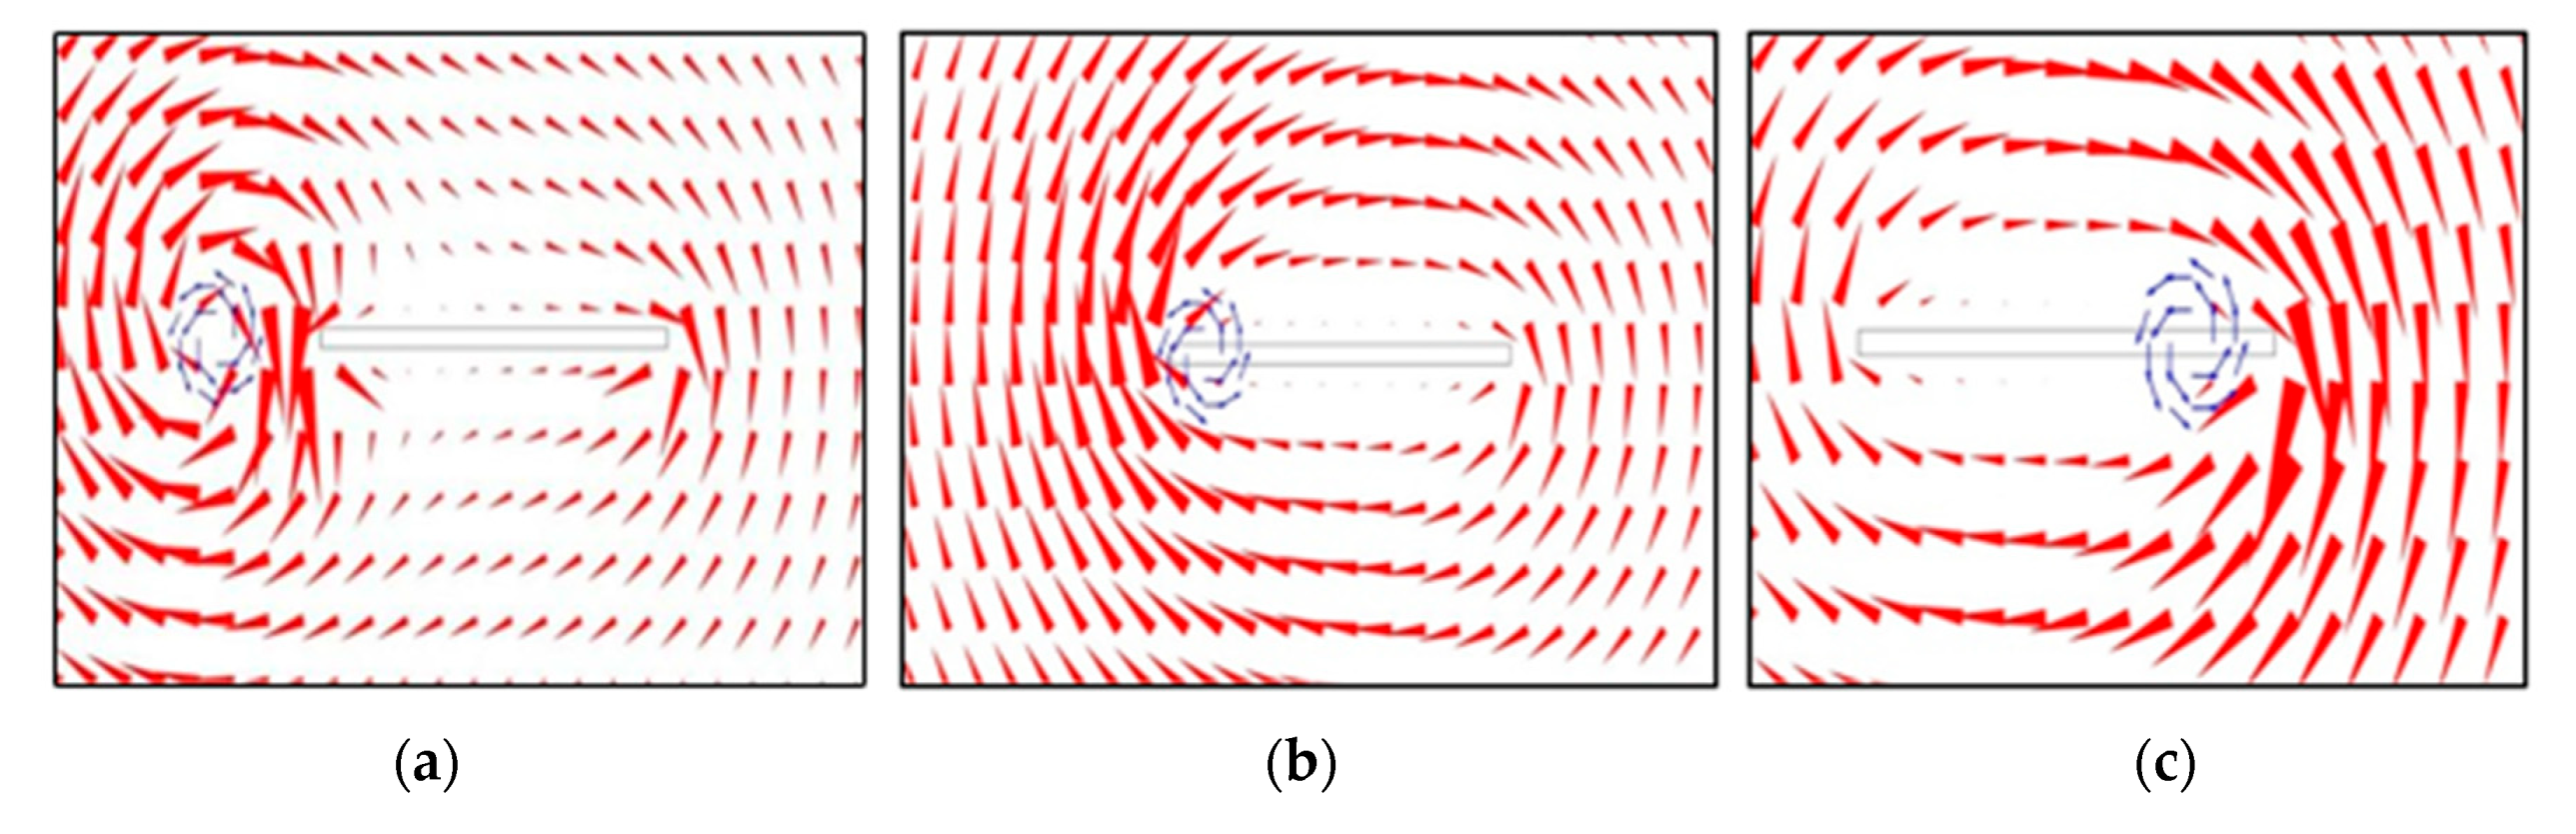
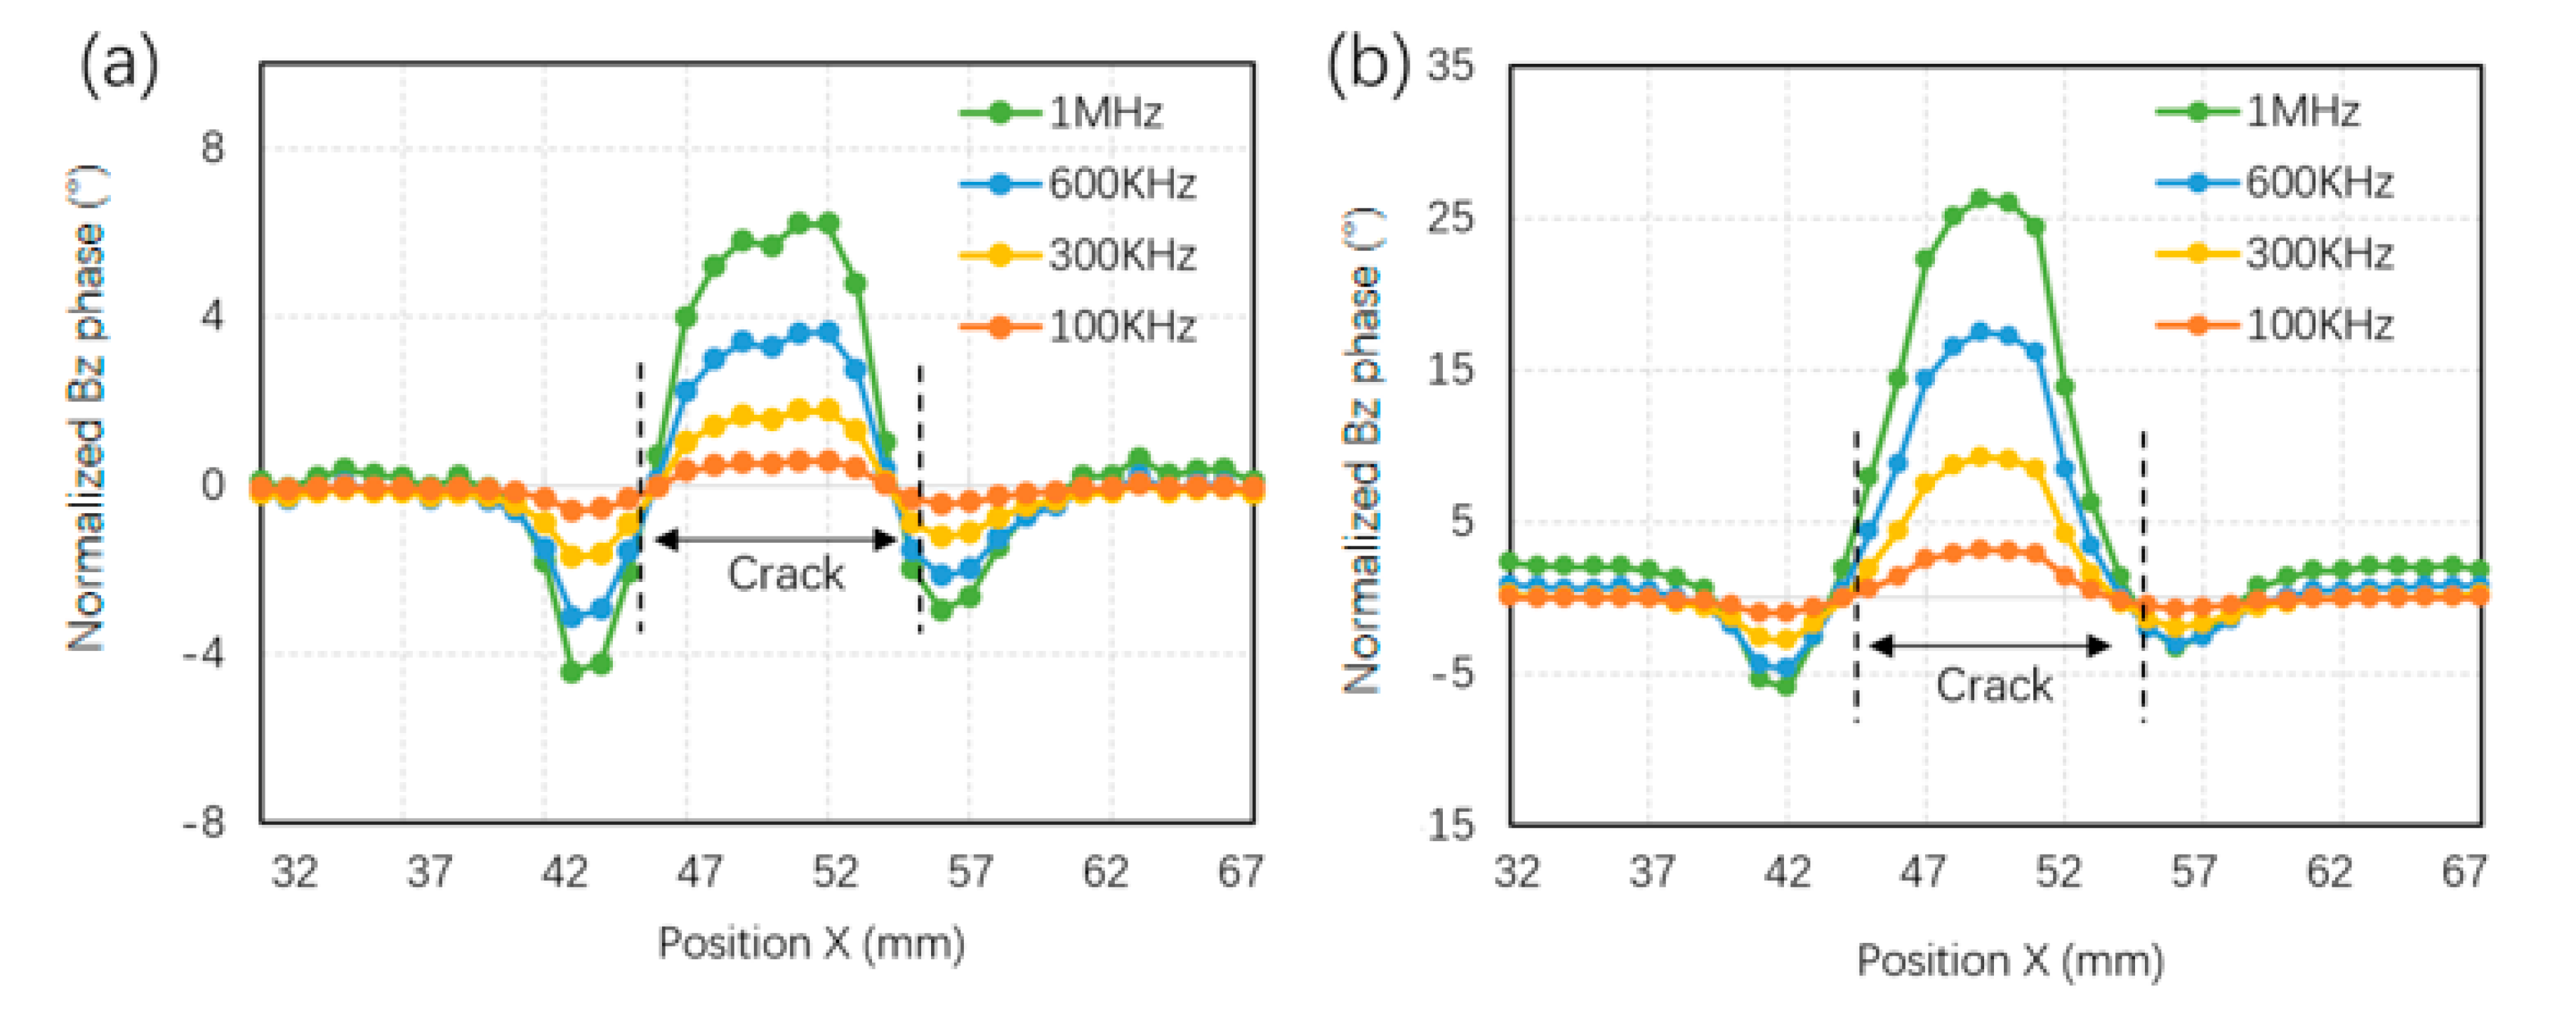
3.2. Detection of Crack Defects

The AC/DC module of COMSOL Multiphysics 5.5 was used to perform finite element simulation on the woven carbon fiber plate. The purpose is to study the effect of crack defects on the surface vertical magnetic field of the sample under EC excitation. The schematic diagram of the simulation model is shown in Figure 3. During measurement, the magneto-optical sensor is placed parallel to the test piece, and the probe light is vertically incident on the magneto-optical sensor. Its Faraday rotation angle is only affected by the magnetic field perpendicular to the surface of the test piece. The sample size is 100 mm long, 100 mm wide, and 2 mm thick, and the size of the sample defect is 10 mm long, 0.4 mm wide, and 2 mm deep. The detection point is 5 mm next to the excitation coil center point. Since the magnetic field at the detection point is mainly affected by the EC between the center of the coil and the detection point, the simulation takes the middle point of these two points to represent the position point of the detection device. We made the lower left corner of the specimen surface the coordinate origin (0, 0, 0), and the coil lifting distance is 0.5 mm. The coil moves from 32.5 mm to 67.5 mm in steps of 1 mm. The coil has 1 mm inner diameter, 2.6 mm outer diameter, 0.8 mm height, 0.05 mm wire diameter, and 140 turns; excitation signal frequency set to 100 kHz, 300 kHz, 600 kHz, and 1 MHz; and current set to 30 mA. Due to the simplification of the distribution of electrical conductivity in the braided structure, the conductivity tensor in Equation (3) above can be simplified into a diagonal form, with the value on the main diagonal set to (10,000, 10,000, 100) S/m.
The first step is to simulate with a non-defective sample before defect scanning and obtain the corresponding reference value to normalize the scanning results. Next, the excitation coil is placed on the position (50, 50, 0.5) above the sample without defects. Figure 4 shows the line scan of the phase of the magnetic induction intensity Bz in a vertical direction at z = 0.5, y = 50, and x from 30 to 70. The phase of the vertical magnetic field in the area near the coil on the outside of the coil is affected by the eddy current and first becomes larger and then smaller. Some EC magnetic testing methods are used to detect the change of the superimposed magnetic field inside the excitation coil [20]. Only the superimposed magnetic field outside the excitation coil is considered here. The magnitude of the excitation magnetic field outside the coil is several orders of magnitude smaller than the magnitude of the excitation magnetic field inside the coil, but the difference in the magnitude of the eddy current is not large, so the superimposed magnetic field outside the coil is more affected by the EC [20].
When performing line scanning according to Figure 3, the distribution of EC in the sample is shown in Figure 5. In the figure, blue is the excitation current and red is the EC. When the excitation coil approaches the defect, the EC at the edge of the defect will increase, with the distribution shown in Figure 5a. When the excitation coil moves on the defect, the EC distribution is shown in Figure 5b. At this point, the magnetic field direction of the EC at the detection point is opposite that of Figure 5a. The eddy current distribution when the excitation coil continues to move to the edge of the defect is shown in Figure 5c. At this point, the magnetic field direction generated by the EC at the detection position is consistent with that in Figure 5a, but the extended EC will have a certain counteraction effect, so the impact should be less than that in Figure 5a. There are EC magnetic fields in opposite directions and exciting magnetic fields in the same direction at different positions during scanning, which makes the effect of the EC magnetic fields on the phase of the superimposed magnetic fields opposite. The EC magnetic field at the edge of the defect acts as an obstacle to the change of the excitation magnetic field, and the phase lags behind the excitation magnetic field. The superposition with the excitation magnetic field will make the superimposed magnetic field phase lag behind the excitation magnetic field; that is, the detected magnetic field phase becomes smaller. In the middle of the defect, due to the opposite direction of the EC magnetic field, it is equivalent to a 180-degree transformation of the phase. At this point, the phase is ahead of the excitation magnetic field, so the magnetic field phase after superposition becomes larger.
Figure 6 is the phase of the vertical magnetic field relative to the scanning position. The data is normalized with the corresponding data without defects. The figure shows that when the detection device approaches the defect, the phase first decreases; when it is on the defect, the phase increases to the maximum; and when it is to leave the defect, it decreases again, which is consistent with the change law of EC distribution previously analyzed. There is no obvious change rule identified from the amplitude change, so it is not shown here. The above results are consistent with the results in Ref. [33] that phase detection based on eddy currents is more sensitive than amplitude detection. In actual ECMO detection, defects can be detected and imaged according to the magnetic field phase.
Figure 7a,b are the phase results of line scanning when the detection point is 4 mm and 6 mm away from the center of the excitation coil, respectively. The figure shows that different detection positions have a significant impact on the results’ value, but the basic change law is the same. The farther away from the excitation source, the smaller the excitation magnetic field and the more obvious the phase change of the superimposed magnetic field affected by the eddy current magnetic field.

4. Experimental Verification of Eddy Current Magneto-Optical Phase Imaging of CFRP Crack Defects

4.1. Line Scan Detection

The experimental sample is a 100 mm long, 100 mm wide, and 2 mm thick T300 woven carbon fiber board, which is processed with a crack about 7 mm long, 1 mm wide, and 2 mm deep. Figure 8 shows the test results using the line scanning method analyzed above. In the experiment, 300 kHz 30 mA, 600 kHz 15 mA, and 900 kHz 10 mA excitation signals were used, respectively. The results show that the change law of the magnetic field phase is consistent with the simulation results, and only a small excitation current is required when the frequency is increased. As shown in Figure 8, two black vertical dashed lines indicate both ends of the defect. When the detection mechanism is far from the defect, the detected magnetic field phase is relatively stable. As the detection mechanism gradually approaches the defect, the detected magnetic field phase begins to decrease and then increases. When the detection mechanism reaches the left edge of the defect, the detected magnetic field phase shows a rapid increase trend. When the detection mechanism reaches the center of the defect, the detection value reaches its peak. Then, as the detection mechanism moves away from the center of the defect to the right of the defect, the magnetic field phase begins to decrease rapidly. When the detection mechanism leaves the right edge of the defect, the detected magnetic field phase still maintains a certain downward trend, followed by an upward trend. When the detection mechanism gradually moves away from the defect, it returns to a stable state. This series of phenomena reflects the rationality of the experimental process.

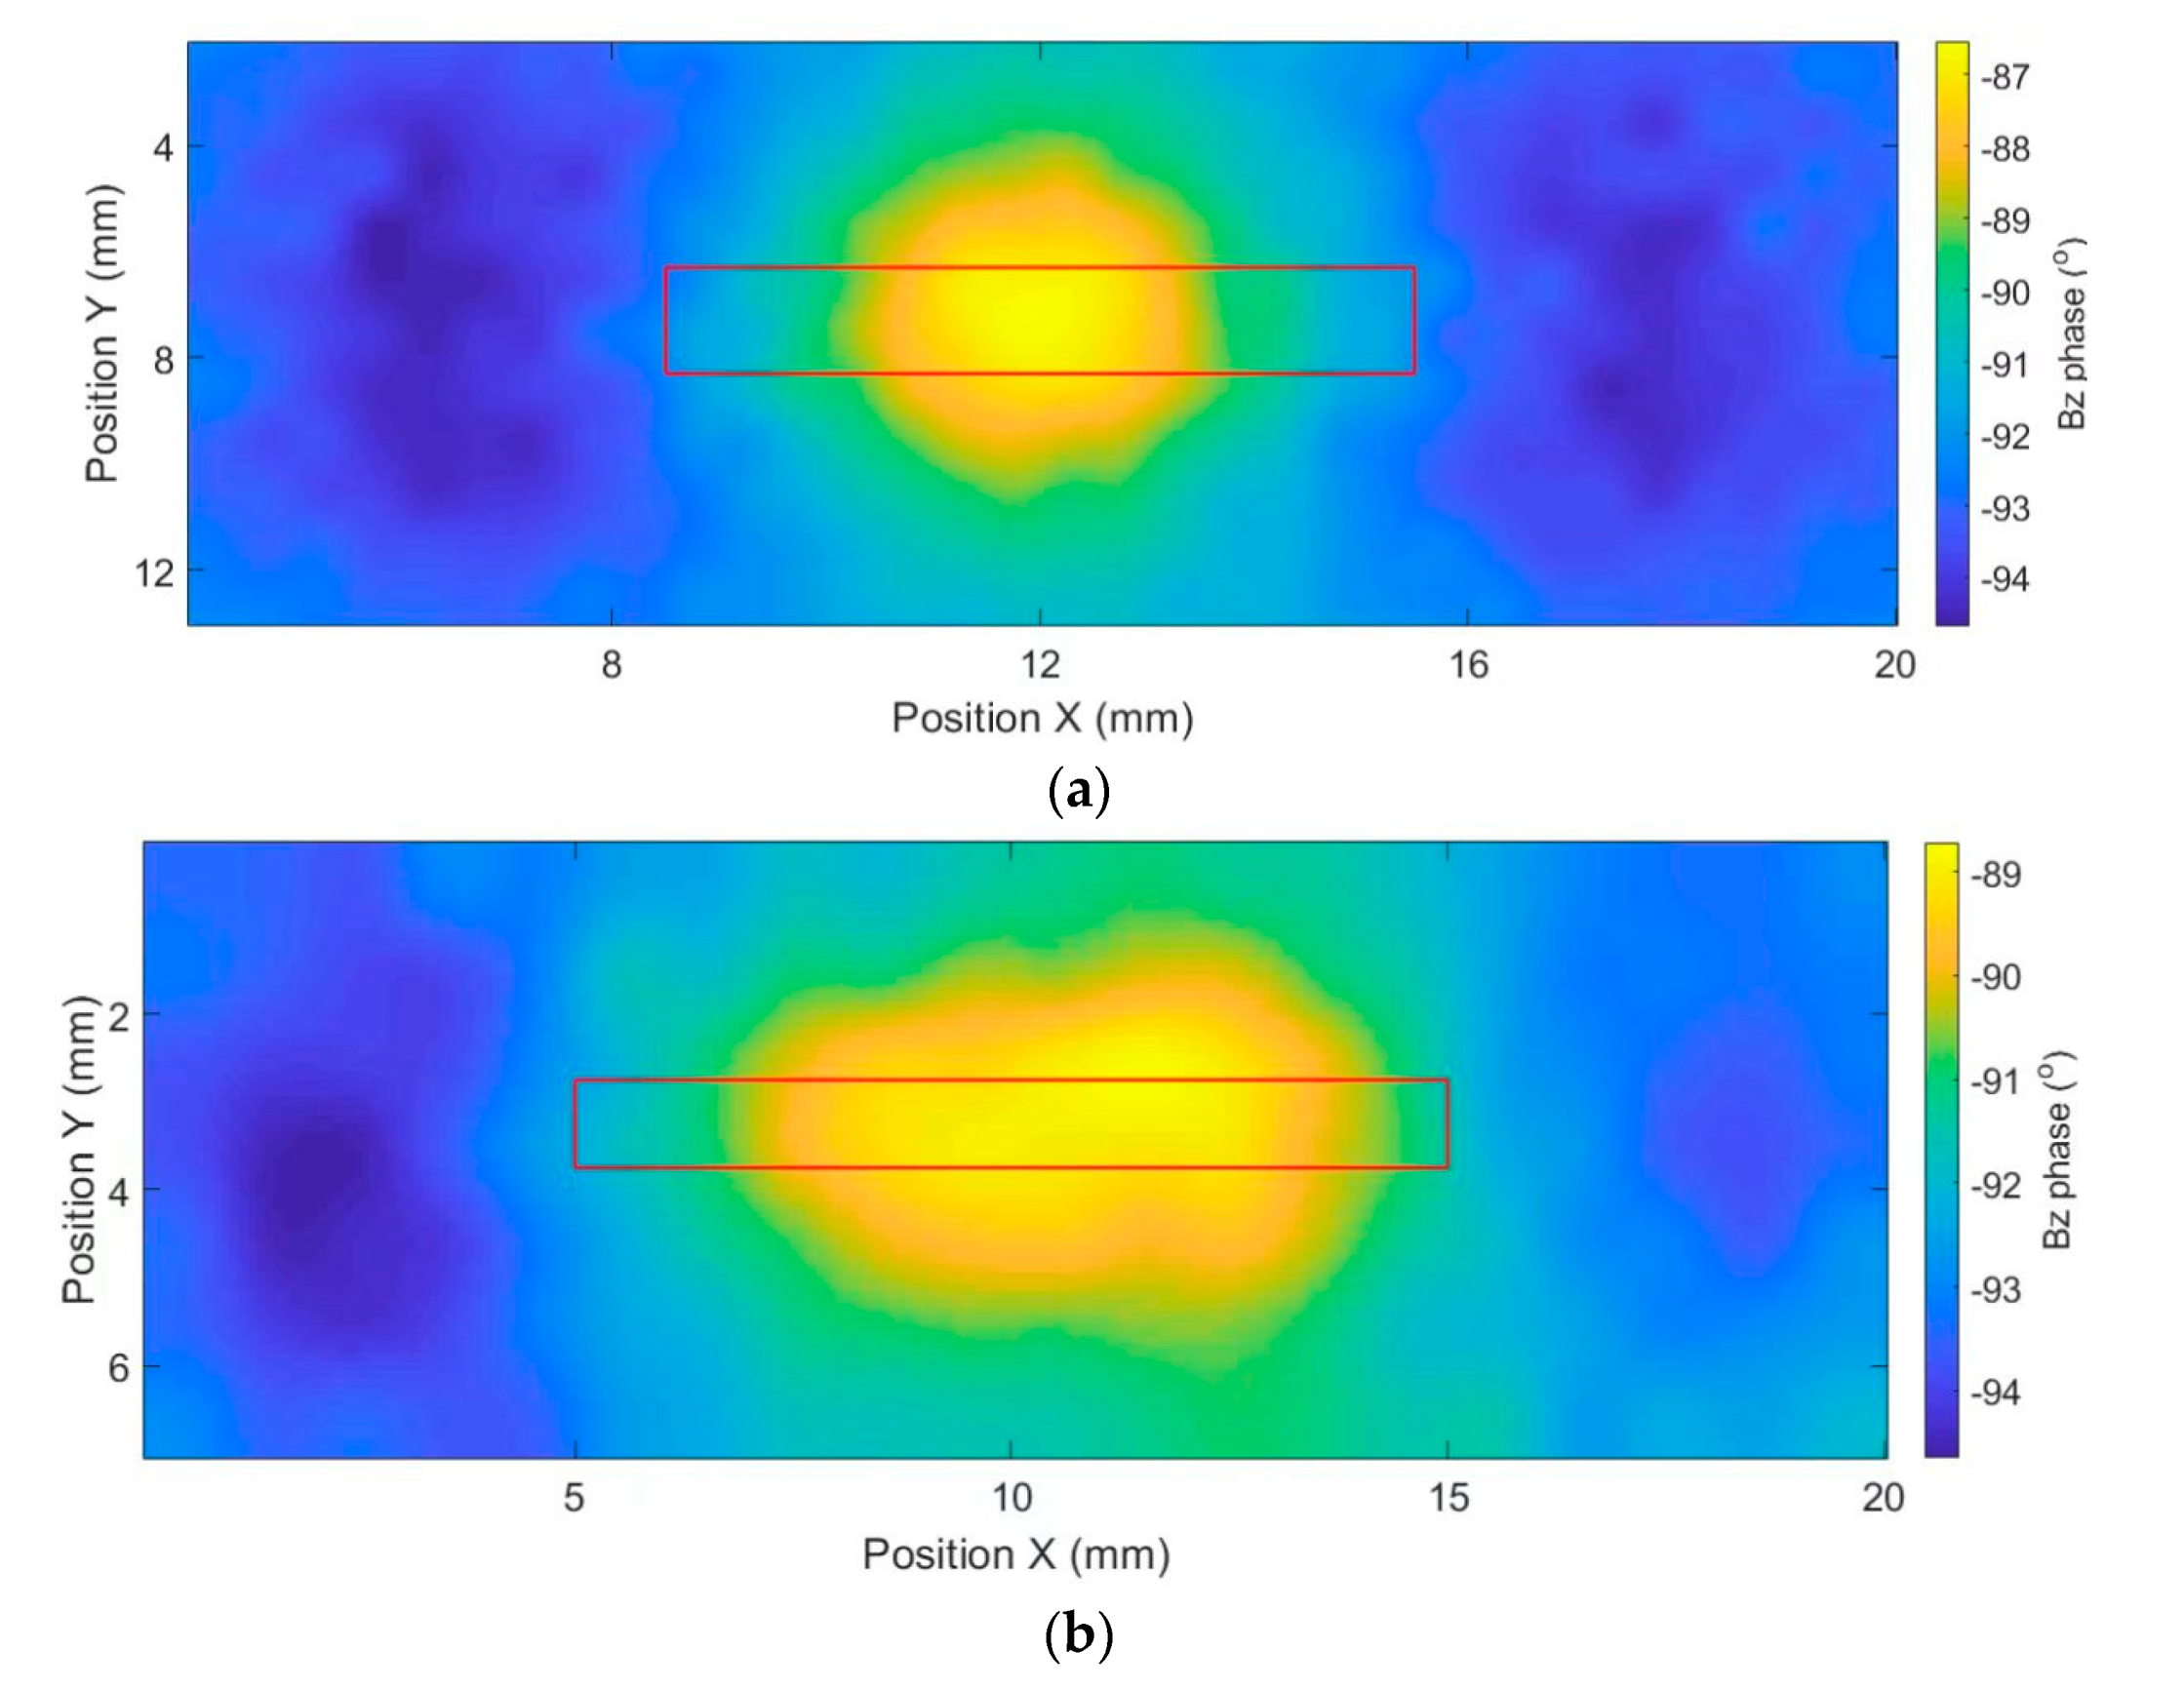
4.2. Line Scan Detection

Figure 9a is a phase image of the above experimental sample scanned with a 600 kHz, 30 mA excitation signal. The red box marked in the figure is the actual position of the defect. As with line scanning, the magnetic field phase in the middle of the defect is larger, and the magnetic field phase on both sides of the defect is smaller. The length of the defect can be roughly determined from the figure, but the width is wider than the actual defect.
Considering that this is the first time using the ECMO method to detect CFRP materials, the size selection should be large, combined with laboratory processing conditions, so a crack defect about 10 mm long, 1 mm wide, and 1 mm deep is machined on the back of the sample with the same size as in the above experiment.
Figure 9b is the c-scan phase image of the defect area under the excitation signal of 600 kHz and 30 mA. The internal defect can also be detected from the results, but the phase change is smaller than for the surface defect.
From these two actual inspection images, it can be seen that the imaging law of detecting CFRP material defects using the ECMO method is consistent with the previous simulation analysis results. At the same time, the edge of the defect can be roughly determined. In addition, subsequent algorithms can be used to reconstruct defects.

5. Conclusions

A method based on eddy current magneto-optical (ECMO) phase imaging to detect cracks in weakly conductive carbon fiber materials is proposed. Compared with the traditional ECMO imaging system, the established scanning ECMO imaging nondestructive detection system greatly improves the magnetic field response and has lower excitation current and higher excitation frequency. The experimental results show that the system can effectively detect the cracks of woven carbon fiber boards.

Author Contributions

Conceptualization, X.Z.; Methodology, J.A.; Software, S.L.; Validation, Q.Z.; Investigation, B.L.; Data curation, X.Z.; Writing—original draft, J.A.; Writing—review & editing, L.B. All authors have read and agreed to the published version of the manuscript.

Funding

National Natural Science Foundation of China (Grant U2030205, Grant 62003075, Grant 61903065, Grant 62003074); Sichuan Science and Technology Planning Project (2022JDJQ0040).

Data Availability Statement

The data that support the findings of this study are available on request from the corresponding author, [Libing Bai], upon reasonable request.

Conflicts of Interest

We declare that we have no financial and personal relationships with other people or organizations that can inappropriately influence our work, there is no professional or other personal interest of any nature or kind in any product, service and/or company that could be construed as influencing the position presented in, or the review of, the manuscript entitled.

References

  1. Zheng, H.; Zhang, W.; Li, B.; Zhu, J.; Wang, C.; Song, G.; Wu, G.; Yang, X.; Huang, Y.; Ma, L. Recent advances of interphases in carbon fiber-reinforced polymer composites: A review. Compos. Part B Eng. 2022, 233, 109639. [Google Scholar] [CrossRef]
  2. Danish, A.; Mosaberpanah, M.A.; Salim, M.U.; Amran, M.; Fediuk, R.; Ozbakkaloglu, T.; Rashid, M.F. Utilization of recycled carbon fiber reinforced polymer in cementitious composites: A critical review. J. Build. Eng. 2022, 53, 104583. [Google Scholar] [CrossRef]
  3. Gangineni, P.K.; Ganesh Gupta, B.N.V.S.K.; Patnaik, S.; Prusty, R.K.; Ray, B.C. Recent advancements in interface engineering of carbon fiber reinforced polymer composites and their durability studies at different service temperatures. Polym. Compos. 2022, 43, 4126–4164. [Google Scholar] [CrossRef]
  4. Gupta, S.; Sharma, A.; Varma, R.K.; Kushvaha, V. A review on performance of near-surface mounted-carbon fiber-reinforced polymer laminates bonded into slits. Polym. Compos. 2022, 43, 6782–6802. [Google Scholar] [CrossRef]
  5. Wu, Y.; Wang, K.; Neto, V.; Peng, Y.; Valente, R.; Ahzi, S. Interfacial behaviors of continuous carbon fiber reinforced polymers manufactured by fused filament fabrication: A review and prospect. Int. J. Mater. Form. 2022, 15, 18. [Google Scholar] [CrossRef]
  6. Song, Y.; Cao, H.; Zheng, W.; Qu, D.; Liu, L.; Yan, C. Cutting force modeling of machining carbon fiber reinforced polymer (CFRP) composites: A review. Compos. Struct. 2022, 299, 116096. [Google Scholar] [CrossRef]
  7. Cho, S.Y. Investigation of manufacturing defects in 3D-printed CFRP using laser ultrasonic testing and x-ray micro-computed tomography. Funct. Compos. Struct. 2021, 3, 025005. [Google Scholar] [CrossRef]
  8. Zhu, P.P.; Bai, L.B.; Cheng, Y.H. Feature Extraction Approach for Defect Inspection in Eddy Current Pulsed Thermography. J. Electron. Sci. Technol. 2021, 19, 11. [Google Scholar]
  9. Iqbal, S.; Bahadur, A.; Ali, S.; Ahmad, Z.; Javed, M.; Irfan, R.M.; Ahmad, N.; Qamar, M.A.; Liu, G.; Akbar, M.B.; et al. Critical role of the heterojunction interface of silver decorated ZnO nanocomposite with sulfurized graphitic carbon nitride heterostructure materials for photocatalytic applications. J. Alloys Compd. 2021, 858, 158338. [Google Scholar] [CrossRef]
  10. Zhu, J.; Wu, C.; Cui, Y.; Li, D.; Zhang, Y.; Xu, J.; Li, C.; Iqbal, S.; Cao, M. Blue-emitting carbon quantum dots: Ultrafast microwave synthesis, purification and strong fluorescence in organic solvents. Colloids Surf. A Physicochem. Eng. Asp. 2021, 623, 126673. [Google Scholar] [CrossRef]
  11. Huang, L.; Li, J.; Li, B. Experimental research on ultrasonic A-scan testing technology of composite solid propellant. J. Phys. Conf. Ser. 2022, 2338, 012011. [Google Scholar] [CrossRef]
  12. Qin, Z.Z.; Barrett, R.; Del Mar Castro, M.; Zaidi, S.; Codlin, A.; Creswell, J.; Denkinger, C. Early user experience and lessons learned using ultra-portable digital X-ray with computer-aided detection (DXR-CAD) products: A qualitative study from the perspective of healthcare providers. PLoS ONE 2023, 18, e0277843. [Google Scholar] [CrossRef]
  13. Panahandeh, S.; May, D.; Grosse-Kockert, C.; Schacht, R.; Ras, M.A.; Wunderle, B. Pulsed infrared thermal imaging as inline quality assessment tool. Microelectron. Reliab. 2023, 142, 114910. [Google Scholar] [CrossRef]
  14. Gudino, N.; Littin, S. Advancements in Gradient System Performance for Clinical and Research MRI. J. Magn. Reson. Imaging 2023, 57, 57–70. [Google Scholar] [CrossRef]
  15. An, J.H.; Ahmed, H.; Lee, J.R. Defect visualization of cylindrical and conical CFRP lattice structures using rotational ultrasonic propagation imager. Meas. Sci. Technol. 2021, 32, 124001. [Google Scholar] [CrossRef]
  16. Hendroprasetyo, W.; Andrian, H. Analysis of Eddy Current Testing Detection Ability to the Varied Longitudinal Cracks on Coated Weld Metal Tee Joint of 5083 Aluminum Ship Structure. IOP Conf. Ser. Earth Environ. Sci. 2022, 972, 012041. [Google Scholar] [CrossRef]
  17. Schulze, M.H.; Heuer, H.; Kuettner, M. High-resolution eddy current sensor system. In Proceedings of the Conference on Smart Sensors, Actuators, and MEMS IV, Dresden, Germany, 18 May 2009. [Google Scholar]
  18. Heuer, H.; Schulze, M.H.; Meyendorf, N. Non-destructive evaluation (NDE) of composites: Eddy current techniques. Non-Destr. Eval. (NDE) Polym. Matrix Compos. 2013, 3, 33–55. [Google Scholar]
  19. Cheng, J.; Qiu, J.; Ji, H.; Wang, E.; Takagi, T.; Uchimoto, T. Application of low frequency ECT method in noncontact detection and visualization of CFRP material. Compos. Part B Eng. 2017, 110, 141–152. [Google Scholar] [CrossRef]
  20. Zhang, N.; Ye, C.; Peng, L.; Tao, Y. Eddy current probe with three-phase excitation and integrated array tunnel magnetoresistance sensors. IEEE Trans. Ind. Electron. 2020, 68, 5325–5336. [Google Scholar] [CrossRef]
  21. Joubert, P.Y.; Pinassaud, J. Linear magneto-optic imager for non-destructive evaluation. Sens. Actuators A Phys. 2006, 129, 126–130. [Google Scholar] [CrossRef]
  22. Cheng, Y.; Deng, Y.; Bai, L.; Chen, K. Enhanced laser-based magneto-optic imaging system for nondestructive evaluation applications. IEEE Trans. Instrum. Meas. 2012, 62, 1192–1198. [Google Scholar] [CrossRef]
  23. Hafez, J.M.; Gao, J.; Eden, J.G. Detection of weak (0.5–300 nT), low frequency (5–100 Hz) magnetic fields at room temperature by kilohertz modulation of the magneto-optical hysteresis in rare earth–iron garnet films. Appl. Phys. Lett. 2007, 90, 132502. [Google Scholar] [CrossRef]
  24. Vishnevskii, V.; Berzhansky, V.N.; Mikhailov, V.; Pankov, F.; Nesteruk, A. Magneto-Optic Eddy Current Introscopy Based on Garnet Films. In Proceedings of the IEEE International Conference on Oxide Materials for Electronic Engineering, Lviv, Ukraine, 3–7 September 2012. [Google Scholar]
  25. Deeter, M.N.; Rose, A.H.; Day, G.W. Fast, sensitive magnetic-field sensors based on the Faraday effect in YIG. J. Light. Technol. 2002, 8, 1838–1842. [Google Scholar] [CrossRef] [Green Version]
  26. Amirsolaimani, B.; Gangopadhyay, P.; Persoons, A.; Showghi, S.; LaComb, L.; Norwood, R.; Peyghambarian, N. High sensitivity magnetometer using nanocomposite polymers with large magneto-optic response: Retraction. Opt. Lett. 2020, 20, 45. [Google Scholar] [CrossRef]
  27. Gao, X.; Zhou, X.; Wang, C.; Ma, N.; You, D. Skin depth and detection ability of magneto-optical imaging for weld defects in alternating magnetic field. J. Manuf. Syst. 2020, 55, 44–55. [Google Scholar] [CrossRef]
  28. Berzhansky, V.N.; Filippov, D.M.; Lugovskoy, N.V. Magneto-optical visualization of eddy current magnetic fields. Phys. Procedia 2016, 82, 27–31. [Google Scholar] [CrossRef] [Green Version]
  29. Xue, Y.; Qing-Hui, Y.; Huai-Wu, Z.; Qi-Ye, W.; Fei-Ming, B.; Zhi-Yong, Z.; Ding, Z.; Jian-Tao, H. Preparation and orientation mechanism analysis of (BiTm)3(GaFe)5O12 magneto-optical single crystal film with out-of-plane orientation. Acta Phys. Sin. 2021, 70, 1078011. [Google Scholar]
  30. Qin, J.; Xia, S.; Jia, K.; Wang, C.; Tang, T.; Lu, H.; Zhang, L.; Zhou, P.; Peng, B.; Deng, L.; et al. Enhancement of the Faraday effect and magneto-optical figure of merit in all-dielectric metasurfaces. ACS Photonics 2022, 9, 1240–1247. [Google Scholar]
  31. Karakhanyan, V.; Eustache, C.; Lefier, Y.; Grosjean, T. Inverse Faraday effect from the orbital angular momentum of light. Phys. Rev. B 2022, 105, 045406. [Google Scholar] [CrossRef]
  32. Mao, X.; Qin, G.-Q.; Yang, H.; Wang, Z.; Wang, M.; Li, G.-Q.; Xue, P.; Long, G.-L. Tunable partial polarization beam splitter and optomechanically induced Faraday effect. Phys. Rev. A 2022, 105, 033526. [Google Scholar] [CrossRef]
  33. Radtke, U.; Zielke, R.; Rademacher, H.G.; Crostack, H.A.; Hergt, R. Application of magneto-optical method for real-time visualization of eddy currents with high spatial resolution for nondestructive testing. Opt. Lasers Eng. 2001, 36, 251–268. [Google Scholar] [CrossRef]
Figure 1. Principle of the magneto-optical detection and imaging system.
Applsci 13 04541 g001
Figure 2. The experiment setup.
Applsci 13 04541 g002
Figure 3. Schematic diagram of the simulation model.
Applsci 13 04541 g003
Figure 4. The Bz phase of a normal sample.
Applsci 13 04541 g004
Figure 5. Distribution of the eddy current induced by the excitation coil. (a) Coil approaches the crack, (b) coil moves on the crack, and (c) coil leaves the crack.
Applsci 13 04541 g005
Figure 6. The line scan result of the normalized Bz phase.
Applsci 13 04541 g006
Figure 7. The normalized Bz phase by the line scan with different measuring distances: (a) 4 mm and (b) 6 mm.
Applsci 13 04541 g007
Figure 8. The normalized Bz phase by line scan.
Applsci 13 04541 g008
Figure 9. The c scan Bz phase images: (a) approximately 7 mm long surface crack, (b) approximately 10 mm long back crack.
Applsci 13 04541 g009
Disclaimer/Publisher’s Note: The statements, opinions and data contained in all publications are solely those of the individual author(s) and contributor(s) and not of MDPI and/or the editor(s). MDPI and/or the editor(s) disclaim responsibility for any injury to people or property resulting from any ideas, methods, instructions or products referred to in the content.

