Article

Deep-Learning-Based Sound Classification Model for Concrete Pouring Work Monitoring at a Construction Site

1
Department of Convergence Engineering for Future City, Sungkyunkwan University, Suwon 16419, Republic of Korea
2
School of Civil, Architectural Engineering & Landscape Architecture, Sungkyunkwan University, Suwon 16419, Republic of Korea
*
Author to whom correspondence should be addressed.
Appl. Sci. 2023, 13(8), 4789; https://doi.org/10.3390/app13084789
Submission received: 9 March 2023 / Revised: 9 April 2023 / Accepted: 10 April 2023 / Published: 11 April 2023
(This article belongs to the Section Civil Engineering)

Abstract

:
In the present study, the utilization of sound data in research and technology is examined, data classification techniques are analyzed, and the applicability and necessity of these techniques are explored in order to propose an acoustic classification model that differentiates between normal and abnormal sounds during concrete pouring. The paper presents an experiment in which normal sound data occurring during concrete pouring, main noise data from construction, and symptom data that could affect structural quality or even cause a collapse incident were collected. By analyzing sound data from actual construction sites and experiments, a deep-learning-based classification model was developed with the aim of preventing events that could compromise the quality and safety of structures in advance. In the classification model, both CNN (convolutional neural network) and RNN (recurrent neural network) exhibited high accuracies of 94.38% and 93.26%, respectively, demonstrating remarkable performance in identifying the status of concrete placement. Unlike previous research that only collected and sorted normal construction-related sound data, the current study developed a sorting model that addresses quality- and safety-related matters by including sound data that may influence material separation, concrete leakage, and formwork collapse during concrete placement, and differentiating these sounds from normal concrete pouring sounds. The research findings are expected to contribute to the improvement of safety management and work efficiency at construction sites.

1. Introduction

Increasing personnel and equipment are deployed at construction sites as construction projects have recently become larger and more complex. Consequently, countermeasures and prevention are emerging as important challenges in construction sites due to safety accidents. Rapid response and control systems are being established in many countries, including South Korea, through the establishment of national disaster management institutions. Despite these efforts, approximately 500 people die every year from industrial accidents in South Korea, and the mortality rate per 10,000 workers was 1.47, which is approximately 45% higher than the average mortality rate from industrial accidents of 1.01 (Korea Occupational Safety and Health Agency 2015). Temporary construction, excavation, and reinforced concrete work are the major causes of accidents. An investigation regarding the details of collapse and destruction accidents revealed that most of them were related to collapses during concrete pouring or due to upper loading. Many accidents involving temporary construction, excavation, and reinforced concrete construction work, such as collapse and destruction accidents, were caused by the failure of the formwork and shores to withstand the upper load during concrete pouring.
Collapse of the formwork or concrete leaks during the pouring process can significantly affect the quality of the structure and cause human and physical damage [1]. Changes inside and outside must be detected and monitored [2] during concrete pouring to prevent the aforementioned accidents. Cameras [3] and several measuring sensors [4] are being introduced, as it is extremely dangerous to monitor directly under the formwork with the naked eye during the pouring work [5]. However, CCTV [6] has limitations in that only a limited range can be covered, and the measurement also has low economic feasibility because it must be attached to the main formwork. It is therefore necessary to establish a monitoring system that can fulfil a wide range of demands. The present study proposes a method that uses sound data [7] to overcome the limitations of sensor- and visual-data-based technologies. Sound data complements the blind spots of a camera, and unlike high-resolution image data, the size of sound data is only one-thousandth that of video data, thus enabling real-time data transmission at construction sites, even at low transmission speeds. Therefore, our aim is to establish a framework that serves as the basis of a system that can react to disasters proactively by identifying unstable conditions and behaviors.
Recently, algorithms are being developed in order to classify equipment sounds so as to monitor the status of civil engineering sites [8]. While equipment sounds are no longer considered noise which should block sound data in the construction field, they are considered necessary data for management. In previous studies, the primary focus was on collecting and classifying mechanical equipment and work sounds at construction sites. Data that can cause problems with the work status were not collected, but only normal sounds were collected. However, the present study focuses on concrete pouring work, and collected sound data which could affect material separation and formwork collapse through actual experiments, enabling a more systematic understanding of the current status by distinguishing such sounds from normal concrete pouring sounds. A system that can immediately inform safety accidents that may occur during concrete pouring or detect abnormal signs in the early stages of an accident by utilizing sound analysis is developed in this study. The aim is to improve accuracy through deep-learning algorithms based on sound data collected at an actual construction site and to use the data as an effective monitoring method for sound-based work status and safety management in the future.

2. Literature Review

2.1. Accident Detection Studies Based on Acoustic Analysis

Sound is a wave in which the vibration of an object is transmitted by a medium and is divided into voice and acoustics, such as human voices or speech. Prior studies were primarily conducted for educational use by analyzing features, such as change in rhythm, intonation, and speech speed [9], in the field of humanities and for developing a medical system for laryngeal cancer detection and voice therapy in the field of medical engineering [10]. In the field of information and communication, artificial intelligence, such as Siri, and technology to match the facial expression and voice of a character in animation games are being developed through voice recognition [11]. Sound waves are used not only to detect the situation around vehicles [12], but also to identify diseases and abnormal signs through the cries of livestock [13]. Voice analysis technology is also applied to determine whether a person is the identical person for scientific investigation of a criminal case [14] or to respond to a disaster situation by determining emotions or circumstances of a person [15]. Studies related to accident detection are being conducted in various industrial fields using the unique features of sound data. First, in the case of a traffic accident automatic detection system [16], CCTV was installed in a designated area and data were analyzed in real time to automatically detect the accident situation [17] in a tunnel and provide information to prevent secondary accidents. However, because the system in the study was applied to a tunnel [18], which is a linear space, it cannot be applied to a construction site in a three-dimensional space. The landslide monitoring system [19] in the field of civil engineering predicts the risk in advance by detecting changes in water temperature using a thermometer and analyzing the acoustics when the earth moves down a slope. However, this system is difficult to be applied to construction sites where various sounds are generated outdoors because not only the ground needs to be drilled, but also the acoustics of an accident are detected when external noise is blocked after drilling. The study of tracking and monitoring of the working status and productivity of heavy equipment through sound analysis [20] can be viewed as similar to this study in terms of improving the problems of monitoring through the attached sensors and analyzing sound patterns. However, acoustic analysis was not performed across the construction site because the activity of only a single machine, which was relatively distant from external noise, was analyzed in heavy equipment monitoring, and there were significant limitations to be applied to the safety management field of the construction site as the setting and layout of the device were not considered for measurement (i.e., position, distance, direction, and number of microphones). Although studies for accident detection in construction are also being conducted, most of them monitor dangerous situations in real time using equipment that has recently been miniaturized and advanced. In previous studies on accident monitoring using advanced equipment, USN-based real-time monitoring [21] was performed using several measurement sensors (i.e., ultrasonic wave, load, and inclination) in a temporary formwork construction. In addition, signs of collapse must be detected quickly, as roads and railroad slopes often collapse due to heavy rains caused by extreme weather conditions. Therefore, a system that can determine the risk of sudden slope collapse has been developed [22]. A new analysis algorithm has also been developed to detect signs of sudden slope collapse, which means that actions, such as warnings, evacuation instructions, and road closures, can be taken more quickly by detecting the signs. Similarly, even if measurements and management are performed using various types of sensors in the field of construction accident management, they are not actively applied due to the high cost required for maintenance. Conventional sensor-based monitoring systems are disadvantageous in terms of installation and maintenance and pose economic problems when applied to large-scale construction sites. Meanwhile, the accident detection system, which analyzes the frequency and sound pattern, can monitor a wide range by simply placing the equipment at a certain point, without having to attach the equipment individually. This system is considered to be effective, as it can be used together with noise management at the construction site. In addition, an accident can be detected through sound analysis at the construction site if the accident acoustics that may occur at the site are identified by classifying the various construction sounds at the site. If action can be taken in advance by detecting the accident beforehand in a situation where the time, method, and location of the occurrence are unknown, the effective value is expected to be extremely high. Research on sound data is being conducted across various fields, and the construction industry is no exception. The focus of our study is on the potential applications of sound data in the construction industry, particularly with regards to improving safety and productivity.

2.2. Studies on AI in the Construction Field

Various studies using machine-learning, deep-learning, and AI algorithms are being conducted in the field of construction. The applicability to the safety management field [23], which requires a large number of structured or unstructured data, is being investigated, and studies to predict the construction cost and construction period of new projects are being conducted [24], focusing on past project cases. In addition, there are studies using machine learning in the process of analyzing business feasibility [25] or rationally selecting contractors [26]. In recent years, machine learning techniques have also been applied to the analysis of concrete structures, such as the development of shear capacity equations for reinforced concrete (RC) elements with stirrups [27] and the formulation of best practices in concrete science [28]. First, the attributes that caused the accident were defined by analyzing the safety report, and the data on the defined attributes were used to predict potential safety accidents in a new situation [29]. In this process, the energy source, type of injury, injury area, and degree of injury were predicted by applying random forest and stochastic gradient tree boosting (SGTB) to improve the accuracy of data analysis and prediction [30]. In addition, the evolutionary SVM inference model (ESIM), applying fast messy genetic algorithm (fmGA) and SVM, was proposed to predict the estimate at completion (EAC), and the applicability of the proposed model was identified by applying it to the data of past construction projects [31]. In addition, a decision tree using bagging and boosting techniques was proposed and applied to predict the construction period of the construction project, and the effectiveness of the proposed model was identified by comparing the application results with the SVM algorithm [32]. Pre-qualification was performed using the SVM algorithm for rational selection of the contractor, and the performance of the SVM algorithm was identified by comparing it with the artificial neural network algorithm [33]. Factors for the feasibility analysis of a construction project in the early stages of the project were derived, and the feasibility of the new project was predicted using the qualitative evaluation results for each factor [34]. Data were collected by applying an accelerometer sensor to machine parts, and machine learning algorithms were applied to detect damage to movable bridges in the field of building maintenance. The performance of each algorithm was compared and analyzed by applying artificial neural network, radial basis function (RBF) network, and SVM algorithm to predict the pavement performance, which is an important factor in the configuration of pavement management systems [35]. Energy demand–supply of buildings was analyzed by applying a clustering algorithm to the real-time data of buildings and substations in relation to the energy analysis of buildings [36]. The energy loss of buildings was optimized, and the loss factors were identified using a semi-supervised learning algorithm in this process. A random forest algorithm was applied to accurately predict the energy performance of residential buildings, and the applicability of the random forest algorithm to energy analysis was identified by comparing it with the linear regression method [37]. The field of applying machine learning algorithms in the construction industry was identified using large amounts of data from various types of sensors and images. For example, real-time data that can be obtained from wireless networking technology and temperature sensors were analyzed to predict building disasters, such as fire, using machine learning [38], and a method for tracking the location of multiple workers at the construction site by analyzing image data was proposed [39]. In addition, a method was proposed to automatically detect concrete structures by analyzing the color data in the image [40]. Similarly, studies applying deep-learning algorithms are actively being conducted to utilize various forms of data throughout the construction site. Studies on the analysis of various data are being conducted throughout the life cycle of a building, and studies using vision data on the site are actively being conducted with the recent development of drones, AR, and VR technologies [41]. However, sound data on the site are not determined as useful information for construction management but as unwanted noise, and studies have not been conducted on the analysis and application of this information. Sound data have a wider collection range than vision data, which is collected through a camera, and have the advantage of easy installation and maintenance compared to measurement sensors that must be attached to structures. Therefore, it is determined that safety and monitoring can be managed more actively by developing a classification model that can check the signs of safety accidents and work status through analysis and classification of sound data. Furthermore, it is expected that a more robust safety and work monitoring system can be built through the combination of vision data and data received from various sensors. Although AI is extensively used in the construction industry for safety management and analyzing construction-related data, research on analyzing and utilizing sound data generated from construction sites is scarce. Therefore, there is a recognized need for further investigation in this area. By studying sound data and combining it with visual data and diverse sensor information, we can anticipate a more robust safety and work monitoring system.

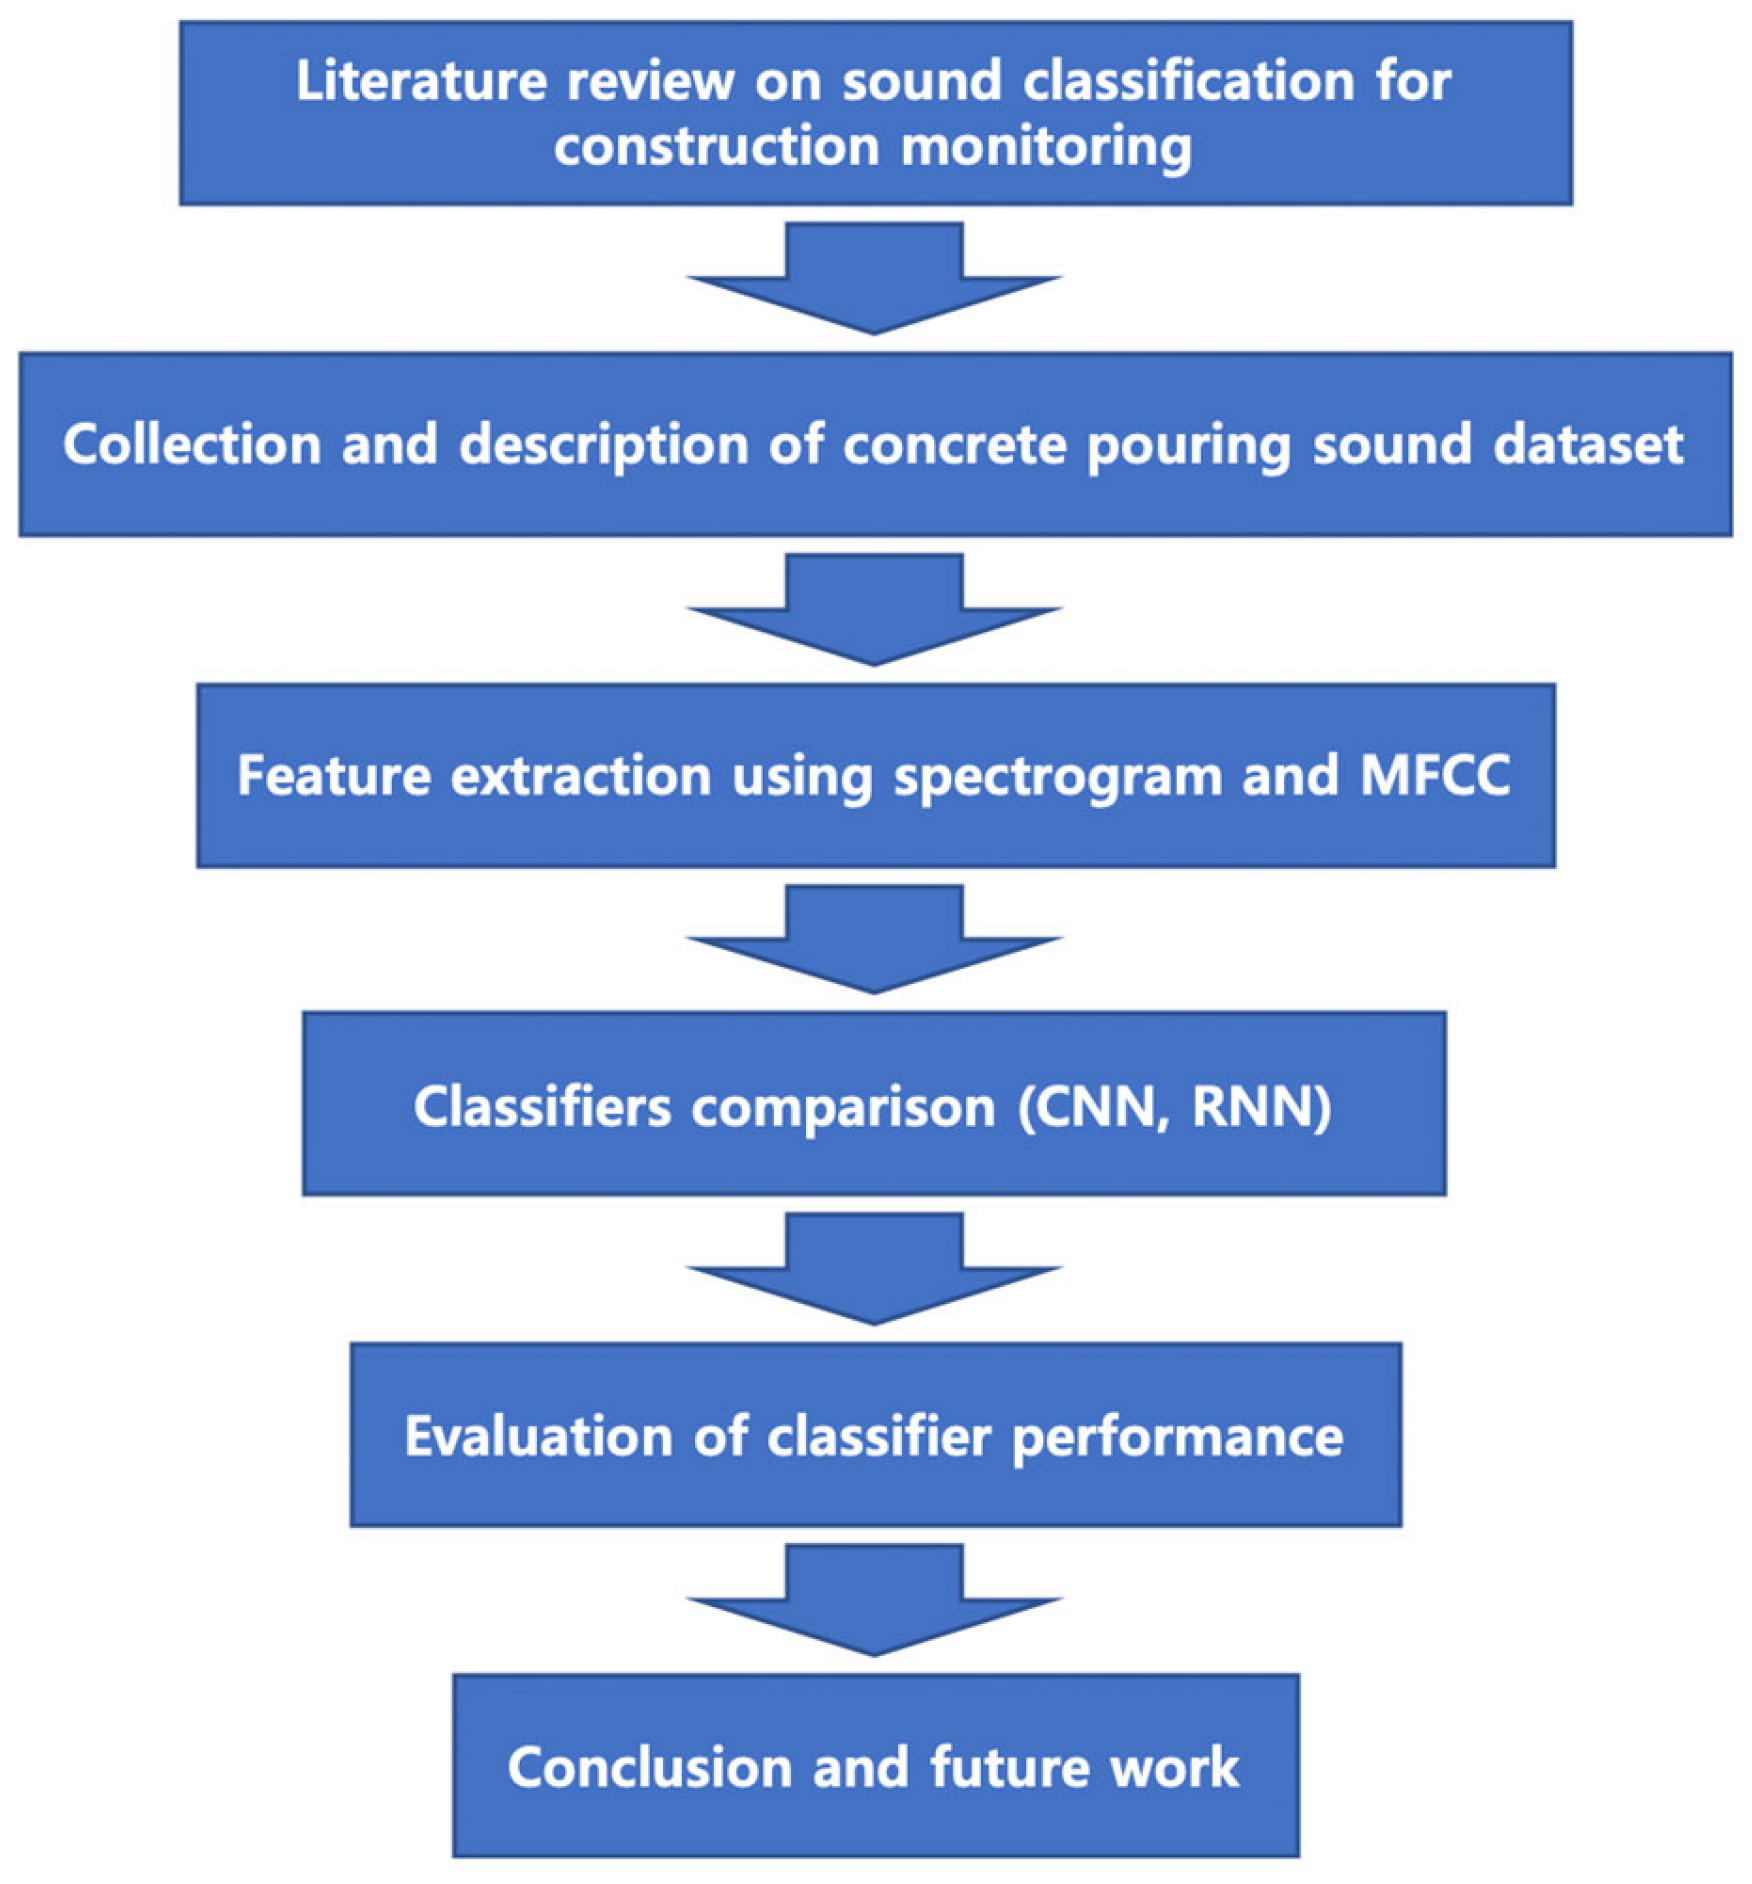
3. Research Scope and Method

The present study is focused on developing a classification model that can immediately inform about safety accidents that may occur during concrete pouring through sound source analysis at the site. “Accident sounds” and “abnormal signs” can be classified as sounds indicating an accident occurrence and sounds that can cause accident rates, respectively. Taking concrete pouring as an example, “accident sounds” may include the impact sound of distorted and falling formwork and screaming sounds of people caused by external impact, while “abnormal signs” refer to sounds that may cause accidents, such as the impact sound of the vibrator’s formwork and the sound of concrete slowly leaking, as well as sounds indicating the need for work interruption and modification. Because sound data related to accident sounds or abnormal signs can only be collected when an actual accident occurs, the purpose of the present study is to develop a model that analyzes and classifies normal sound data by analyzing various sound sources at the site. The aim is to apply a classification algorithm suitable for the characteristics of sound sources at the construction site to increase its usability as a cornerstone of the sound-based work status and safety monitoring system and as an effective monitoring method for on-site work management and safety management in the future. The following steps, summarized in Figure 1, were taken to develop a sound source classification model that is suitable for the characteristics of a construction site. First, previous literature and case studies were reviewed to summarize the limitations and characteristics of accident detection studies currently used in construction sites, and methods for accident detection using sound sources in various industrial fields were analyzed. Second, the sound data generated at a construction site were collected and processed by dividing them into units required for data analysis for each class. Third, the sound data collected at the site were separated into a certain unit, converted into image data, and pre-processed to be directly applied to the deep-learning algorithm using the feature extraction algorithm. Fourth, the accuracy, strengths, and weaknesses of each algorithm were analyzed by applying the CNN and RNN deep-learning algorithms used in sound analysis, respectively. Finally, the experimental results were analyzed, the limitations observed in the classification model and system development process were discussed, and future system development and research directions were proposed.

4. Methods and Models for Sound Classification in Concrete Pouring Work Monitoring

The present study has developed a classification model that divides and learns various sounds at a construction site by class after intensively collecting and analyzing sounds during pouring work. The study utilized CNN and RNN algorithms based on Google Colab to implement the classification model, and the results were compared and verified using the four performance measures of accuracy, precision, recall, and F-1 score to evaluate the model’s effectiveness.

4.1. Dataset

The sound data were collected directly from the construction site during the pouring process to secure data reliability, which is vital in the development of a deep-learning-based classification model (Figure 2). The Zoom H6 audio recorder, equipped with a high-performance microphone, was used as a sound source data collection device, and visual data were collected simultaneously using a video camera. Visual data were used for sound source data classification when there were unspecified data in the audio data or when the overall situation had to be understood.
The data consisted of overlapping various cases, considering various situations, particularly due to the fact that pouring noise is a compound rather than a single sound. Additionally, other cases of single noise at the construction site were collected at the actual site or added using official data (urban 8 k) [42]. A model to determine abnormal data by analyzing and classifying normal sound data was utilized in this study, as sound data related to accident sounds or abnormal signs can only be collected when an actual accident occurs.
In addition, although they do not represent serious sounds, such as an “accidental sound”, a separate experiment was created to collect sound sources that could potentially cause accidents or affect the quality of structures, thus creating artificial situations and adding data (Figure 3). As shown in Figure 3, the formwork was constructed identically to that of aluminum and wooden–steel forms, and the same process as the actual construction site was used. The concrete is injected, after which air bubbles in the concrete are eliminated with a vibrator, which is an essential step in concrete pouring; the vibrator ensures that the concrete is filled well without gaps to obtain more dense concrete. However, if the vibrator impacts the formwork during this process, the concrete will leak momentarily, and in the event of extensive damage, the formwork will be deformed. If the fastening parts of the formwork are detached due to the vibrator’s impact, not only concrete leakage but also the deformation of the formwork caused by continuous impact may lead to work interruption, rework, and even human casualties. Experiments confirmed this phenomenon, and additional data could be collected for vibrator impact sounds. Finally, the data were processed and organized to categorize a total of eight classes from the collected sound source data of the actual construction site and the experiments.

4.2. Feature Extraction

The collected sound source data were converted into an image after extracting and merging the features, such as time, frequency, cepstral, and wavelet domain, and a classification model was created by applying this shape information to a learning algorithm. Therefore, it can be considered that the feature extraction of sound source data is the most basic and important factor in the development of a learning model. The mel-frequency cepstral coefficient (MFCC) technique was used in this study, which is a technique that extracts features by dividing the data at a certain interval (short time) and analyzing the spectrum for this interval, rather than targeting the entire input sound (Figure 4).
First, the sound data frame was divided [43]. The sound signal input in the time domain continuously changes (Figure 5). For simplification, it was assumed that the sound signal does not change considerably within a short time. However, this assumption does not mean that there is absolutely no change in the signal, but that there is a little statistical change in a short time. The length of the frame is generally set at approximately 20–40 ms in MFCC. Although the number of samples may vary depending on the sampling rate, it is approximately 1000 samples based on 44.1 KHz. The reliability of the frequency analysis is low if the number of samples is extremely small, and the analysis is difficult if it is considerably large because the signal change becomes considerably large within one frame.
Then, the power spectrum [44] for each frame was calculated (Figure 6). Depending on the frequency of the input sound, different parts of the cochlea in the human ear vibrate. In other words, each cochlear nerve informs the brain of the frequency of input, based on the point of the cochlea that vibrates. Periodogram estimation in MFCC performs this function in humans.
Although it is extremely discriminative at low frequencies, it is less discriminative at higher frequencies. Therefore, the energy between various frequencies can be shown by creating groups of periodogram bins and summing these groups. A filter called mel filter bank was then passed through the spectrum. A mel filter is used to determine the amount of energy that is generated at each interval, which is extremely thin at low frequency and widens as the frequency increases and is rarely considered at high frequency. The mel scale determines the interval when separating the filter bank, and the method to separate the interval is as follows [43]:
Convert   Frequency   to   Mel   Scale :   M ( f ) = 1125   ln ( 1 + f 700 )
Convert   Mel   Scale   to   Frequency :   M 1 ( m ) = 700 ( exp m 1125 1 )
It takes the log of the value once the filter bank energy is input. This compression operation makes it possible to create sound features similar to what humans actually hear. A log is taken because the human ear does not detect the volume of the sound with a linear scale. In addition, cepstral mean subtraction can be used later if a log is taken. The discrete cosine transform (DCT) is calculated [44] for the filter bank energy from which the log is taken. The DCT compresses and expresses a matrix for a feature called the mel-spectrogram. Filter bank DCT separates the correlation between energies because everything is overlapped in the filter bank.
DCT is a transformation that expresses a specific function as the sum of the cosine functions. The cepstral coefficient of the cosine function in the beginning has most of the data information before the transformation and is approximated to 0, thereby showing the effect of data compression as it moves towards to the end. In other words, energy concentrates at lower frequencies, and 12 cepstral coefficients, in which information and energy are concentrated among 26 coefficients, are selected and used as features. A total of 13 values per frame serves as the feature when the energy obtained accordingly is added, and this is called MFCC. In summary, the feature extraction of sound data is performed to obtain the cepstral domain through a spectrum converted to an image. The 13 cepstral coefficient values serve as features of sound data by taking the DCT on the mel spectrogram (Figure 7). They are preprocessed into a form that can be recognized and classified by a computer through these steps and that can be input into a learning algorithm.

4.3. Classfiers (CNN and RNN)

The sound data preprocessed through the procedure described in Section 4.2 are learned through a deep-learning algorithm, thereby building a classification model. Deep-learning algorithms typically used in sound and voice recognition are convolution neural networks (CNNs), recurrent neural networks (RNNs), and long–short-term memory (LSTM). The classification methods and characteristics of the three algorithms were analyzed, and the model most suitable for classification of actual site sound data was determined, applied, and then compared and analyzed in this study. A CNN consists of an input layer, an output layer, and several hidden layers. Because convolution calculations are performed in the hidden layer, this neural network is called a CNN. The major difference from the general neural network structure is that an image is regarded as the input of CNN. In addition, the feature is captured in the image. For example, when looking at a face, it is recognized as a face because there are ears, eyes, nose, and head. Even if the ears are covered with hair, it is recognized as a face based on the consideration of other probable factors on the face. However, the lines and edges, textures, and shapes in an image can be distinguished and contrasted by the eyes or nose that are generally known because it must be able to recognize the eyes and nose in reality. It is also about determining the relative size and location of features. Therefore, the CNN classifies and determines the unique features of an object by learning, regardless of the specific coordinates (location).
CNN [45] can be divided into two parts, one that extracts the features of an image and another that classifies the class, as shown in Figure 8. The feature extraction area is composed of several layers of convolution and pooling layers, and the two convolution layers are essential elements that reflect the activation function after applying a filter to the input data. The pooling layers next to the convolution layers are optional. A fully connected layer for image classification is added at the end of the CNN, and a flattened layer that converts image data to an array is located between the part that extracts features of the image and the part that classifies the image.
In CNN, the filter convolutes the input data to extract image features, calculates convolutions, and creates a feature map using the calculation results (Figure 8). The shape of the output data in the convolution layer differs depending on the filter size, stride, applied padding, and maximum pooling size. Consequently, CNN is extremely suitable for feature extraction and training of an image with plural filters, and it is determined that instantaneous sound data can be recognized quickly owing to its effectiveness in recognizing features with the adjacent images while retaining the spatial information of the image. RNNs differ from CNNs as they contain ‘memory’ (in other words, hidden state). Network memory is the information that summarizes the input data so far, in which the network gradually modifies its own memory whenever a new input is available, and the memory left to the network after processing all the inputs becomes the information summarizing the entire sequence. This is similar to the way humans process sequences (Figure 9).
RNN is an effective deep-learning technique [46] to learn the sequence through a structure in which a certain part is repeated, which is a basic structure that has W (recurrent weight) from the hidden layer to itself (Figure 10). It is a neural network algorithm that has recurrent weight indicating itself by the directed cycle formed by the connection between units, in which the value(s) of the previous state becomes the input of the next calculation, thereby affecting the result. For example, when recognizing a word or sentence, the RNN refers to the preceding word and letter. RNN is primarily used to recognize sequential information, such as voice and letters, because it effectively processes only relatively short sequences. In addition, the biggest advantage of RNNs is that various and flexible structures can be created as necessary, as it is a network structure that can accept inputs and outputs regardless of the length of the sequence (Figure 11).
However, RNNs have an inherent issue in determining relatively long sounds or long sentences. As an alternative, LSTMs incorporate a gate that controls the flow of data, enabling improved determinations. This enhanced RNN structure reflects long-distance dependencies by adding a gate that controls the amount of information transmitted without unconditionally reflecting the input value in the state. Nonetheless, the application of the LSTM algorithm was not considered in this study, as sound data at construction sites do not possess the characteristics of long sound data that require reflection of long-distance dependencies, such as words or sentences. CNN is particularly useful in capturing local patterns (e.g., spectral characteristics of sound) within the data, while RNN is suitable for processing sequential data and captures temporal patterns of audio signals well. Through these two algorithms, sound related to concrete pouring work can be classified more accurately. Therefore, this study analyzed the characteristics of CNN and RNN, which are representative deep-learning algorithms in the field of sound recognition, constructed a site sound data classification model by inputting pre-processed sound data to both CNN and RNN, and compared and verified the accuracy of the classification model using various indicators.

5. Results and Utilization Plan

Classification performance indicators were used to evaluate whether the labels classified based on the trained data accurately matched the actual labels. The most commonly used accuracy, precision, recall, and F-1 score were used among the various performance indicators. Precision is calculated as the number of true positives (TP) divided by the sum of true positives and false positives (FP): Precision = TP/(TP + FP). Similarly, recall is calculated as the number of true positives divided by the sum of true positives and false negatives (FN): Recall = TP/(TP + FN). For instance, if the classifier correctly identifies 80 true positives, 20 false positives, and 10 false negatives, the precision would be 80/(80 + 20) = 0.8 and recall would be 80/(80 + 10) = 0.89. Although accuracy is a ratio of accurately predicting positive/false values and is often used to judge intuitive accuracy, it is difficult to be evaluated properly if data are unbalanced or biased to a specific class. Precision is the probability of the actual values being positive among the positive results classified by the model. It is also called positive predictive value (PPV) as an indicator of how well the positives were predicted. Recall (recall rate) is the ratio of the true values predicted by the model among those that are actually true, which means the same as sensitivity. The criteria for true positives are different from precision. Precision and recall can be used in a complementary manner; when the results of both indicators are high, they can be considered better indicators. Although precision is important in some cases, the recall value is also important in certain other cases depending on the analysis data. The F-1 score is an indicator that reveals the effectiveness of the model. It is a harmonic average of precision and recall, which combines two values and converts them into one statistical value. It was found that the data ratio of the label was extremely different for each class, as the pouring noise was primarily collected in the beginning. Although it was determined that there was no problem in training even though the data ratio was different as the purpose was to train and determine the pouring noise, the imbalance of the dataset exhibited many errors and biases in the construction of the classification model.
Therefore, data preprocessing was performed by adding white noise to the existing data or by including the official data (urban 8 k) to balance the existing data. The precision and recall ratio of all classes were improved as a result of calculating and expressing the precision and recall values for each class, as shown in both Figure 12 and Table 1.
A total of approximately 9000 data were collected, with 80% (7200 data) used for training and 20% (1800 data) used for testing the CNN model by setting an optimized interval. As a result of performing 100 iterations, the accuracy for determining the performance of the classification model continued to increase as the number of iterations increased, and then converged after the 78th iteration, resulting in an accuracy of approximately 94.38%. In addition, it was trained by inputting them into the RNN model, and as a result of performing iteration learning 100 times as in the CNN model, the accuracy increased as the number of iterations increased, and then converged after the 69th iteration, resulting in an accuracy of approximately 93.26% (Figure 13).
As a result of training on the CNN and RNN models with the following parameters (e.g., number of layers, neurons, activation functions, and training epochs), both showed extremely high accuracy at 94.38% and 93.26%, respectively. In classification model development, both models are expected to exhibit high performance in classifying sound data at the site. In the case of the CNN model, the data preprocessing process was relatively short, because the converted image data could be trained without additional processing. In the case of a classification model, it had the advantage of accurately predicting and determining unique features, even in constant noise, by canceling noise and providing consistent features for fine parts. It is therefore considered to be useful for capturing sudden abnormal signs or shock sounds in major construction work types at the site. Meanwhile, in the case of the RNN model, relatively high hardware performance and a long time were required in the data preprocessing process before data learning, unlike the CNN model, because a sequence image of a certain section rather than a single captured image needs to be input. However, it is determined that it will be useful for a system that can determine the amount of work at the site and continuously monitor the work status, because the recurring structure of the RNN model is advantageous in continuous, iterative, and sequential data learning by reflecting the past weight value to the current learning.

Utilization Plan

The proposed model has the potential to aid in identifying potential issues during concrete pouring by detecting formwork impact sounds, which may help mitigate the risk of accidents. Currently, the deep-learning-based classification model focuses on detecting formwork impact sounds during concrete pouring. However, as future work unfolds, it is planned to expand the model to detect more specific accident-related sounds, such as the sound of formwork breakage, by collecting and classifying additional sound data. This expansion is particularly significant given that the deep-learning-based sound classification model emphasizes detecting formwork impact sounds during concrete pouring work.
In light of these developments, a sound classification model for concrete pouring work can be utilized at construction sites to analyze sound data and understand the current status of the concrete pouring process, including the timing and productivity of the work. By analyzing sound data from vibrator work, the model can identify the compacting work time and prevent material separation. Furthermore, the model can immediately instruct the manager to stop and supplement the work by identifying the sound of impact on the formwork in real-time. Additionally, the model can be set to issue a warning if it detects loud impact sounds, such as the collapse of formwork or external impacts, by identifying sound data that exceed an acceptable threshold for such noises (Figure 14).
Building upon these capabilities, integrating the proposed sound classification model with existing safety management systems at construction sites can lead to a more comprehensive and effective safety monitoring approach. Combining sound data analysis with other sensor data and visual monitoring techniques could provide a more accurate and real-time assessment of potential hazards, ultimately improving overall safety on construction sites. This improvement will enable construction managers and workers to leverage the proposed model to enhance safety practices and procedures by monitoring the sound data in real time and taking appropriate actions to mitigate potential risks.
Moreover, the proposed model can contribute to reducing costs associated with accidents, downtime, and delays in construction projects. Early detection of potential issues and timely interventions can help prevent accidents that might result in costly damage to equipment, materials, and structures, as well as injuries to workers. Additionally, by minimizing downtime and delays caused by accidents or safety incidents, the model can contribute to more efficient construction processes and ultimately lead to cost savings for construction companies.
As a future goal, identifying the cause and type of sound through a deep-learning algorithm based on the measured sound source data after measuring and analyzing various types of sounds generated at the construction site is essential. This will help in developing an IoT device and operating system that predicts and notifies the location of the corresponding area when an abnormal sign is detected (Figure 15). A classification model that can detect abnormal sounds by classifying normal noise at the site was applied in this study because it is difficult to collect and learn sounds of accidents or abnormal signs. The classification model can be continuously upgraded and abnormal sign data can be secured using the accumulated data on the server if all the sound data of the site are transmitted to the server after building a web server based on the classification model. Consequently, the more the system is used on the site, the more robust the system will be.
Based on the findings presented in this study, several directions for future research are suggested. First, future researchers should aim to collect and annotate a larger and more diverse dataset of construction site sounds to further improve the accuracy and generalizability of the model. Second, investigating the potential of incorporating other types of sensor data, such as vibration, temperature, or humidity, could enhance the model’s performance in detecting potential safety hazards. Third, developing a user-friendly interface for the proposed model would make it more accessible and practical for construction managers and workers to adopt and use in their daily operations. Finally, conducting case studies to validate the model’s effectiveness in real-world construction scenarios and identifying potential areas for improvement would provide valuable insights for refining the model. By addressing these areas, researchers can enhance the model’s effectiveness and value for the construction industry, ultimately leading to improved safety and efficiency on construction sites.

6. Conclusions

In the study presented here, the researchers delved into the crucial aspect of concrete pouring by collecting and analyzing not only normal concrete pouring sound data but also various working sound data that can lead to structural quality degradation and accidents during the actual concrete pouring process. The primary objective was to develop a classification model capable of accurately identifying the current status of concrete pouring work, thereby enhancing safety and efficiency at construction sites.
By processing the sound data collected from real-world construction sites and applying CNN and RNN deep-learning algorithms to construct a classification model, the researchers made strides in comparing and analyzing the accuracy, strengths, and weaknesses of each method. The findings reveal that the balance of data quantity in each class is a key factor influencing the accuracy of the classification model. Both CNN and RNN algorithms exhibited exceptional performance, with classification accuracies of 94.38% and 93.26% respectively, demonstrating their potential for enhancing real-time monitoring and safety at construction sites.
The research holds significant implications in the identification and prevention of problematic working conditions by capturing and analyzing sound data related to structural degradation and accidents. The developed classification model showcases the potential for real-time monitoring of major construction work types and providing immediate notifications when abnormal signs are detected, thereby increasing safety and minimizing risks associated with construction activities.
In order to further improve the classification model and unlock its full potential, the following future research directions and practical applications are proposed:
  • Develop a web-server-based sound source determination and location prediction system to enable real-time monitoring of construction sites and provide immediate notifications when abnormal signs are detected.
  • Maximize the utilization of the proposed classification model by developing wireless devices that leverage edge computing technology, thus ensuring efficient and seamless data processing and communication.
  • Integrate various IoT device sensors with sound data to develop an algorithm that can accurately detect a wide range of site statuses, paving the way for a more comprehensive and smart safety monitoring system.
  • Expand the classification model to encompass other construction activities and industries, allowing for broader applications and a more profound impact on safety monitoring across various sectors.
By incorporating these suggestions and further refining the classification model, the researchers believe their research can serve as a foundation for the development of advanced safety monitoring systems that can significantly contribute to the construction industry and beyond, ultimately elevating the overall quality and safety standards across diverse industries.

Author Contributions

Conceptualization, I.K. and S.C.; methodology, I.K. and S.C.; formal analysis, I.K., Y.K. and S.C.; investigation I.K., Y.K. and S.C.; data curation, I.K. and S.C.; writing original draft preparation, I.K. and S.C.; writing—review and editing, I.K. and S.C. All authors have read and agreed to the published version of the manuscript.

Funding

This work was financially supported by a National Research Foundation of Korea (NRF) grant funded by the Korean government (MSIT) (No. 2021R1A2C1013079).

Institutional Review Board Statement

Not applicable.

Informed Consent Statement

Not applicable.

Data Availability Statement

Some or all data, models, or code generated or used during the study are proprietary or confidential in nature and may only be provided with restrictions.

Acknowledgments

The authors are also very thankful for the anonymous referees and editors whose suggestions and comments helped to improve the manuscript’s quality.

Conflicts of Interest

The authors declare no conflict of interest.

References

  1. Haduong, A.; Kim, J.J.; Balali, V.; Assistant, G. Statistical Results on Incidents for Formwork Safety in Concrete Structures. In Proceedings of the Construction Research Congress 2018, New Orleans, LA, USA, 2–4 April 2018. [Google Scholar]
  2. Seo, J.; Han, S.; Lee, S.; Kim, H. Computer Vision Techniques for Construction Safety and Health Monitoring. Adv. Eng. Inform. 2015, 29, 239–251. [Google Scholar] [CrossRef]
  3. Lee, Y.J.; Park, M.W.; Brilakis, I. Entity Matching across Stereo Cameras for Tracking Construction Workers. In Proceedings of the ISARC 2016—33rd International Symposium on Automation and Robotics in Construction, Auburn, AL, USA, 18–21 July 2016; International Association for Automation and Robotics in Construction (I.A.A.R.C): Auburn, AL, USA; pp. 669–677. [Google Scholar]
  4. Shin, T.H.; Chin, S.; Yoon, S.W.; Kwon, S.W. A Service-Oriented Integrated Information Framework for RFID/WSN-Based Intelligent Construction Supply Chain Management. Autom. Constr. 2011, 20, 706–715. [Google Scholar] [CrossRef]
  5. Cho, C.; Lee, Y.-C.; Zhang, T.; Student, P.D. Sound Recognition Techniques for Multi-Layered Construction Activities and Events. In Proceedings of the Computing in Civil Engineering 2017, Seattle, WA, USA, 25–27 June 2017. [Google Scholar]
  6. Park, M.W.; Brilakis, I. Construction Worker Detection in Video Frames for Initializing Vision Trackers. Autom. Constr. 2012, 28, 15–25. [Google Scholar] [CrossRef]
  7. Fricker, S.; Vogel, T. Site Installation and Testing of a Continuous Acoustic Monitoring. Constr. Build. Mater. 2007, 21, 501–510. [Google Scholar] [CrossRef]
  8. Lee, Y.-C.; Scarpiniti, M.; Uncini, A. Advanced Sound Classifiers and Performance Analyses for Accurate Audio-Based Construction Project Monitoring. J. Comput. Civ. Eng. 2020, 34, 04020030. [Google Scholar] [CrossRef]
  9. Ogden, R.; Hawkins, S.; House, J.; Huckvale, M.; Local, J.; Carter, P.; Dankovičová, J.; Heid, S. ProSynth: An Integrated Prosodic Approach to Device-Independent, Natural-Sounding Speech Synthesis. Comput. Speech Lang. 2000, 14, 177–210. [Google Scholar] [CrossRef]
  10. Boyanov, B.; Hadjitodorov, S. Acoustic Analysis of Pathological Voices: A Voice Analysis System for the Screening and Laryngeal Diseases. IEEE Eng. Med. Biol. Mag. 1997, 16, 74–82. [Google Scholar] [CrossRef]
  11. Kavitha, S.; Sanjana, N.; Yogajeeva, K.; Sathyavathi, S. Speech Emotion Recognition Using Different Activation Function. In Proceedings of the 2021 International Conference on Advancements in Electrical, Electronics, Communication, Computing and Automation, ICAECA 2021, Coimbatore, India, 8–9 October 2021. [Google Scholar] [CrossRef]
  12. Foggia, P.; Petkov, N.; Saggese, A.; Strisciuglio, N.; Vento, M. Audio Surveillance of Roads: A System for Detecting Anomalous Sounds. IEEE Trans. Intell. Transp. Syst. 2016, 17, 279–288. [Google Scholar] [CrossRef]
  13. Ferrari, S.; Piccinini, R.; Silva, M.; Exadaktylos, V.; Berckmans, D.; Guarino, M. Cough Sound Description in Relation to Respiratory Diseases in Dairy Calves. Prev. Vet. Med. 2010, 96, 276–280. [Google Scholar] [CrossRef]
  14. Morrison, G.S. Forensic Voice Comparison and the Paradigm Shift. Sci. Justice 2009, 49, 298–308. [Google Scholar] [CrossRef]
  15. Mitsuyoshi, S.; Nakamura, M.; Omiya, Y.; Shinohara, S.; Hagiwara, N.; Tokuno, S. Mental Status Assessment of Disaster Relief Personnel by Vocal Affect Display Based on Voice Emotion Recognition. Disaster Mil. Med. 2017, 3, 1–9. [Google Scholar] [CrossRef] [Green Version]
  16. Kochlan, M.; Hodon, M.; Cechovic, L.; Kapitulik, J.; Jurecka, M. WSN for Traffic Monitoring Using Raspberry Pi Board. In Proceedings of the 2014 Federated Conference on Computer Science and Information Systems, FedCSIS 2014, Warsaw, Poland, 7–10 September 2014; Institute of Electrical and Electronics Engineers Inc.: Piscataway Township, NJ, USA, 2014; pp. 1023–1026. [Google Scholar]
  17. Rios-Cabrera, R.; Tuytelaars, T.; van Gool, L. Efficient Multi-Camera Vehicle Detection, Tracking, and Identification in a Tunnel Surveillance Application. Comput. Vis. Image Underst. 2012, 116, 742–753. [Google Scholar] [CrossRef]
  18. Lee, K.B.; Shin, H.S. An Application of a Deep Learning Algorithm for Automatic Detection of Unexpected Accidents under Bad CCTV Monitoring Conditions in Tunnels. In Proceedings of the 2019 International Conference on Deep Learning and Machine Learning in Emerging Applications, Deep-ML 2019, Istanbul, Turkey, 26–28 August 2019; Institute of Electrical and Electronics Engineers Inc.: Piscataway Township, NJ, USA, 2019; pp. 7–11. [Google Scholar]
  19. Giri, P.; Ng, K.; Phillips, W. Wireless Sensor Network System for Landslide Monitoring and Warning. IEEE Trans. Instrum. Meas. 2019, 68, 1210–1220. [Google Scholar] [CrossRef]
  20. Cheng, C.F.; Rashidi, A.; Davenport, M.A.; Anderson, D. Audio Signal Processing for Activity Recognition of Construction Heavy Equipment. In Proceedings of the ISARC 2016—33rd International Symposium on Automation and Robotics in Construction, Auburn, AL, USA, 18–21 July 2016; International Association for Automation and Robotics in Construction (I.A.A.R.C): Auburn, AL, USA; pp. 642–650. [Google Scholar]
  21. Lee, H.-S.; Asce, M.; Lee, K.-P.; Park, M.; Baek, Y.; Lee, S.; Asce, A.M. RFID-Based Real-Time Locating System for Construction Safety Management. J. Comput. Civ. Eng. 2012, 26, 366–377. [Google Scholar] [CrossRef]
  22. Jin, H.; Zhang, L.; Liang, W.; Ding, Q. Integrated Leakage Detection and Localization Model for Gas Pipelines Based on the Acoustic Wave Method. J. Loss Prev. Process. Ind. 2014, 27, 74–88. [Google Scholar] [CrossRef]
  23. Liu, J.; Luo, H.; Liu, H. Deep Learning-Based Data Analytics for Safety in Construction. Autom. Constr. 2022, 140, 104302. [Google Scholar] [CrossRef]
  24. Rafiei, M.H.; Adeli, H. Novel Machine-Learning Model for Estimating Construction Costs Considering Economic Variables and Indexes. J. Constr. Eng. Manag. 2018, 144, 04018106. [Google Scholar] [CrossRef]
  25. Najafabadi, M.M.; Villanustre, F.; Khoshgoftaar, T.M.; Seliya, N.; Wald, R.; Muharemagic, E. Deep Learning Applications and Challenges in Big Data Analytics. J. Big Data 2015, 2, 1–21. [Google Scholar] [CrossRef] [Green Version]
  26. Jang, Y.; Jeong, I.; Cho, Y.K. Identifying Impact of Variables in Deep Learning Models on Bankruptcy Prediction of Construction Contractors. Eng. Constr. Archit. Manag. 2021, 28, 3282–3298. [Google Scholar] [CrossRef]
  27. Quaranta, G.; De Domenico, D.; Monti, G. Machine-Learning-Aided Improvement of Mechanics-Based Code-Conforming Shear Capacity Equation for RC Elements with Stirrups. Eng. Struct. 2022, 267, 114665. [Google Scholar] [CrossRef]
  28. Li, Z.; Yoon, J.; Zhang, R.; Rajabipour, F.; Srubar, W.V.; Dabo, I.; Radlińska, A. Machine Learning in Concrete Science: Applications, Challenges, and Best Practices. NPJ Comput. Mater. 2022, 8, 1–17. [Google Scholar] [CrossRef]
  29. Esmaeili, B.; Hallowell, M.R.; Rajagopalan, B. Attribute-Based Safety Risk Assessment. I: Analysis at the Fundamental Level. J. Constr. Eng. Manag. 2015, 141, 04015021. [Google Scholar] [CrossRef]
  30. Tixier, A.J.P.; Hallowell, M.R.; Rajagopalan, B.; Bowman, D. Application of Machine Learning to Construction Injury Prediction. Autom. Constr. 2016, 69, 102–114. [Google Scholar] [CrossRef] [Green Version]
  31. Cheng, M.Y.; Hoang, N.D.; Roy, A.F.V.; Wu, Y.W. A Novel Time-Depended Evolutionary Fuzzy SVM Inference Model for Estimating Construction Project at Completion. Eng. Appl. Artif. Intell. 2012, 25, 744–752. [Google Scholar] [CrossRef]
  32. Cheng, M.Y.; Peng, H.S.; Wu, Y.W.; Chen, T.L. Estimate at Completion for Construction Projects Using Evolutionary Support Vector Machine Inference Model. Autom. Constr. 2010, 19, 619–629. [Google Scholar] [CrossRef]
  33. Lam, K.C.; Yu, C.Y. A Multiple Kernel Learning-Based Decision Support Model for Contractor Pre-Qualification. Autom. Constr. 2011, 20, 531–536. [Google Scholar] [CrossRef]
  34. Li, L.; Wang, J.; Leung, H.; Jiang, C. Assessment of Catastrophic Risk Using Bayesian Network Constructed from Domain Knowledge and Spatial Data. Risk Anal. 2010, 30, 1157–1175. [Google Scholar] [CrossRef]
  35. Wang, X.; Zhao, J.; Li, Q.; Fang, N.; Wang, P.; Ding, L.; Li, S. A Hybrid Model for Prediction in Asphalt Pavement Performance Based on Support Vector Machine and Grey Relation Analysis. J. Adv. Transp. 2020, 2020, 7534970. [Google Scholar] [CrossRef]
  36. Naganathan, H.; Chong, W.O.; Chen, X. Building Energy Modeling (BEM) Using Clustering Algorithms and Semi-Supervised Machine Learning Approaches. Autom. Constr. 2016, 72, 187–194. [Google Scholar] [CrossRef]
  37. Ahmad, M.W.; Mourshed, M.; Rezgui, Y. Trees vs Neurons: Comparison between Random Forest and ANN for High-Resolution Prediction of Building Energy Consumption. Energy Build. 2017, 147, 77–89. [Google Scholar] [CrossRef]
  38. Hitimana, E.; Bajpai, G.; Musabe, R.; Sibomana, L.; Kayalvizhi, J. Implementation of Iot Framework with Data Analysis Using Deep Learning Methods for Occupancy Prediction in a Building. Future Internet 2021, 13, 67. [Google Scholar] [CrossRef]
  39. Yang, J.; Arif, O.; Vela, P.A.; Teizer, J.; Shi, Z. Tracking Multiple Workers on Construction Sites Using Video Cameras. Adv. Eng. Inform. 2010, 24, 428–434. [Google Scholar] [CrossRef]
  40. Chun, P.J.; Izumi, S.; Yamane, T. Automatic Detection Method of Cracks from Concrete Surface Imagery Using Two-Step Light Gradient Boosting Machine. Comput.-Aided Civ. Infrastruct. Eng. 2021, 36, 61–72. [Google Scholar] [CrossRef]
  41. Rachmawati, T.S.N.; Kim, S. Unmanned Aerial Vehicles (UAV) Integration with Digital Technologies toward Construction 4.0: A Systematic Literature Review. Sustainability 2022, 14, 5708. [Google Scholar] [CrossRef]
  42. Johnson, D.S.; Lorenz, W.; Taenzer, M.; Mimilakis, S.; Grollmisch, S.; Abeßer, J.; Lukashevich, H. DESED-FL and URBAN-FL: Federated Learning Datasets for Sound Event Detection. In Proceedings of the European Signal Processing Conference, EUSIPCO, Dublin, Ireland, 23–27 August 2021; pp. 556–560. [Google Scholar]
  43. Muda, L.; Begam, M.; Elamvazuthi, I. Voice Recognition Algorithms Using Mel Frequency Cepstral Coefficient (MFCC) and Dynamic Time Warping (DTW) Techniques. arXiv 2010, arXiv:1003.4083. [Google Scholar]
  44. Singh, P.P.; Rani, P. An Approach to Extract Feature Using MFCC. IOSR J. Eng. 2014, 4, 21–25. [Google Scholar] [CrossRef]
  45. Kattenborn, T.; Leitloff, J.; Schiefer, F.; Hinz, S. Review on Convolutional Neural Networks (CNN) in Vegetation Remote Sensing. ISPRS J. Photogramm. Remote Sens. 2021, 173, 24–49. [Google Scholar] [CrossRef]
  46. Pascanu, R.; Gulcehre, C.; Cho, K.; Bengio, Y. How to Construct Deep Recurrent Neural Networks. arXiv 2013, arXiv:1312.6026. [Google Scholar]
Figure 1. Research process.
Applsci 13 04789 g001
Figure 2. Construction site sound data collection.
Applsci 13 04789 g002
Figure 3. Experiments for formwork impact sound data collection.
Applsci 13 04789 g003
Figure 4. MFCC block diagram.
Applsci 13 04789 g004
Figure 5. Concrete pouring sound data at a construction site: sound waveform.
Applsci 13 04789 g005
Figure 6. Concrete pouring sound data at a construction site: sound spectrum.
Applsci 13 04789 g006
Figure 7. Concrete pouring sound data at a construction site: mel power spectrogram.
Applsci 13 04789 g007
Figure 8. Convolution neural network (CNN).
Applsci 13 04789 g008
Figure 9. Image of sound data pre-processed for CNN model training.
Applsci 13 04789 g009
Figure 10. Recurrent neural networks (RNNs).
Applsci 13 04789 g010
Figure 11. Image of sound data at a construction site pre-processed for RNN model training.
Applsci 13 04789 g011
Figure 12. Data ratio by class.
Applsci 13 04789 g012
Figure 13. CNN classification model result.
Applsci 13 04789 g013
Figure 14. Utilization of the proposed model at construction sites.
Applsci 13 04789 g014
Figure 15. System process.
Applsci 13 04789 g015
Table 1. Data ratio by class.
Sound TypePrecisionRecall
Concrete pouring96%97%
Formwork impact sound96%90%
Car horn95%96%
Siren96%96%
Jackhammer94%92%
Hammer93%96%
Drilling91%95%
Excavator95%93%
Disclaimer/Publisher’s Note: The statements, opinions and data contained in all publications are solely those of the individual author(s) and contributor(s) and not of MDPI and/or the editor(s). MDPI and/or the editor(s) disclaim responsibility for any injury to people or property resulting from any ideas, methods, instructions or products referred to in the content.

