
Examination of the Effects of Different Frequencies on Rock Fracturing via Laboratory-Scale Variable Amplitude Fatigue Loading Experiments
 ,
,
Abstract
:1. Introduction
2. Materials and Methods
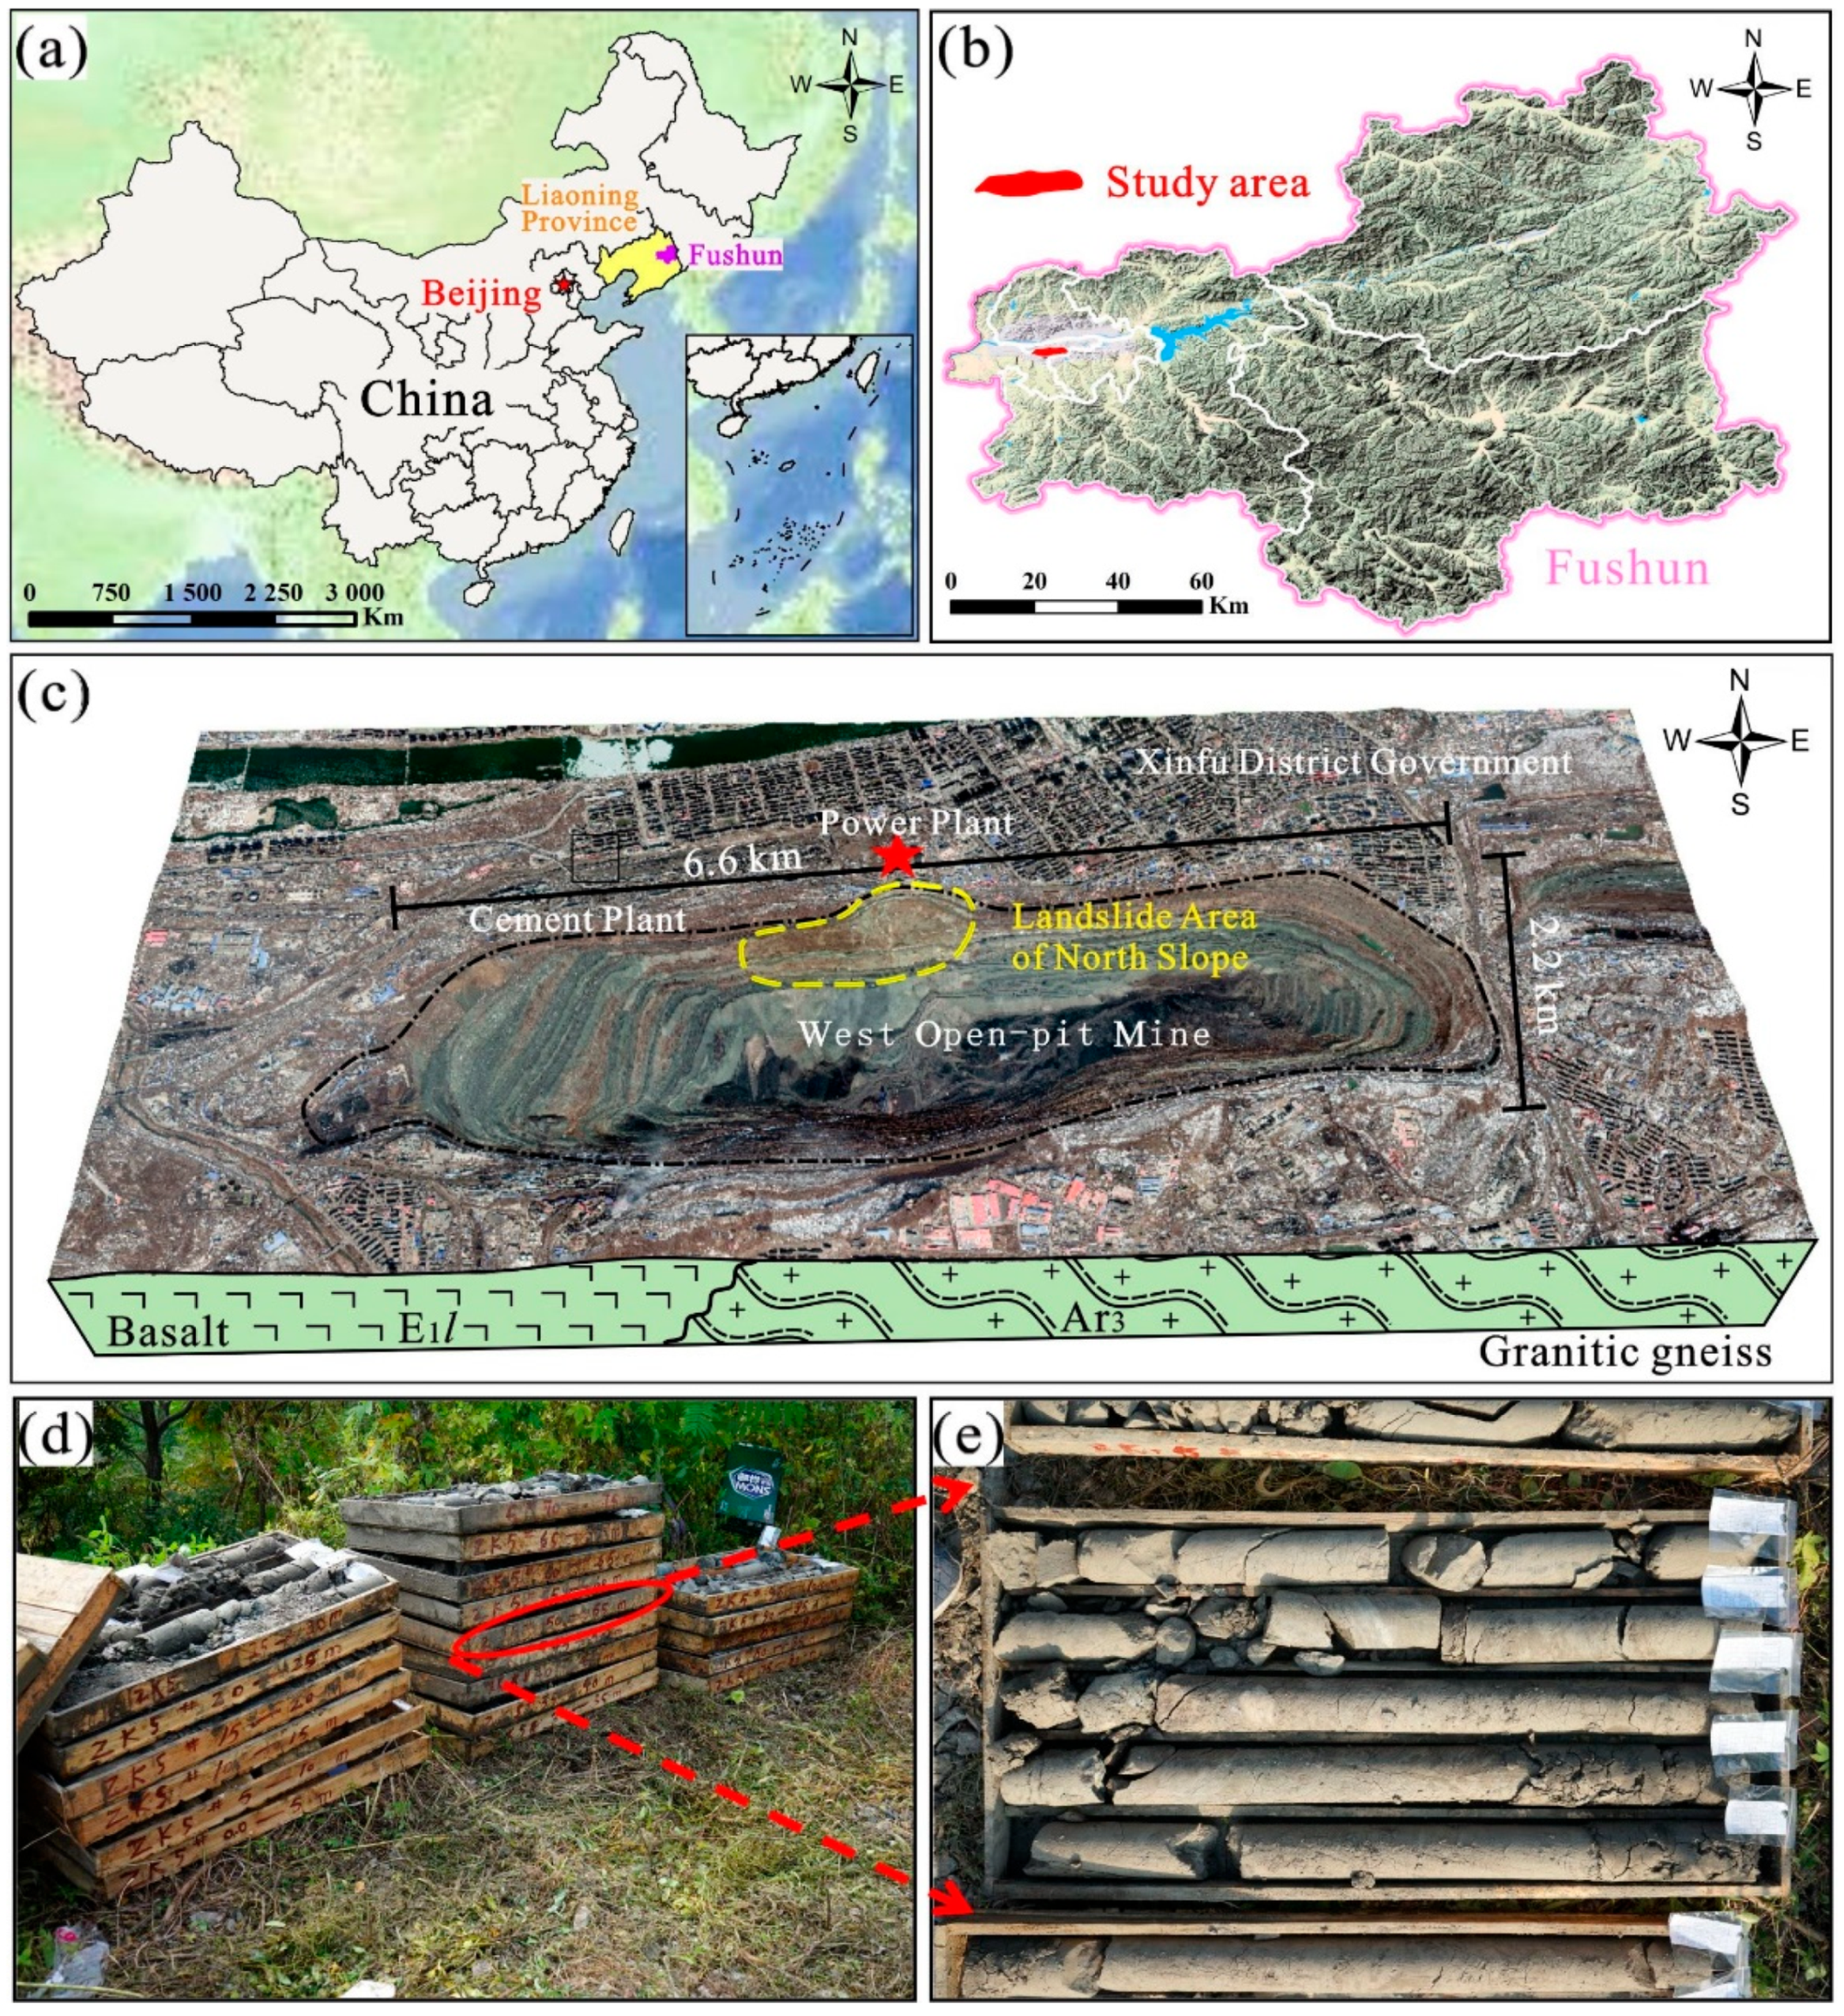
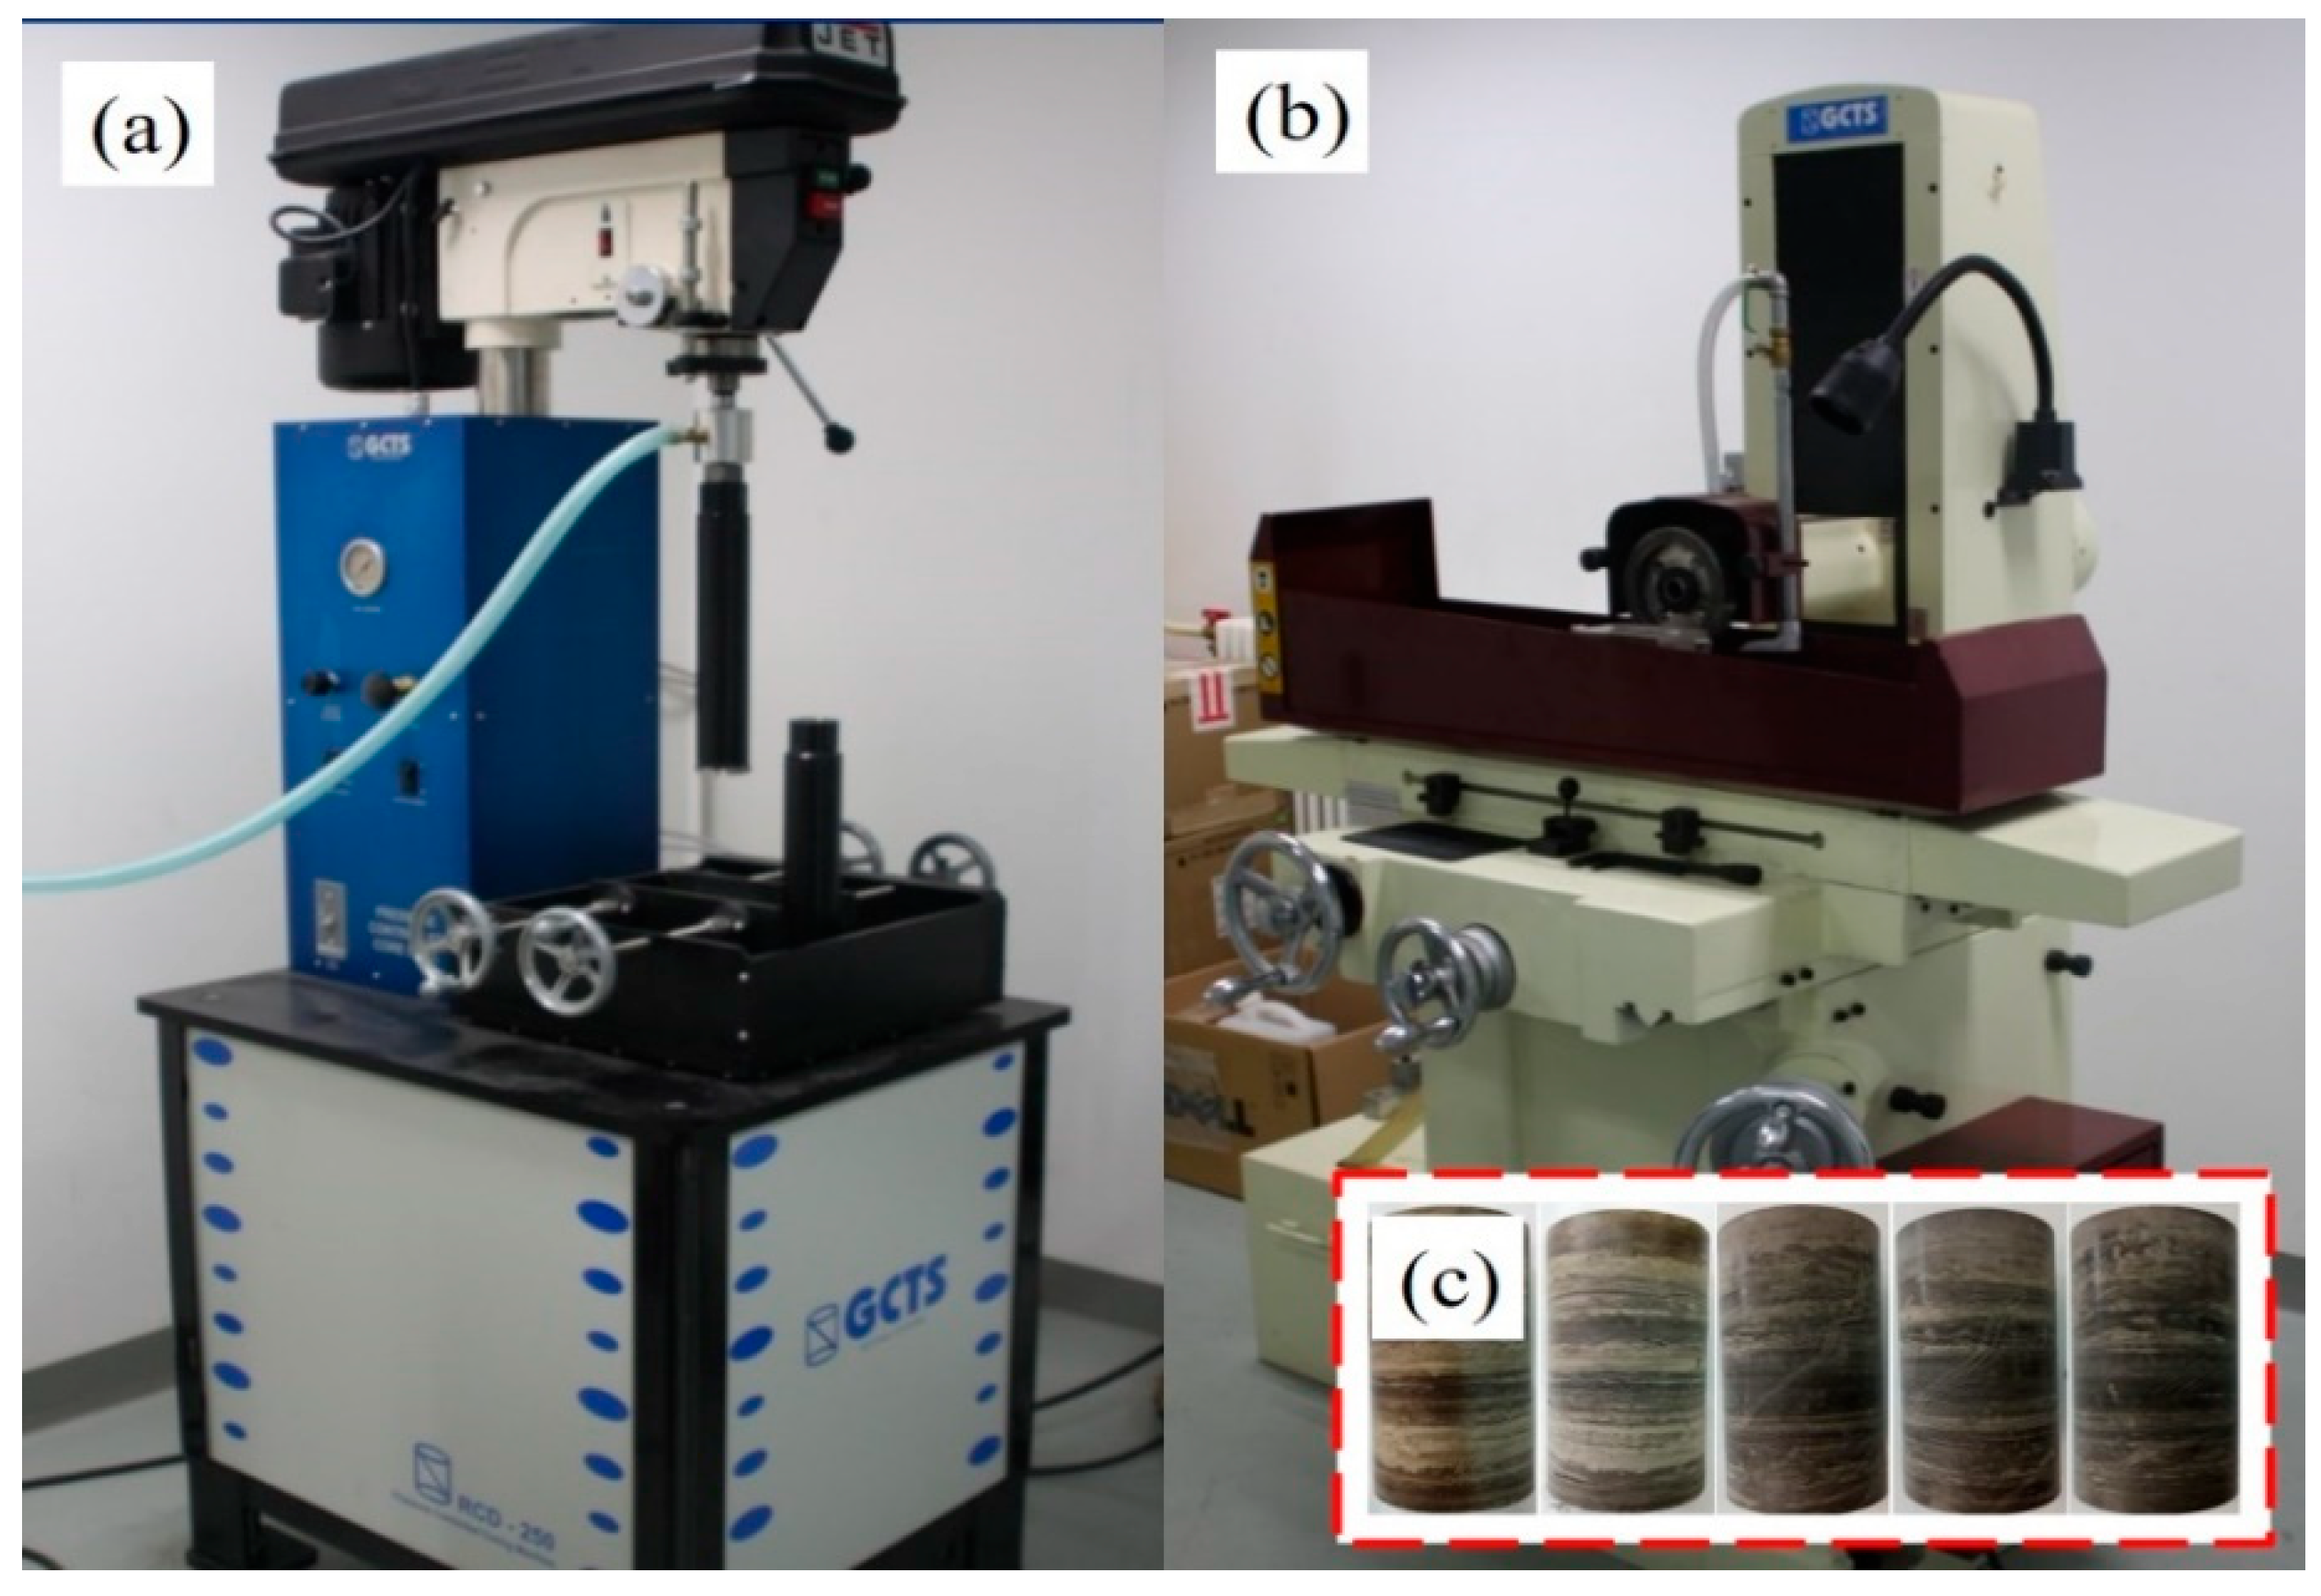
2.1. Rock Materials and Sample Preparation
2.2. Rock Sample Preparation
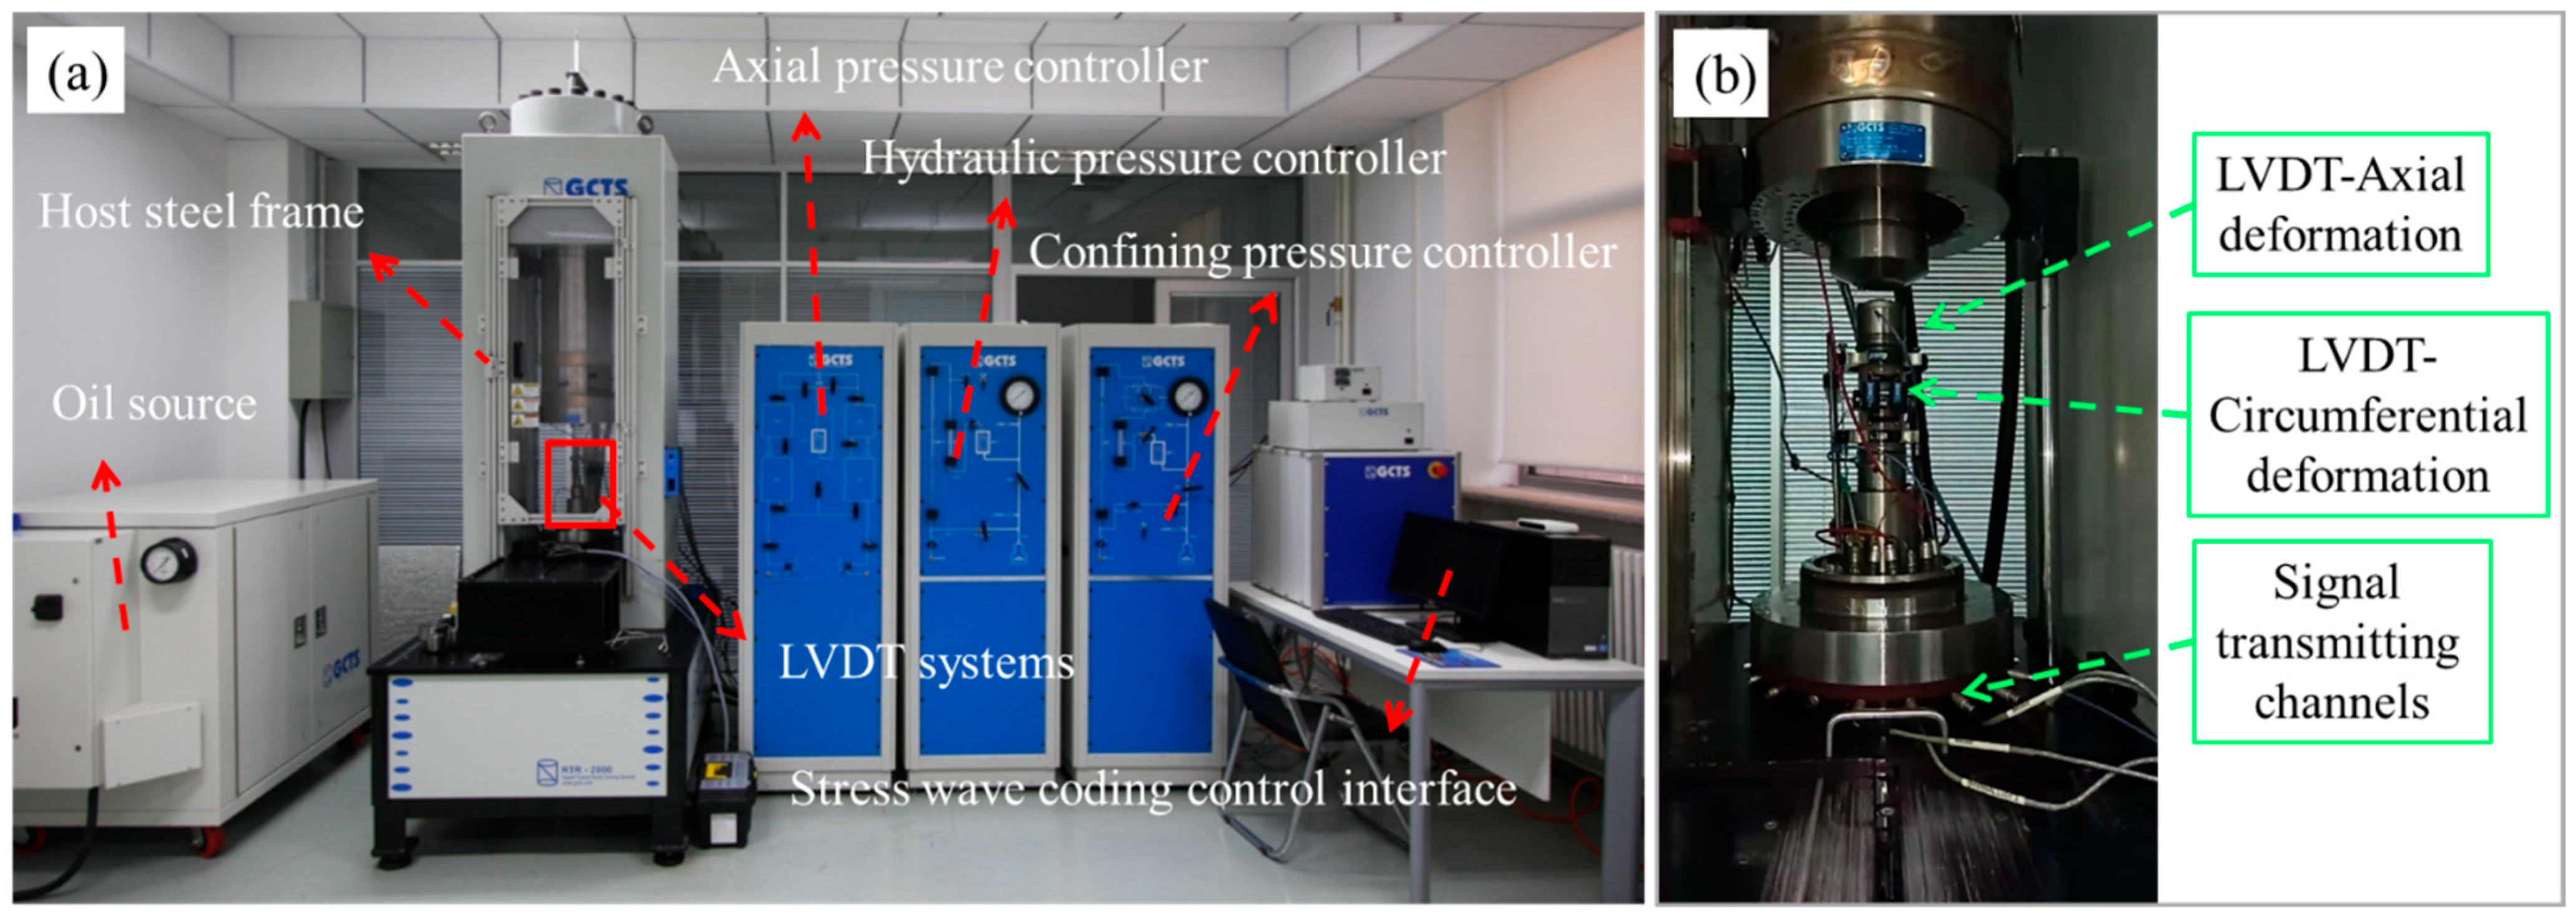
2.3. Testing System
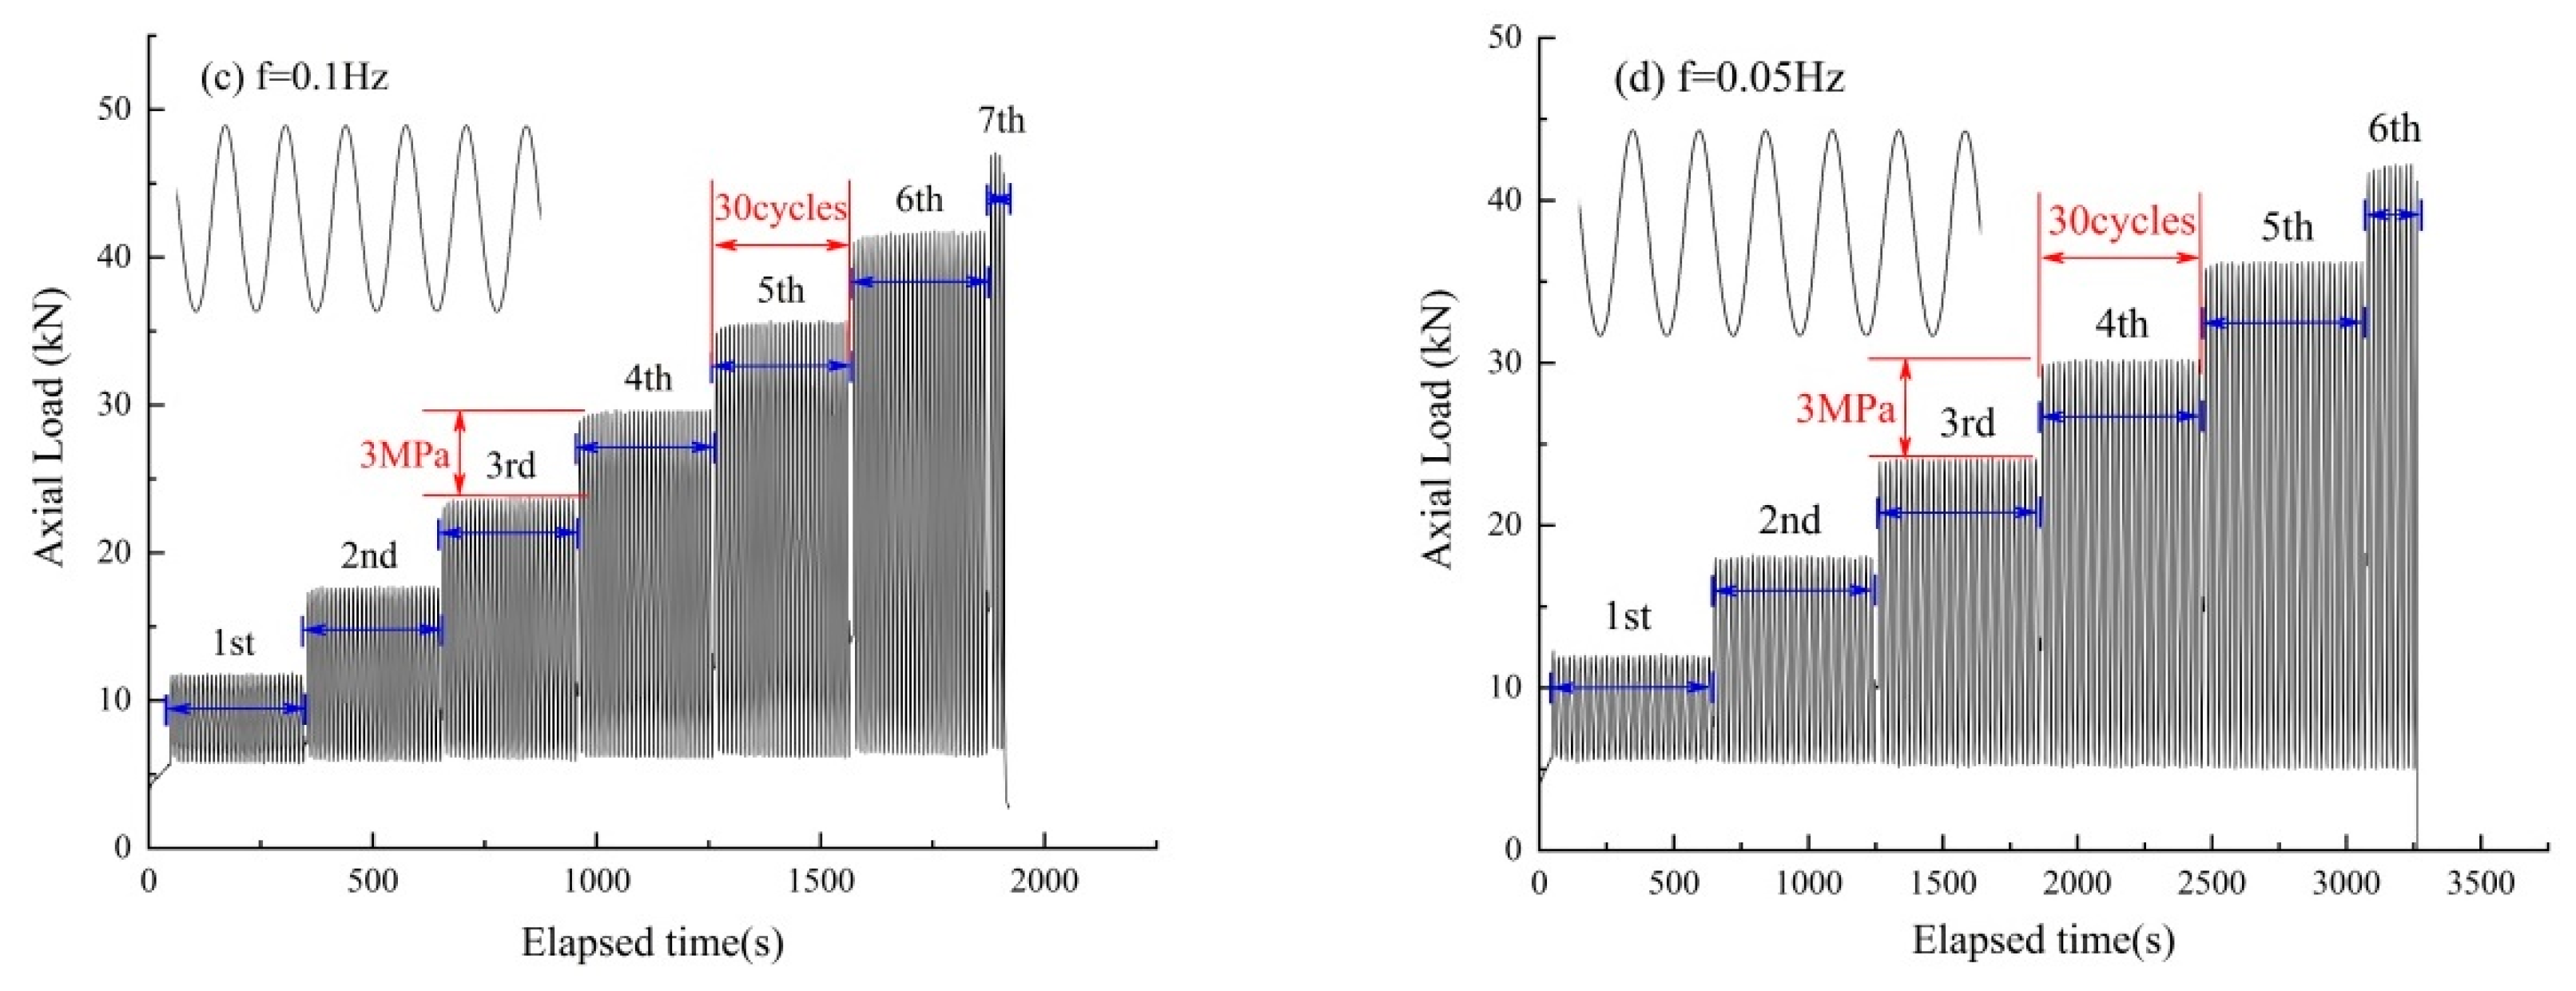
2.4. Testing Scheme
- (1)
- Conventional uniaxial static compression stage. A constant strain rate of 0.06 mm/min was applied to the argillaceous shale samples. The samples were loaded under a stress of 3 MPa at a constant strain rate.
- (2)
- Increasing-amplitude stress-cycling stage. According to the field data for the blast vibrations and vehicle loading, four different frequency values were applied to the samples: 0.04, 0.1, 0.5, and 1.0 Hz. During the loading process, the stress amplitude of each cyclic loading stage was increased by 3 MPa. For each loading stage, 30 stress cycles were applied to the argillaceous shale samples. The stress cycling was continued in this manner until each sample failed. Two groups of samples were tested, as listed in Table 1.
3. Experimental Results and Analyses
3.1. Rock Fatigue Life Analysis
3.2. Representative Stress–Strain Curves
3.3. Sample Deformation Characteristics
3.3.1. Relationship between Deformation and the Number of Cycles
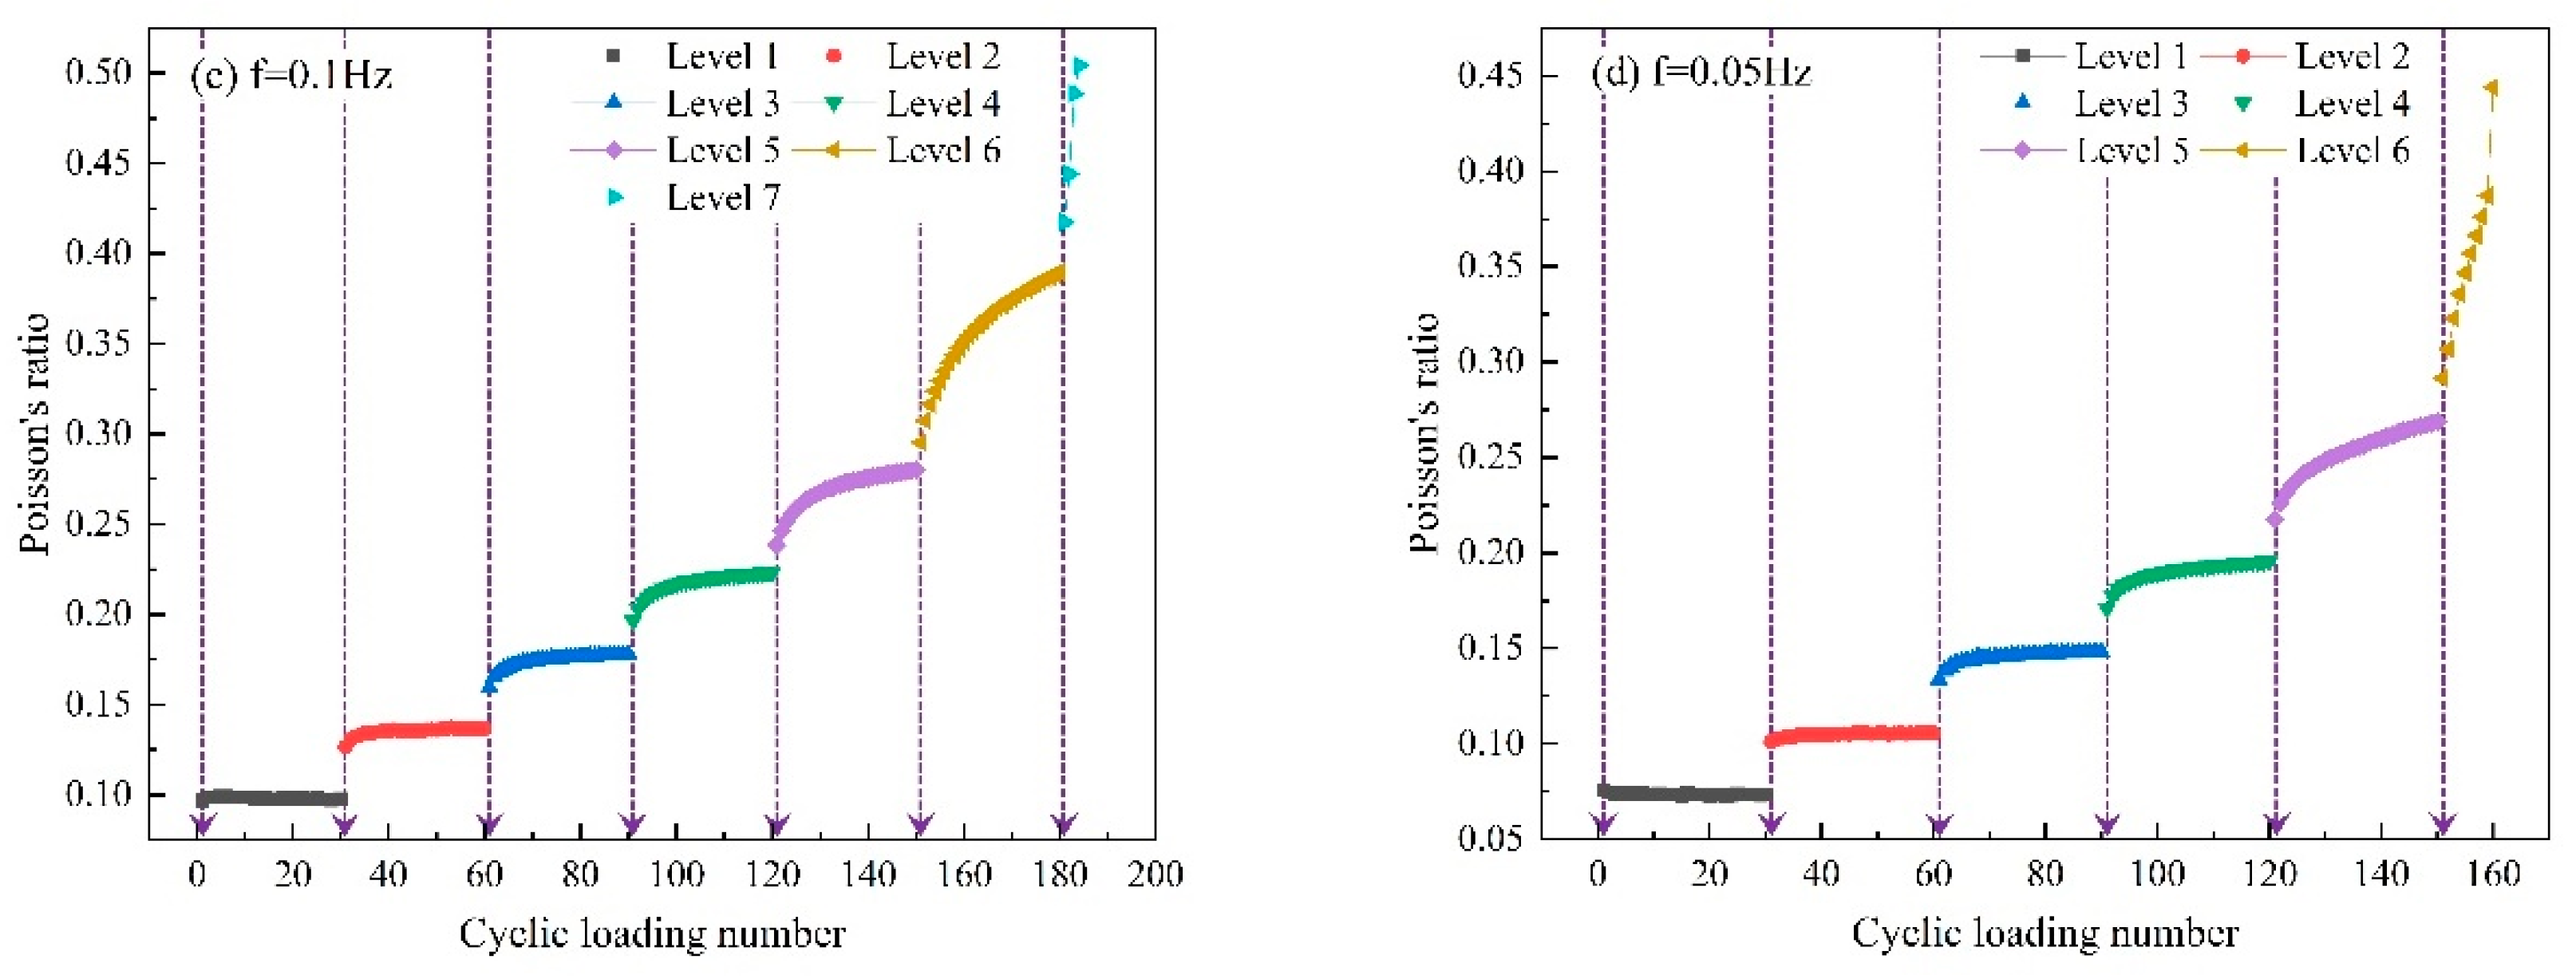
3.3.2. Relationship between the Deformation and Loading Stage
3.4. Analysis of Rock Fatigue Stiffness Degradation
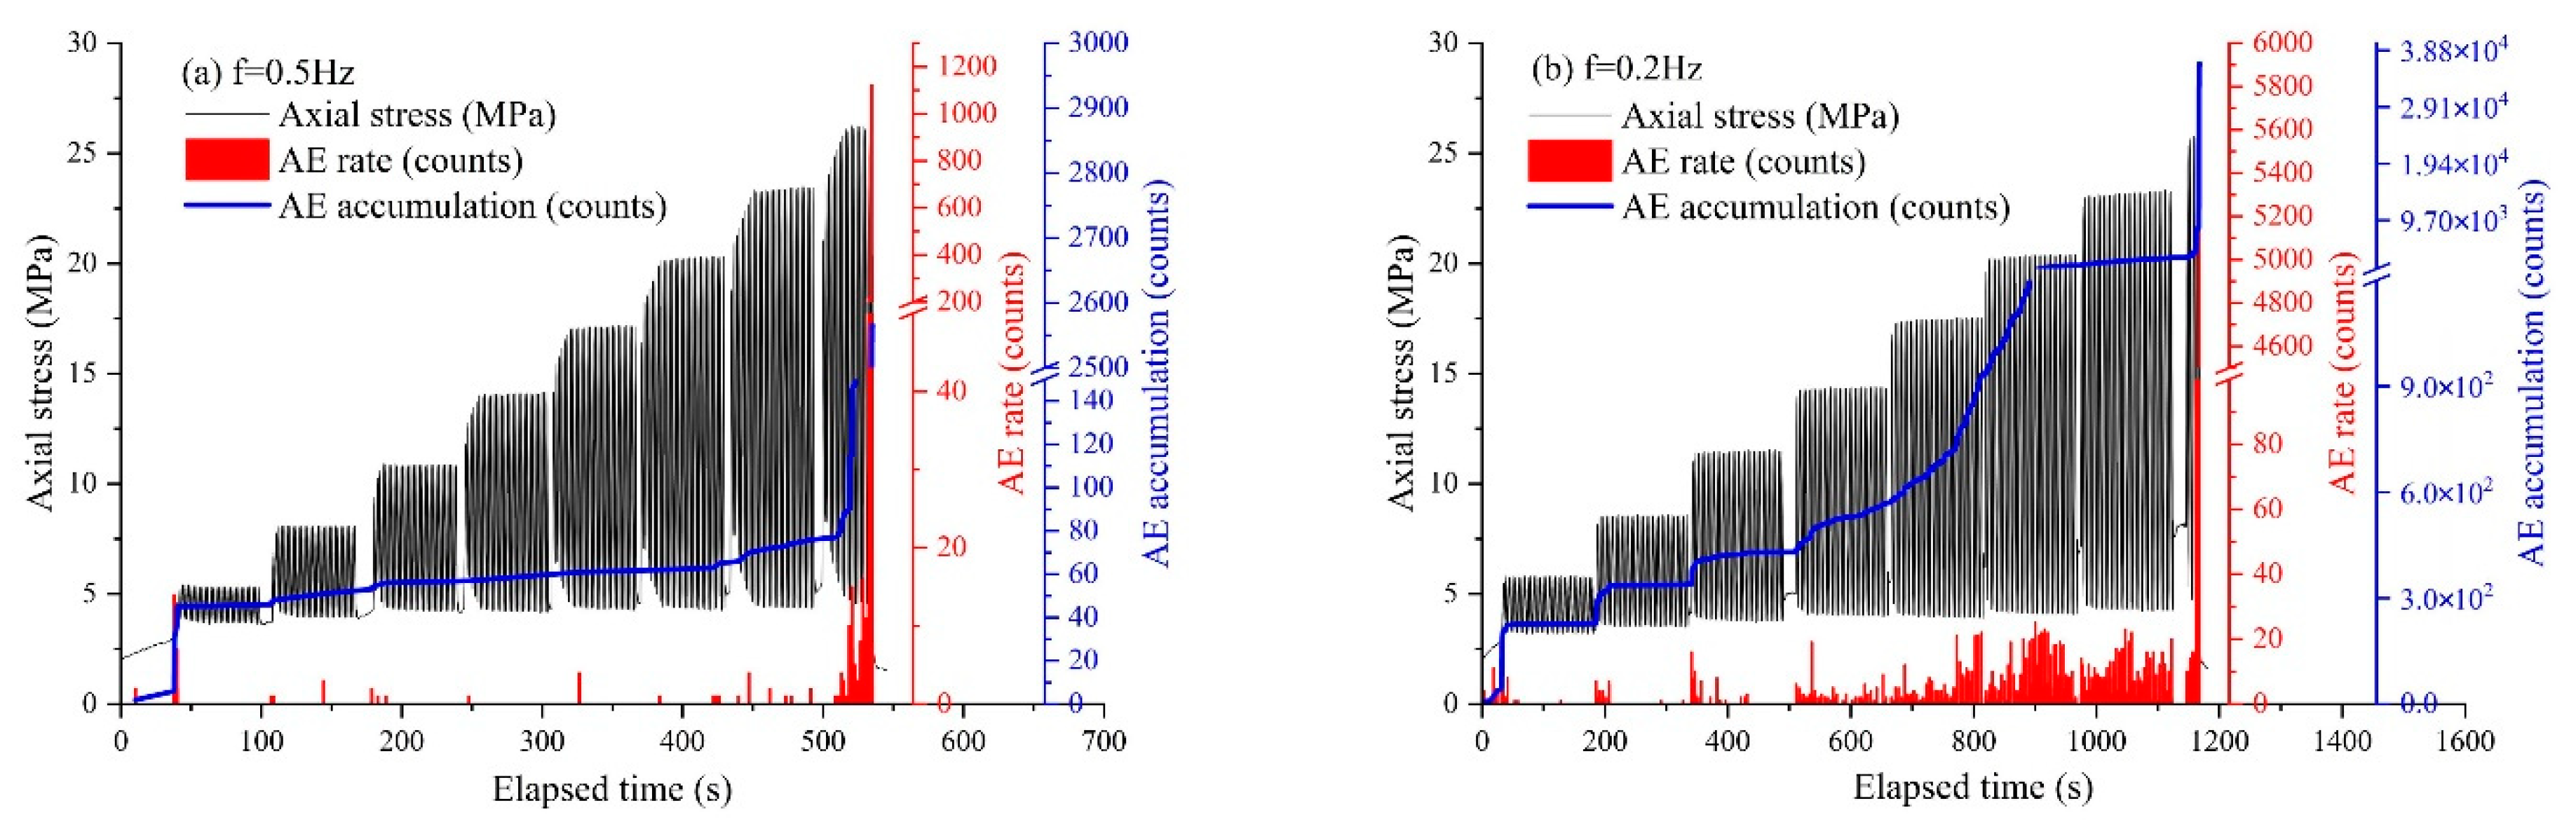
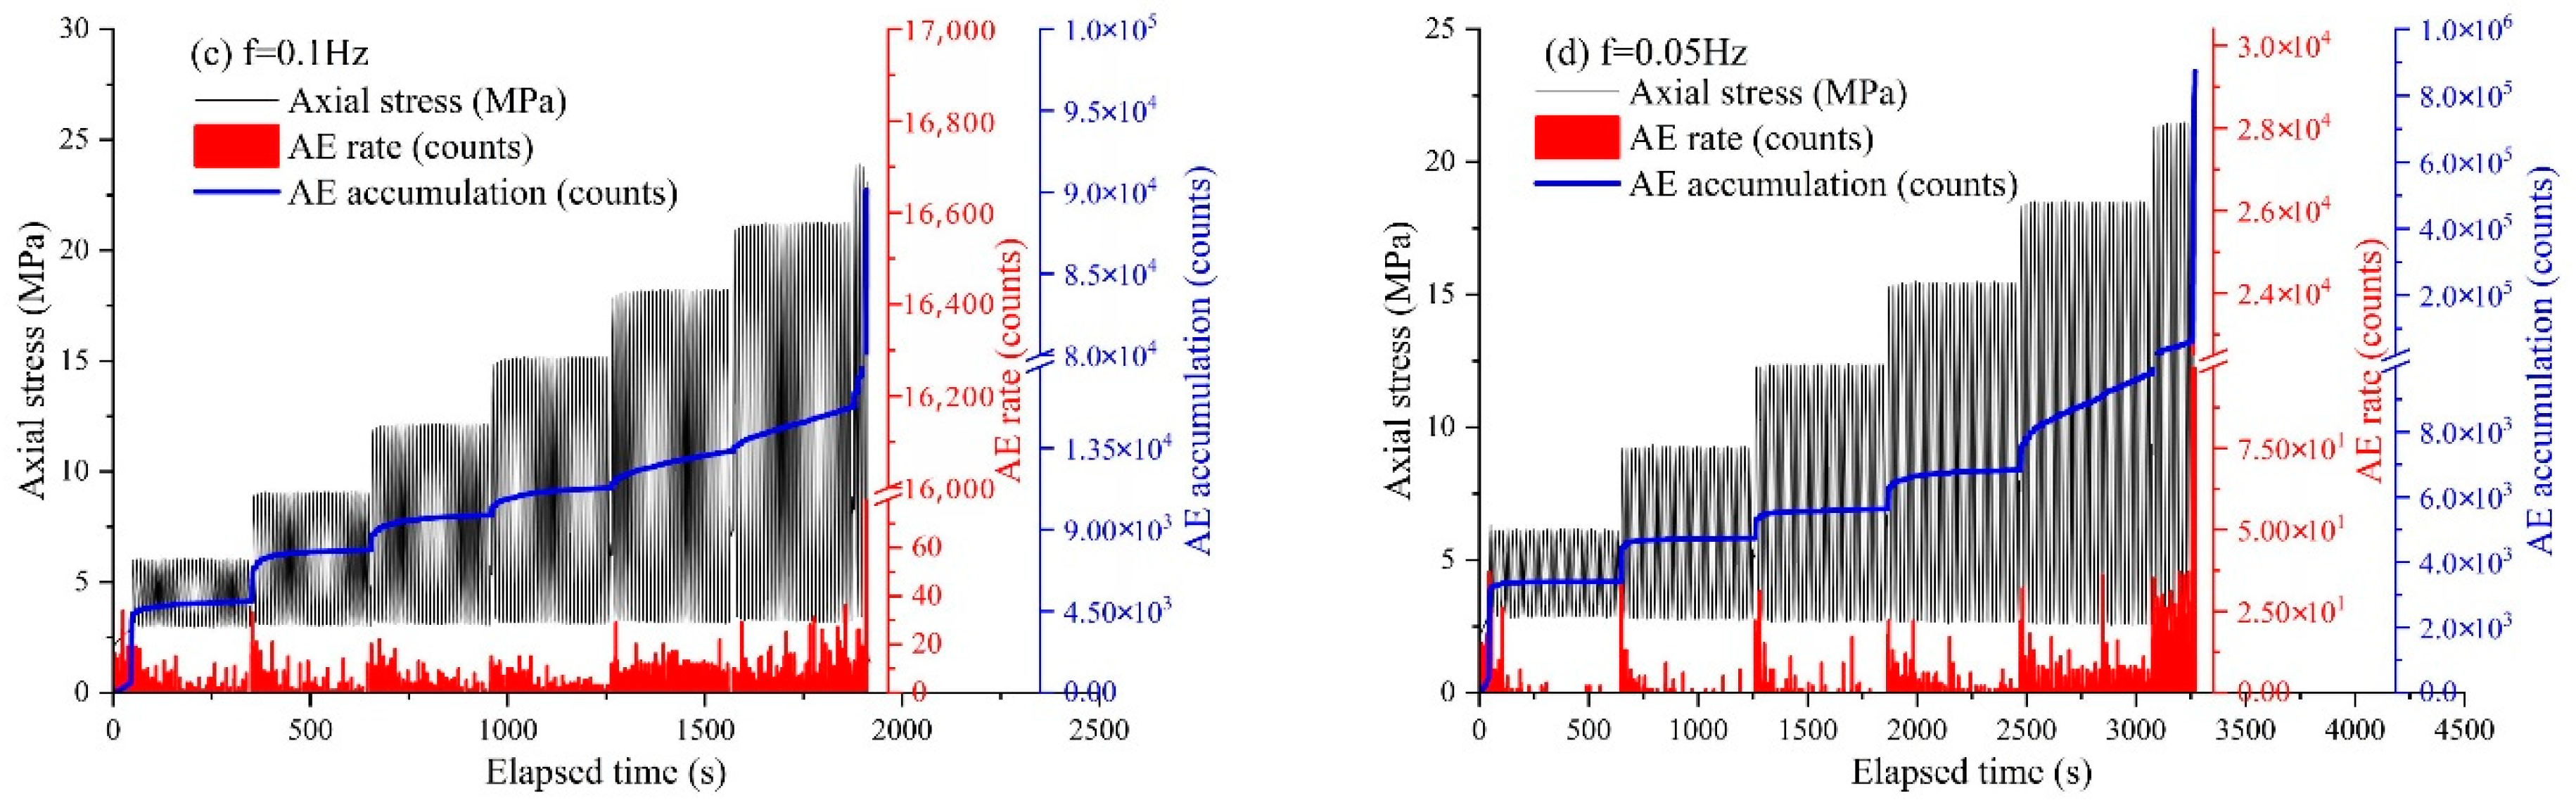
3.5. AE Count/Energy Characteristics
3.5.1. AE Count Characteristics during Sample Deformation
3.5.2. AE Energy Characteristics during Sample Deformation
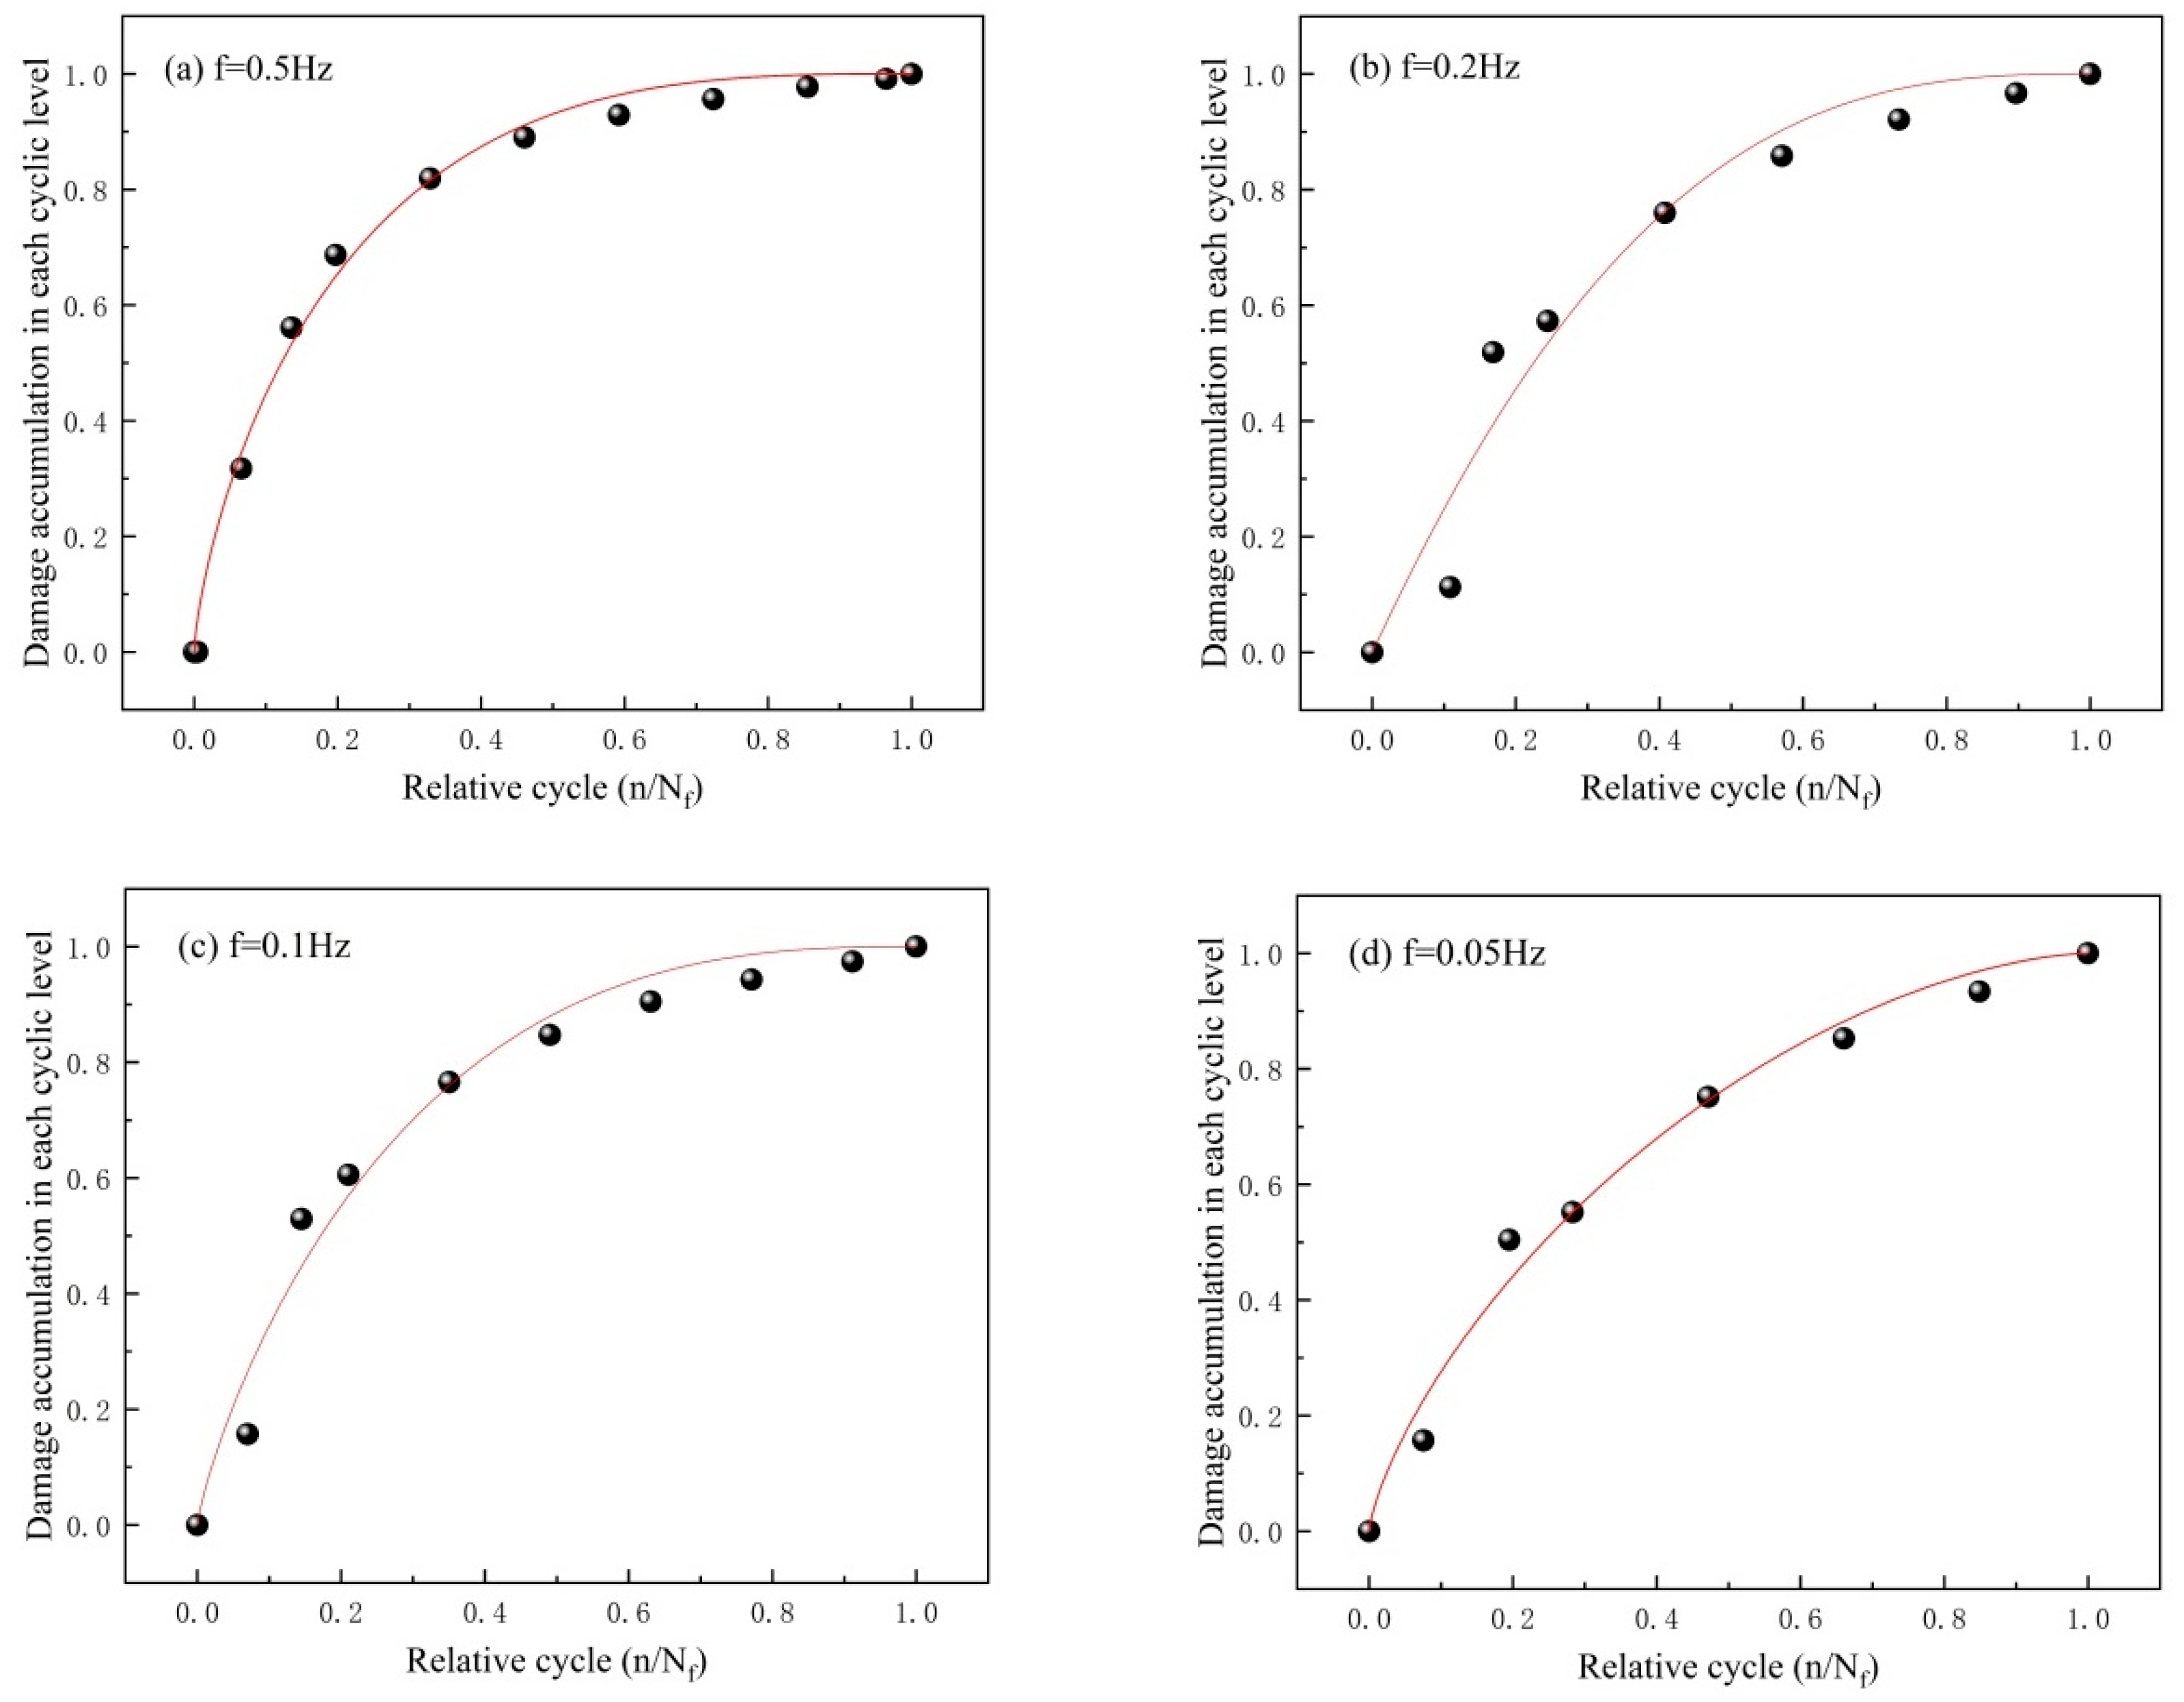
3.6. Analysis of Fatigue Damage Evolution
3.7. Evolution of Accumulative Fatigue Damage of the Argillaceous Shale Samples
4. Discussion
5. Conclusions
- (1)
- As the loading frequency increased, the number of loading cycles and the fatigue life gradually increased. The morphology of the hysteresis curve changed with the loading time. In addition, the hysteresis curve changed from sparse to dense at each fatigue loading stage before failure, while the final failure stage was sparse.
- (2)
- For a given loading frequency, the axial, radial, and volumetric strains showed different trends. The cumulative strains in the argillaceous shale at the different loading frequencies were also different. Overall, the higher the frequency, the higher the cumulative strain during the final deformation. The damage process was divided into three stages based on the results of the deformation characteristics of the fatigue test.
- (3)
- The AE count and AE energy exhibited during the rupture of the rock were affected by the loading frequency, and the accumulated damage of the rock that occurred when the stress amplitude suddenly increased was greater than that at the fatigue loading stage. The entire process of the accumulative AE energy corresponded well to the accumulative AE count.
- (4)
- The rock exhibited two stages of damage evolution under incremental variable amplitude fatigue loads: (1) rapid damage accumulation at the beginning of the loading and (2) relatively smooth damage evolution thereafter. The proposed cumulative fatigue damage model can fit the damage accumulated throughout the rock fracturing process.
Author Contributions
Funding
Institutional Review Board Statement
Informed Consent Statement
Data Availability Statement
Conflicts of Interest
Abbreviations
| AE | Acoustic emission |
| XRD | X-ray diffraction |
| SEM | Scanning electron microscopy |
| LVDT | Linear variable differential transformer |
| PAC | Physical Acoustics Corporation |
References
- Cerfontaine, B.; Collin, F. Cyclic and Fatigue Behaviour of Rock Materials: Review, Interpretation and Research Perspectives. Rock Mech. Rock Eng. 2018, 51, 391–414. [Google Scholar] [CrossRef]
- Attewell, P.B.; Farmer, I.W. Fatigue Behaviour of Rock. Int. J. Rock Mech. Min. Sci. 1973, 10, 1–9. [Google Scholar] [CrossRef]
- Wang, Y.; Gao, S.; Liu, D.; Li, C. Anisotropic Fatigue Behaviour of Interbedded Marble Subjected to Uniaxial Cyclic Compressive Loads. Fatigue Fract. Eng. Mater. Struct. 2020, 43, 1170–1183. [Google Scholar] [CrossRef]
- Kang, Y.; Chen, J.; Niu, C.; Luo, Y. Evolution Characteristics of Secant Modulus and Its Post Peak Damage in Three Axial Compression for Sandstone. J. Inner Mongolia Univ. Technol. 2018, 1, 35–42. [Google Scholar]
- Gordon, R.B.; Davis, L.A. Velocity and Attenuation of Seismic Waves in Imperfectly Elastic Rock. J. Geophys. Res. 1968, 73, 3917–3935. [Google Scholar] [CrossRef]
- Jiang, C.; Cai, W.; Zhuang, W.; Duan, M.; Chen, Y.; Yu, T. Research on Deformation Characteristics and Energy Evolution Mechanisms of Shale Under Constant Amplitude Cyclic Loading. Chin. J. Rock Mech. Eng. 2020, 39, 2416–2428. [Google Scholar]
- Yang, B.; Xue, L.; Wang, M.; Li, Y. Study on Damage-Fracture of Shale Based on the Energy Principle. J. Basic Sci. Eng. 2018, 26, 997–1004. [Google Scholar]
- Wang, J.; Zhang, Q.; Song, Z.; Liu, X.; Wang, X.; Zhang, Y. Microstructural Variations and Damage Evolvement of Salt Rock Under Cyclic Loading. Int. J. Rock Mech. Min. Sci. 2022, 152, 105078. [Google Scholar] [CrossRef]
- Xin, T.; Liang, B.; Wang, J.; Sun, W.; Sun, Y. Experimental Study on the Evolution Trend of the Pore Structure and the Permeability of Coal Under Cyclic Loading and Unloading. ACS Omega 2021, 6, 35830–35843. [Google Scholar] [CrossRef]
- Heap, M.J.; Faulkner, D.R. Quantifying the Evolution of Static Elastic Properties as Crystalline Rock Approaches Failure. Int. J. Rock Mech. Min. Sci. 2008, 45, 564–573. [Google Scholar] [CrossRef]
- Gao, D.; Sang, S.; Liu, S.; Geng, J.; Wang, T.; Sun, T. Investigation of the Energy Evolution of Tectonic Coal Under Triaxial Cyclic Loading with Different Loading Rates and the Underlying Mechanism. Energies 2021, 14, 8124. [Google Scholar] [CrossRef]
- Liu, X.; Chai, Z.; Liu, X.; Yang, Z. Study on Pore Fracture Propagation and Unloading Failure Characteristics of Siltite Under Cyclic Loads. J. China Coal Soc. 2022, 12, 1511. [Google Scholar] [CrossRef]
- Ghiasi, V.; Ghiasi, S.; Prasad, A. Evaluation of tunnels under squeezing rock condition. J. Eng. Des. Technol. 2012, 10, 168–179. [Google Scholar] [CrossRef]
- Bagde, M.N.; Petroš, V. Fatigue Properties of Intact Sandstone Samples Subjected to Dynamic Uniaxial Cyclical Loading. Int. J. Rock Mech. Min. Sci. 2005, 42, 237–250. [Google Scholar] [CrossRef]
- Miao, S.-J.; Wang, H.; Huang, Z.-J.; Liang, M.-C. Experimental Study on the Mechanical Properties of Argillaceous Quartz Siltstone Under Different Upper Limit Cyclic Loadings. J. Eng. Mech. 2021, 38, 75–85. [Google Scholar]
- Geranmayeh, V.R.; Thoeni, K.; Dyskin, A.V.; Sharifzadeh, M.; Sarmadivaleh, M. Fatigue damage response of typical crystalline and granular rocks to uniaxial cyclic compression. Int. J. Fatigue 2020, 138, 105667. [Google Scholar] [CrossRef]
- Wang, Z.; Li, S.; Qiao, L.; Zhao, J. Fatigue Behavior of Granite Shale Subjected to Cyclic Loading Under Triaxial Compression Condition. Rock Mech. Rock Eng. 2013, 46, 1603–1615. [Google Scholar] [CrossRef]
- Roberts, L.A.; Buchholz, S.A.; Mellegard, K.D.; Düsterloh, U. Cyclic Loading Effects on the Creep and Dilation of Salt Rock. Rock Mech. Rock Eng. 2015, 48, 2581–2590. [Google Scholar] [CrossRef]
- Mohanty, B.; Chung, S. Production Blasting and Slope Stability. In Proceedings of the International Symposium on Geotechnical Stability in Surface Mining, 1986; CANMET: Calgary, AB, Canada, 1986. [Google Scholar]
- Lupogo, K. Characterization of Blast Damage in Rock Slopes: An Integrated Field-Numerical Modeling Approach. Ph.D. Dissertation, Simon Fraser University, Burnaby, BC, Canada, 2017. [Google Scholar]
- Wu, J.; Zhang, C.; Meng, H.; Guo, H.; Wu, K.; Li, H. Temporal and Spatial Characteristics of Landslide Susceptibility in the West Open-Pit Mining Area, Fushun, China. Int. J. Geomech. 2021, 27, 409–417. [Google Scholar] [CrossRef]
- Hua, W. Study on Mechanical Properties and Damage Evolution Mechanism of Weakly Cemented Sandstone under Uniaxial Cyclic Loading and Unloading. Ph.D. Dissertation, Anhui Jianzhu University, Hefei, China, 2021. [Google Scholar]
- Zhang, F.; Yang, T.; Li, L.; Wang, Z.; Xiao, P. Cooperative monitoring and numerical investigation on the stability of the south slope of the Fushun west open-pit mine. Bull. Eng. Geol. Environ. 2019, 78, 2409–2429. [Google Scholar] [CrossRef]
- Cui, L.; Sheng, Q.; Zheng, J.; Xie, M.; Liu, Y. A Unified Deterioration Model for Elastic Modulus of Rocks with Coupling Influence of Plastic Shear Strain and Confining Stress. Rock Mech. Rock Eng. 2022, 55, 7409–7420. [Google Scholar] [CrossRef]
- Wang, Y.; Yi, Y.F.; Li, C.H.; Han, J.Q. Anisotropic Fracture and Energy Characteristics of a Tibet Marble Exposed to Multi-Level Constant-Amplitude (MLCA) Cyclic Loads: A Lab-Scale Testing. Eng. Fract. Mech. 2021, 244, 107550. [Google Scholar] [CrossRef]
- Zhu, Z.F.; Chen, G.Q.; Xiao, H.Y.; Liu, H.; Zhao, C. Study on Crack Propagation of Rock Bridge Based on Muti Parameters Analysis of Acoustic Emission. Chin. J. Rock Mech. Eng. 2018, 37, 909–918. [Google Scholar]
- Li, S.L.; Zhou, M.J.; Gao, Z.P.; Chen, D.X.; Zhang, J.L.; Hu, J.Y. Experimental Study on Acoustic Emission Characteristics Before the Peak Strength of Rocks Under Incrementally Cyclic Loading-Unloading Methods. Chin. J. Rock Mech. Eng. 2019, 38, 724–735. [Google Scholar]
- He, M.C.; Miao, J.L.; Feng, J.L. Rock Burst Process of Limestone and Its Acoustic Emission Characteristics Under True-Triaxial Unloading Conditions. Int. J. Rock Mech. Min. Sci. 2010, 47, 286–298. [Google Scholar] [CrossRef]
- Wang, Y.; Li, C.H.; Hu, Y.Z. Experimental Investigation on the Fracture Behaviour of Black Shale by Acoustic Emission Monitoring and CT Image Analysis During Uniaxial Compression. Geophys. J. Int. 2018, 213, 660–675. [Google Scholar] [CrossRef]
- Li, L.R.; Deng, J.H.; Zheng, L.; Liu, J.F. Dominant Frequency Characteristics of Acoustic Emissions in White Marble During Direct Tensile Tests. Rock Mech. Rock Eng. 2017, 50, 1337–1346. [Google Scholar] [CrossRef]
- Hong, G.; Lu, X. Characteristics of Acoustic Emission and Rock Fracture Precursors of Granite Under Conventional Triaxial Compression. Chin. J. Rock Mech. Eng. 2015, 34, 694–702. (In Chinese) [Google Scholar]
- Ge, X.R.; Jiang, Y.; Lu, Y.D. Testing Study on Fatigue Deformation Law of Rock Under Cyclic Loading. Chin. J. Rock Mech. Eng. 2003, 22, 1581–1585. [Google Scholar]
- Wang, C.; Hou, X.; Liao, Z.; Chen, Z.; Lu, Z. Experimental investigation of predicting coal failure using acoustic emission energy andload-unload response ratio theory. J. Appl. Geophys. 2019, 161, 76–83. [Google Scholar] [CrossRef]
- Wang, C.; Bao, T.; Lu, H.; Liu, L.; Lu, Z.; Li, W.; Yu, Q. Variation regulation of the acoustic emission energy parameter during the failure process of granite under uniaxial compression. Mater. Test. 2015, 57, 755–760. [Google Scholar] [CrossRef]
- Xiao, J.Q.; Ding, D.X.; Xu, G.; Jiang, F.L. Inverted S-shaped Model for Nonlinear Fatigue Damage of Rock. Int. J. Rock Mech. Min. Sci. 2009, 46, 643–648. [Google Scholar] [CrossRef]
- Mao, H.; Mahadevan, S. Fatigue Damage Modelling of Composite Materials. Compos. Struct. 2002, 58, 405–410. [Google Scholar] [CrossRef]


| Group | Sample ID | L × d (mm × mm) | Mass (g) | Peak Strength (MPa) | Loading Cycles | Loading Frequency (Hz) | Lower Limit Stress (MPa) | Loading and Unloading Conditions |
|---|---|---|---|---|---|---|---|---|
| I | UC-1 | 100.25 × 49.45 | 399.8 | 24.5 | / | / | / | Uniaxial, monotonous compression, 0.06 mm/min |
| UC-2 | 100.03 × 49.94 | 401.4 | 27.1 | / | / | / | ||
| II | UF-1 | 99.58 × 49.88 | 401.8 | 27.6 | 228 | 0.5 | 3 | Increasing-amplitude stress of 3 MPa, 30 cycles were performed for each fatigue loading stage |
| UF-2 | 100.01 × 49.61 | 402.5 | 27.1 | 219 | 0.5 | 3 | ||
| UF-3 | 99.66 × 49.77 | 399.9 | 26.1 | 214 | 0.2 | 3 | ||
| UF-4 | 100.05 × 49.95 | 402.3 | 25.8 | 211 | 0.2 | 3 | ||
| UF-5 | 99.73 × 49.98 | 398.5 | 24.1 | 184 | 0.1 | 3 | ||
| UF-6 | 100.72 × 49.82 | 400.3 | 23.5 | 175 | 0.1 | 3 | ||
| UF-7 | 100.02 × 50.01 | 397.1 | 21.3 | 159 | 0.05 | 3 | ||
| UF-8 | 100.08 × 49.91 | 401.2 | 22.1 | 146 | 0.05 | 3 |
| Loading Frequency (Hz) | R2 | ||
|---|---|---|---|
| A | B | ||
| 0.5 | 0.73574 | 2.90574 | 0.99319 |
| 0.2 | 1.01348 | 2.78921 | 0.95081 |
| 0.1 | 0.82709 | 2.61645 | 0.97423 |
| 0.05 | 0.74002 | 1.62622 | 0.98501 |
Disclaimer/Publisher’s Note: The statements, opinions and data contained in all publications are solely those of the individual author(s) and contributor(s) and not of MDPI and/or the editor(s). MDPI and/or the editor(s) disclaim responsibility for any injury to people or property resulting from any ideas, methods, instructions or products referred to in the content. |
© 2023 by the authors. Licensee MDPI, Basel, Switzerland. This article is an open access article distributed under the terms and conditions of the Creative Commons Attribution (CC BY) license (https://creativecommons.org/licenses/by/4.0/).
Share and Cite
Gao, S.; Meng, H.; Wu, Y.; Wang, X.; Wang, Y.; Wu, J.; Wang, P. Examination of the Effects of Different Frequencies on Rock Fracturing via Laboratory-Scale Variable Amplitude Fatigue Loading Experiments. Appl. Sci. 2023, 13, 4908. https://doi.org/10.3390/app13084908
Gao S, Meng H, Wu Y, Wang X, Wang Y, Wu J, Wang P. Examination of the Effects of Different Frequencies on Rock Fracturing via Laboratory-Scale Variable Amplitude Fatigue Loading Experiments. Applied Sciences. 2023; 13(8):4908. https://doi.org/10.3390/app13084908
Chicago/Turabian StyleGao, Shaohua, Huajun Meng, Yunfeng Wu, Xuebing Wang, Yu Wang, Jihuan Wu, and Peng Wang. 2023. "Examination of the Effects of Different Frequencies on Rock Fracturing via Laboratory-Scale Variable Amplitude Fatigue Loading Experiments" Applied Sciences 13, no. 8: 4908. https://doi.org/10.3390/app13084908