
An Optimization Model for the Maximized Profit of Housing Development Project: A Case Study of Bangkok and Perimeter, Thailand

Abstract
:1. Introduction
- To assess the profitability of the housing development project located in Bangkok and perimeter in Thailand.
- This model can be applied with construction management and resource allocation with the budget of project for the maximized profit of the project.
- This model can be applied to the other projects suitably for the large cities or densely populated cities which are similar to Bangkok and perimeter in Thailand.
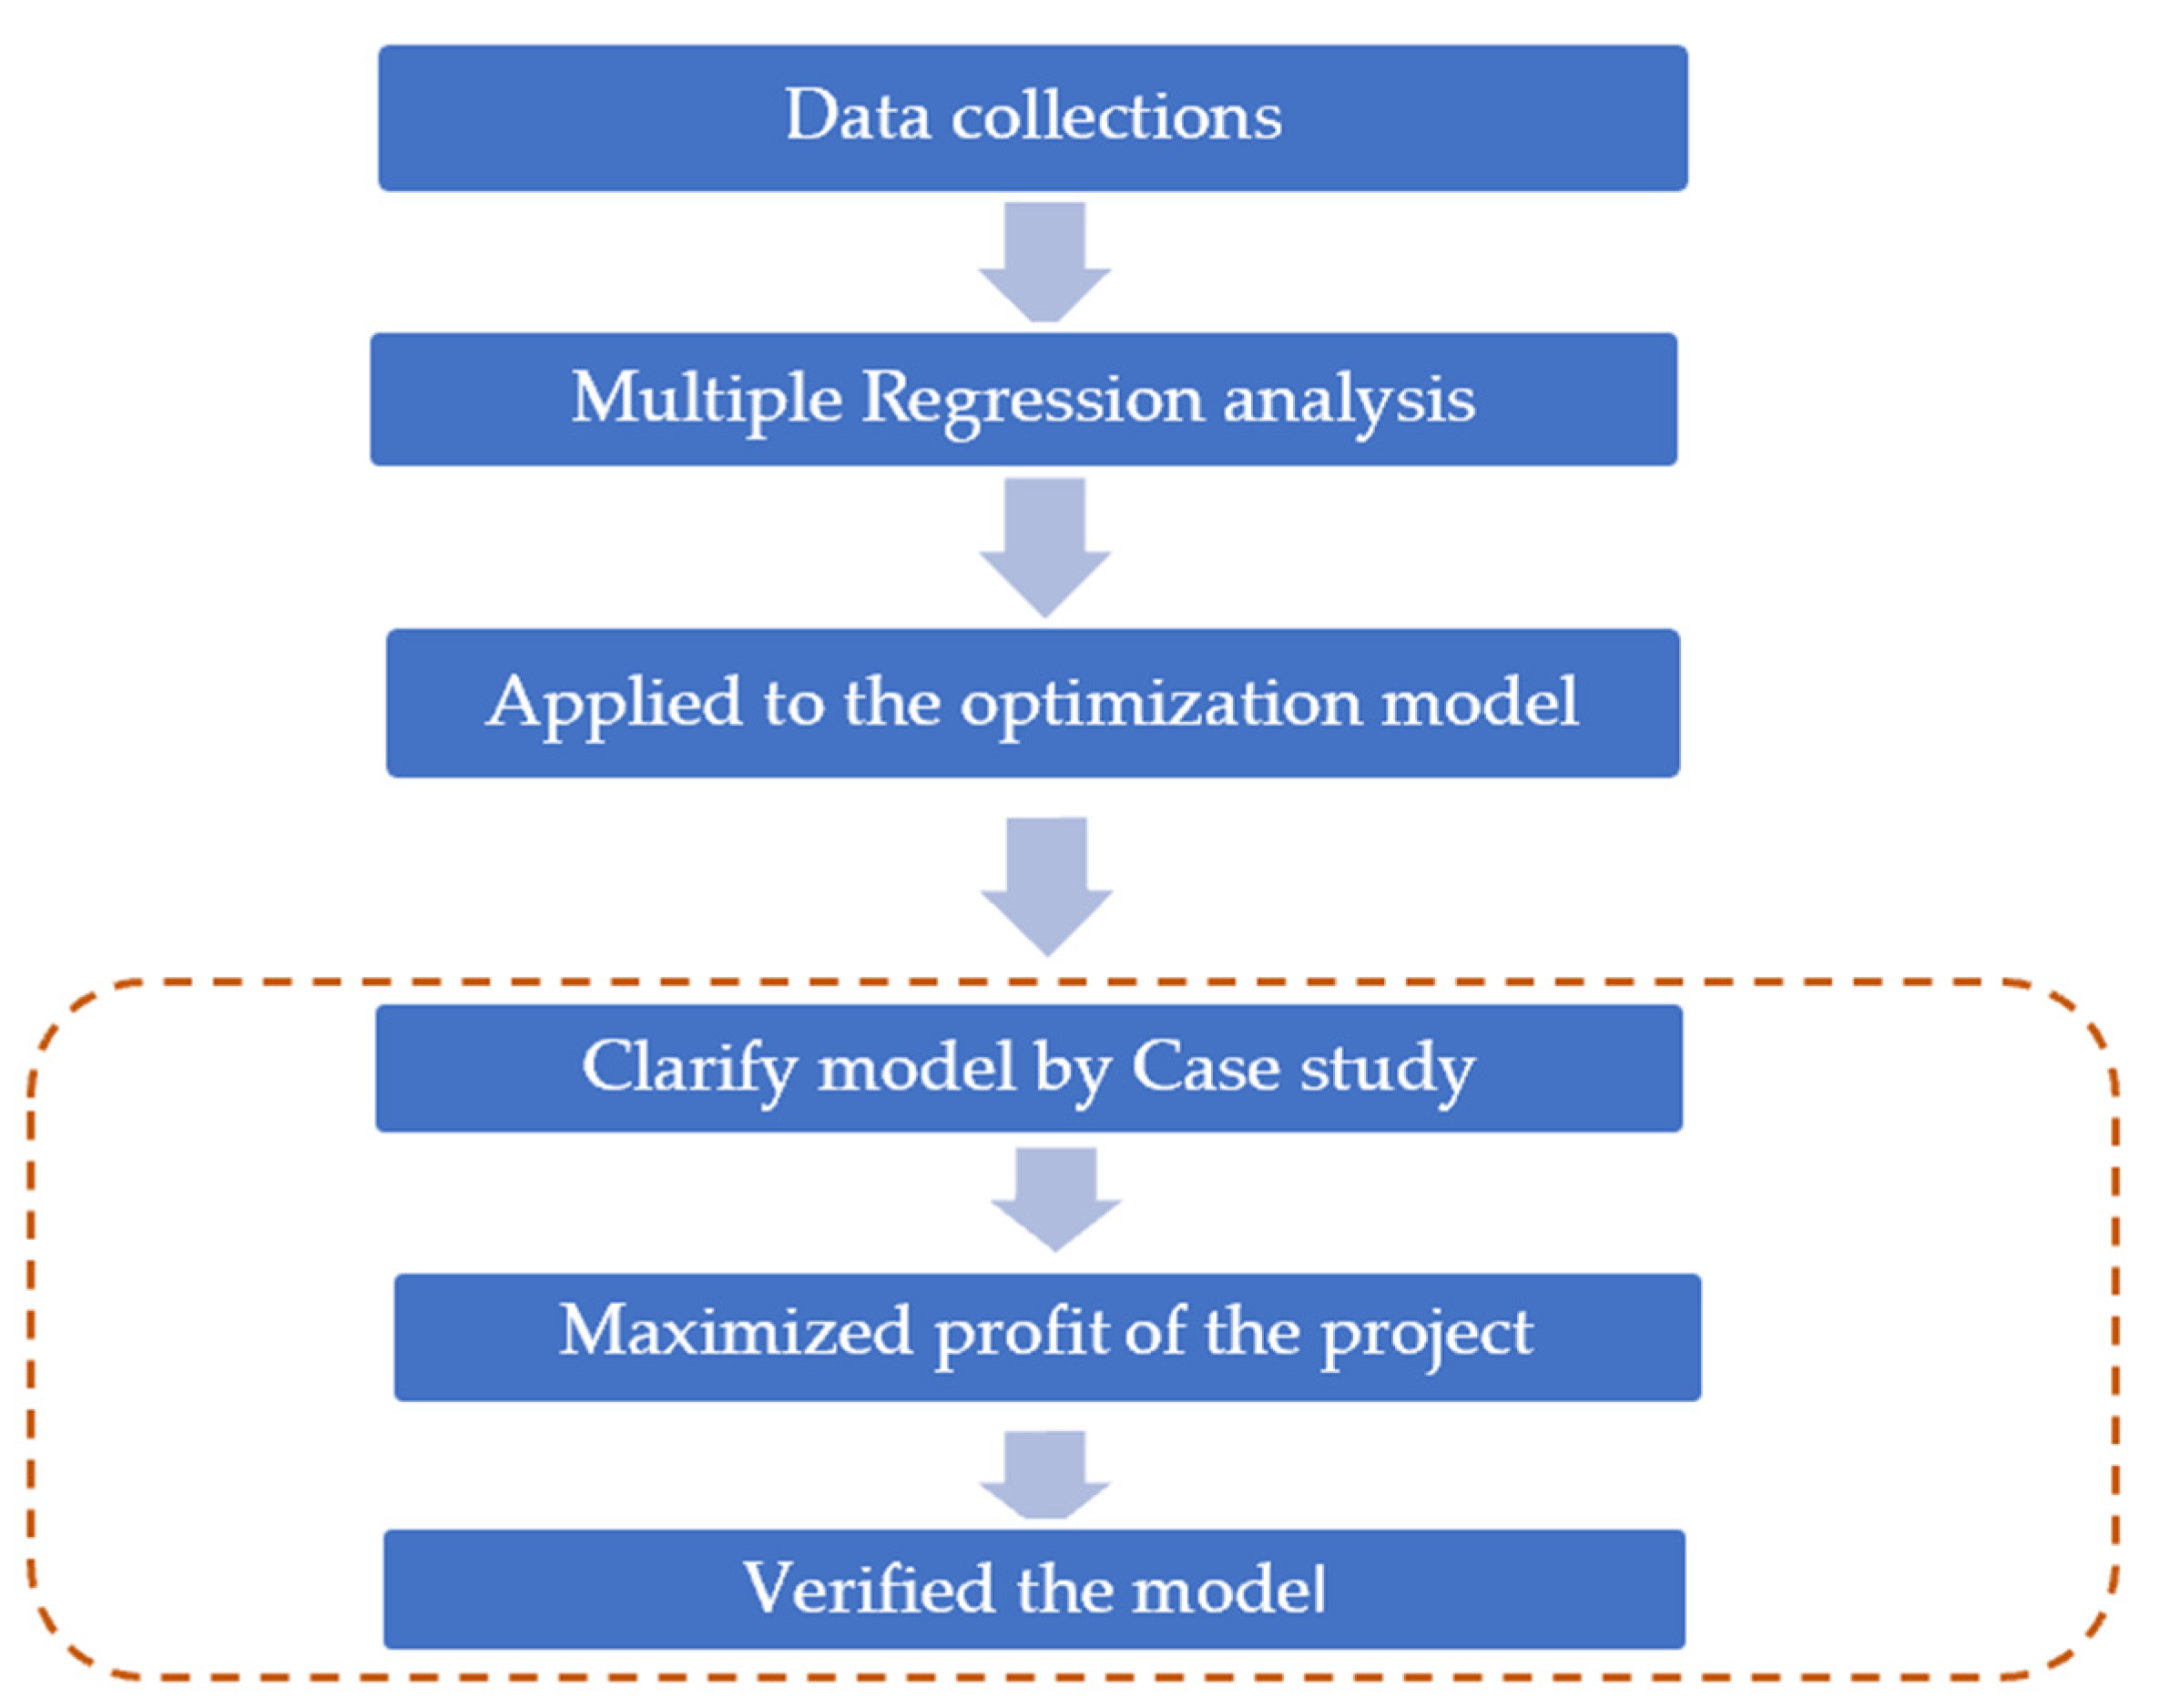
2. Materials and Methods
2.1. Data Collections
2.2. Multiple Regression Analysis
2.2.1. Application of Multiple Regression Analysis
2.2.2. A Graph Comparing the Predicted Profit/Type Values from the Regression Models with the Actual Profit/Type Values
2.3. Optimization Approach
- Designed Variable
- 2.
- Objective Function
- 3.
- Constraints
- 4.
- Sign Restrictions
Linear Programming
3. Case Study
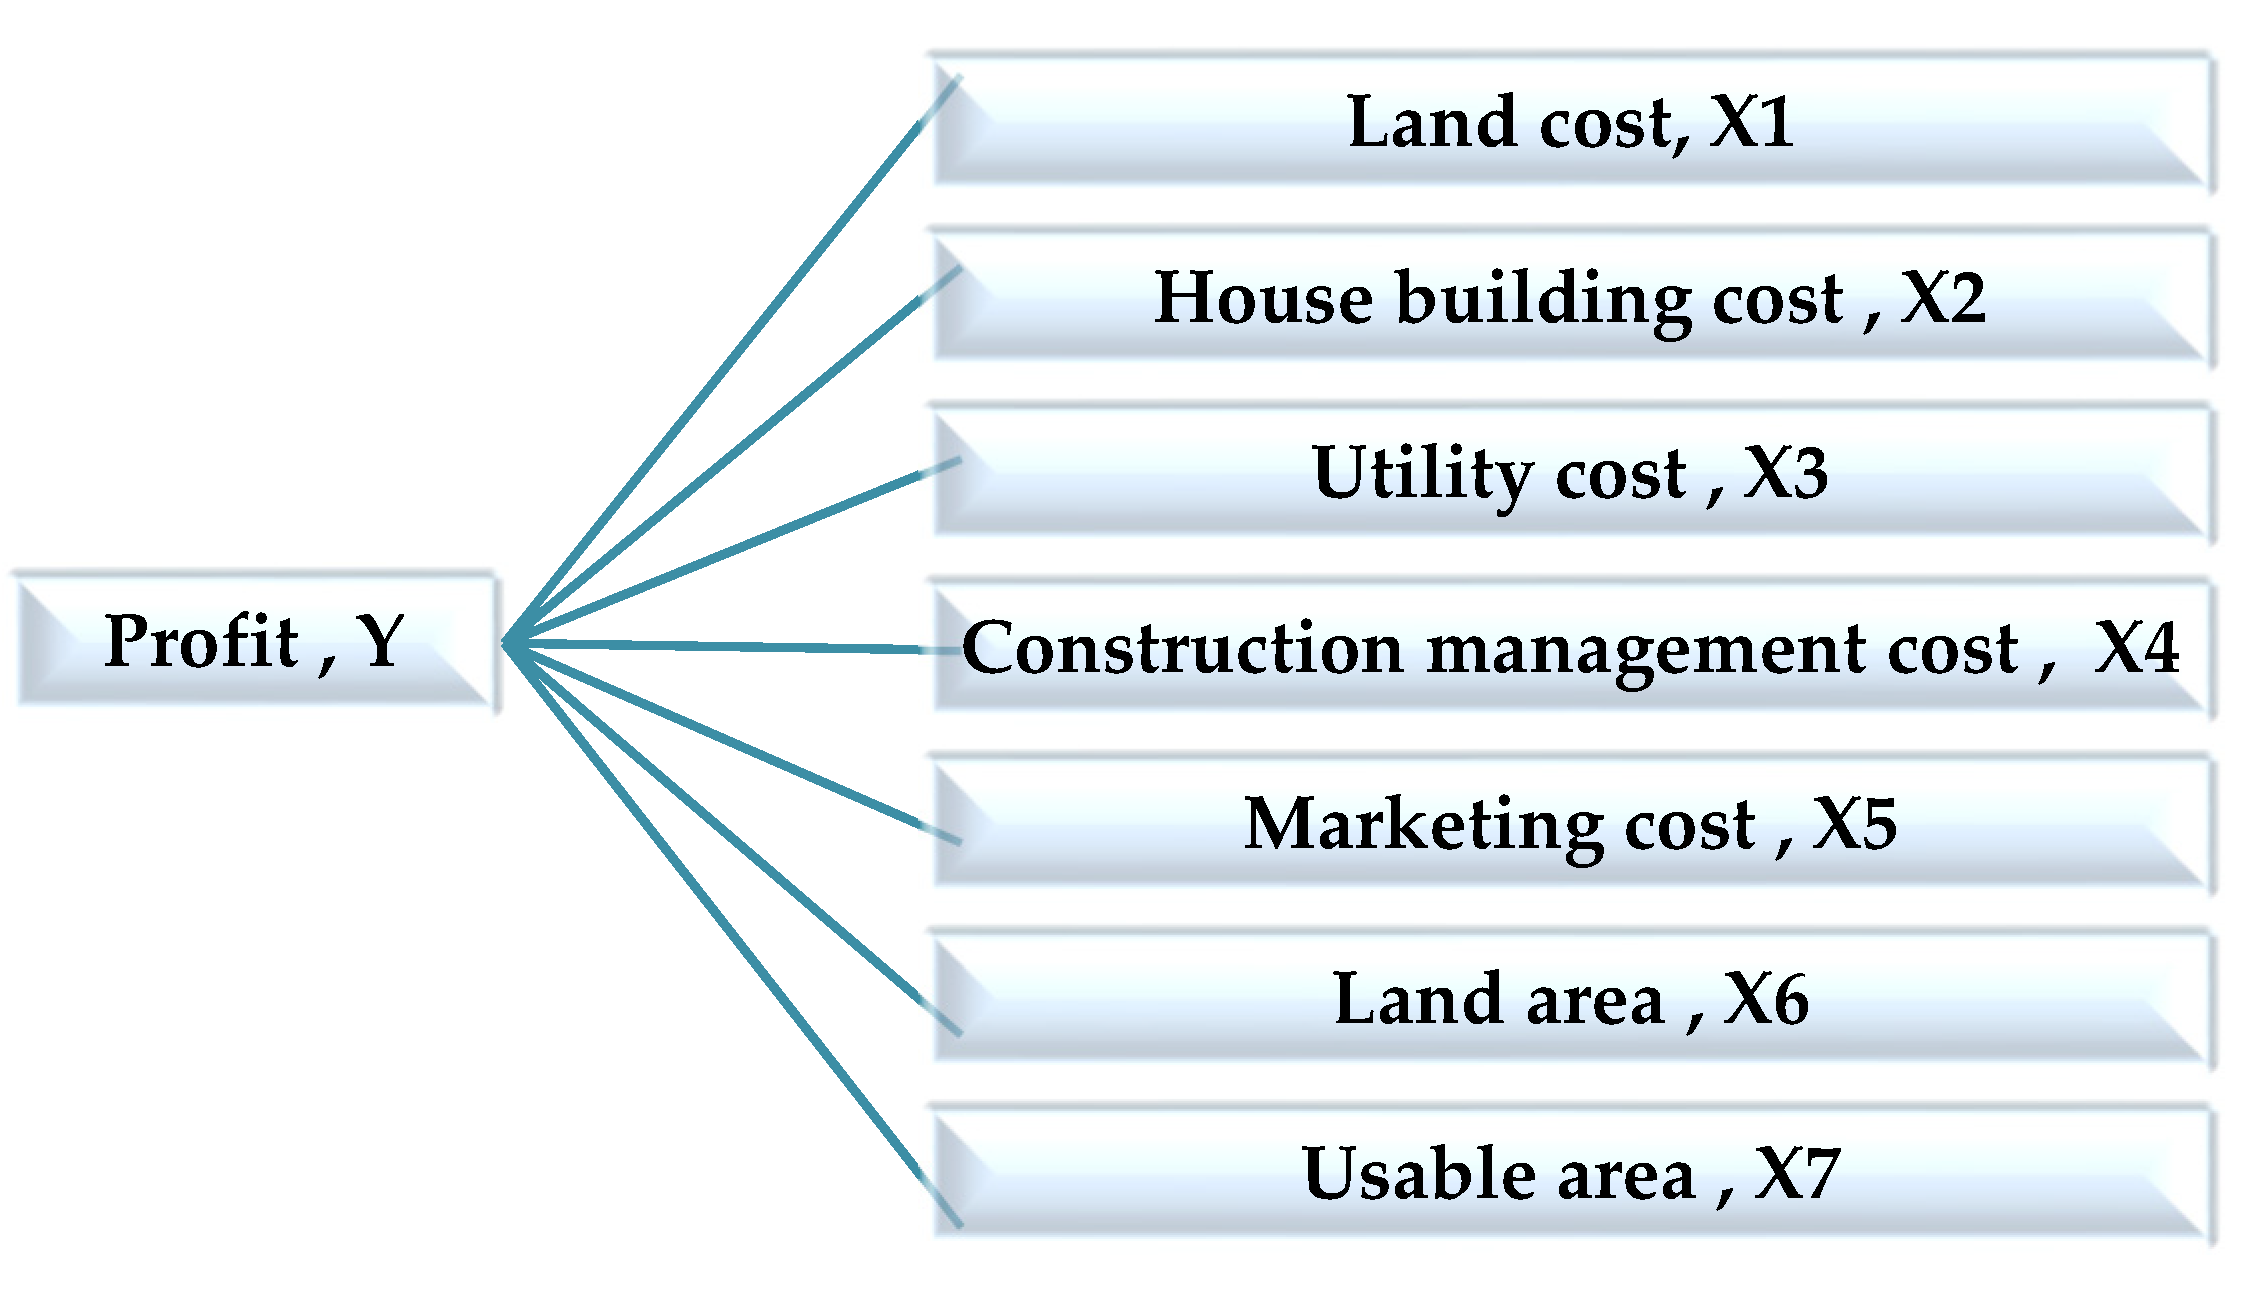
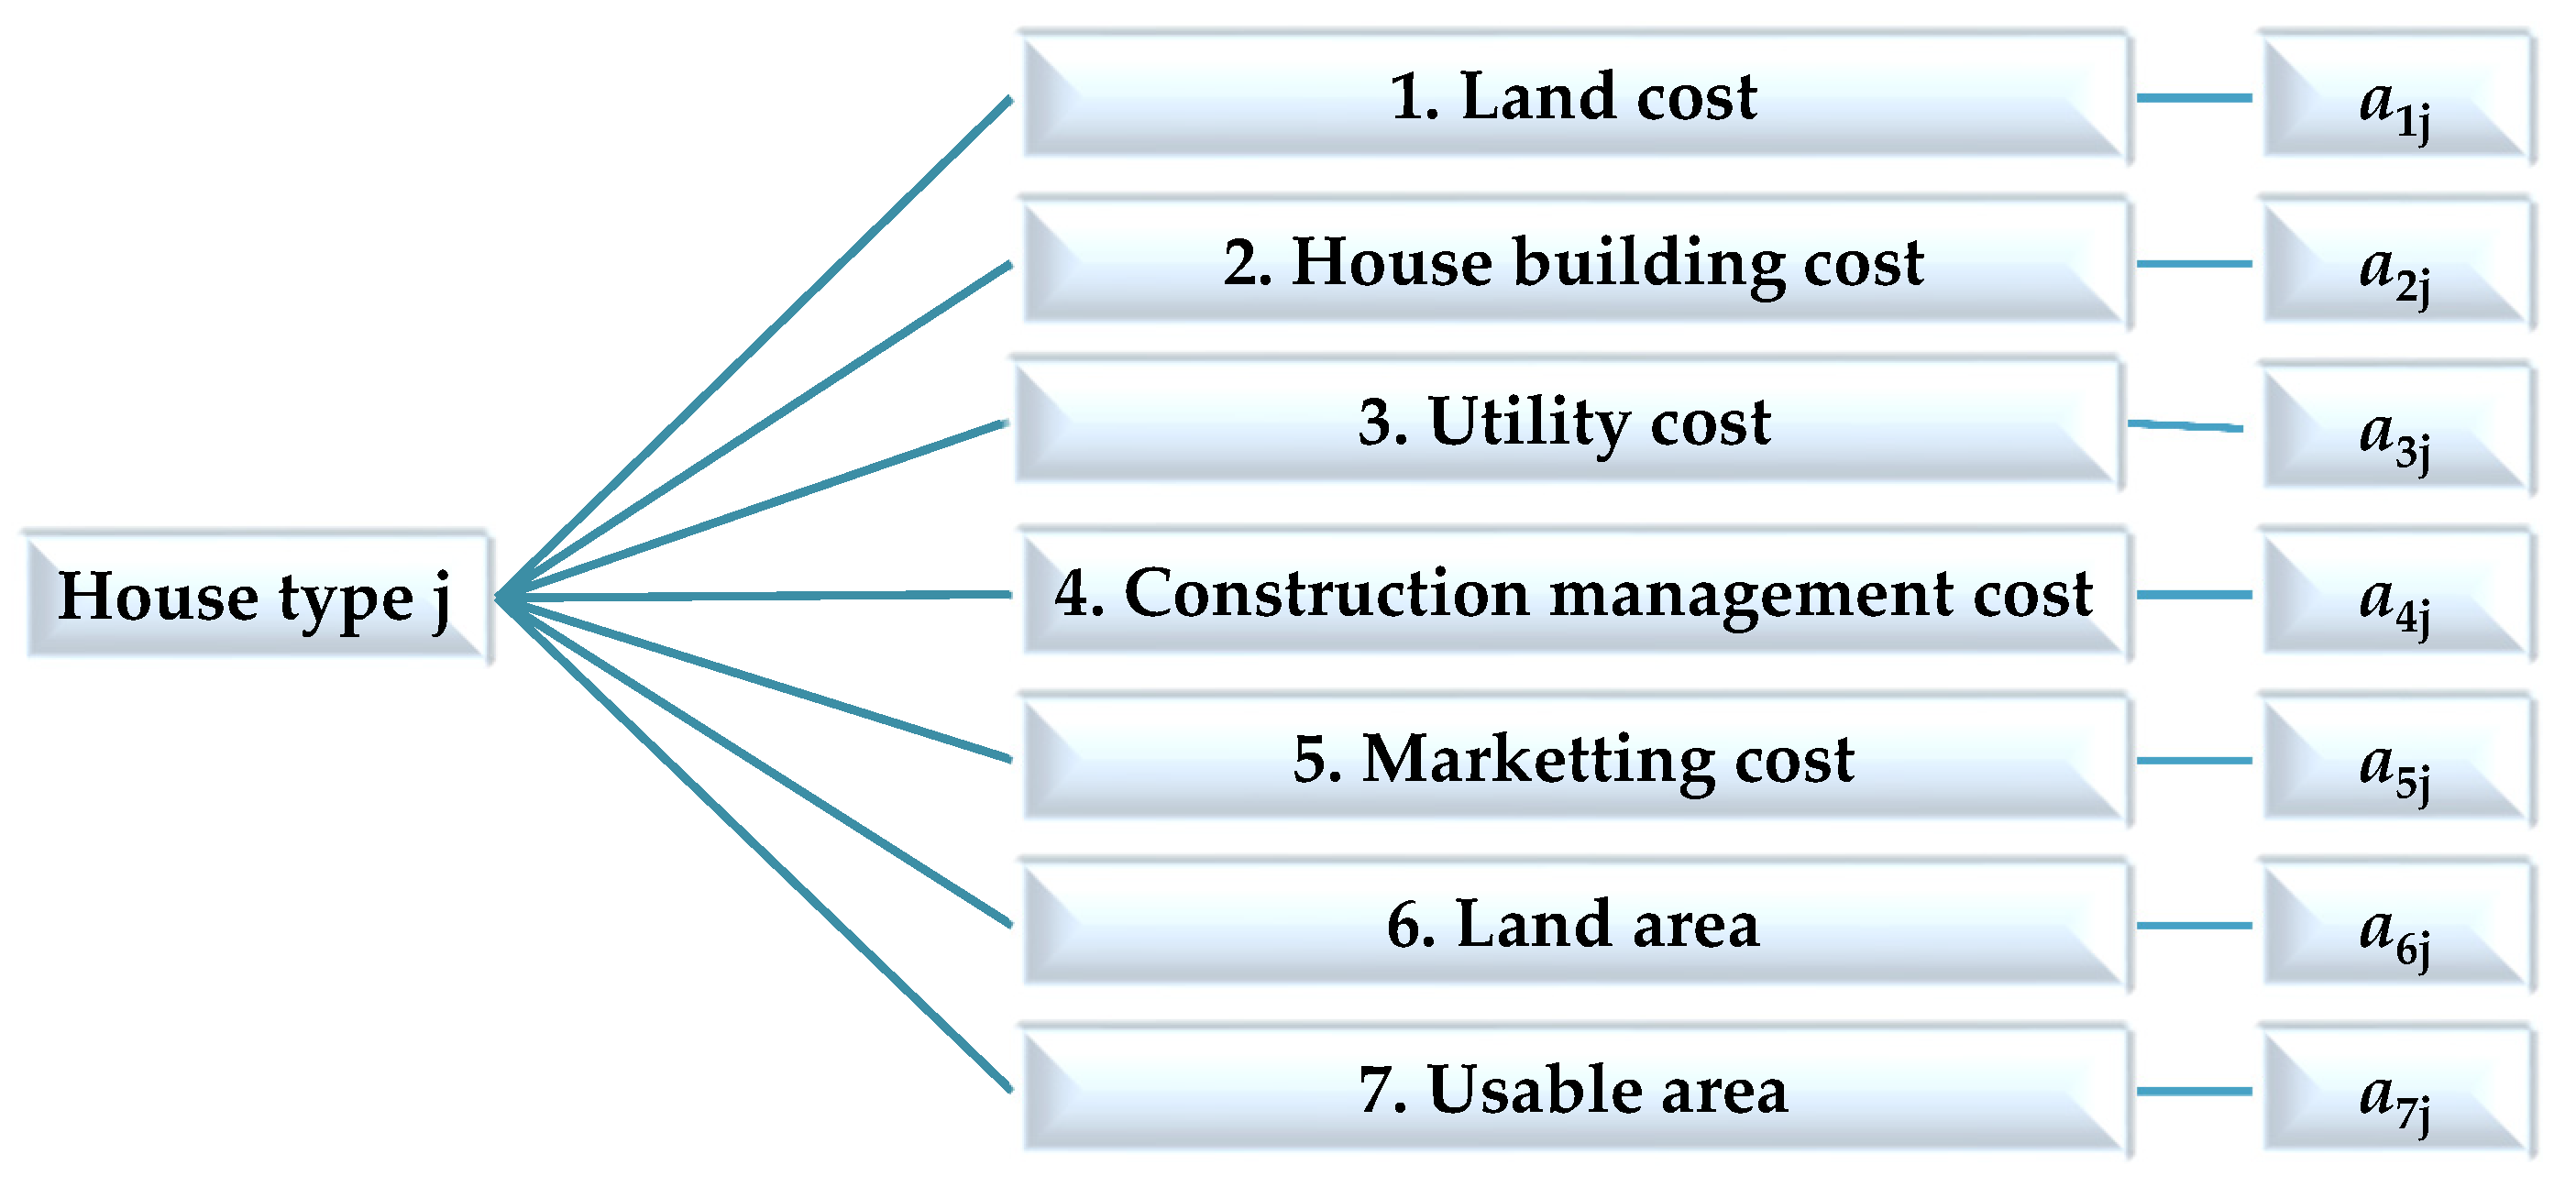
3.1. Decision Variables
3.2. Coefficients of the Decision Variables
3.3. Constraint Functions, or Limiting Functions
3.4. Objective Function
4. Results and Discussion
4.1. Verification of the Optimization Model
4.2. Sensitivity Analysis
4.2.1. Scenario One
4.2.2. Scenario Two
5. Conclusions
- For the default constraint or the fixed constraint, it was found that constraints are needed in every project with to find out the objective function value that is called the maximized profit of the housing development project, namely Constraint No. 1, or the land cost limitation; Constraint No. 2, or the house building cost limitation; Constraint No. 3, or the utility cost limitation; Constraint No. 4, or the construction management cost limitation; and Constraint No. 5 or the marketing cost limitation. Moreover, all of them are the resource constraints of housing development projects. Thus, the default constraint represents the total resource required for decision variables, or x1, x2, and x3 for this study. As a result, this constraint will be used depending on the product per unit.
- Various constraints or user constraints depend on the users to define their own requirement or determining the owner’s plan. Then, the constraints can be set according to the project’s budget in the project planning stage, and each project will be different. There are other constraints, namely Constraint No. 6, or the land area limitation; Constraint No. 7, or usable area limitation; Constraint No. 8, or total houses in the project limitation; Constraint No. 9, or a minimum of x1; Constraint No. 10, or a minimum of x2; and Constraint No. 11, or a minimum of x3. A varying constraint is the control of the budget of the project that should be determined by the program user. However, it also depends on each program user, while varying constraints should be compatible with default constraints to gain the best objective function value or a quite reliable and effective objective function value.
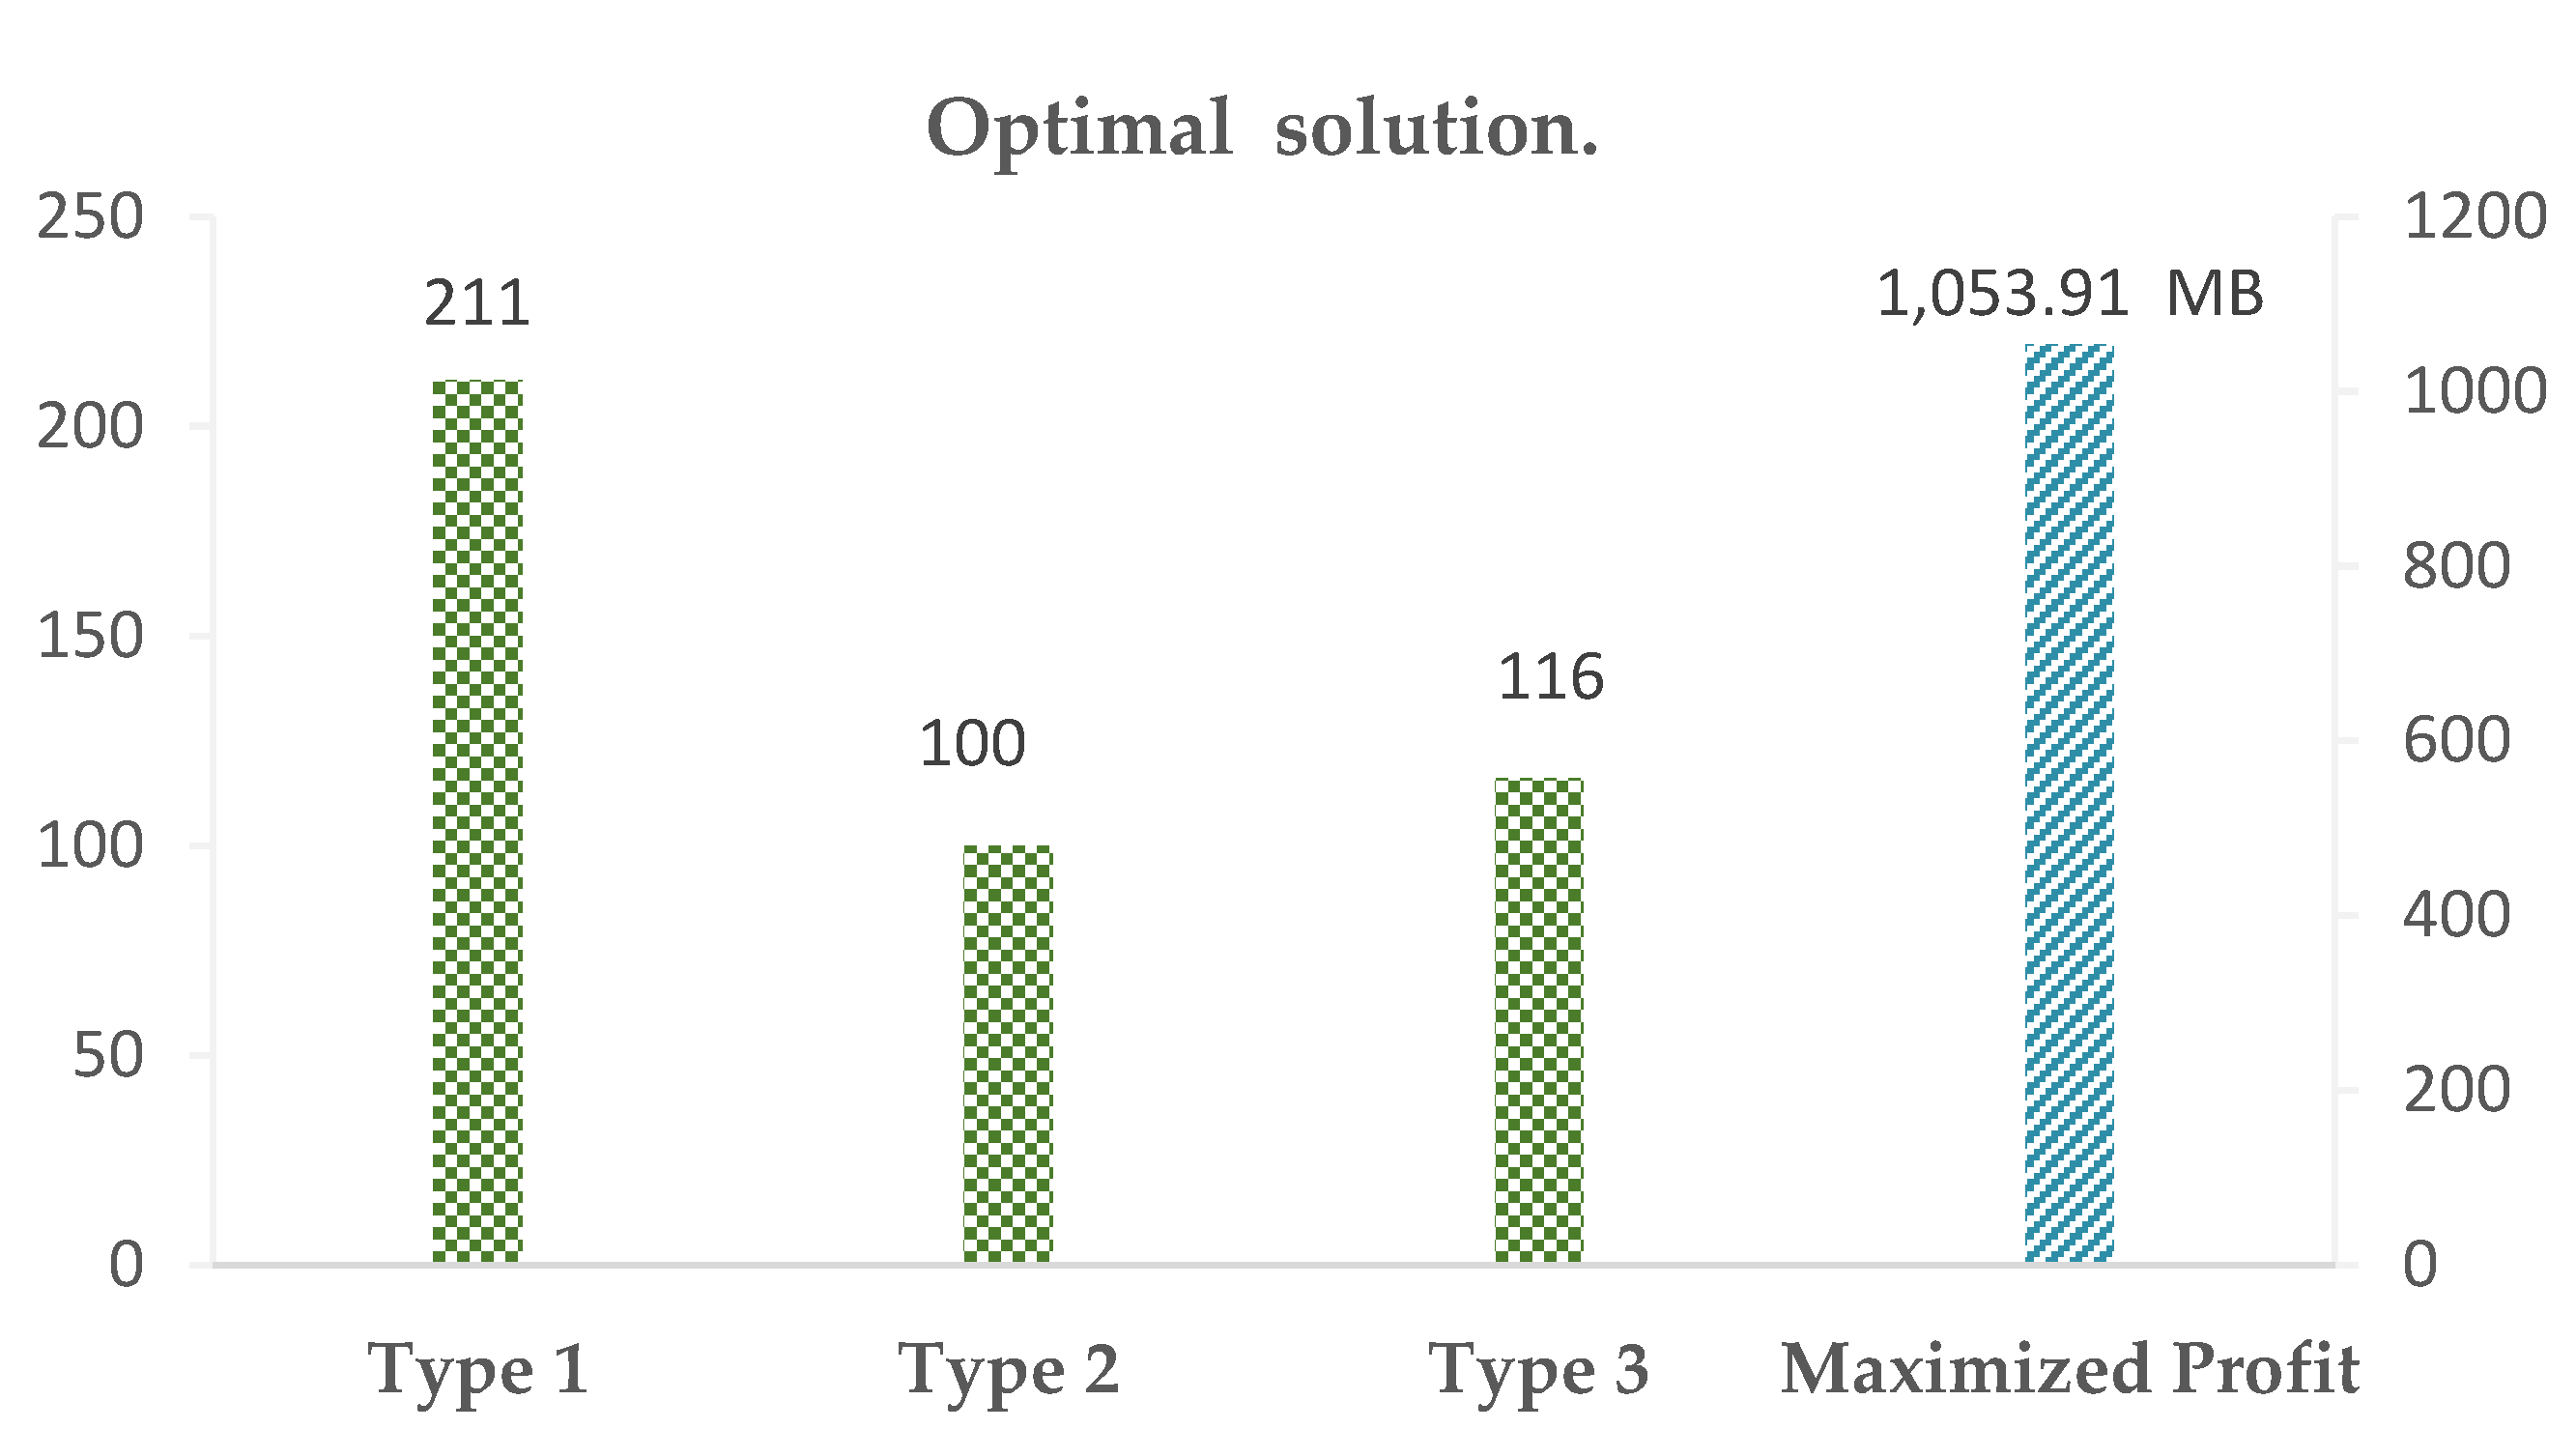
- The optimal solution showed how to determine the maximized profit for all houses in the case study of the project under resource constraints, such as the land cost limitation, the building cost limitation, the utility cost limitation, and the number of houses for each type in the project.
Author Contributions
Funding
Institutional Review Board Statement
Informed Consent Statement
Data Availability Statement
Acknowledgments
Conflicts of Interest
References
- Boye, P.; Mireku-Gyimah, D.; Okpoti, D. Multiple Linear Regression Model for Estimating the Price of a Housing Unit. Ghana Min. J. 2017, 17, 66–77. [Google Scholar] [CrossRef]
- Chaphalkar, N.; Dhatunde, M. Real property valuation using sales comparison method and multiple regression analysis. Int. J. Mod. Trends Eng. Res. 2015, 2, 305–315. [Google Scholar]
- Thomas, N.; Thomas, A. Regression Modelling for Prediction of Construction Cost and Duration. Appl. Mech. Mater. 2016, 857, 195–199. [Google Scholar] [CrossRef]
- Rasyadan, F.; Hapsari, I.R. Housing Development Optimizition (Case Study: Anugerah Dian Regency In Kabupaten Banjar). Am. J. Eng. Res. 2020, 9, 55–59. [Google Scholar]
- Montana, F.; Kanafani, K.; Wittchen, K.B.; Birgisdottir, H.; Longo, S.; Cellura, M.; Riva Sanseverino, E. Multi-Objective Optimization of Building Life Cycle Performance. A Housing Renovation Case Study in Northern Europe. Sustainability 2020, 12, 7807. [Google Scholar] [CrossRef]
- Pandit, A. Application of Linear programming for Profit maximization of a Housing construction company: Case study of Urbanization of Millennials. Int. J. Eng. Appl. Sci. Technol. 2020, 5, 578–581. [Google Scholar] [CrossRef]
- Marović, I.; Perić, M.; Hanak, T. A Multi-Criteria Decision Support Concept for Selecting the Optimal Contractor. Appl. Sci. 2021, 11, 1660. [Google Scholar] [CrossRef]
- Laokhongthavorn, L.; U-tapao, C. A Multi-Objective Optimization Model for Solid Waste Disposal Under Uncertainty: A Case Study of Bangkok, Thailand. Int. J. Civ. Eng. 2017, 15, 205–212. [Google Scholar] [CrossRef]
- Baldominos, A.; Blanco, I.; Moreno, A.J.; Iturrarte, R.; Bernárdez, Ó.; Afonso, C. Identifying Real Estate Opportunities Using Machine Learning. Appl. Sci. 2018, 8, 2321. [Google Scholar] [CrossRef]
- Ahmed, S. An Approach to Maximize profit of a constructing project within Limited Budget by using Simplex Method. Int. J. Sci. Eng. Res. 2015, 6, 786–791. [Google Scholar]
- Klingenberg, B.; Brown, R.J. Optimization of residential property management. Prop. Manag. 2006, 24, 397–414. [Google Scholar] [CrossRef]
- Arfan Utiarahman, A.S.R. Case Study of Housing Development with Optimization of Housing Land Utilization by Using Linear Programs. Int. J. Innov. Sci. Res. Technol. 2018, 3, 307–313. [Google Scholar]
- Real Estate Information Center. Real Estate Situation Bangkok-Perimeter. 2004. Available online: www.reic.or.th (accessed on 25 August 2004).
- Yamane, T. Statistics, an Introductory Analysis, 2nd ed.; Harper: New York, NY, USA, 1967. [Google Scholar]
- Sarker, R.A.; Newton, C.S. Optimization Modelling a Practical Approach; CRC Press: Boca Raton, FL, USA, 2007. [Google Scholar]
- Winston, W.L. Operations Research Applications and Algorithms, 4th ed.; Thomson Brooks/Cole: Belmont, CA, USA, 2004. [Google Scholar]
- Balakrishnan, N.; Stair, R.M.; Render, B. Managerial Decision Modeling with Spreadsheets; Pearson Education Ltd.: New York, NY, USA, 2013. [Google Scholar]
- Render, B.; Stair, R.M., Jr.; Hanna, M.E.; Hale, T.S. Quantitative Analysis for Management, 12th ed.; Pearson Education Ltd.: New York, NY, USA, 2015. [Google Scholar]
- Taylor, B.W. Introduction to Management Science; Pearson Education Ltd.: New York, NY, USA, 2019. [Google Scholar]
- Wisniewski, M.; Dacre, T. Mathematical Programming: Optimization Models for Business and Management Decision-Making; McGRAW-HILL Book Company Ltd.: Maidenhead, Berkshire, UK, 1990. [Google Scholar]
- Meredith, J.R.; Shafer, S.M.; Turban, E. Quantitative Business Modeling; South-Western/Thomson Learning: Mason, OH, USA, 2002. [Google Scholar]
- Chan, D.W.M.; Kumaraswamy, M.M. Modelling and predicting construction durations in Hong Kong public housing. Constr. Manag. Econ. 1999, 17, 351–362. [Google Scholar] [CrossRef]
- Chan, A.P.C.; Chan, D.W.M. Developing a benchmark model for project construction time performance in Hong Kong. Build. Environ. 2004, 39, 339–349. [Google Scholar] [CrossRef]
- Le-Hoai, L.; Lee, Y.D.; Nguyen, A.T. Estimating time performance for building construction projects in Vietnam. KSCE J. Civ. Eng. 2013, 17, 1–8. [Google Scholar] [CrossRef]


| House Types | Units | Land Cost/Type | House Building Cost/Type | Utility Cost /Type | Construction Management Cost /Type | Marketing Cost /Type | Land Area /Type | Usable Area /Type |
|---|---|---|---|---|---|---|---|---|
| 1 | 197 | 675,107 | 1,335,600 | 330,817.76 | 49,706.26 | 75,858.09 | 50.7 | 106 |
| 2 | 123 | 704,402.0 | 1,508,000.0 | 330,817.76 | 60,960.90 | 79,149.77 | 52.9 | 130 |
| 3 | 107 | 752,338.0 | 1,985,600.0 | 330,817.76 | 68,463.78 | 84,536.14 | 56.5 | 146 |
| 4 | 66 | 438,314.5 | 845,152.0 | 189,315.9 | 54,080.00 | 55,717.70 | 16 | 88 |
| 5 | 271 | 520,498.4 | 1,252,184.0 | 189,315.9 | 81,119.28 | 83,575.80 | 19 | 132 |
| 6 | 65 | 630,077.0 | 1,583,824.0 | 189,315.9 | 103,242.72 | 106,369.20 | 23 | 168 |
| 7 | 188 | 459,350.0 | 1,231,400.9 | 196,042.2 | 41,224.81 | 53,286.10 | 20.7 | 110 |
| 8 | 138 | 527,697.7 | 1,379,120.3 | 196,042.2 | 45,647.10 | 61,214.66 | 23.78 | 121.8 |
| 9 | 58 | 459,350.0 | 1,281,694.2 | 196,042.2 | 42,843.82 | 53,286.10 | 20.7 | 114.32 |
| 10 | 41 | 527,697.7 | 1,428,530.79 | 196,042.2 | 46,913.83 | 61,214.66 | 23.78 | 125.18 |
| 11 | 20 | 1,560,674.89 | 1,780,000.0 | 301,503.76 | 59,579.82 | 120,051.91 | 37 | 130 |
| 12 | 18 | 1,518,494.48 | 1,525,000.0 | 301,503.76 | 52,705.22 | 116,807.27 | 36 | 115 |
| 13 | 95 | 759,247.24 | 1,420,000.0 | 301,503.76 | 56,371.67 | 58,403.63 | 18 | 123 |
| 14 | 70 | 553,055.24 | 880,000.0 | 112,786.26 | 11,034.39 | 172,626.83 | 19 | 87 |
| 15 | 192 | 486,803.83 | 750,000.0 | 112,786.26 | 9385.57 | 33,533.26 | 16.9 | 74 |
| Regression Statistics | |
|---|---|
| Multiple R | 0.968 |
| R Square | 0.937 |
| Adjust R Square | 0.927 |
| Variables | Unstandardized Coefficients | Standardized Coefficients | Sig. | Collinearity Statistics VIF | |
|---|---|---|---|---|---|
| B | Std. Error | Beta | |||
| (Constant) | −384,364.26 | 229,043.285 | 0.119 | ||
| Land cost/type | 1.486 | 0.186 | 0.688 | 0.000 | 1.423 |
| House building cost/type | 0.919 | 0.197 | 0.402 | 0.001 | 1.423 |
| House Types | Units | Land Cost | House Building Cost | Utility Cost | Construction Management Cost | Marketing Cost | Land Area | Usable Area | Profit/ Type |
|---|---|---|---|---|---|---|---|---|---|
| 1 | 197 | 675,107 | 1,335,600 | 330,817.76 | 49,706.26 | 75,858.09 | 50.7 | 106 | 2,112,910.89 |
| 2 | 123 | 704,402 | 1,508,000 | 330,817.76 | 60,960.90 | 79,149.77 | 52.9 | 130 | 2,166,669.58 |
| 3 | 107 | 752,338 | 1,985,600 | 330,817.76 | 68,463.78 | 84,536.14 | 56.5 | 146 | 2,628,244.32 |
| Cases | Project’s Profit | Percentage Error |
|---|---|---|
| Actual data | 963.97 MB. | 0.35% |
| Optimal solution | 967.36 MB. |
| Project’s Data | Scenario 1 | Scenario 2 |
|---|---|---|
| House-type 1 (unit) | 211 | 214 |
| House-type 2 (unit) | 100 | 96 |
| House-type 3 (unit) | 116 | 117 |
| Maximized profit of the project (MB) | 1053.91 | 1054.18 |
Disclaimer/Publisher’s Note: The statements, opinions and data contained in all publications are solely those of the individual author(s) and contributor(s) and not of MDPI and/or the editor(s). MDPI and/or the editor(s) disclaim responsibility for any injury to people or property resulting from any ideas, methods, instructions or products referred to in the content. |
© 2023 by the authors. Licensee MDPI, Basel, Switzerland. This article is an open access article distributed under the terms and conditions of the Creative Commons Attribution (CC BY) license (https://creativecommons.org/licenses/by/4.0/).
Share and Cite
Kakaew, S.; U-tapao, C. An Optimization Model for the Maximized Profit of Housing Development Project: A Case Study of Bangkok and Perimeter, Thailand. Appl. Sci. 2023, 13, 5400. https://doi.org/10.3390/app13095400
Kakaew S, U-tapao C. An Optimization Model for the Maximized Profit of Housing Development Project: A Case Study of Bangkok and Perimeter, Thailand. Applied Sciences. 2023; 13(9):5400. https://doi.org/10.3390/app13095400
Chicago/Turabian StyleKakaew, Siripob, and Chalida U-tapao. 2023. "An Optimization Model for the Maximized Profit of Housing Development Project: A Case Study of Bangkok and Perimeter, Thailand" Applied Sciences 13, no. 9: 5400. https://doi.org/10.3390/app13095400
APA StyleKakaew, S., & U-tapao, C. (2023). An Optimization Model for the Maximized Profit of Housing Development Project: A Case Study of Bangkok and Perimeter, Thailand. Applied Sciences, 13(9), 5400. https://doi.org/10.3390/app13095400