Article

Investigation of the Influence Area of the Excavation of a Double-Line Highway Tunnel under an Existing Railway Tunnel

1
School of Civil and Environment Engineering, University of Science and Technology Beijing, Beijing 100083, China
2
School of Mine Engineering, North China University of Science and Technology, Tangshan 063210, China
*
Authors to whom correspondence should be addressed.
Appl. Sci. 2024, 14(1), 290; https://doi.org/10.3390/app14010290
Submission received: 16 November 2023 / Revised: 22 December 2023 / Accepted: 26 December 2023 / Published: 28 December 2023

Abstract

:
The research on the impact of the excavation of underpass tunnels has already had certain results, but there is a lack of research cases of double-line highway tunnels with oblique angles under the existing railway tunnels, especially the method of determining the area of the impact of the dynamic and static loads of new tunnels and existing trains, which can be enriched by considering them at the same time. This paper, is based on the tunnel project of the new double-line Shiqian highway tunnel with oblique angles under the Hurong railway in Wanshoushan. By constructing a three-dimensional finite element model and simulating the application of static tunnel excavation load, dynamic blasting load, and dynamic train operation load of the existing tunnel, the overall displacement of the existing tunnel and the settlement value of the bottom plate of the track surface by the static tunnel excavation load were analyzed. Then, the stresses, vibration speeds, and displacements of the tunnel due to the dynamic blasting loads and the dynamic train operation loads were obtained. The results show that the area of influence of the static loads of the new tunnel excavation on the existing tunnel is divided into three types of perturbations presenting strong, weak, and slight; the area affected by the blasting dynamic load of new tunnel excavation is a circular domain with the datum point in the tunnel section as the center; the area affected by the dynamic load of train operation in the existing tunnel is an ellipse with the center of the track surface of the existing tunnel as the datum; and there is an anomalous shape in the area affected by the blasting dynamic load of new tunnel excavation and the area affected by the dynamic load of the train operation in the existing tunnel.

1. Introduction

With China’s growing population and increasing traffic congestion, the development of underground space has become a mainstream trend, and the emergence of underground highway and railway tunnels has greatly eased traffic congestion [1,2,3]. However, due to the increase in the number of tunnels, it is inevitable that there will be spatial overlapping of tunnels, in which the lower part of new tunnels passes through the existing tunnels, which is a commonly used method in the project [4,5,6,7]. The excavation of new tunnels not only induces stress redistribution in the surrounding rock strata but also generates additional stresses, settlement deformations, and additional vibrations on the existing tunnels, resulting in the deterioration of the mechanical properties of the existing tunnel structures within a certain range of the underpass area [8,9,10]. When the clear distance between the cross-section tunnels is small, there is an overlapping influence area between the excavation of the new tunnel and the train operation in the existing tunnel, which can lead to further deterioration of the mechanical properties of the surrounding rock [11,12,13]. Currently, there are fewer studies on the overlapping impact areas of tunnel crossing sections, and research on cases of double-line highway tunnels passing under existing railway tunnels at oblique angles is lacking. Therefore, it is of great significance to study the area affected by the excavation of road tunnels under existing railway tunnels.
At present, scholars have certain research results on the effects of static loads on excavation under existing tunnels for new tunnels [14,15,16]. Chakeri et al. [17] investigated the effect of tunnel depth, overburden pressure, tunnel dimensions, and palisade pressure on tunnel displacements in a single-lane tunnel. Gue et al. [18] investigated the bending moments and deformation patterns of a newly constructed two-lane tunnel vertically crossing an existing tunnel at different clear distances using centrifuge modeling tests. Avgerinos et al. [19] constructed a model of a newly constructed tunnel vertically under an existing tunnel by means of three-dimensional finite element (ICFEP 1999) software and analyzed the circumferential forces, bending moments, and lining deformations due to excavation. Chen et al. [20] systematically monitored the deformation characteristics and stress changes of new tunnels using a proximity earth pressure balance shield (EPBS) on existing tunnels based on a double tunnel project in a sandy soil formation in Changsha City. It is proposed that the settlement development of the existing tunnel undergoes four stages: settlement, bulge, secondary settlement, and reaching a steady state, and it is found that the settlement caused by the second shield tunnel penetration is significantly larger than the settlement caused by the first tunnel penetration.
Vertical tunnel crossing is typical in the theoretical model, but in practical engineering, angled crossings with more complex disturbances are often adopted. Shi et al. [21] investigated the response of underground pipes to tunnel boring by centrifuge tests. The results showed that the pipe tunnel settlement and strain were related to the tunnel intersection angle, and the change was 20% higher at an intersection angle of 60° compared to a 90° intersection angle. Lin et al. [22] studied the lateral deformation, transverse internal force, and torsional deformation of new two-lane tunnels diagonally angled down through the existing tunnels based on the Changsha Metro Line 2 and Line 4 projects in China. The results show that the lateral deformation and lateral internal force of the existing tunnel show obvious asymmetric characteristics, and there are irrecoverable local torsional deformations on both sides of the new tunnel; the angle of intersection has almost no effect on the maximum settlement at the top of the existing tunnel but it has a significant effect on the maximum settlement at the bottom, and it can be divided into three phases, i.e., a slow decrease (0–30°), a sharp decrease (30–60°), and slow decrease (60–90°). Further, Charles et al. [23] analytically summarized the stress redistribution patterns of new tunnels passing under existing tunnels at different angles of intersection by 3D centrifuge modeling.
At the same time, in addition to the static loads of excavation, more results have been obtained for the role of the dynamic loads of blasting excavation in new tunnels and the dynamic loads of train operation in existing tunnels.
In terms of the dynamic loading of blasting and excavation of new tunnels, Shin et al. [24] used numerical methods to simulate the dynamics of soft rock tunnels, investigated the particle velocity of the blast vibration and the displacement and lining stress change in the tunnels, and proposed the concept of a blast protection zone. Zhao et al. [25] investigated the effects of blasting vibration velocity and vibration frequency of neighboring tunnels on the existing tunnels through the finite element method (FEM) and on-site monitoring experiments. Tian et al. [26] carried out on-site tunnel blasting vibration tests and processed signals such as power spectrum, wavelet energy, and wavelet packet energy analysis with the help of MATLAB 2018 software. According to the severity of the affected degree, the tunnel blasting area is divided into a hazardous area, a warning area, a blasting control area, and a safety area. Duan et al. [27] investigated the peak particle velocity (PPV) change, stress distribution, and crown settlement of cross tunnels under blasting vibration conditions by on-site monitoring and numerical simulation methods based on the Gaojiu Road-Jiahua Tunnel Project in Chongqing. Cao et al. [28] studied the effect of excavation blasting on the supporting structure of the front tunnel in the transition section of the rear tunnel under different levels of surrounding rock, the excavation process, the distance from the explosive source, and the clear span. Ruan et al. [29] modeled the vibration velocity of deep rock blasting, proposed the safe allowable distances under different soil thicknesses, and verified them according to the field blasting parameters.
In terms of dynamic loading from train operation in existing tunnels, Gharehdash et al. [30] and Ma et al. [31] investigated the effect of subway operation on shield tunnel lining and ground vibration by establishing a three-dimensional dynamic finite element model of trains, tracks, tunnels, and soil, respectively. Lai et al. [32] analyzed the vibration response of vehicle loads in the new tunnel and train loads in the existing tunnel on the structure of the new tunnel with the help of Midas-GTS NX 2018 3D finite element simulation software based on the intersection project of Metro Line 2 and Yongningmen tunnel. Huang et al. [33] studied the train-induced settlement of subway tunnels in saturated clay. Yan et al. [34] investigated the dynamic response of cross-shield tunnels under train vibration using nonlinear finite element (ICFEP 1999) software. Dong et al. [35] investigated the dynamic response characteristics of new tunnels under existing heavy railroad tunnels. Xue et al. [36] studied the effects of construction disturbance, train dynamics, and vibration loads on the existing tunnels of super-large diameter shield tunnels based on the Shanghai North Cross-Strait Project.
In summary, the current research on the role of new tunnel excavation static loads, new tunnel blasting excavation dynamic loads, and the existing tunnel operational loads has been more comprehensive and, at the same time, considers that the new tunnel excavation, the existing train dynamic, and the static loads affecting the region of the determination of the method need to be enriched.
Therefore, based on the tunnel project of the new double-line Shiqian highway tunnel diagonally crossing the Hurong railway at Wanshoushan, a three-dimensional model of the influence area of the crossing section was constructed using Midas-GTS NX 2022 numerical simulation software. By applying the new tunnel excavation static load, blasting dynamic load, and the existing tunnel train running dynamic load for simulation calculation, the influence area of the three different load effects is studied.

2. Project Summary

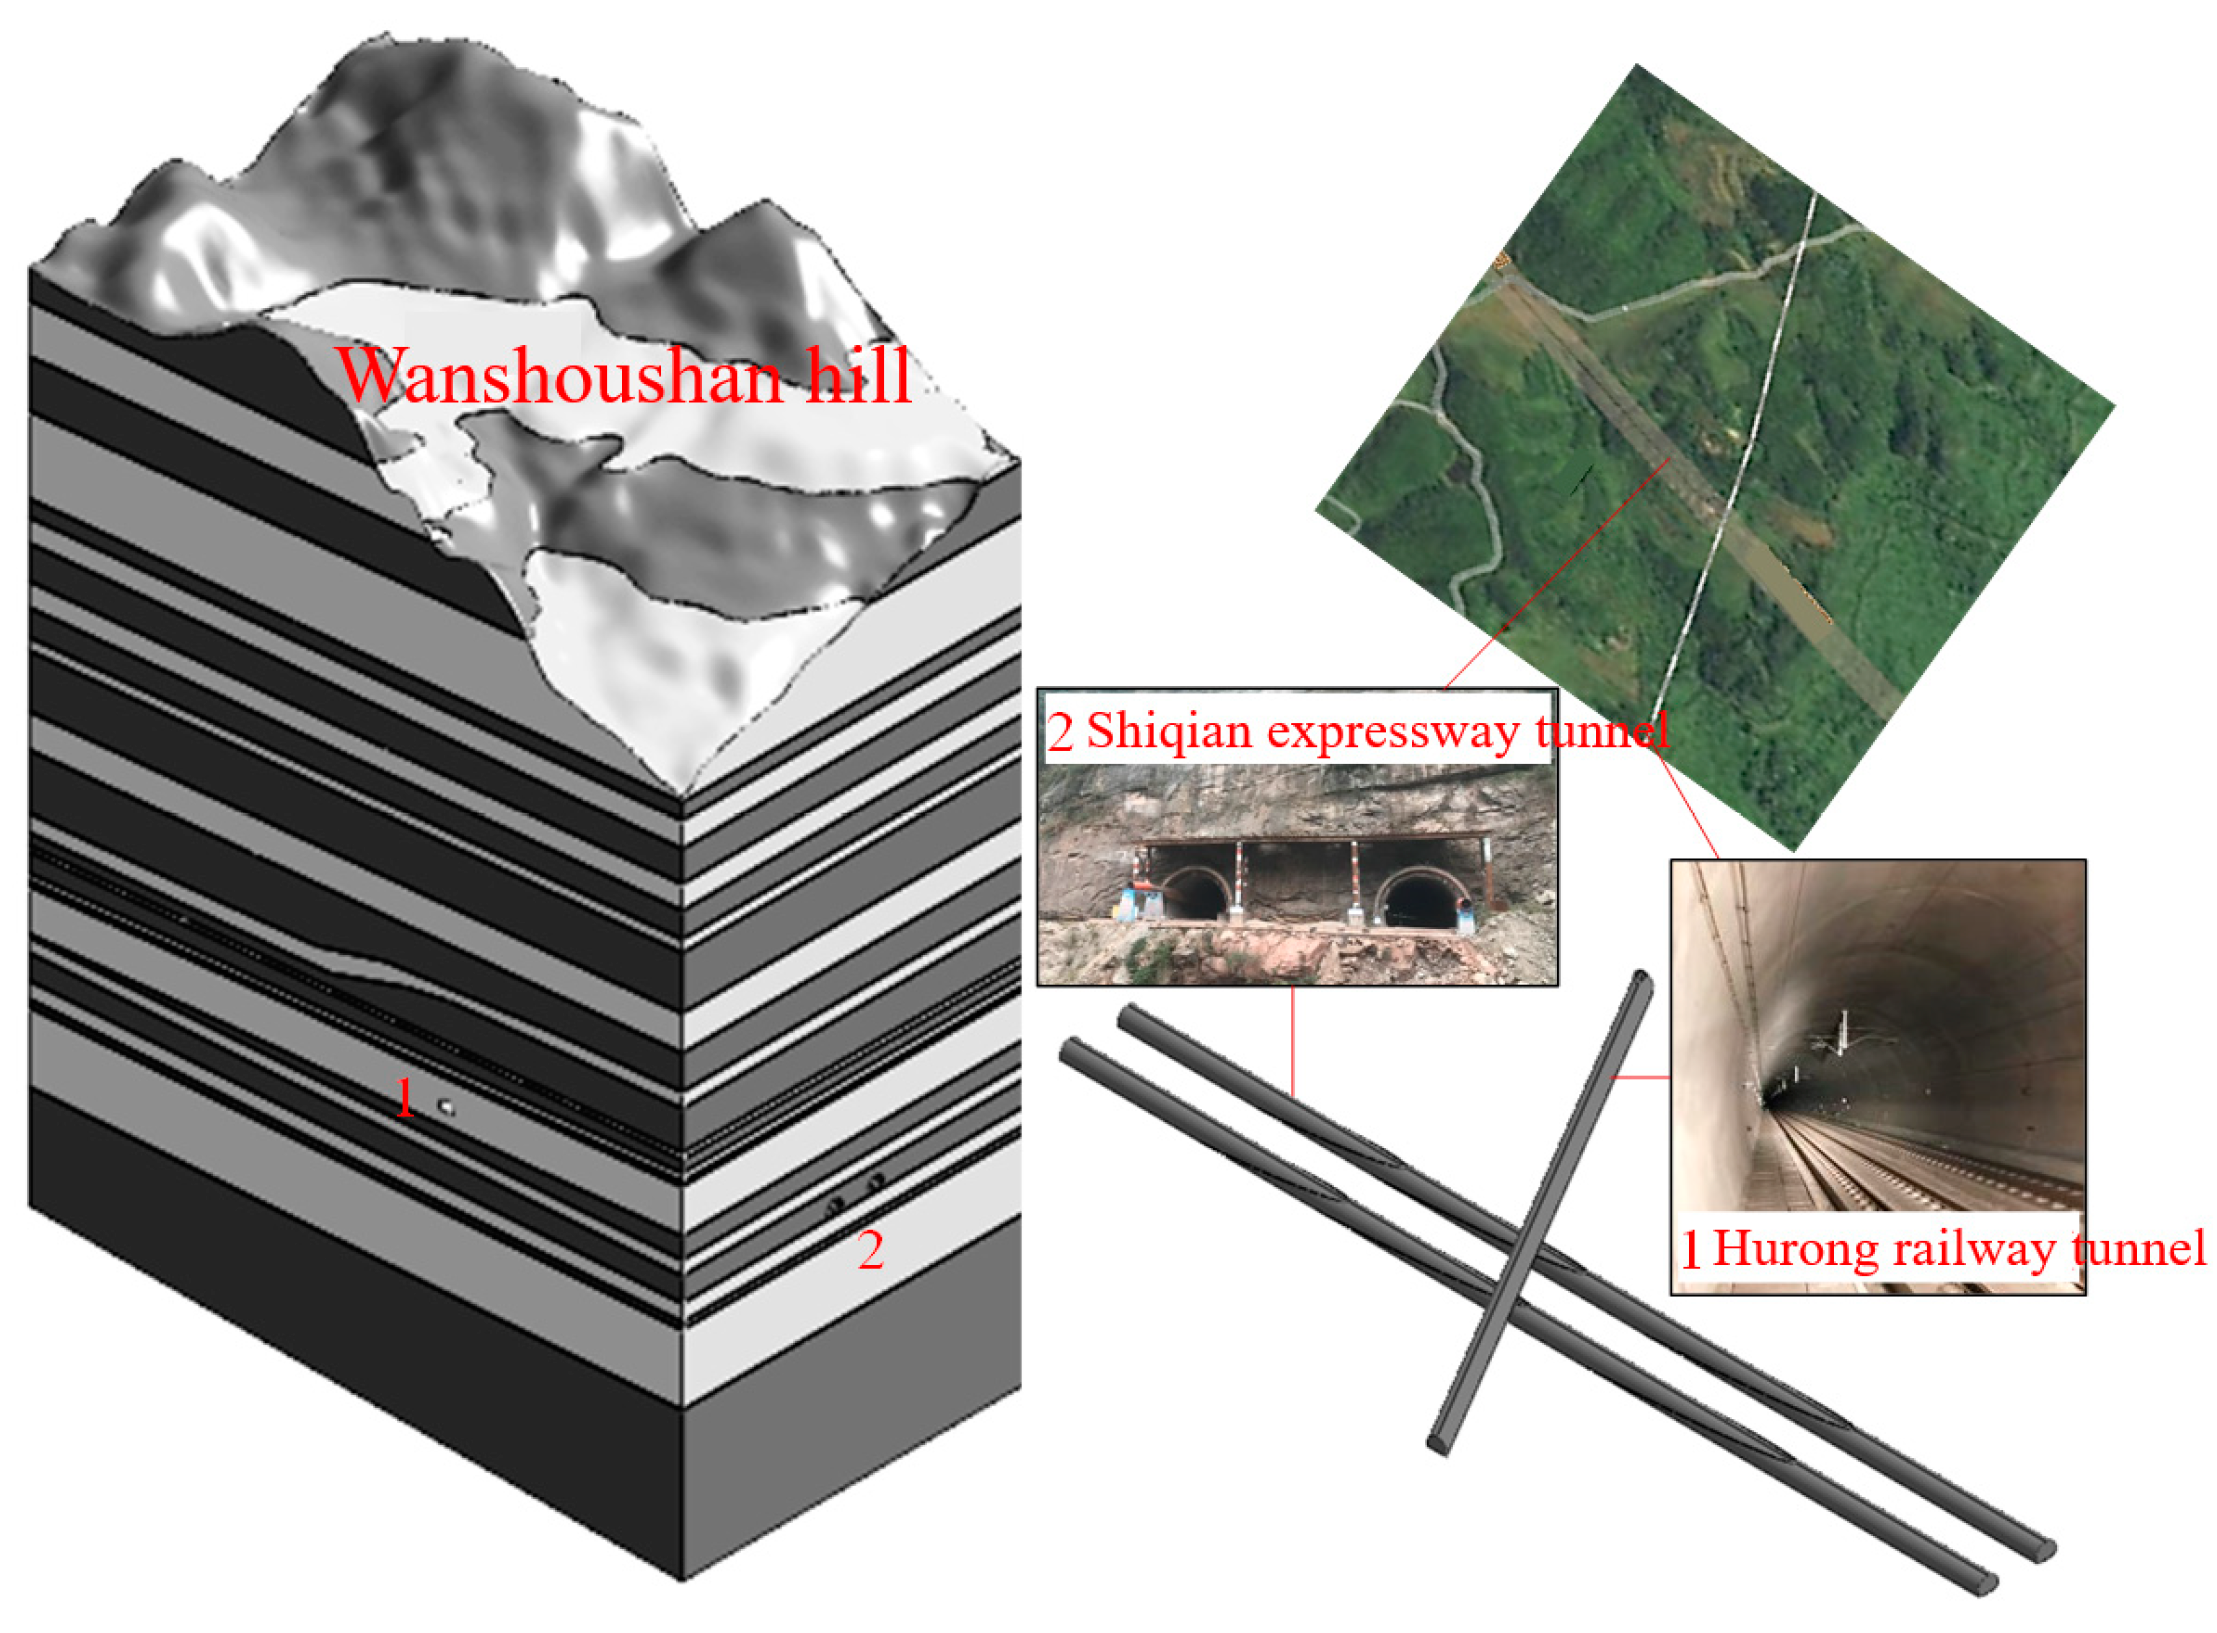
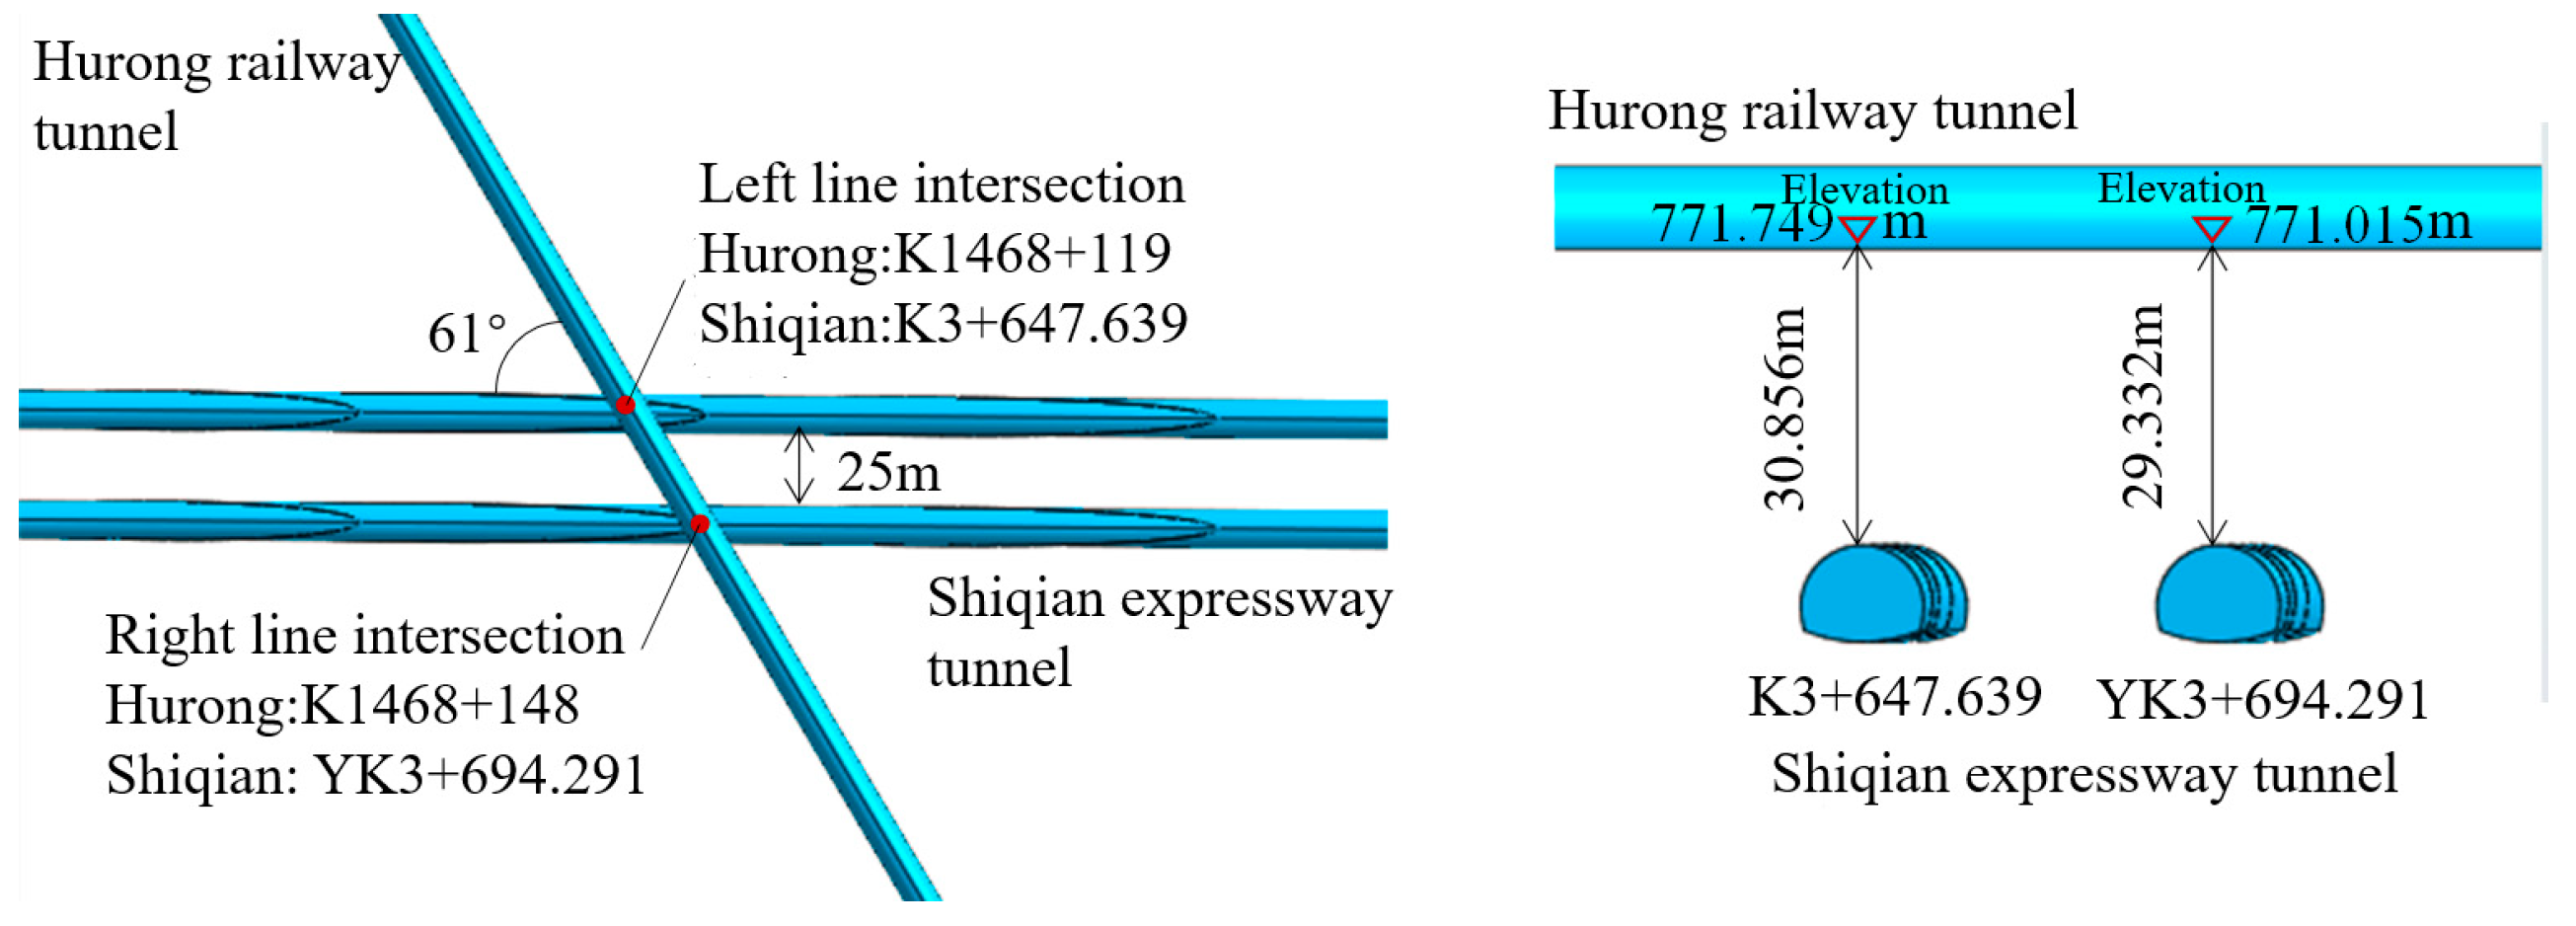
2.1. Engineering Background

The research project described in this paper focuses on the cross tunnel between the Hurong railway and the Shiqian expressway at the Wanshoushan section. As Figure 1 shows, the Hurong Wanshoushan railway is a two-lane tunnel with one uphill side and a gradient of 15.5%. The maximum width of the tunnel clear section is 12.26 m, the height is 10.03 m, and the clear area is 99.49 m2. The Shiqian Wanshoushan highway tunnel is a detached double-bore tunnel, with a length of 2718 m on the left and 2729 m on the right. The maximum width of the tunnel’s clear section is 10.66 m, the height is 8.60 m, and the clear area is 76.85 m2.
As shown in Figure 2, the spacing of the two-lane Shiqian highway tunnel is 25 m, and it passes through the railroad tunnel in the form of a 61° oblique angle. The pile number of the left line intersection in the Shiqian highway tunnel is K3 + 674.943, the pile number in the Hurong railroad tunnel is K1468 + 119 (operation pile number), and the static spacing of the structure is 30.856 m; the pile number of the right line intersection in the Shiqian highway tunnel is YK3 + 694.291, the pile number of the Hurong railroad tunnel is K1468 + 148 (operation pile number), and the static spacing of the structure is 29.332 m.

2.2. Engineering Geological Conditions

The Shiqian expressway tunnel is approached from the Shizhu to Qianjiang direction, and the lower part of the tunnel crosses the surrounding rock of the Wanshoushan tunnel section of the Hurong railway. As shown in Figure 3, the lithology of the project area is mainly mudstone and malmstone, the inlet section and outlet section are class V surrounding rock, and the cave section is mainly class III and IV surrounding rock (necessary for the classification of surrounding rock).
The malmstone belongs to the Upper Shaximiao Formation of the Middle Jurassic, and it is a hard rock. The direction of the rock strata intersects with the axis of the cave at an angle of 32°; the inclination of the rock strata is about 10~12°, and two groups of joints are mainly developed. The rock body is more complete, with a thick layer structure, and the combination between layers is generally better.
The mudstone belongs to the Upper Shaximiao Formation of the Middle Jurassic, and it is a soft rock, and the thickness of the mudstone is thin. The direction of the rock layer intersects with the axis of the cave at an angle of 25~26°, the inclination of the rock layer is about 11°, and two groups of joints are mainly developed. The rock body is more complete; for the thin medium-thick layer structure, the combination between layers is generally good.
Tunnels go through the area of lithology for the mudstone and malmstone. They are weak water-bearing strata that are part of the fissure and are a more developed section of the existence of a drop-shaped or linear outflow of water. The tunnel body is an elliptical isolated hill, surface water and groundwater drainage conditions are good and groundwater is not erosive to the concrete structure, so the impact of groundwater is ignored. The peak acceleration of ground vibration in the survey area is 0.05 g, and the intensity of seismic defense of buildings is 6 degrees.

3. Three-Dimensional Numerical Model

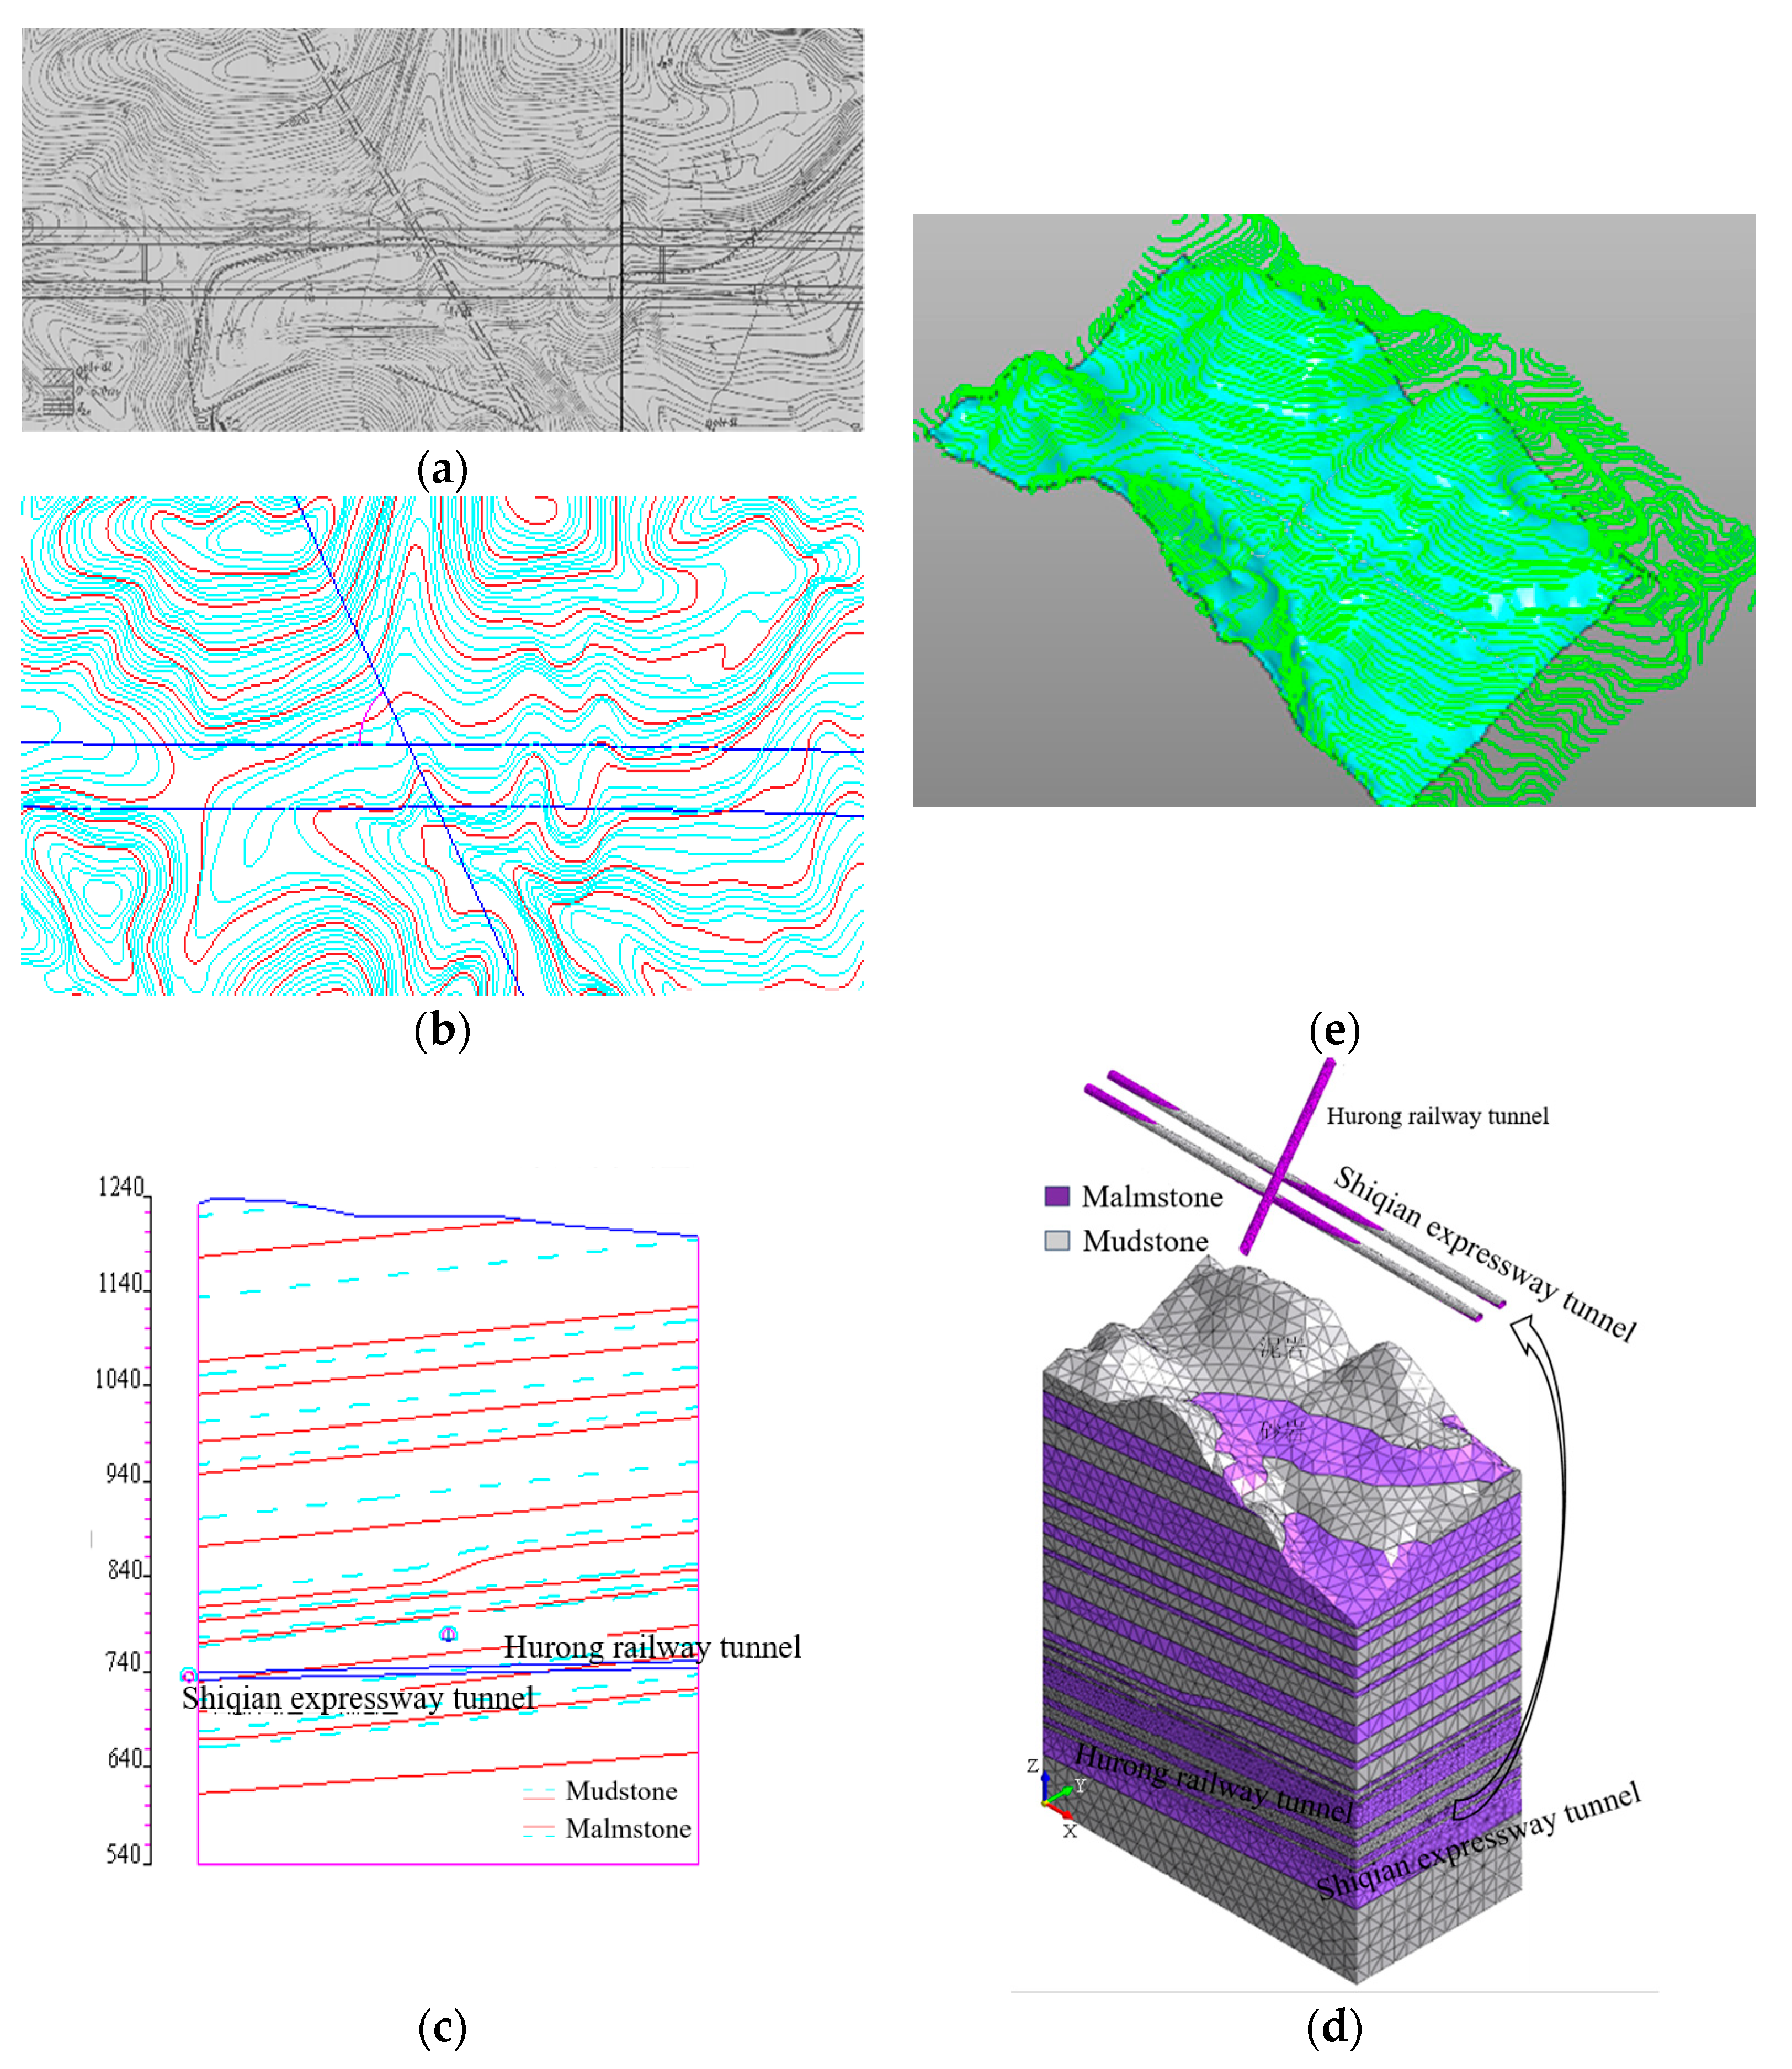
3.1. Finite Element Calculation Model

In this paper, a 3D geologic model is created by Midas GTS NX 2022 software developed for the geotechnical field. In order to minimize the negative influence of the boundary constraints on the calculation results in the finite element model, the left and right outer boundaries are taken to be 3–5 times the width of the excavation area, and the upper and lower boundaries are taken to be 3–5 times the height of the excavation area. The length (X direction) × width (Y direction) × height (Z direction) of the finite element model is 600 m × 316 m × 749.6 m, and it can be considered to be unaffected by construction factors, such as excavation, etc., outside the taken range.
The boundary constraints imposed during the calculation are the following: the ground surface is free constraint; the front and rear boundaries of the model are constrained by displacement in the Y-axis direction and the left and right boundaries are constrained by displacement in the X-axis direction due to the presence of extrusion in the subsurface geotechnical body; and the lower boundaries of the model are fixed constraints, which limit the vertical and horizontal displacements and rotations.
The 3D solid model building process is shown in Figure 4. Firstly, according to the contour data of the actual geological topographic map, the TGM (terrain generator) in GTS NX is used to generate the actual free ground surface, the solid model is generated according to the dimensions, and finally, the solid model is generated by combining the stratigraphic section, the tunnel dimensions, and the spatial relationship.
This paper uses isotropic three-dimensional tetrahedral structural units to simulate mudstone and malmstone with the extended Drucker–Prager yield criterion.
The traditional Drucker–Prager criterion overcomes the weaknesses of the Mohr–Coulomb criterion by considering the effect of intermediate principal stresses on yielding and damage, and the yield surface is smooth and without edges. However, the disadvantage is that it does not consider the nonlinear characteristics of yielding and damage and the characteristics of geotechnical materials with unequal compressive strengths on the flat surface, and the approximation of the actual damage conditions is poor. The Midas GTS NX 2022 finite element software used in this paper extends the classical Drucker–Prager model, and the shape of the yield surface in the meridional plane can be simulated by a linear function, hyperbolic function, or exponential function model.
The surrounding rocks around the tunnel structure are symmetrically seeded with linear gradients to divide the fine cells and improve the calculation accuracy, with a grid size of 2~10 m, and the 3D grid model is generated with 689,200 cells after giving the rock parameters and the intrinsic model.

3.2. Finite Element Calculation Parameters

3.2.1. Static Loads for New Tunnel Excavation

1. Basic parameters
Mudstone and malmstone specimens were taken from a typical Class IV perimeter rock section of the Shiqian Wanshoushan Highway Tunnel, and density tests, uniaxial compression and deformation tests, and triaxial compression tests were conducted [6]. Table 1 shows the parameters of the peripheral rock support of the Shiqian Wanshoushan highway tunnel.
As shown in Figure 5, the peripheral rock support of the Shiqian Wanshoushan highway tunnel is shown. Anchor support is discounted to the modulus of elasticity of the rock body in the reinforced area by stiffness, the steel frame and grid support are discounted to the initial lining of sprayed concrete by stiffness, and the reinforced area of rock anchors is estimated according to Duraksha’s formula [28], the steel frame or grid discounting formula:
EC = Ec0 + Sg × Eg/Sc
where: EC is the modulus of elasticity of the spray concrete after conversion (MPa); Ec0 is the modulus of the elasticity of the original spray concrete (MPa); Sg is the steel frame or grille frame cross-sectional area (m2); Eg is the modulus of the elasticity of the steel frame or grill (MPa); and Sc is the cross-sectional area of the concrete (m2).
The anchor support discount formula:
Er = Er0 + Vb × Eb/Vr
where Er is the modulus of the elasticity of the rock mass after conversion (MPa); Er0 is the modulus of the elasticity of original spray concrete (MPa); Vb is the volume of the anchor rods in the support area (m3); Eb is the modulus of the elasticity of the anchor rod (MPa); and Vr is the volume of the rock body in the support area (m3).
The parameters of the mudstone and malmstone rock mass and the discounted anchor support and steel frame grating support are shown in Table 2.
2. Numerical simulation process
(1)
The corresponding rock properties are assigned to the strata, and the initial ground stress field is balanced. There is no influence of tectonic joints in the cross-section tunnel project, and the ground stress is considered according to the initial self-gravitational stress field.
(2)
Simulate the excavation of the whole section of the existing railroad tunnel, apply initial support and secondary lining, and zero the displacement field.
(3)
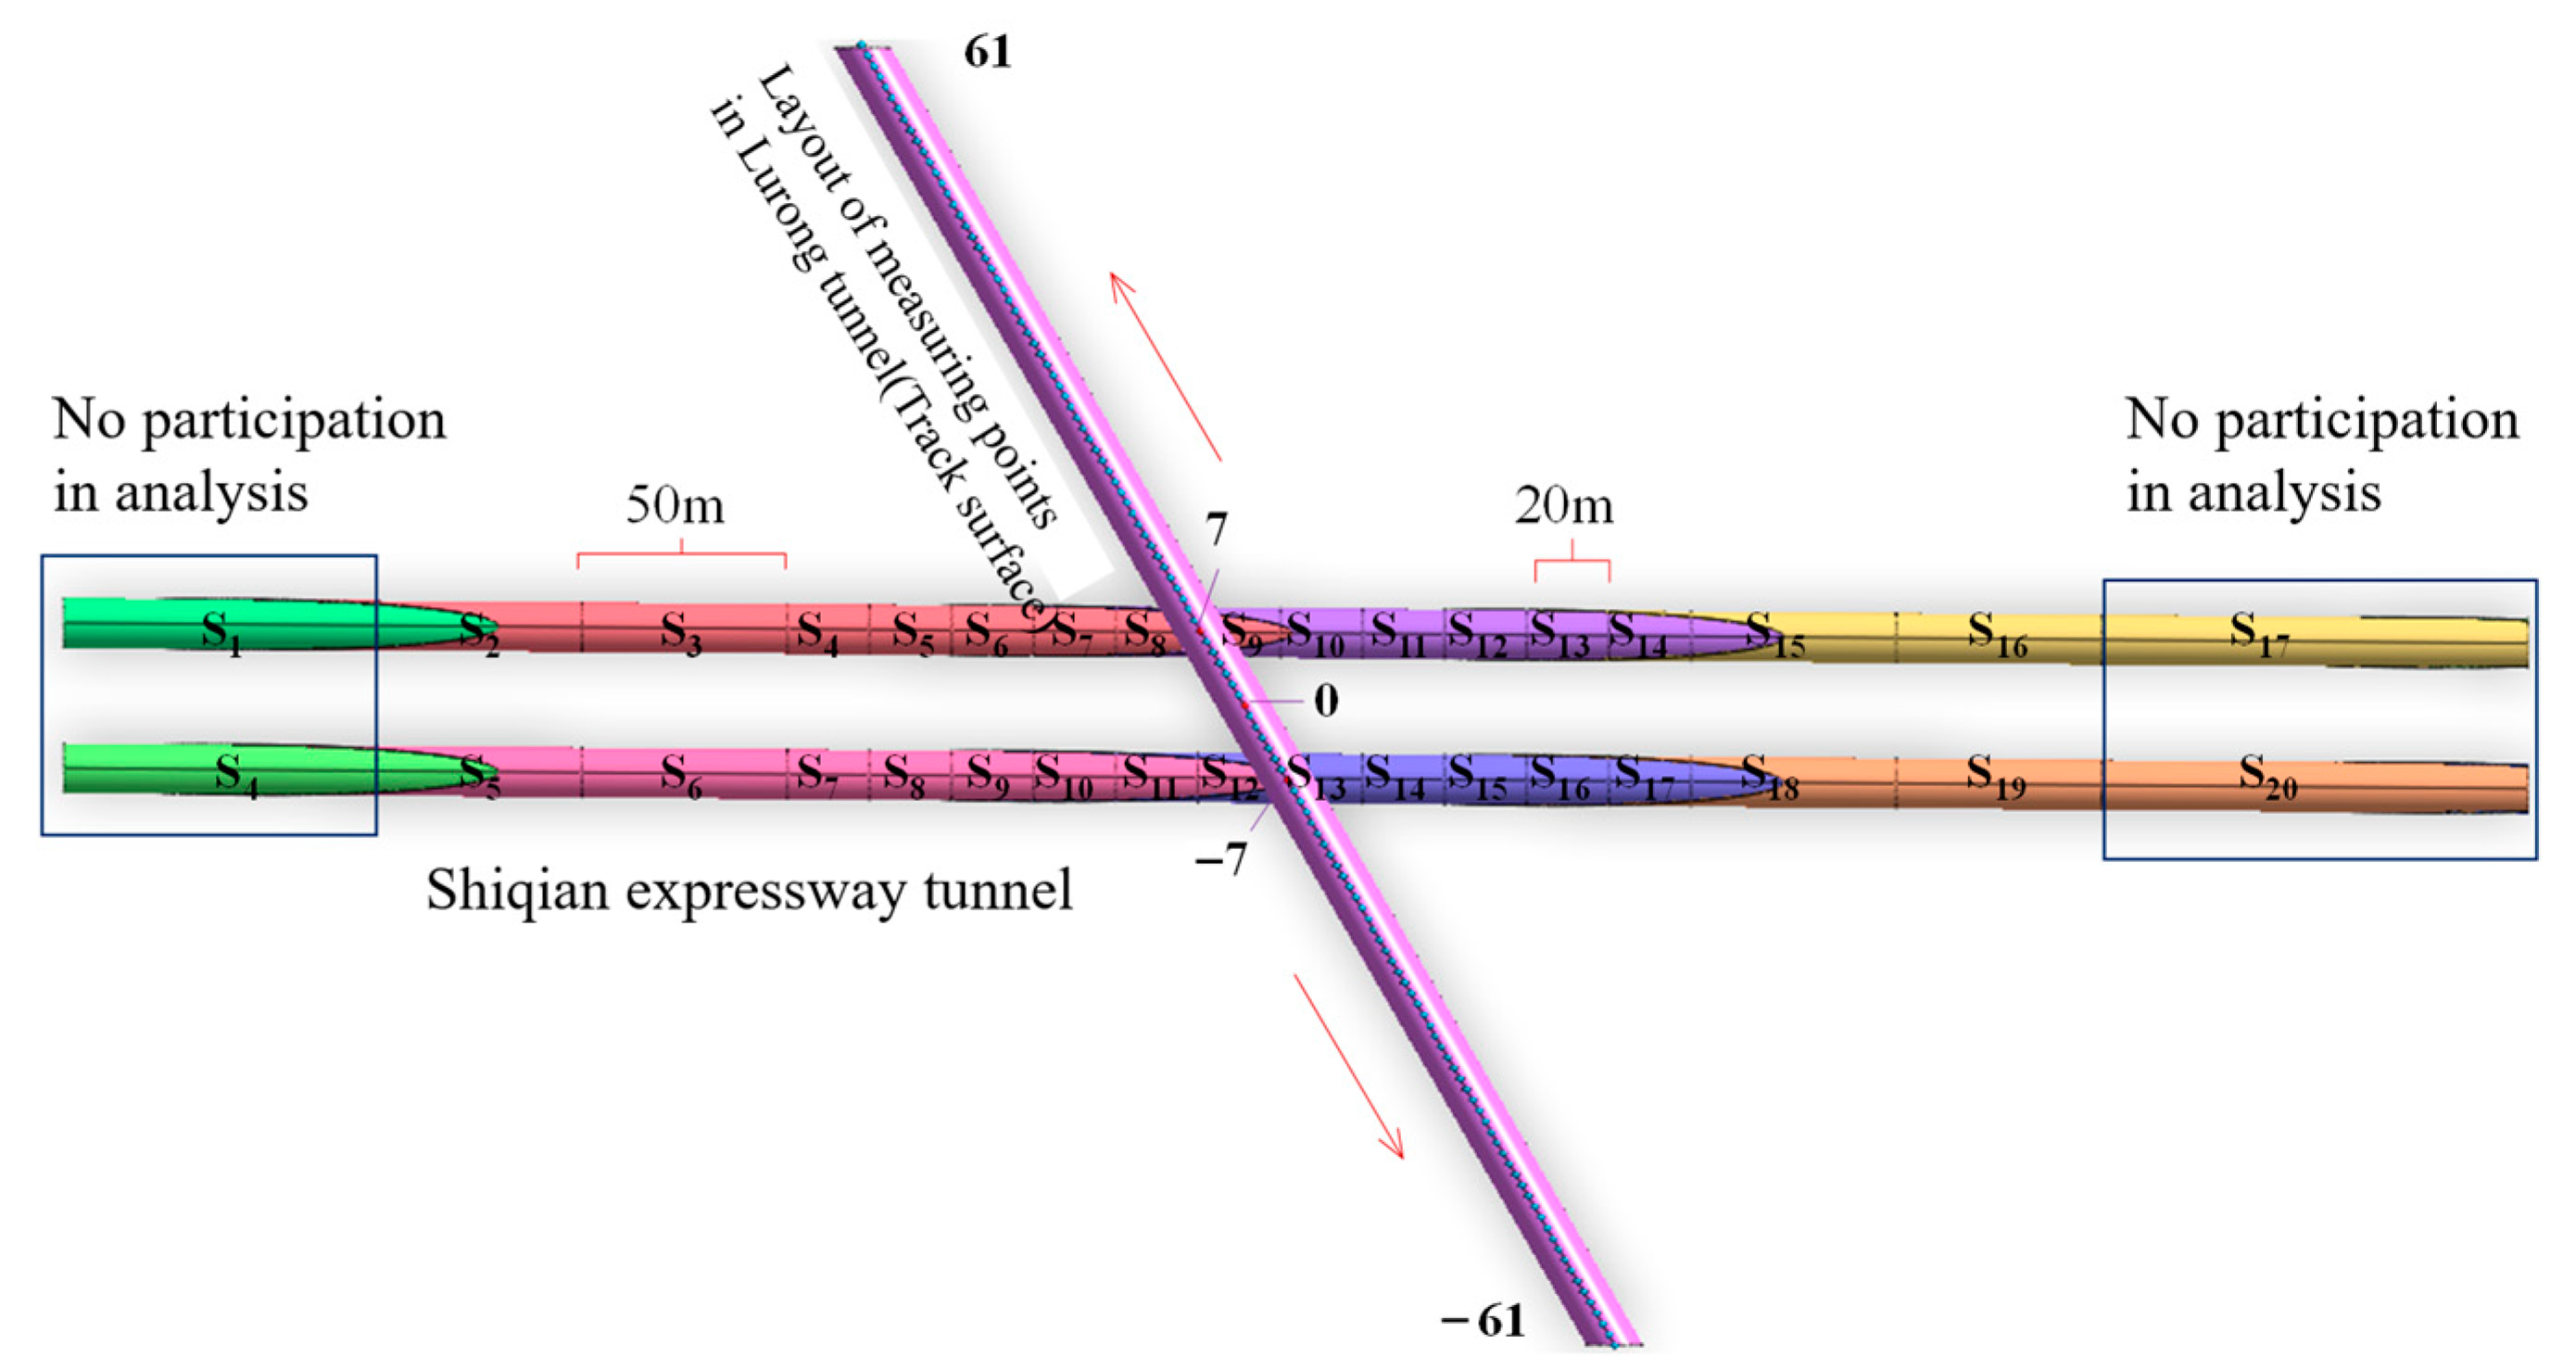
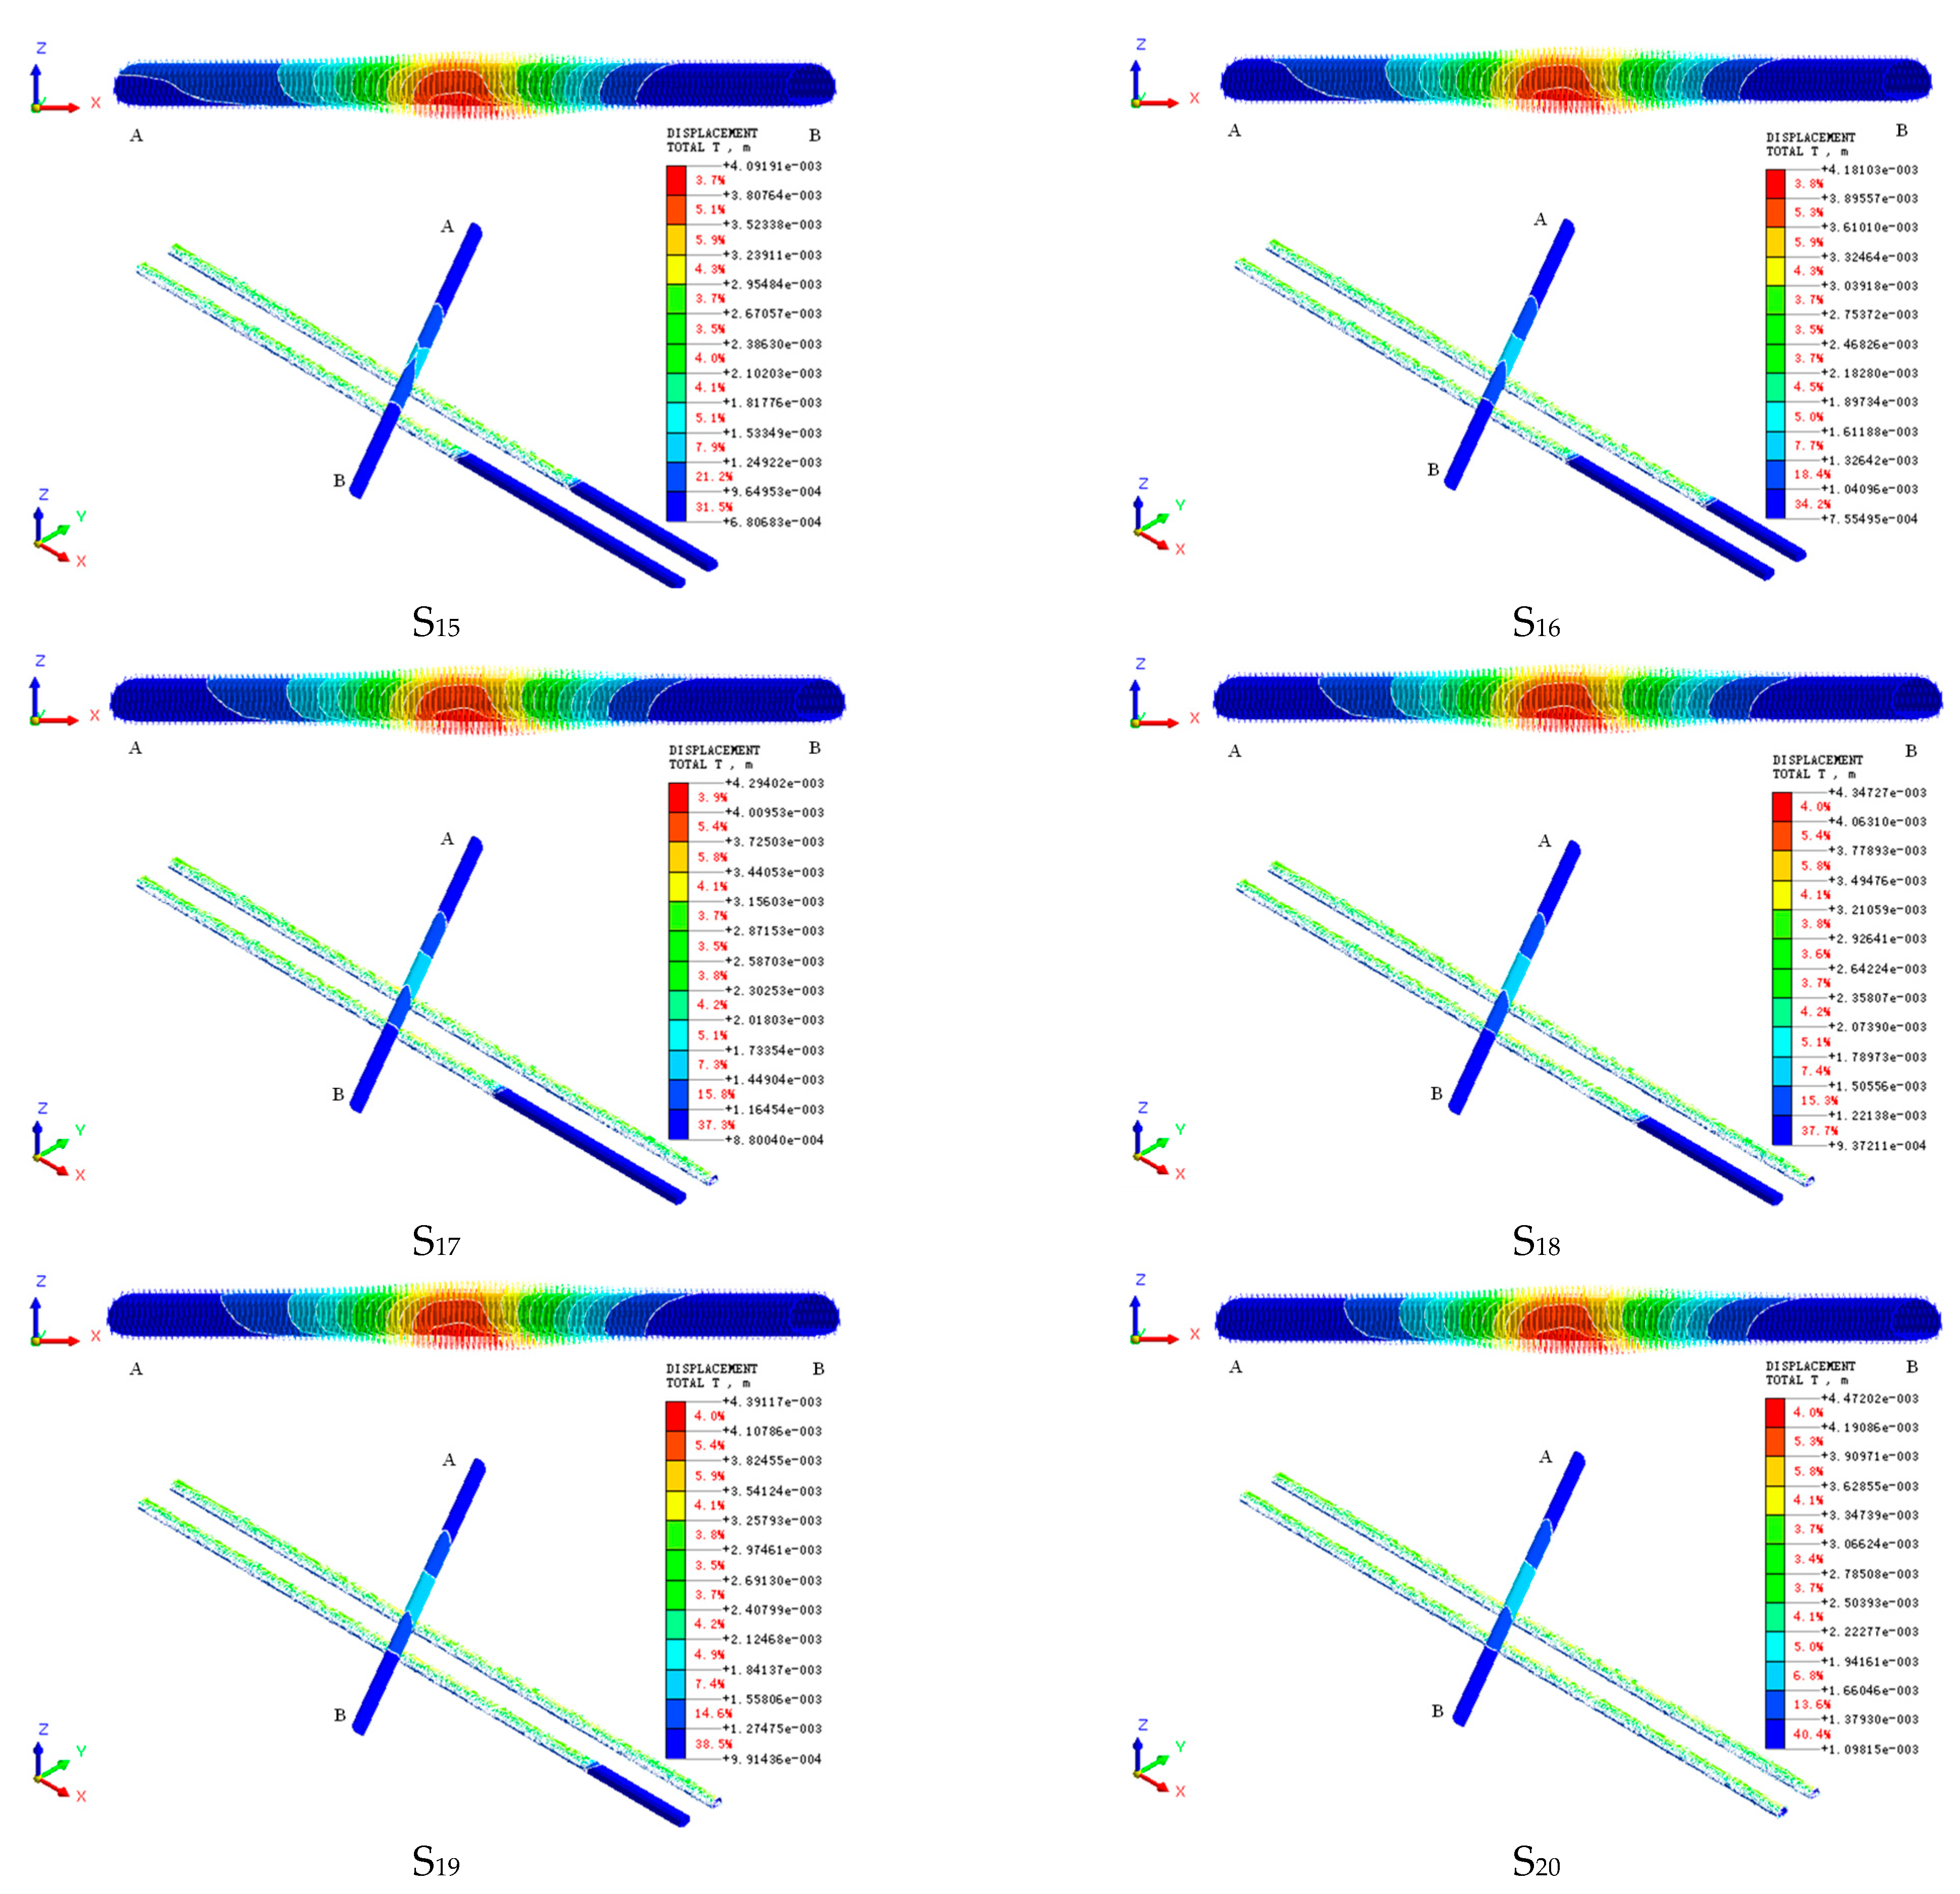
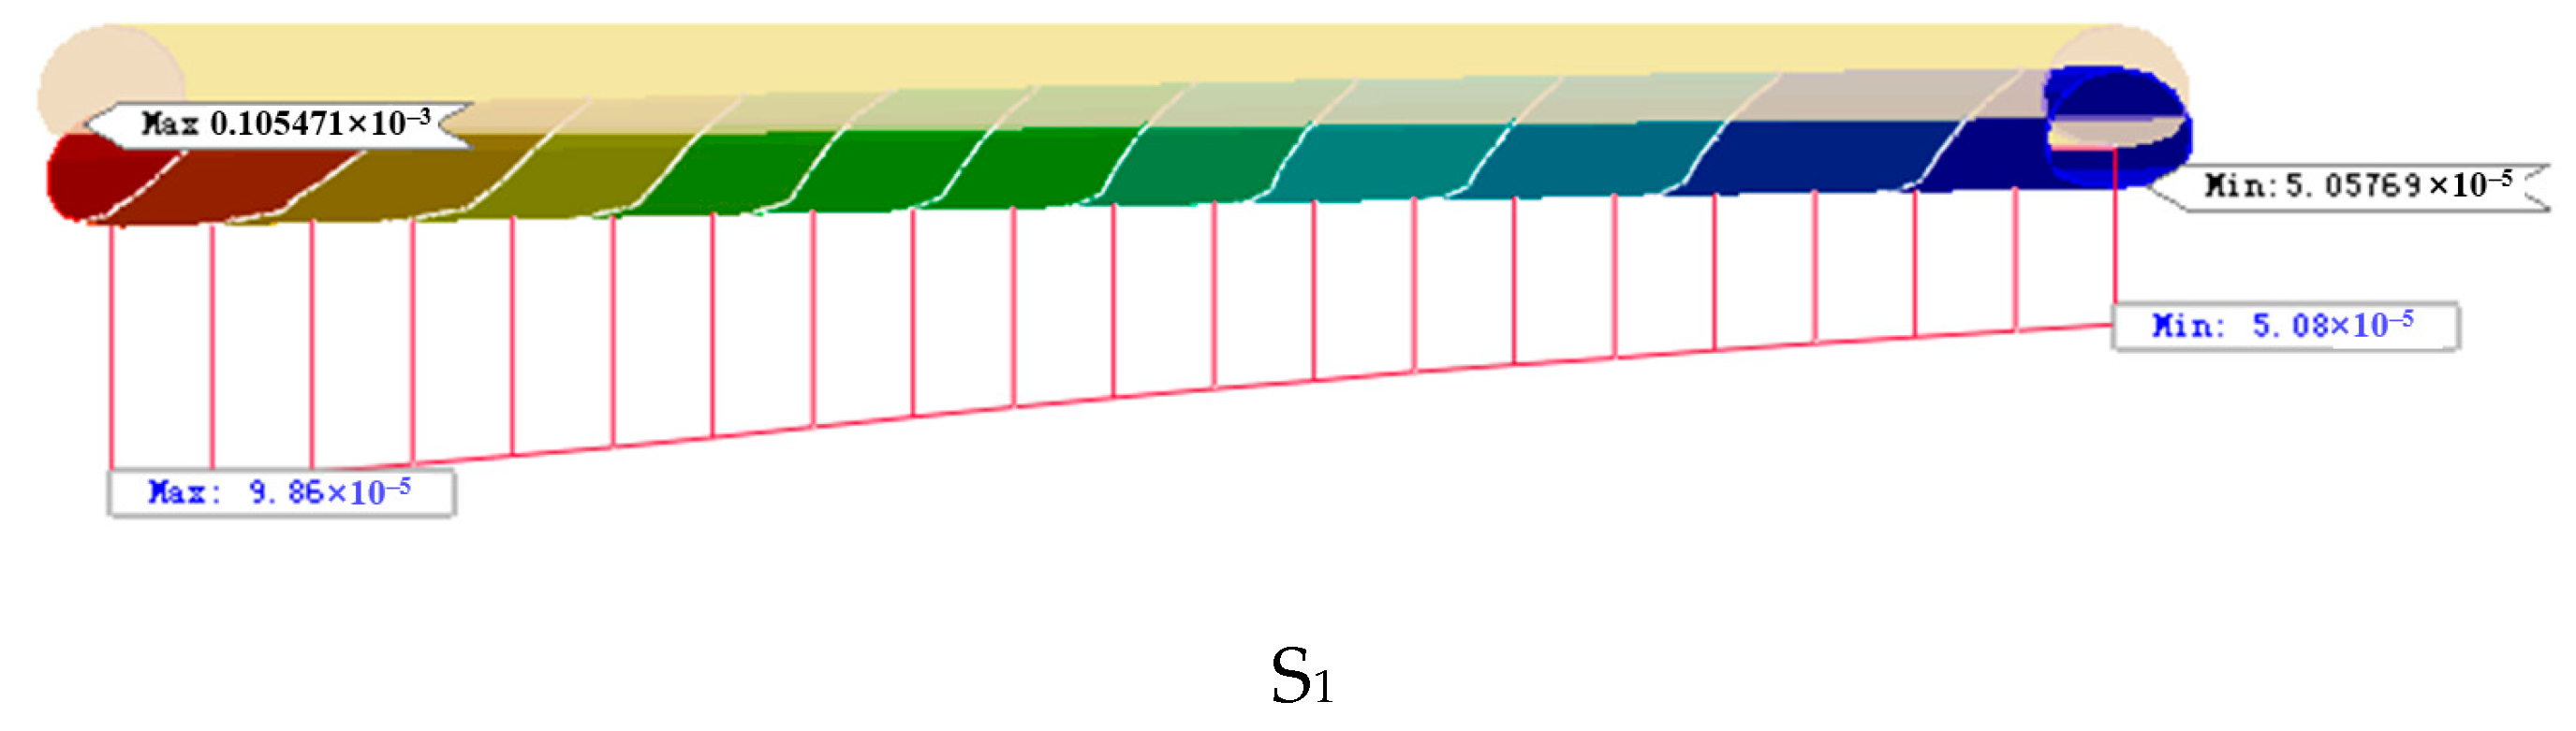
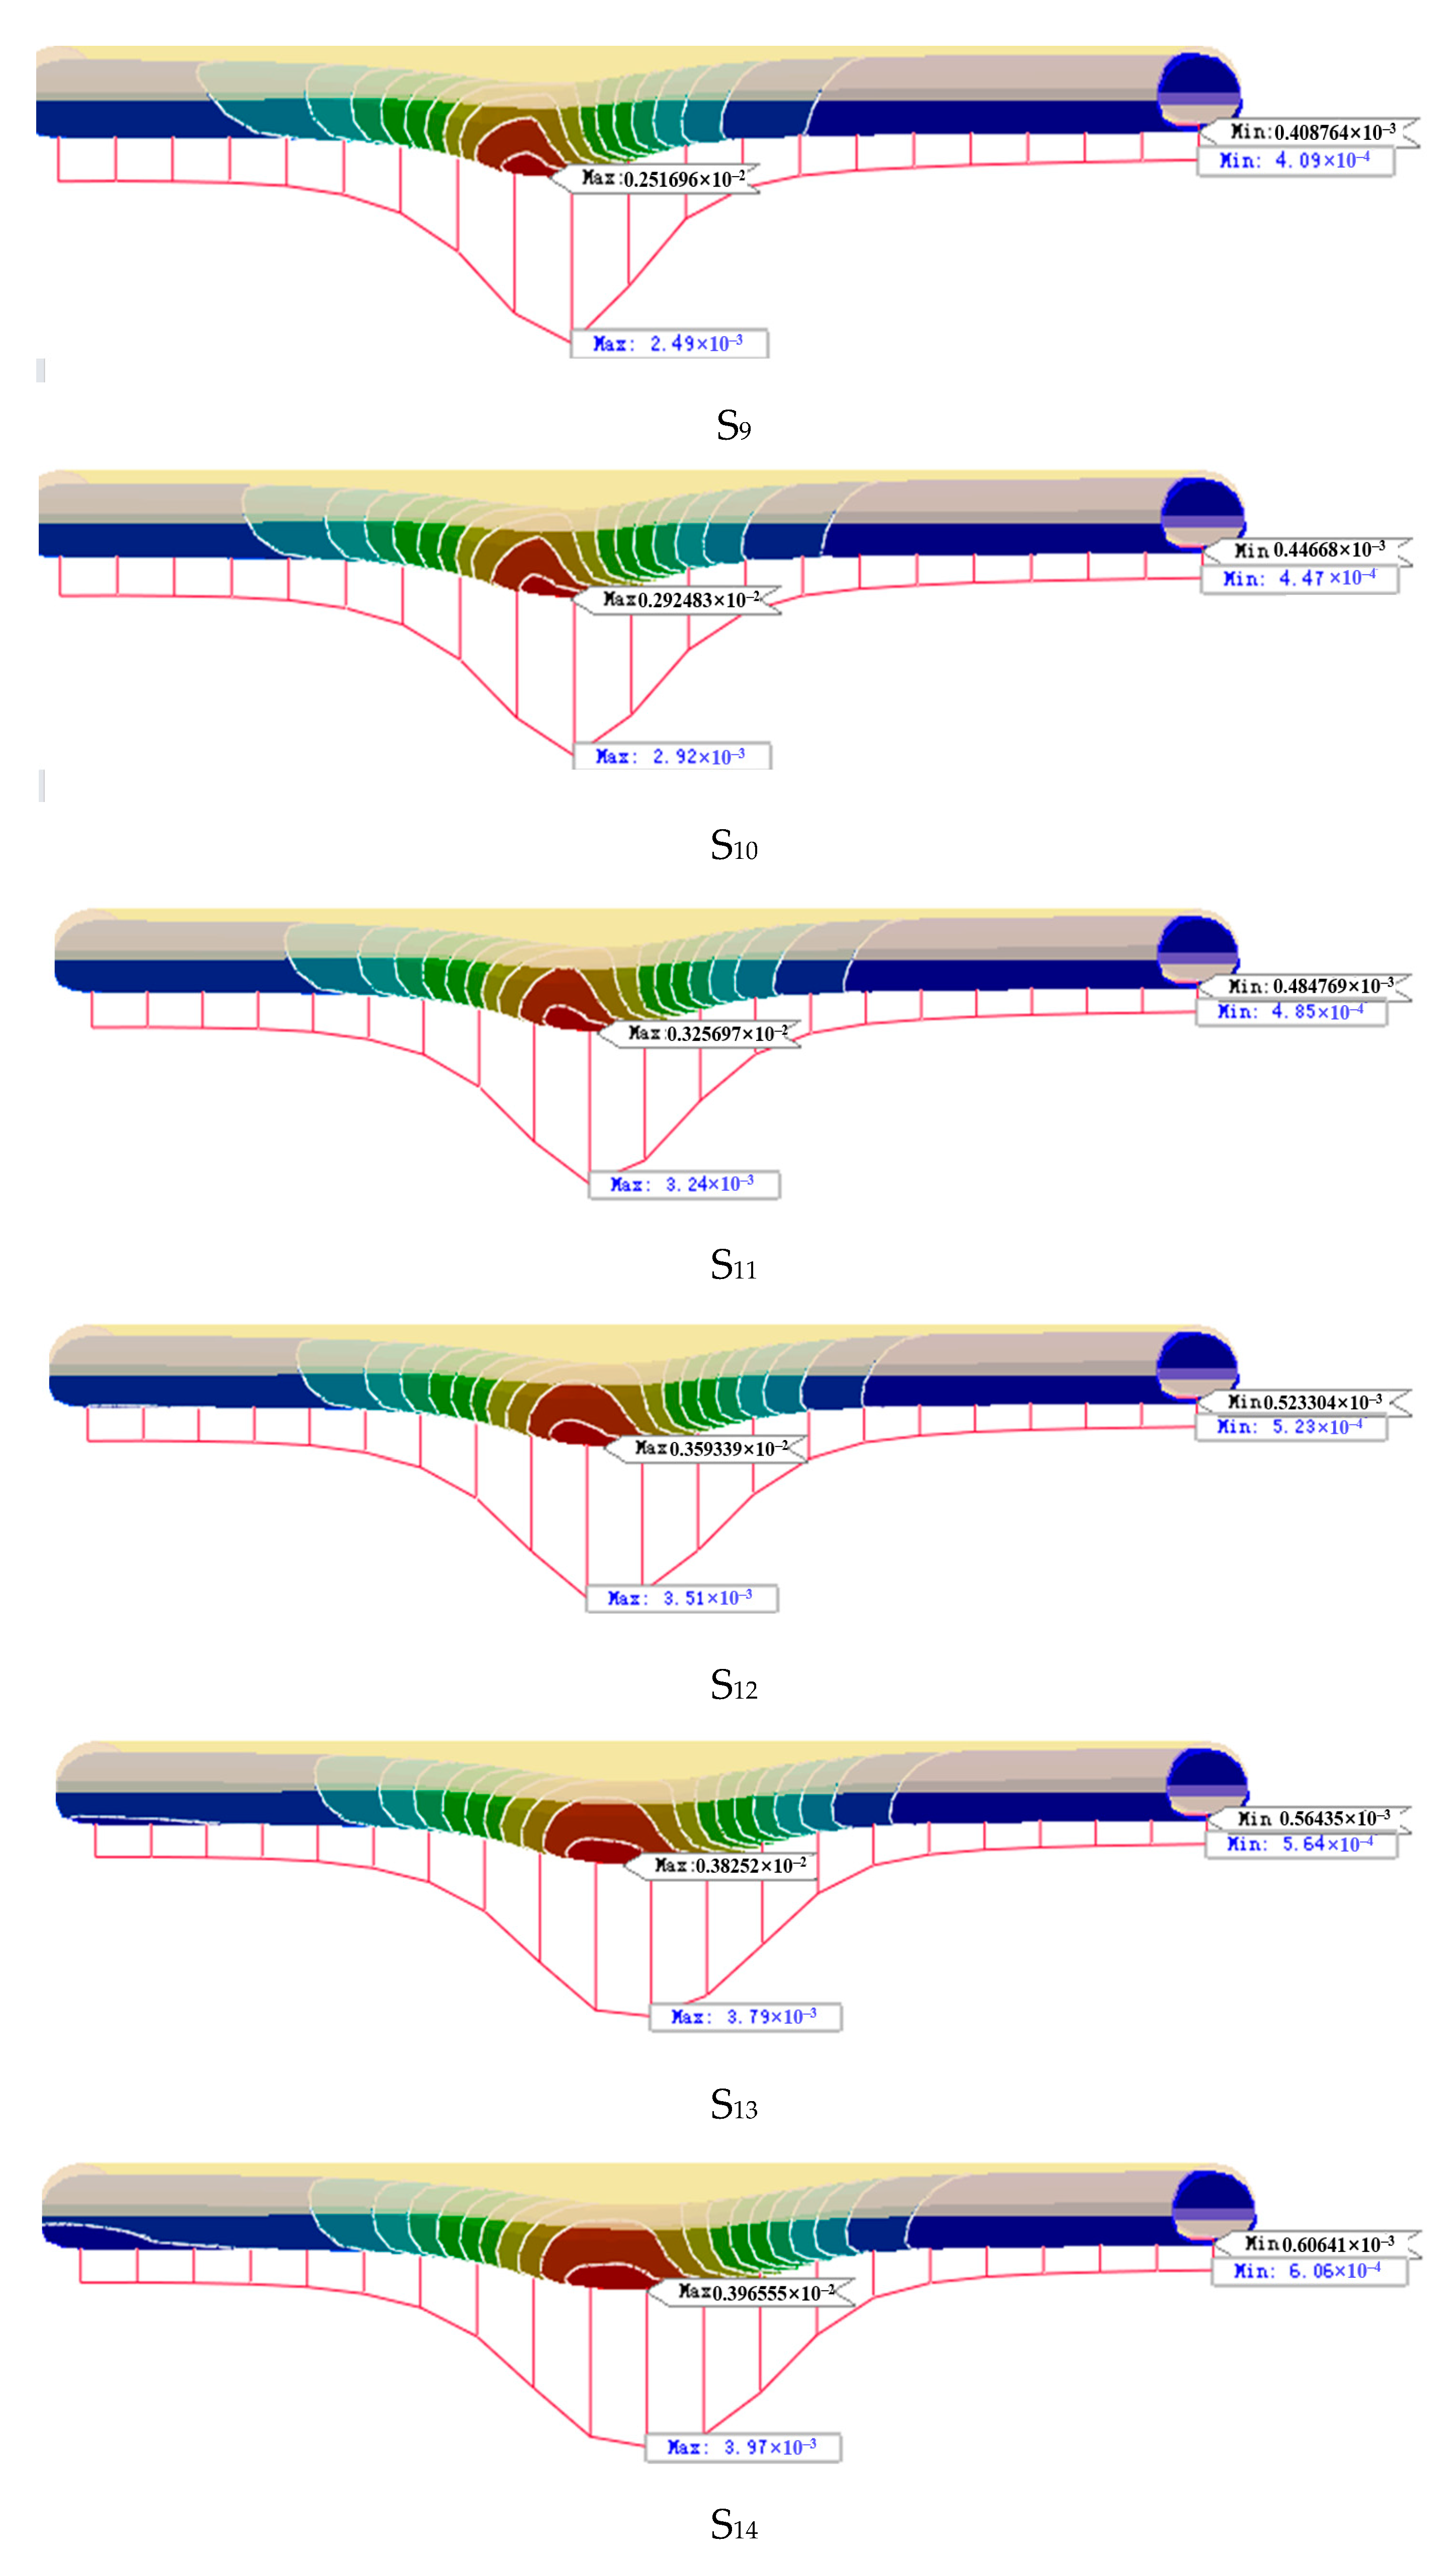
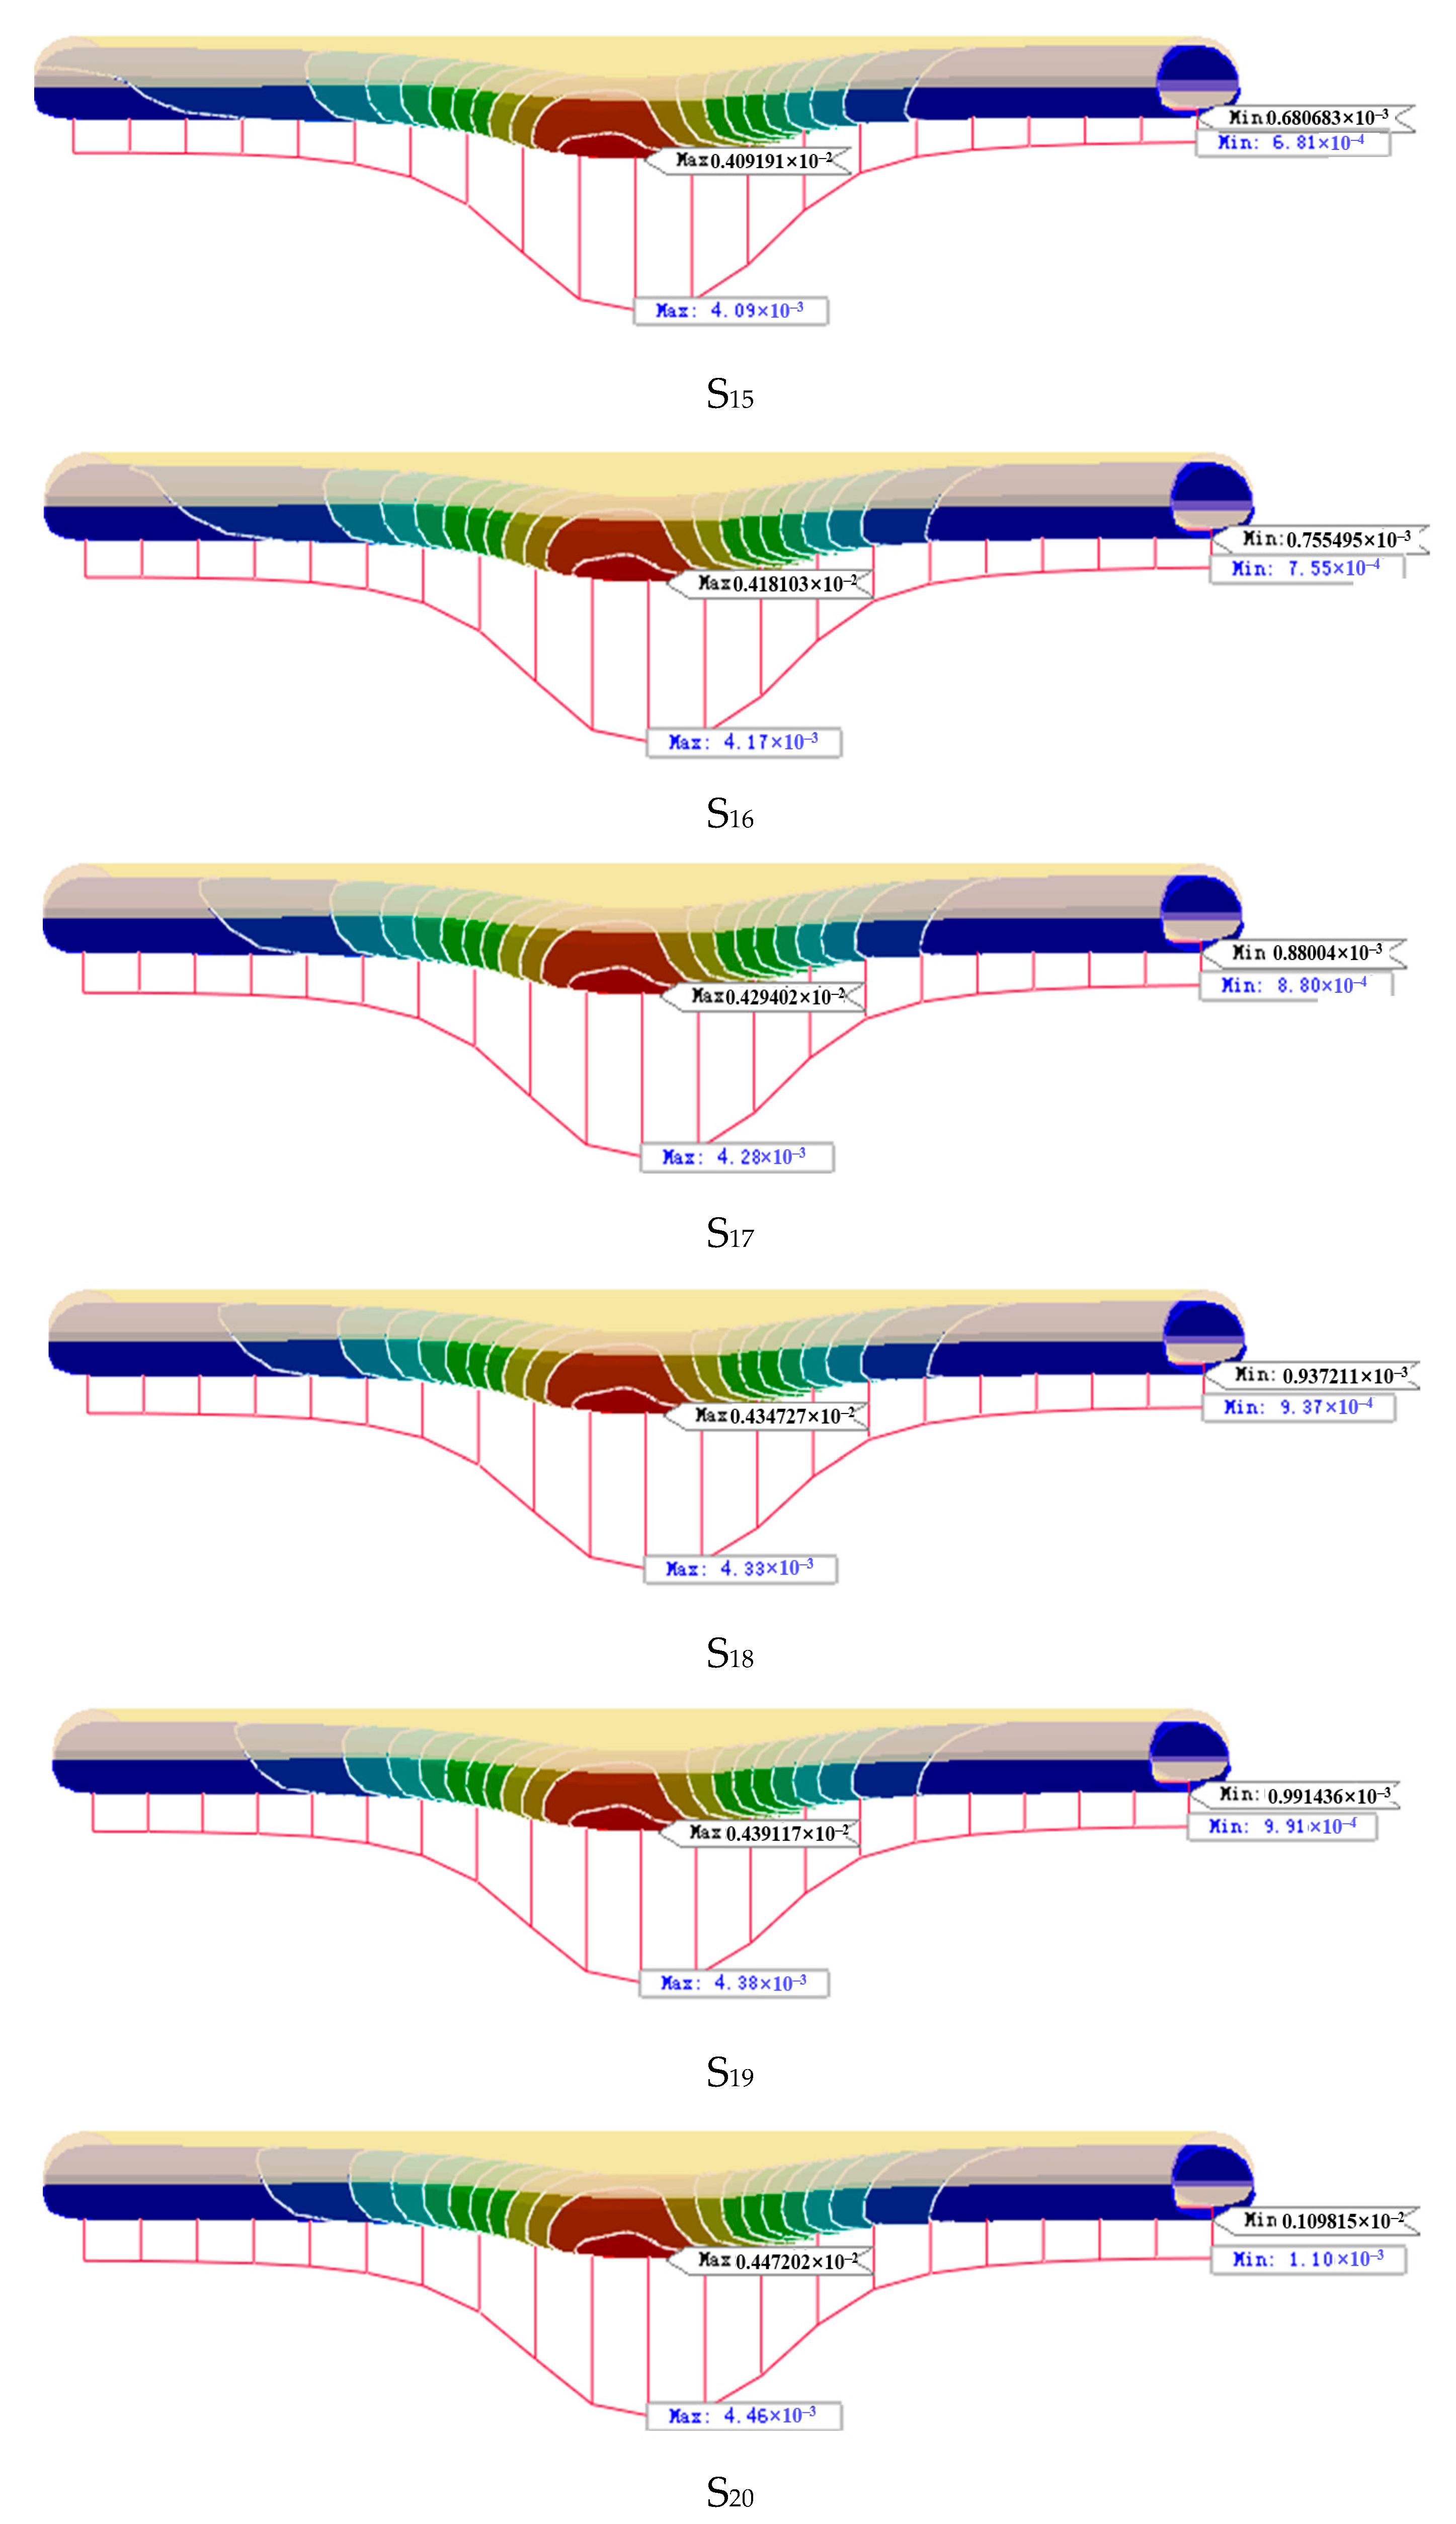
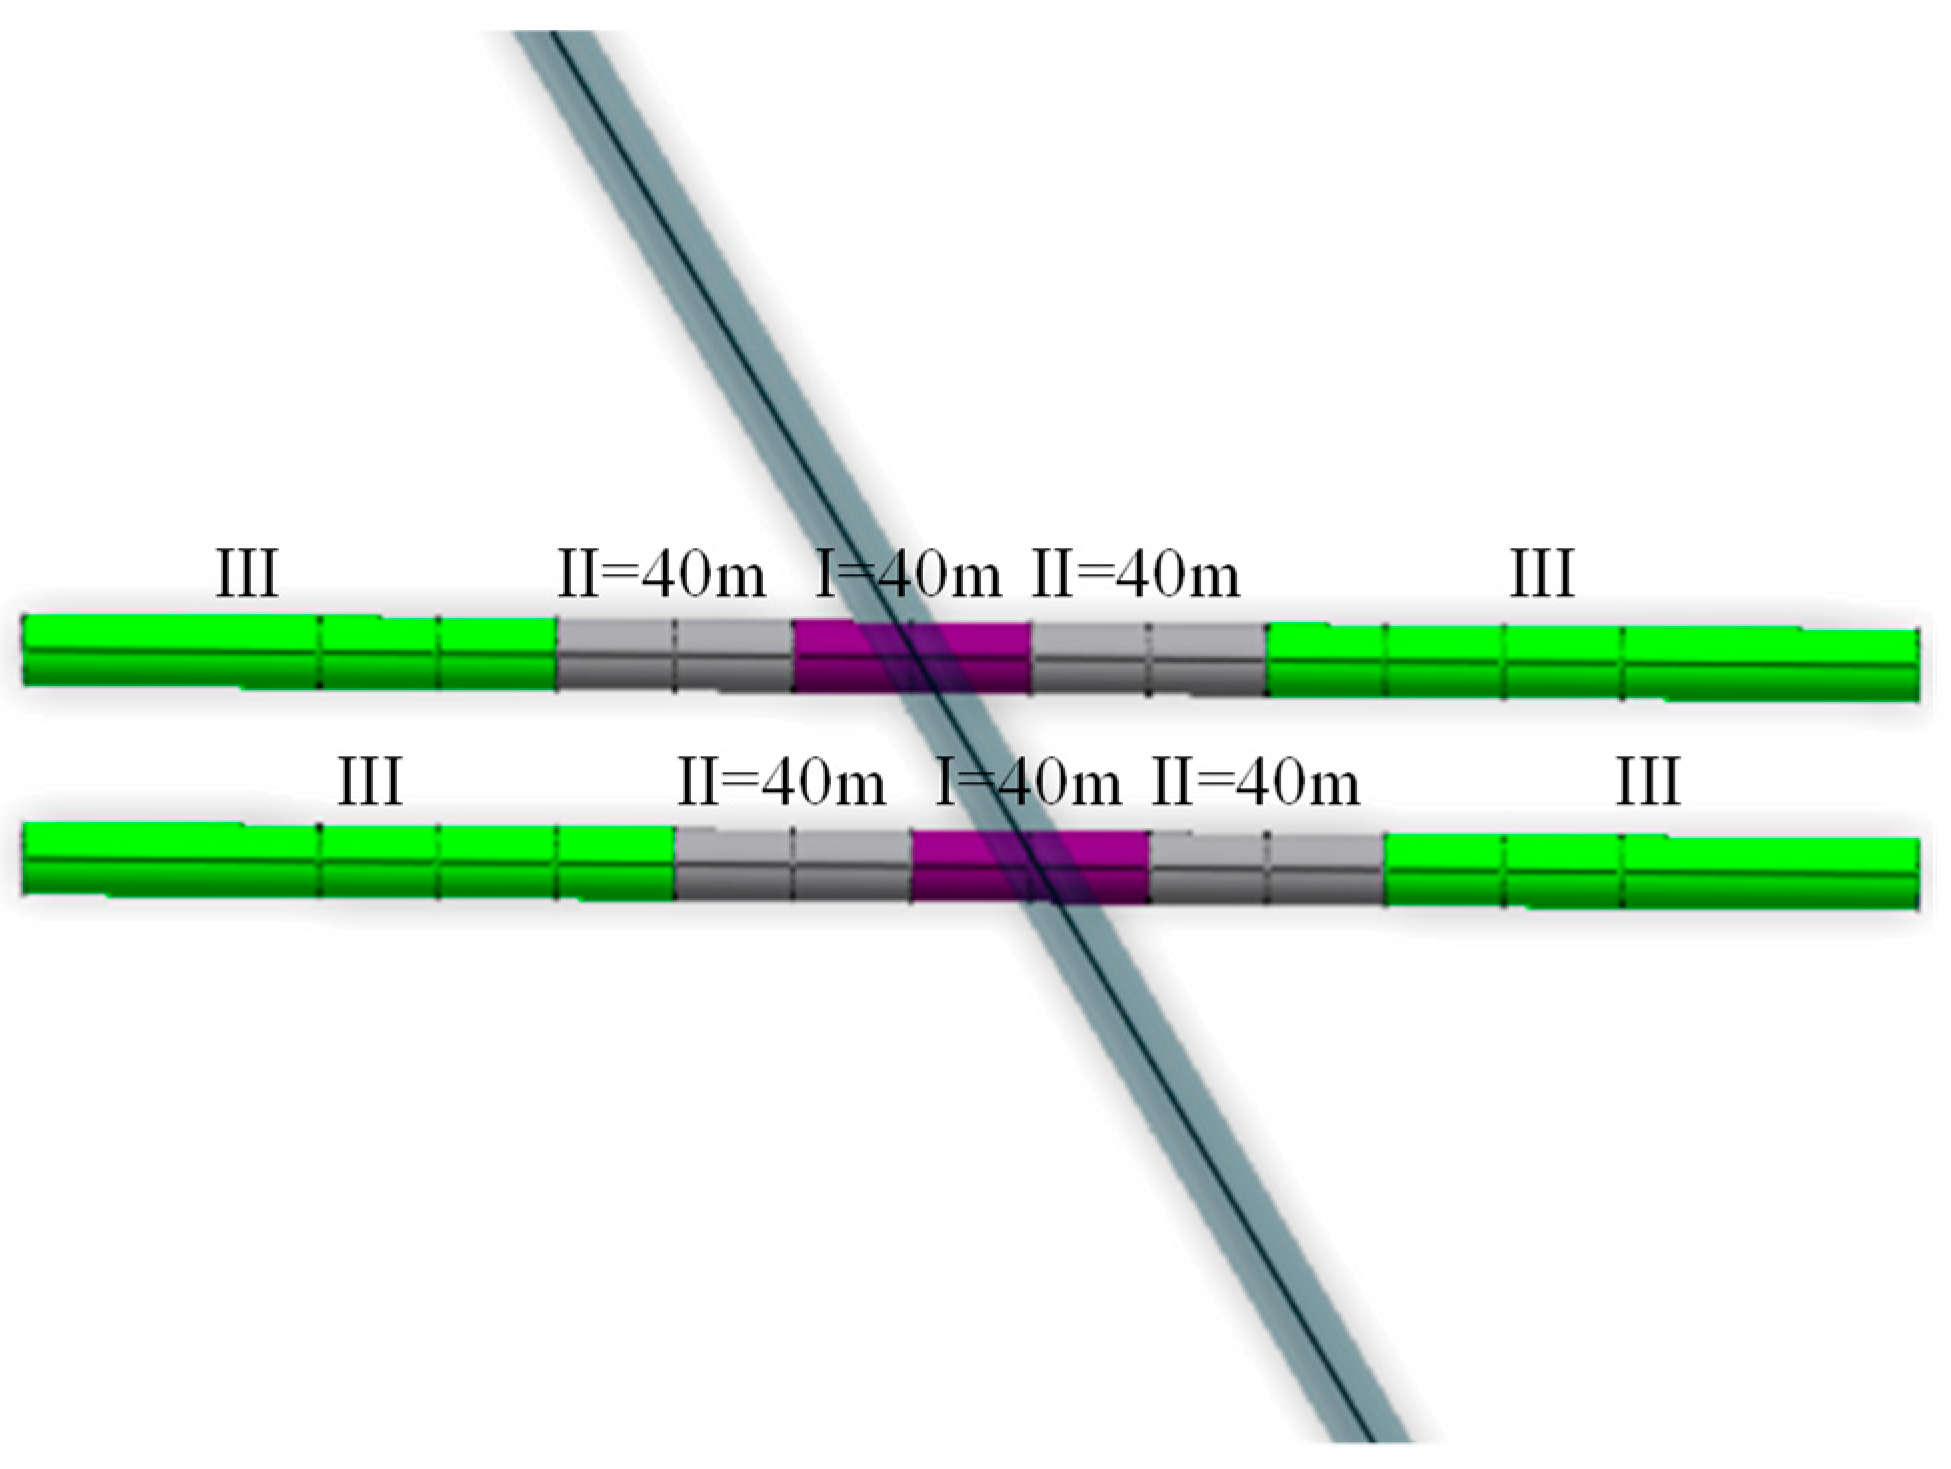
Excavation of the new highway tunnel. Tunnel each excavation at a footage of 2 m after the excavation for the initial support and secondary lining in order to facilitate data analysis for multiple excavation steps as a whole encapsulated into different data results extracted when the step is Si. Set the left side of the tunnel for the first excavation of the tunnel, from the inlet (left) to the exit (right) excavation, the right side of the tunnel for the excavation after the front and back of the tunnel difference of 3 Si, Si, and Nos. for the S1, S2, S3, and S20,…S20. The left holes S1 and S17 and the right holes S4 and S20 are the time step of going to the boundary effect, which is 90 m, respectively. The left hole is S2 = S3 = S15 = S16 = 50 m and S4 = S5 = S6 = S7 = S8 = S9 = S10 = S11 = S12 = S13 = S14 = 20 m. The right hole is S5 = S6 = S18 = S19 = S14 = 20 m, S6 = S18 = S19 = 50 m, and S7 = S8 = S9 = S10 = S11 = S12 = S13 = S14 = S15 = S16 = S17 = 20 m, as shown in Figure 6.
(4)
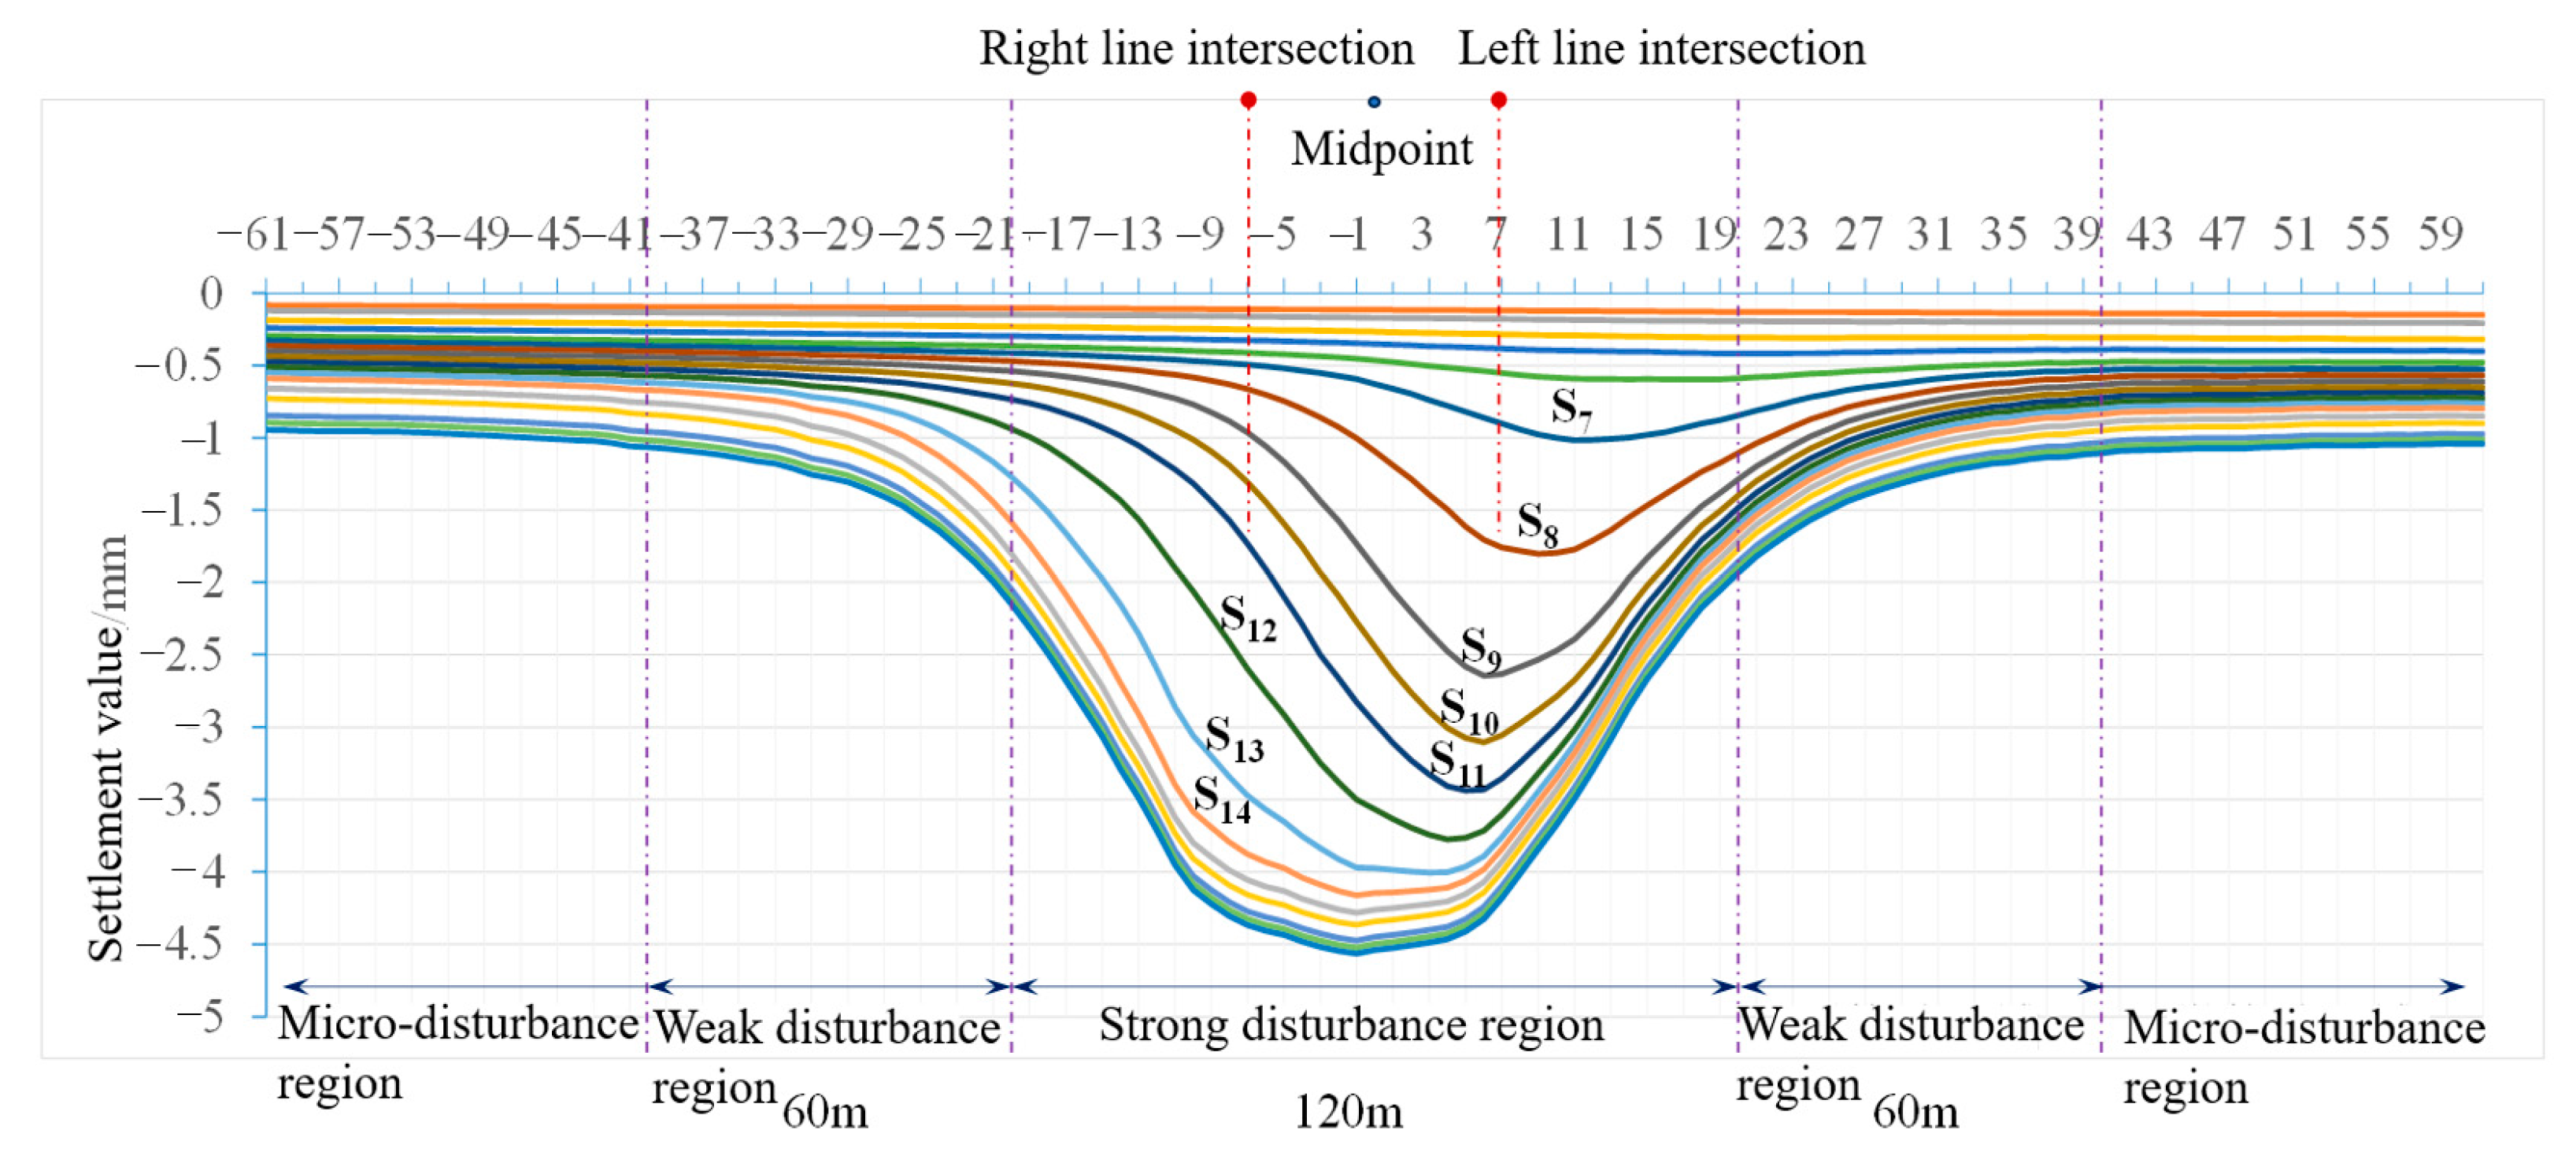
Layout of the monitoring points in the existing tunnels. Along the Hurong tunnel floor layout measurement points, the tunnel’s left and right intersection at the center of the line are set as 0 measurement points, the left hole extension line layout is set at 0~61 measurement points, the right hole extension line layout is set at 0~−61 measurement points at a measurement point interval distance of 3 m, including the 7th measurement point for the left line of the intersection and the −7th measurement point for the right line of the intersection.

3.2.2. Dynamic Blasting Loads for New Tunnels

1. Eigenvalue analysis
An eigenvalue is used to analyze the inherent dynamic characteristics of the structure, which is an important parameter for the design of the structure subjected to dynamic loads. Through the eigenvalue analysis [37], the dynamic characteristics of the structure such as vibration shape, self-oscillation period, and vibration parameter coefficients can be obtained.
The characteristic equations for the calculation of the vibration shape and intrinsic period are as follows:
K Φ ¯ n = ω n 2 M Φ ¯ n
where K is the stiffness matrix of the structure; M is the mass matrix of the structure; “ ω n 2 ” is the eigenvalue of the nth vibration mode; and “ Φ ¯ n ” is the eigenvector of the nth vibration mode, and the spatial iterative method is used to calculate the eigenvectors to converge [31].
(1)
Boundary conditions
According to the literature [31,38], an elastic boundary is defined by the curved surface spring, and the spring coefficient is calculated according to the foundation reaction coefficient of the road design code.
The vertical rock formation reaction force coefficient:
k v = k v 0 · ( B v / 30 ) 3 / 4
The horizontal rock formation reaction factor:
k h = k h 0 · ( B h / 30 ) 3 / 4
where kv0 = kh0 = E0/30 and Bv = Av1/2, Bh = Ah1/2. Av is the vertical cross-section area of the rock layer, Ah is the horizontal cross-section area of the rock layer, and E0 is the elastic modulus of the rock layer.
After extracting the cross-sectional area in each direction based on the 3D solid model (Figure 4), the vertical and horizontal foundation reaction coefficients are calculated by Equations (4) and (5), as shown in Table 3.
(2)
Analysis of results
As shown in Figure 7, the calculation is carried out by Equation (1). A comprehensive comparison of the eigenvalue results of the mass participation coefficients and periods of different vibration modes is conducted, and the final determination of the period values of vibration modes 6 and 7, 1.085584 and 1.031460, are used as the basis data for the calculation of the damping of the vibration modes in the time-range analysis.
2. Time-course analysis
Time-course analysis is the process of calculating the dynamic characteristics of the structure and the structural response (displacement, internal force, velocity, etc.) at any moment in time. According to the literature [39,40,41], the power balance equations used are as follows:
M u ¨ ( t ) + C u ˙ ( t ) + K u ( t ) = p ( t )
where M is the total mass matrix of the finite element system; C is the total damping matrix of the finite element system; K is the total stiffness matrix of the finite element system; “ u ¨ ( t ) ”, “ u ˙ ( t ) ” and “u(t)” are the acceleration, velocity and displacement vectors of each node of the system; and “ p ( t ) ” is the dynamic load.
(1)
Boundary conditions
Define the viscous boundary through the surface spring [31,38]. The P-wave and S-wave damping calculations in the X, Y, and Z directions of the rock layer required to establish the viscous boundary are shown in Equations (7) and (8).
The P-wave damping calculation formula:
CP = ρ·A·[(λ + 2G)/ρ]1/2 = γ·A·[(λ + 2G)/(λg)]1/2 = cp·A
The S-wave damping formula:
CS = ρ·A·(G/ρ)1/2 = γ·A·[(G/(λg)]1/2 = cs·A
where ρ is the density, kg/m3; γ is the bulk weight, t/m3; λ = vE/[(1 + v)(1 − 2v)], the bulk modulus, t/m2; G = E/2(1 + v), and the shear modulus, t/m2; E is the modulus of elasticity, t/m2; v is Poisson’s ratio; g is the acceleration of gravity; A is the cross-sectional area of the boundary rock layer, m3; cp is the P-wave damping constant; and cs is the S-wave damping constant.
When inputting damping in GTS NX, only cp and cs can be input because the program automatically calculates the cross-sectional area of each unit. According to Equations (7) and (8), combined with the mechanical parameters of the rock formation, the results of cp and cs are shown in Table 4.
(2)
Dynamic load
Blasting load parameters include loading waveform, peak stress, location and direction of action, loading and unloading time, total vibration time, and loading boundary.
The blast load waveform adopts the triangular load waveform, the peak load is reached quickly at 10 ms, and the unloading time is 100 ms. The peak load is determined by the empirical formula according to the literature [42], and the empirical formula is as follows:
Pmax = 139.97/Z + 844.81/Z2 + 2154/Z3 − 0.8034
Z = R/Q1/3
where Z is the proportional distance; R is the distance from the gun hole to the loading surface, m; and Q is the gun hole charge.
Under the tunnel blasting excavation of the existing railroad tunnels, mass vibration velocity requirements do not exceed 2 cm/s, according to the literature [43]. A one-time detonation of the maximum allowable amount of the drug formula is as follows:
Q = R3(V/K)3/a
where V is the existing tunnel media mass vibration velocity; Q is the time permitted under the tunnel detonation of the total charge, kg; R is the center of the source of self-explosion to the distance of the protected building, m; K is the medium factor; and a is the blasting vibration coefficient.
According to new tunnels and the existing tunnels’ engineering geological conditions, K takes 250 and a takes 1.5 in Formula (11), which calculates the existing tunnel floor from the center line of different distances from the maximum amount of detonation charge and mass vibration velocity, as seen in Table 5.
A maximum charge of 8.0 kg was selected as the base data for calculating the peak blasting load in conjunction with the spatial relationship of the cross tunnels. According to the maximum charge requirements for the upper and lower steps of the excavation section blasting design, the design of the shell hole section is shown in Figure 8, and the blasting parameters are shown in Table 6.
Combined with the excavation section blasting design, the distance from the gun hole to the load surface is 1.0 m, based Formulas (7) and (8), obtaining a peak blasting load of 20.89 MPa. The blasting load in the form of pressure is applied to the tunnel excavation boundary rock layer, which is the direction of action for the perimeter of the tunnel’s vertical direction.

3.2.3. Existing Tunnel Operational Loads

The dynamic load of each wheel during train operation is simplified into a series of vertical concentrated forces whose size changes dynamically with time, and the artificial excitation function method is utilized to determine the train vibration load. The excitation function consists of a static load and a series of sinusoidal functions superimposed on the dynamic load [44,45], whose expression is:
P ( t ) = P 0 + i = 1   3 P i sin ω i t
P i = M 0 a i ω i 2
ω i = 2 π v / L i
where P 0 is the static wheel load; P 1 , P 2 , and P 3 are the peak loads corresponding to the smoothness of travel, line power additional load, and waveform wear; M 0 is the mass of the train under the springs; L i is the uneven vibration wavelengths of the smoothness of travel, line power additional load, and waveform wear control conditions; a i is the lost height corresponding to the uneven vibration wavelength of the three control conditions; and v is the train speed.
According to the existing tunnel train operation information and comprehensively considering the relevant parameters of CRH series trainsets, the train parameters are selected as having eight cars, a length of 200 m, a speed of 200 km/h (55.5 m/s), an axle weight of 19 t, an unsprung mass of 2 t, and a static wheel weight of 95 kN on one side. According to the track unevenness laying accuracy standard (Table 7) mentioned in the literature [32], the uneven wavelength and vector height are determined under three control conditions: L1 = 10 m, a1 = 3.5 mm; L2 = 2 m, a2 = 0.4 mm; and L3 = 0.5 m, a3 = 0.1 mm. Formulas (12) and (13) are used to obtain the train dynamic loading time curve, as shown in Figure 9.

4. Results

4.1. New Tunnel Excavation

Figure 10 shows a cloud diagram of the overall displacement of the existing tunnel at different timing steps, and Figure 10 shows the overall peak deformation of the existing railroad tunnel and the overall deformation curve of the centerline of the bottom plate of the track surface at different timing steps.
By combining Figure 10 and Figure 11, the sensitive area of the existing tunnel impact after S1 excavation is in the 26 m area on the excavation side of the A end of the new tunnel can be seen. The maximum settlement is 0.11 mm at the location of the arch of the existing tunnel and the minimum settlement is 0.05 mm at the location of the tunnel floor at the B end. The maximum settlement of the track floor is 0.09 mm and the minimum settlement is 0.05 mm, which occurs at the tunnel end. The settlement value does not change much in the sensitive area, and gradually decreases as it moves away from the sensitive area.
The settlement pattern of the existing tunnel after the excavation of S2 and S3 is the same as S1, with the maximum and minimum values occurring at the same location and the influence area expanding to the B-end. The maximum value of the tunnel settlement after excavation of S2 is 0.18 mm and the minimum value is 0.08 mm. The maximum settlement of the track base plate is 0.16 mm, the minimum settlement is 0.08 mm, and the influence sensitive area expands to 40 m. The maximum value of tunnel settlement after S3 excavation is 0.25 mm and the minimum value is 0.12 mm. The maximum settlement of the track floor is 0.23 mm, the minimum settlement is 0.12 mm, and the influence-sensitive area extends to 90 m.
After S4 excavation, the location of the maximum value of the existing tunnel settlement changed and occurs in the arch waist position on the excavation side of the new tunnel, 80 m from end A, with a settlement value of 0.39 mm, affecting the sensitive area in the 100 m area on the excavation side of the new tunnel at end A. There is no change in the location of the minimum value of the tunnel settlement and the maximum and minimum value of the track floor, with the maximum settlement of the track floor being 0.35 mm and the minimum settlement being 0.19 mm.
After S5 excavation, the maximum settlement occurs in the new tunnel excavation side arch waist position, 85 m from end A, and the settlement value is 0.55 mm. The maximum settlement of the track base plate occurs 90 m from end A, and the settlement value is 0.45 mm; the tunnel settlement sensitive area moves from end A to the middle of the tunnel.
After S6 excavation, the existing tunnel settlement pattern is the same as S5, the maximum settlement value of the tunnel and track surface moves to the middle of the tunnel, and the sensitive area of the tunnel settlement moves to the middle of the tunnel from the A end, and the settlement changes in the middle of the tunnel are obvious. The maximum settlement value of the tunnel is 0.80 mm, and the maximum settlement of the track base plate is 0.63 mm.
After S7 and S8 excavation, the tunnel and track surface settlement maximum values occur in the same location as S6, but the maximum settlement value points from the tunnel arch waist position to the bottom of the arch position move. The S7 excavation tunnel maximum settlement value of 1.23 mm, and the maximum settlement of the track base plate is 1.04 mm. The S8 excavation tunnel maximum settlement value is 1.85 mm, and the maximum settlement of the base plate is 1.66 mm. The maximum settlement value is 1.66 mm at both ends of the tunnel, and the settlement becomes smaller in a symmetrical trend.
After S9~S12 excavation, the maximum settlement of the tunnel and track surface tends to coincide with the location of the maximum value, which occurs in the location of the tunnel floor, 120 m away from the A end. The tunnel-sensitive area occurs in the 120 m area on both sides of the maximum settlement value, and the A end area is larger than the B end area. The maximum settlement value of the tunnel after the excavation of S9 is 2.52 mm, and the maximum settlement of the track floor is 2.49 mm. The maximum settlement value of the tunnel after the excavation of S10 is 2.92 mm, and the track floor is 1.66 mm. The maximum value becomes smaller toward both ends of the tunnel. After S10 excavation, the maximum settlement of the tunnel is 2.92 mm, and the maximum settlement of the track base plate is 2.92 mm. After S11 excavation, the maximum settlement of the tunnel is 3.26 mm, and the maximum settlement of the track base plate is 3.24 mm. After S12 excavation, the maximum settlement of the tunnel is 3.59 mm, and the maximum settlement of the track base plate is 3.51 mm. The maximum value of the tunnel is the same as the tunnel at the two ends of the settlement law.
The maximum settlement of the tunnel and track surface after the excavation of S13~S20 is 130 m away from the A end of the tunnel floor, and the increase in settlement value is small.
Figure 12 shows the combined settlement curves of the track surface of the existing tunnel under different timing steps. In Figure 12, it can be seen that the maximum settlement of the track surface from S7 to S11 occurs to the right of the left line crossing point. This is because the excavation of the new tunnel is at an angle of 61° with the existing tunnel (as shown in Figure 6), and the left line is the first to be excavated and is three timing steps ahead of the right line, so the left line of the existing tunnel is the first to be affected by the excavation of the new tunnel. As the tunnel excavation progresses, the maximum settlement value gradually approaches the measurement point. At the end of the excavation, it can be observed that the settlement curve is symmetrically distributed based on the measurement points.
In Figure 12, it can be clearly seen that the track surface settlement curve is characterized by significant features: the excavation area of S7~S14 is the sensitive area affected by the excavation of the new tunnel on the existing tunnel, and the settlement changes are large. The settlement of the new tunnel on the existing tunnel is concentrated in the strong disturbance area of 120 m at the measurement point, and the weak disturbance area is 60 m around the strong disturbance area.

4.2. New Tunnel Blasting

The overall displacement cloud, overall vibration velocity cloud, and Von Mises stress cloud of the rock layer under blasting action were extracted and analyzed in order to determine the area affected by blasting dynamic loads in the new tunnel excavation. The Von Mises stress cloud can accurately represent the stress distribution in the formation when only tensile stresses are considered [32].
Figure 13 shows the overall displacement of the rock layer under blasting load. As can be seen from Figure 13, with the centerline of the tunnel section as the reference point, the overall displacement of the rock layer under the dynamic blasting load is divided into three zones: the first zone is a circle with a diameter of 19.72 m centered on the reference point, and the overall displacement is 0.88~2.11 mm; the second zone is a circle with a diameter of 27.09 m, and the overall displacement is 0.35~0.88 mm; the third zone is a circle with a diameter of 35.24 m, and the overall displacement is 0.35~0.18 mm.
As shown in Figure 14, the overall vibration velocity of the rock layer under blasting load is shown in the cloud diagram. As can be seen in Figure 14, with the centerline of the tunnel section as the reference point, the overall vibration velocity of the rock layer under the dynamic blasting load is divided into three zones: the first zone is a circle with a diameter of 19.72 m centered on the reference point, and the overall vibration velocity is in the range of 2.53–6.07 cm/s; the second zone is a circular domain extending outward from the circular domain of the first zone to a circular domain with a diameter of 25.63 m, and the overall displacement is in the range of 1.01–2.53 cm/s; the third zone is a circular domain extending outward from the circular domain of the second zone to a circular domain with a diameter of 35.24 m; and the third section is the circular domain of the second section extended outward to the circular domain with a diameter of 35.24 m, and the overall displacement is in the range of 0.51~1.01 cm/s.
The Von Mises stress cloud of the rock formation under blasting load is shown in Figure 15. As can be seen in Figure 15, with the centerline of the tunnel section as the reference point, the Von Mises stress in the rock layer under dynamic blasting load is divided into three zones: the first zone is a circle with a diameter of 19.72 m centered on the reference point, and the Von Mises stress is in the range of 1.25–3.01 MPa; the second zone is a circle extending outward from the circle in the first zone to a circle with a diameter of 25.63 m, and the Von Mises stress is in the range of 0.50–1.25 MPa; and the third zone is a circle in the second zone, and the Von Mises stress is in the range of 0.50–1.25 MPa. The second section is the circular domain of the first section extending outward to 25.63 m in diameter, and the Von Mises stress is in the range of 0.50~1.25 MPa; the third section is the circular domain of the second section extending outward to 30.03 m in diameter, and the Von Mises stress is in the range of 0.25~0.50 MPa.
Considering the overall displacement map, overall vibration velocity map, and Von Mises stress impact area of the rock layer under the action of blasting dynamic load, combined with the impact characteristics of blasting load in tunnel excavation, it is determined that is it best to take the center of the datum point in the tunnel section and the circular domain with a diameter of 25.63 m as the impact area of blasting dynamic load in the excavation of the new tunnel.

4.3. Existing Tunnel Operation

The overall displacement cloud, overall vibration velocity cloud, and Von Mises stress cloud of the rock layer under train dynamic loading were extracted and analyzed for the purpose of determining the area affected by the dynamic loading of train operation in existing tunnels.
Figure 16 shows a cloud diagram of the overall displacement of the rock formation under the dynamic load of the train. The overall displacement of the rock layer under the dynamic train load is along the axis of the existing tunnel. The influence range is largest in the center of the dynamic train load application area, the symmetry decreases to both sides, and the overall course is ellipsoidal. Taking the section at the center of the dynamic load application area of the existing tunnel as the benchmark, three impact zones are quantitatively described: the first zone is distributed within 5 m below the track surface, with an irregular semicircular shape and an overall displacement of 0.10–0.14 mm; the second zone is distributed within 40–50 m around the tunnel section, with an irregular ellipsoidal shape and an overall displacement of 0.07–0.10 mm; the third zone is distributed within 40–50 m around the tunnel section, with an irregular ellipsoidal shape and an overall displacement of 0.10 mm; and the third zone is distributed in the tunnel section, with an overall displacement of 0.10 mm. The third zone is distributed in the range of 70~100 m around the tunnel section, with an irregular oval shape and an overall displacement of 0.69~0.07 mm.
As shown in Figure 17, the overall vibration velocity of the rock layer under the dynamic load of the train is shown in the cloud diagram. In Figure 17, it can be seen that the overall vibration velocity of the rock layer under dynamic train loads varies irregularly along the axis of the existing tunnel, but the overall influence area does not change much. Taking the cross-section at the center of the dynamic load application area of the existing tunnel as the reference, three impact zones are quantitatively described: the first zone is distributed in the track surface area, and the overall vibration velocity is in the range of 1.29~1.94 m/s; the second zone is in the range of 6 m below the track surface, with the shape of an irregular semicircle, and the overall vibration velocity is in the range of 0.34~1.29 m/s; and the third zone is in the range of 10 m below the track surface, with an irregular semicircle, and the left side wall is in the range of 3 m. The third zone is in the area of an irregular semicircle in the range of 10 m below the track surface, the area is in the range of 3 m on the left side wall, and the overall vibration speed is 0.18~0.34 m/s.
The Von Mises stress cloud of the rock formation under the dynamic train load is shown in Figure 18. In Figure 18, it can be seen that the Von Mises stresses under dynamic train loads change irregularly along the axis of the existing tunnel, but the overall influence area does not change much. Taking the section at the center of the dynamic load application area of the existing tunnel as the reference, three impact zones are quantitatively described: the first zone is distributed in the track area, and the Von Mises stresses are in the range of 0.18–0.30 MPa; the second zone is in the irregular semicircular area within 3 m below the track surface and in the area within 2 m of the left side wall, and the Von Mises stresses are in the range of 0.05–0.18 MPa; and the second section is in the irregular semicircular area within 5 m below the track surface and the area within 3 m on the left side wall, and the Von Mises stress is 0.03~0.05 MPa.
Considering the overall displacement map, the overall vibration velocity map and Von Mises stress influence area of the rock layer under the dynamic load of the train, when combined with the repetitive characteristics of the dynamic load of the train, it is determined that the influence area of the existing tunnel is the range of the second section of the overall displacement. Taking the overall displacement maps as the basic data, the quantification is carried out by AutoCAD 2022 software to obtain the quantified data of the second section of the influence area (Figure 19a), and the influence area of the rock layer under the dynamic load of the train is finally determined through the symmetry of the data (Figure 19b). Taking the center of the track surface of the existing tunnel as the reference, the influence area is elliptical, with a long axis of 54.75 m and a short axis of 44.96 m. The long axis is 54.75 m and the short axis is 44.96 m.

4.4. Impact Area Determination

We conducted a comprehensive analysis of the new tunnel excavation static load on the existing tunnel impact area, the new tunnel excavation blasting dynamic load impact area, and the existing tunnel train running dynamic load impact area data using the entity model to quantify and determine the two-lane highway tunnel under the existing railroad tunnel excavation impact area.
The new tunnel excavation static load influence area is shown in Figure 20. The 40 mI area on both sides of the center of the crossing point is the strong disturbance area of the new tunnel excavation, the 40 mII area on both sides of the strong disturbance area is the weak disturbance area, and the III area is the micro-disturbance area. As shown in Figure 21, there is a heterogeneous overlapping area with a length of 25.30 m, a width of 18.30 m, and a volume of 499.73 m3 in the dynamically loaded area of the new tunnel excavation and the dynamically loaded area of the existing tunnel train operation.

4.5. Limitations

The first limitation is that the finite element computational model used in this paper is relatively simplified from the actual situation, and the mesh density and computational accuracy may not be sufficient for only approximate numerical solutions. The second limitation is that the paper only conducted a numerical simulation study for this project and lacked field tests or data to validate its numerical results.
Therefore, the adoption of analytical methods specifically for discontinuous environments and the use of similar indoor tests or field monitoring data to verify the accuracy of the simulation results are topics that need to be further investigated.

5. Conclusions

In this paper, the excavation impact area of a two-lane new highway tunnel passing through an existing railroad tunnel is investigated. A finite element three-dimensional analysis model is constructed, and the impact area of the tunnel under three kinds of loads is investigated by applying the static load of the new tunnel excavation, the dynamic load of the new tunnel blasting excavation, and the dynamic load of the train running in the existing tunnel for simulation calculation.
The results of the study show that there are strong and weak disturbance zones in the influence area of new tunnel excavation static loads on existing tunnels, and there are heterogeneous superimposed influence areas in the influence area of new tunnel excavation blasting dynamic loads and dynamic train operation loads in existing tunnels. In this paper, a method of determining the influence area of dynamic and static loads on new tunnel excavation and existing tunnels is identified, which can provide a reference for similar projects in the future.
Midas-GTS NX 2022 is used to further analyze and come up with the following conclusions:
The new tunnel excavation static load on the existing tunnel impact area from the center of the intersection to both sides of 120 m for the strong disturbance area, strong disturbance area on both sides of 60 m for the weak disturbance area, and other for the micro-disturbance area. New tunnel excavation blasting dynamic load impact area. The tunnel section in the center of the reference point shows a circle that is 25.63 m in diameter for the new tunnel excavation blasting dynamic load impact area.
The existing tunnel train running dynamic load impact area. The center of the existing tunnel track surface as a reference. The impact area is shaped like an oval and has a long axis of 54.75 m and a short axis of 44.96 m.
Overlapping influence area. The dynamic load impact area of the new tunnel blasting excavation and the dynamic load impact area of the existing tunnel train operation have a heteromorphic superimposed impact area of 25.30 m in length, 18.30 m in width, and 499.73 m3 in volume.

Author Contributions

Methodology, Y.L.; formal analysis, Y.L., C.H. and H.L.; resources, C.H.; data curation, C.H., H.L. and C.M.; writing—original draft, C.H., H.L. and C.M.; writing—review and editing, H.L. and C.M.; visualization, C.H., H.L. and C.M.; funding acquisition, Y.L. All authors have read and agreed to the published version of the manuscript.

Funding

This work is supported by the Hongjian Lu Natural Science Foundation of Hebei Province (No. E2021209006).

Institutional Review Board Statement

Not applicable.

Informed Consent Statement

Not applicable.

Data Availability Statement

The data presented in this study are available on request from the corresponding author. The data are not publicly available due to privacy.

Conflicts of Interest

The authors declare no conflicts of interest.

References

  1. Chen, Z.L.; Chen, J.Y.; Liu, H.; Zhang, Z.F. Present status and development trends of underground space in Chinese cities: Evaluation and analysis. Tunn. Undergr. Space Technol. 2018, 71, 253–270. [Google Scholar] [CrossRef]
  2. Debrock, S.; Van Acker, M.; Admiraal, H. Design recommendations for sustainable urban underground spaces. Tunn. Undergr. Space Technol. 2023, 140, 105332. [Google Scholar] [CrossRef]
  3. Von der Tann, L.; Sterling, R.; Zhou, Y.; Metje, N. Systems approaches to urban underground space planning and management—A review. Undergr. Space 2020, 5, 144–166. [Google Scholar] [CrossRef]
  4. Cheng, H.; Chen, J.; Chen, G. Analysis of ground surface settlement induced by a large EPB shield tunnelling: A case study in Beijing, China. Environ. Earth Sci. 2019, 78, 605. [Google Scholar] [CrossRef]
  5. Islam, M.S.; Iskander, M. Twin tunnelling induced ground settlements: A review. Tunn. Undergr. Space Technol. 2021, 110, 103614. [Google Scholar] [CrossRef]
  6. Shi, J.; Ng, C.W.; Chen, Y. A simplified method to estimate three-dimensional tunnel responses to basement excavation. Tunn. Undergr. Space Technol. 2017, 62, 53–63. [Google Scholar] [CrossRef]
  7. Xie, X.; Yang, Y.; Ji, M. Analysis of ground surface settlement induced by the construction of a large-diameter shield-driven tunnel in Shanghai, China. Tunn. Undergr. Space Technol. 2016, 51, 120–132. [Google Scholar] [CrossRef]
  8. Weng, X.; Sun, Y.; Yan, B.; Niu, H.; Lin, R.; Zhou, S. Centrifuge testing and numerical modeling of tunnel face stability considering longitudinal slope angle and steady state seepage in soft clay. Tunn. Undergr. Space Technol. 2020, 101, 103406. [Google Scholar] [CrossRef]
  9. Yin, X.; Chen, R.; Meng, F. Influence of seepage and tunnel face opening on face support pressure of EPB shield. Comput. Geotech. 2021, 135, 104198. [Google Scholar] [CrossRef]
  10. Zou, J.F.; Qian, Z.H. Face-Stability Analysis of Tunnels Excavated below Groundwater Considering Coupled Flow Deformation. Int. J. Geomech. 2018, 18, 04018089. [Google Scholar] [CrossRef]
  11. Li, Y.; Zhang, W. Investigation on passive pile responses subject to adjacent tunnelling in anisotropic clay. Comput. Geotech. 2020, 127, 103782. [Google Scholar] [CrossRef]
  12. Nematollahi, M.; Dias, D. Three-dimensional numerical simulation of pile-twin tunnels interaction—Case of the Shiraz subway line. Tunn. Undergr. Space Technol. 2019, 86, 75–88. [Google Scholar] [CrossRef]
  13. Phutthananon, C.; Lertkultanon, S.; Jongpradist, P.; Duangsano, O.; Likitlersuang, S.; Jamsawang, P. Numerical investigation on the responses of existing single piles due to adjacent twin tunneling considering the lagging distance. Undergr. Space 2023, 11, 171–188. [Google Scholar] [CrossRef]
  14. Fang, Q.; Zhang, D.; Li, Q.; Wong, L.N.Y. Effects of twin tunnels construction beneath existing shield-driven twin tunnels. Tunn. Undergr. Space Technol. 2015, 45, 128–137. [Google Scholar] [CrossRef]
  15. Ng, C.W.W.; Fong, K.Y.; Liu, H.L. The effects of existing horseshoe-shaped tunnel sizes on circular crossing tunnel interactions: Three-dimensional numerical analyses. Tunn. Undergr. Space Technol. 2018, 77, 68–79. [Google Scholar] [CrossRef]
  16. Yin, M.; Jiang, H.; Jiang, Y.; Sun, Z.; Wu, Q. Effect of the excavation clearance of an under-crossing shield tunnel on existing shield tunnels. Tunn. Undergr. Space Technol. 2018, 78, 245–258. [Google Scholar] [CrossRef]
  17. Chakeri, H.; Ozcelik, Y.; Unver, B. Effects of important factors on surface settlement prediction for metro tunnel excavated by EPB. Tunn. Undergr. Space Technol. 2013, 36, 14–23. [Google Scholar] [CrossRef]
  18. Gue, C.Y.; Wilcock, M.J.; Alhaddad, M.M.; Elshafie, M.Z.E.B.; Soga, K.; Mair, R.J. Tunnelling close beneath an existing tunnel in clay-perpendicular undercrossing. Geotechnique 2017, 67, 795–807. [Google Scholar] [CrossRef]
  19. Avgerinos, V.; Potts, D.M.; Standing, J.R. Numerical investigation of the effects of tunnelling on existing tunnels. Geotechnique 2017, 67, 808–822. [Google Scholar] [CrossRef]
  20. Chen, R.P.; Lin, X.T.; Kang, X.; Zhong, Z.Q.; Liu, Y.; Zhang, P.; Wu, H.N. Deformation and stress characteristics of existing twin tunnels induced by close-distance EPBS under-crossing. Tunn. Undergr. Space Technol. 2018, 82, 468–481. [Google Scholar] [CrossRef]
  21. Shi, J.; Wang, Y.; Ng, C.W. Three-Dimensional Centrifuge Modeling of Ground and Pipeline Response to Tunnel Excavation. J. Geotech. Geoenviron. Eng. 2016, 142, 04016054. [Google Scholar] [CrossRef]
  22. Lin, X.T.; Chen, R.P.; Wu, H.N.; Cheng, H.Z. Deformation behaviors of existing tunnels caused by shield tunneling undercrossing with oblique angle. Tunn. Undergr. Space Technol. 2019, 89, 78–90. [Google Scholar] [CrossRef]
  23. Ng, C.W.; Wong, Y.Y.A.; Shakeel, M. Effects of the skew angle of new tunneling on an existing tunnel: Three-dimensional centrifuge and numerical modeling. Can. Geotech. J. 2022, 59, 1728–1742. [Google Scholar] [CrossRef]
  24. Shin, J.H.; Moon, H.G.; Chae, S.E. Effect of blast-induced vibration on existing tunnels in soft rocks. Tunn. Undergr. Space Technol. 2011, 26, 51–61. [Google Scholar] [CrossRef]
  25. Zhao, H.B.; Long, Y.; Li, X.H.; Lu, L. Experimental and numerical investigation of the effect of blast-induced vibration from adjacent tunnel on existing tunnel. Ksce J. Civ. Eng. 2016, 20, 431–439. [Google Scholar] [CrossRef]
  26. Tian, X.; Song, Z.; Wang, J. Study on the propagation law of tunnel blasting vibration in stratum and blasting vibration reduction technology. Soil Dyn. Earthq. Eng. 2019, 126, 105813. [Google Scholar] [CrossRef]
  27. Duan, B.; Gong, W.; Ta, G.; Yang, X.; Zhang, X. Influence of Small, Clear Distance Cross-Tunnel Blasting Excavation on Existing Tunnel below. Adv. Civ. Eng. 2019, 2019, 4970269. [Google Scholar] [CrossRef]
  28. Cao, F.; Zhang, S.; Ling, T. Blasting-Induced Vibration Response of the Transition Section in a Branching-Out Tunnel and Vibration Control Measures. Adv. Civ. Eng. 2020, 2020, 4970269. [Google Scholar] [CrossRef]
  29. Ruan, J.B.; Wang, T.H.; Zhao, Z.K.; Zhang, L.; Yin, H.B. Discussion on Blasting Vibration Velocity of Deep Rock Mass Considering Thickness of Overlying Soil Layer. Period. Polytech. Civ. Eng. 2023, 67, 1264–1272. [Google Scholar] [CrossRef]
  30. Gharehdash, S.; Barzegar, M. Numerical modeling of the dynamic behaviour of tunnel lining in shield tunneling. Ksce J. Civ. Eng. 2015, 19, 1626–1636. [Google Scholar] [CrossRef]
  31. Ma, M.; Liu, W.; Qian, C.; Deng, G.; Li, Y. Study of the train-induced vibration impact on a historic Bell Tower above two spatially overlapping metro lines. Soil Dyn. Earthq. Eng. 2016, 81, 58–74. [Google Scholar] [CrossRef]
  32. Lai, J.; Wang, K.; Qiu, J.; Niu, F.; Wang, J.; Chen, J. Vibration Response Characteristics of the Cross Tunnel Structure. Shock. Vib. 2016, 2016, 9524206. [Google Scholar] [CrossRef]
  33. Huang, Q.; Huang, H.W.; Ye, B.; Zhang, D.M.; Gu, L.L.; Zhang, F. Dynamic response and long-term settlement of a metro tunnel in saturated clay due to moving train load. Soils Found. 2017, 57, 1059–1075. [Google Scholar] [CrossRef]
  34. Yan, Q.X.; Song, L.Y.; Chen, H.; Chen, W.Y.; Ma, S.Q.; Yang, W.B. Dynamic Response of Segment Lining of Overlapped Shield Tunnels under Train-Induced Vibration Loads. Arab. J. Sci. Eng. 2018, 43, 5439–5455. [Google Scholar] [CrossRef]
  35. Dong, J.; Zhong, S.; Wang, H.L.; Wu, Z.H. Dynamic response characteristics of crossing tunnels under heavy-haul train loads. Geomech. Eng. 2020, 20, 103–112. [Google Scholar]
  36. Zhang, X.; Zhang, M.; Javadi, A.A. Influence of a Super-Large Diameter Shield Tunnel Excavation on the Lining Structure of the Metro Lines in Operation. Iran. J. Sci. Technol. Trans. Civ. Eng. 2023, 47, 3851–3866. [Google Scholar] [CrossRef]
  37. Galli, G.; Grimaldi, A.; Leonardi, A. Three-dimensional modelling of tunnel excavation and lining. Comput. Geotech. 2004, 31, 171–183. [Google Scholar] [CrossRef]
  38. Wang, W.H.; Wang, L.L.; Du, Y.Z.; Yao, Y.X.; Huang, Y. Numerical and experimental analysis on motion performance of new sandglass-type floating body in waves. Mar. Struct. 2016, 46, 56–77. [Google Scholar] [CrossRef]
  39. Yang, C.-S.; Mo, H.-H.; Chen, J.-S.; Wang, J.-Z. Influence of Seismic Loading on Segment Opening of a Shield Tunnel. Sci. World J. 2014, 2014, 387210. [Google Scholar]
  40. Lai, J.; Guo, C.; Qiu, J.; Fan, H. Static Analytical Approach of Moderately Thick Cylindrical Ribbed Shells Based on First-Order Shear Deformation Theory. Math. Probl. Eng. 2015, 2015, 274091. [Google Scholar] [CrossRef]
  41. Nejati, H.R.; Ahmadi, M.; Hashemolhosseini, H. Numerical analysis of ground surface vibration induced by underground train movement. Tunn. Undergr. Space Technol. 2012, 29, 1–9. [Google Scholar] [CrossRef]
  42. Shi, C.; Zhao, Y.; Zhao, C.; Lou, Y.; Sun, X.; Zheng, X. Water-Sealed Blasting Control Measures of the Metro Station Undercrossing Existing Structures in Ultra-Close Distances: A Case Study. Front. Earth Sci. 2022, 10, 848913. [Google Scholar] [CrossRef]
  43. Wu, X.; Gong, M.; Wu, H.; Hu, G.; Wang, S. Vibration reduction technology and the mechanisms of surrounding rock damage from blasting in neighborhood tunnels with small clearance. Int. J. Min. Sci. Technol. 2023, 33, 625–637. [Google Scholar] [CrossRef]
  44. Ye, F.; He, C.; Wang, S.M.; Zhang, J.L. Landscape design of mountain highway tunnel portals in China. Tunn. Undergr. Space Technol. 2012, 29, 52–68. [Google Scholar] [CrossRef]
  45. Lai, J.; Mao, S.; Qiu, J.; Fan, H.; Zhang, Q.; Hu, Z.; Chen, J. Investigation Progresses and Applications of Fractional Derivative Model in Geotechnical Engineering. Math. Probl. Eng. 2016, 2016, 9183296. [Google Scholar] [CrossRef]
Figure 1. Spatial relationship diagram of the underpass tunnel project.
Applsci 14 00290 g001
Figure 2. Three-dimensional spatial key data of the underpass tunnel project.
Applsci 14 00290 g002
Figure 3. III—Class III perimeter rock; IV—Class IV perimeter rock; V—Class V perimeter rock; Cross-section of the rock layer and surrounding rock grade distribution in the Wanshoushan highway tunnel of the Shiqian expressway.
Applsci 14 00290 g003
Figure 4. Solid model building steps: (a) geological topographic map; (b) CAD digitization; (c) TGM ground surface; (d) stratigraphic profile; (e) 3D solid model.
Applsci 14 00290 g004
Figure 5. Cross-section of the peripheral rock support of the Shiqian Wanshoushan highway tunnel.
Applsci 14 00290 g005
Figure 6. Time-step diagram for extracting excavation data for new tunnels.
Applsci 14 00290 g006
Figure 7. The red dotted box: data used in the model. Graph of eigenvalue analysis results.
Applsci 14 00290 g007
Figure 8. Design cross-section of the blasting holes for upper and lower step excavation.
Applsci 14 00290 g008
Figure 9. Train load time curve.
Applsci 14 00290 g009
Figure 10. A: entrance; B: exit. Overall displacement maps of the existing tunnels at different data extraction time steps.
Applsci 14 00290 g010aApplsci 14 00290 g010bApplsci 14 00290 g010c
Figure 11. Overall peak deformation and track surface settlement curves of the existing tunnels at different timing steps.
Applsci 14 00290 g011aApplsci 14 00290 g011bApplsci 14 00290 g011cApplsci 14 00290 g011d
Figure 12. Combination of track surface settlement curves of the existing tunnels with different timing steps.
Applsci 14 00290 g012
Figure 13. Clouds of the overall displacement of the rock layer under blasting loads.
Applsci 14 00290 g013
Figure 14. Clouds of the overall vibration velocity of the rock formation under blasting loads.
Applsci 14 00290 g014
Figure 15. Von Mises stress cloud of the rock formation under blasting loads.
Applsci 14 00290 g015
Figure 16. Clouds of the overall displacement of the rock layer under the dynamic load of the train.
Applsci 14 00290 g016
Figure 17. Overall vibration velocity of the rock formation under dynamic train loading.
Applsci 14 00290 g017
Figure 18. Von Mises stress map of the rock layer under dynamic train loading.
Applsci 14 00290 g018
Figure 19. Determination of the region of influence of the rock formations under dynamic train loads.
Applsci 14 00290 g019
Figure 20. Areas affected by the excavation of new tunnels.
Applsci 14 00290 g020
Figure 21. Two-lane highway tunnel under the existing railway tunnel excavation impact area.
Applsci 14 00290 g021
Table 1. Parameters of the peripheral rock support of the Shiqian Wanshoushan highway tunnel.
Sports EventTunnel Support Parameters of the Shiqian ExpresswayHurong Railway Tunnel Support Parameters
Initial supportC25 spray concrete28 cm23 cm
Φ6.5 steel mesh@20 × 20 cm@20 × 20 cm
Initial support reinforcement measures22a I-beam @60 cm closed into a ring22a I-beam @60 cm closed into a ring
Sprayed steel-framed concreteSystem anchor@60 × 100 cm, L = 3.5 m, C20 flux-coiled anchors@120 × 100 cm, L = 3.5 m, C20 flux-coiled anchors
C25 spray concrete22 cm20 cm
Steel frame16a I-beam @60 cm closed into a ring16a I-beam @100 cm closed into a ring
Secondary lining 70 cm C30 reinforced concrete45 cm C35 reinforced concrete
vault 70 cm C30 reinforced concrete50 cm C35 reinforced concrete
Ancillary construction measures T76L self-propelled anchor + small conduit in advanceT76L self-propelled anchor + small conduit in advance
Table 2. Rock mechanical parameters.
EnterpriseMaterialsE (GPa)μc (MPa)φ(°)σ (MPa)γ (kN/m3)
StratumMalmstone5.090.312.2535.828.9023.13
Mudstone2.150.331.0333.483.8423.89
Highway tunnelInitial support28.130.25 26.28
Anchor reinforcement15.390.28 25.17
Secondary lining300.20 25.00
Railway tunnelInitial support28.130.25 26.28
Anchor reinforcement15.390.28 25.17
Secondary lining300.20 25.00
Orbital plane400.20 25.00
Note: γ = stratum unit weight; E = elastic modulus; μ = Poisson’s ratio; c = cohesion; φ = angle of internal friction; σ = compressive strength.
Table 3. Vertical and horizontal rock reaction coefficients for different rock formations of 3D solid models.
Rock Layers (Top to Bottom)Model X, Y, and Z Direction Rock Reaction Coefficient (t/m3)
kLXhkRXhkFYhkBYhkZv
Mudstone2665.52 4387.63 3145.71 2432.20
Malmstone7244.13 8970.20 7759.39 7153.64
Mudstone3000.16 3126.16 2946.43 2907.13
Malmstone5915.44 5884.53 5710.24 5710.24
Mudstone4530.42 4527.31 4384.49 4384.49
Malmstone9279.97 9156.92 8921.78 8921.78
Mudstone3433.82 3471.77 3330.95 3330.95
Malmstone9418.76 9440.04 9170.55 9170.55
Mudstone3778.67 4061.60 3665.52 3665.52
Malmstone12,121.47 12,114.00 11,728.72 11,728.72
Mudstone2872.95 2876.63 2781.49 2781.49
Malmstone8071.31 8006.92 7782.58 7782.58
Mudstone2849.02 3341.86 2944.74 2944.74
Malmstone10,695.17 11,704.80 10,214.62 10,214.62
Mudstone5055.50 3273.70 3833.84 3833.84
Malmstone16,257.58 17,026.51 16,334.96 16,334.96
Mudstone4388.29 4656.22 4334.61 4334.61
Malmstone14,776.82 14,146.10 14,016.62 14,016.62
Mudstone7913.75 8064.80 8000.96 8000.96
Malmstone7416.49 7348.26 7214.18 7214.18
Mudstone4157.90 4093.52 3915.15 3915.15
Malmstone10,895.32 11,533.88 10,782.67 10,782.67
Mudstone3940.98 3941.80 3755.93 3755.93
Malmstone11,277.14 10,721.60 10,633.81 10,633.81
Mudstone6106.59 6398.02 6045.57 6045.57
Malmstone6596.91 6338.03 6255.26 6255.26
Mudstone2212.34 2078.98 2073.10 2073.10 1556.58
Table 4. Damping constants for different rock formations.
Rock Stratumcpcs
Mudstone278.584140.3275
Malmstone407.594212.2705
Table 5. The maximum detonating charges for different distances and different vibration velocities.
Distance from the Centerline
R (M)
The Maximum Amount of Explosive Charge at a Time
Q (Kg)
Circular Footage (M)Mass Vibration Velocity
V (cm/S)
301.70.62.00
404.00.62.00
508.01.02.00
608.01.01.52
70121.01.48
80181.01.48
90262.01.49
100362.01.50
110483.01.50
120623.01.48
Table 6. Table of the blasting parameters for upper and lower step excavation.
Name of Shell HoleNumber of Millisecond Detonator SegmentsDepth of Hole
(m)
HoleSingle Hole Charge
(kg)
Charge of Single Section
(kg)
CU111.480.86.4
CU231.380.64.8
AU151.1160.46.4
AU271.1160.46.4
AU391.1180.47.2
AU4111.1200.48.0
PU1131.1260.37.8
BU1151.1160.58.0
AD111.1120.67.2
AD231.1120.67.2
AD351.1130.67.8
AD471.1130.67.8
PD191.1120.44.8
BD1111.3130.67.8
subtotal 203 97.6
Note: A = auxiliary hole; B = floor hole; C = cut hole; P = peripheral hole; U = upper step; D = downward step.
Table 7. Eigenvalues of track irregularities in the UK.
Control ConditionsWavelength (M)Correct a Mistake (Mm)
Unsteadiness5016
209
105
Traveling Line Power Additional Load52.5
20.6
10.3
Waveform Wear0.50.1
0.050.05
Disclaimer/Publisher’s Note: The statements, opinions and data contained in all publications are solely those of the individual author(s) and contributor(s) and not of MDPI and/or the editor(s). MDPI and/or the editor(s) disclaim responsibility for any injury to people or property resulting from any ideas, methods, instructions or products referred to in the content.

