Article

Simulation of Spinal Cord Reflexes

by
Mihai Popescu
1,2,* and
Cristian Ravariu
3,4
1
Doctoral School of Faculty of Electronics and Telecommunications, Polytechnic University of Bucharest UPB, Str. Splaiul Independentei 313, Sector 6, 060042 Bucharest, Romania
2
Network and IT Devices Service DSICD Department of “Carol Davila” Medicine and Pharmacy University Bucharest, Boulevard Eroii Sanitari nr. 8, Sector 5, 050474 Bucharest, Romania
3
BioNEC Group, Department of Electronic Devices Circuits and Architectures, Polytechnic University of Bucharest UPB, Splaiul Independentei 313, 060042 Bucharest, Romania
4
EduSciArt SRL, 050686 Bucharest, Romania
*
Author to whom correspondence should be addressed.
Appl. Sci. 2024, 14(1), 310; https://doi.org/10.3390/app14010310
Submission received: 3 November 2023 / Revised: 11 December 2023 / Accepted: 12 December 2023 / Published: 29 December 2023
(This article belongs to the Special Issue Advances in Neural Networks and Deep Learning)

Abstract

:
The importance of spinal reflexes is connected to the rehabilitation processes in neural prostheses and to the neuromuscular junction. In order to model neuron networks as electronic circuits, a simulation environment like LTSpice XVII or PSpice can be used to create a complete electronic description. There are four types of neurons employed in spinal reflexes: α-motoneurons, sensitive neurons, excitatory interneurons, and inhibitory interneurons. Many proposals have been made regarding methods that can be used for assimilating neurons using electronic circuits. In this paper, only a single internal model of a neuron is considered enough to simulate all four types of neurons implicated in the control loops. The main contribution of this paper is to propose the modeling of neurons using some electronic circuits designed either with a bipolar transistor or with CMOS transistors for the input and output of circuits stages. In this way, it is possible to mimic the neural pulses’ circulation along the loops of the spinal reflexes and to prove the accuracy of the simulation results with respect to the biological signals collected from the bibliographic materials.

1. Introduction

Spinal reflexes are instantaneous actions designated to maintain the safety of a person when unusual or unexpected situations occur. When an external event exceeds a certain level of safety, a loop of on–off control is locally closed, causing the somatic system to react [1]. In the case of a limb mobilized in a certain joint, there are a couple of muscle groups participating in the movement. The first group, part of this couple, (known as agonistic), mobilizes the limb in a certain direction, following, generally, a linear or a circular trajectory function of the limits imposed by the required joints. The second group, part of the couple (known as antagonistic), mobilizes the limb in the opposite direction. Automatically, when a command is triggered, and the agonistic muscle group mobilizes the limb in its direction, the motoneurons, which act the agonistic group, will receive a facilitatory impulse train [2]. In contrast, the motoneurons actioning the antagonistic muscles will receive, at the same time, an inhibitory impulse train [1]. Along with this type of on–off control, we must also mention the continuous control loops for the limb’s mobilization, directed by the upper stages of the central nervous system. Practically, the spinal reflexes are accompanying these continuous control loops, working as limit protectors. The speed of their action cannot be followed by the speed of the continuous control loops, and therefore, they escape from the nervous system’s upper stages of control. For details about the spinal cord reflexes, more explanations are available in [1,2]. Regarding muscles and nervous system physiology, more details are given in [3]. In the following subsections, brief enumerations and explanations of the spinal reflexes are given as supports for the scheme models.

1.1. The Myotatic (Stretch) Reflex and the Reciprocal Inhibition in the Stretch Reflex

The myotatic reflex, or the stretch reflex, relays on the muscle spindle Ia fibers’ activation at an unexpected sudden stretch of the agonistic muscle causing a rapid contraction of same muscle. The reciprocal inhibition in the stretch reflex is realized by a branch of the activated Ia afferents, splitting in the spinal cord and synapsing with an inhibiting interneuron also synapsing with the α-motoneuron of the antagonistic muscle responding to the movement in the same joint.

1.2. The Autogenic Inhibition Reflex and the Reciprocal Excitation in the Autogenic Inhibition Reflex

The autogenic inhibition reflex relies on the Golgi tendon organ’s Ib fibers’ activation when the muscle tension grows unexpectedly. These 1b fibers are synapsing with an inhibitory interneuron also synapsing with the α-motoneuron of the tensioned muscle.
Reciprocal excitation in the autogenic inhibition reflex is realized by the branching of the Ib fibers, which are splitting in the spinal cord and synapsing with an excitatory interneuron also synapsing with the α-motoneuron of the antagonistic muscle of the movement in the same joint.

1.3. The Flexion Reflex and the Reciprocal Inhibition for the Flexion Reflex and Crossed Extension Reflex

The flexion reflex relies on the activation of group III pain receptors fibers. A branch of them synapses with the excitatory interneuron of the flexor muscle for the movement in the joint that is increasing the limb’s distance from the nociception cause.
Reciprocal inhibition for the flexion reflex is caused by a branch from the activated group III fiber splitting and synapsing with an inhibiting interneuron also synapsing with the α-motoneuron of the extensor muscle in the mobilized joints.
A crossed extension reflex is caused by another branch from the activated group III fiber splitting and synapsing with an excitatory interneuron, whose axon crosses the midline to the contralateral spinal cord, also synapsing with the α-motoneuron of the extensor muscles of the opposite side of the body.

1.4. The Recurrent Inhibition of Motor Neurons

The axons of α-motoneurons split and send a branch to synapse with an inhibitory interneuron, Renshaw, making an inhibitory synapse with the same α-motoneurons that cause it to fire. This negative loop back circuit will stabilize the pulse rate on the α-motoneuron. It is a loop of local continuous control. Even though it is not working like an on–off command, working locally, it must be mentioned.
To mimic the spinal reflexes’ functioning, we used LTSpice XVII as the simulation environment. Of course, there are also other simulation environments like PSpice, but we previously used LTSpice for our simulation projects, which proved to be very useful, giving us results that were close to reality. We conducted separate simulations with BJT and CMOS transistors. The medical terms unrecognized by the Word Spelling and Grammar were taken from the neuroscience-oriented references, especially from [1].

2. Theoretical Considerations

The neuron can be considered a circuit working with frequency modulated pulses. The main characteristic of the pulses is that the duty time of every pulse is the same no matter how long the entire pulse period is. As a consequence, the modulation addresses only the duration of the pulses’ pause time. A diagram with the idealized pulse parameters is given in Figure 1. First of all, in order to consider a frequency modulation taking place, we must assume a central frequency, or a characteristic frequency, of every neuron type, modifiable according to a modulation function f(). Considering an infinite pulse train for every pulse n, we have a value f(n) of the modulation function determining the pause time of the n pulse, prolonging or protracting it according to its sign. Theoretically, the pulse train can be defined as follows:
f : N ( T L , T + L ) ,   L   <   T tp ,
where T is the pulse period at the neuron characteristic frequency. If tp is the duty time of the pulses, the Laplace transform of the pulse train is:
I s = 0 e s t f t d t = n = 0 0 t p H e s t d t n = 0 t p T h e s t d t n = 0 0 f n h e s t d t = n = 0 0 t p H e s t d t + t p T h e s t d t + n = 0 0 f ( n ) h e s t d t = If ( s ) + Iv ( s ) ,
where If(s) is the fixed part and Iv(s) is the variable part of I(s). The constant part is the integral of a periodic function, fp(), respectively, of a pulse train with the characteristics shown in Figure 1. The integral part of a periodic function is given in textbooks, and If(s) can be written as:
I f ( s ) = 0 T e s t f p ( t ) d t 1 e s T
f p ( t ) = H ;   t 0 , t p h ;   t ( t p ,   T )
I f s = 1 s 1 e s t ( H ( 1 e s t p ) + h ( e s T e s t p ) )
I v ( s ) = n = 0 h s 1 e s f ( n )
The part of the signal that is of interest to us is the variable one. As can be seen, the modulation part of the signal, Iv, is already separated from the carrier If. The final separation of the modulation from the pulses is achieved at the effectors. Overall, we consider the neuron to be a system with variable parameters [4]; yet, during a certain time interval, it can be approximated as a linear system with fixed parameters. A neuron needs a certain number of excitation pulses, always the same, coming at a convenient time interval, to give a single pulse at the output [1]. The number of excitation pulses can be obtained by time summation and/or by spatial summation. Our neuronal scheme models take this fact into account. The ratio between the output pulses and the input excitation pulses does not remain constant. When the frequency of the excitation pulse input rises, approaching the limit of 100 Hz, and the pause time approaches the refractory period, the ratio obviously decreases. The same phenomenon occurs in our simulations due to the capacity of the charge/discharge.

3. The Electronic Circuitry for the Models of Different Neuron Types

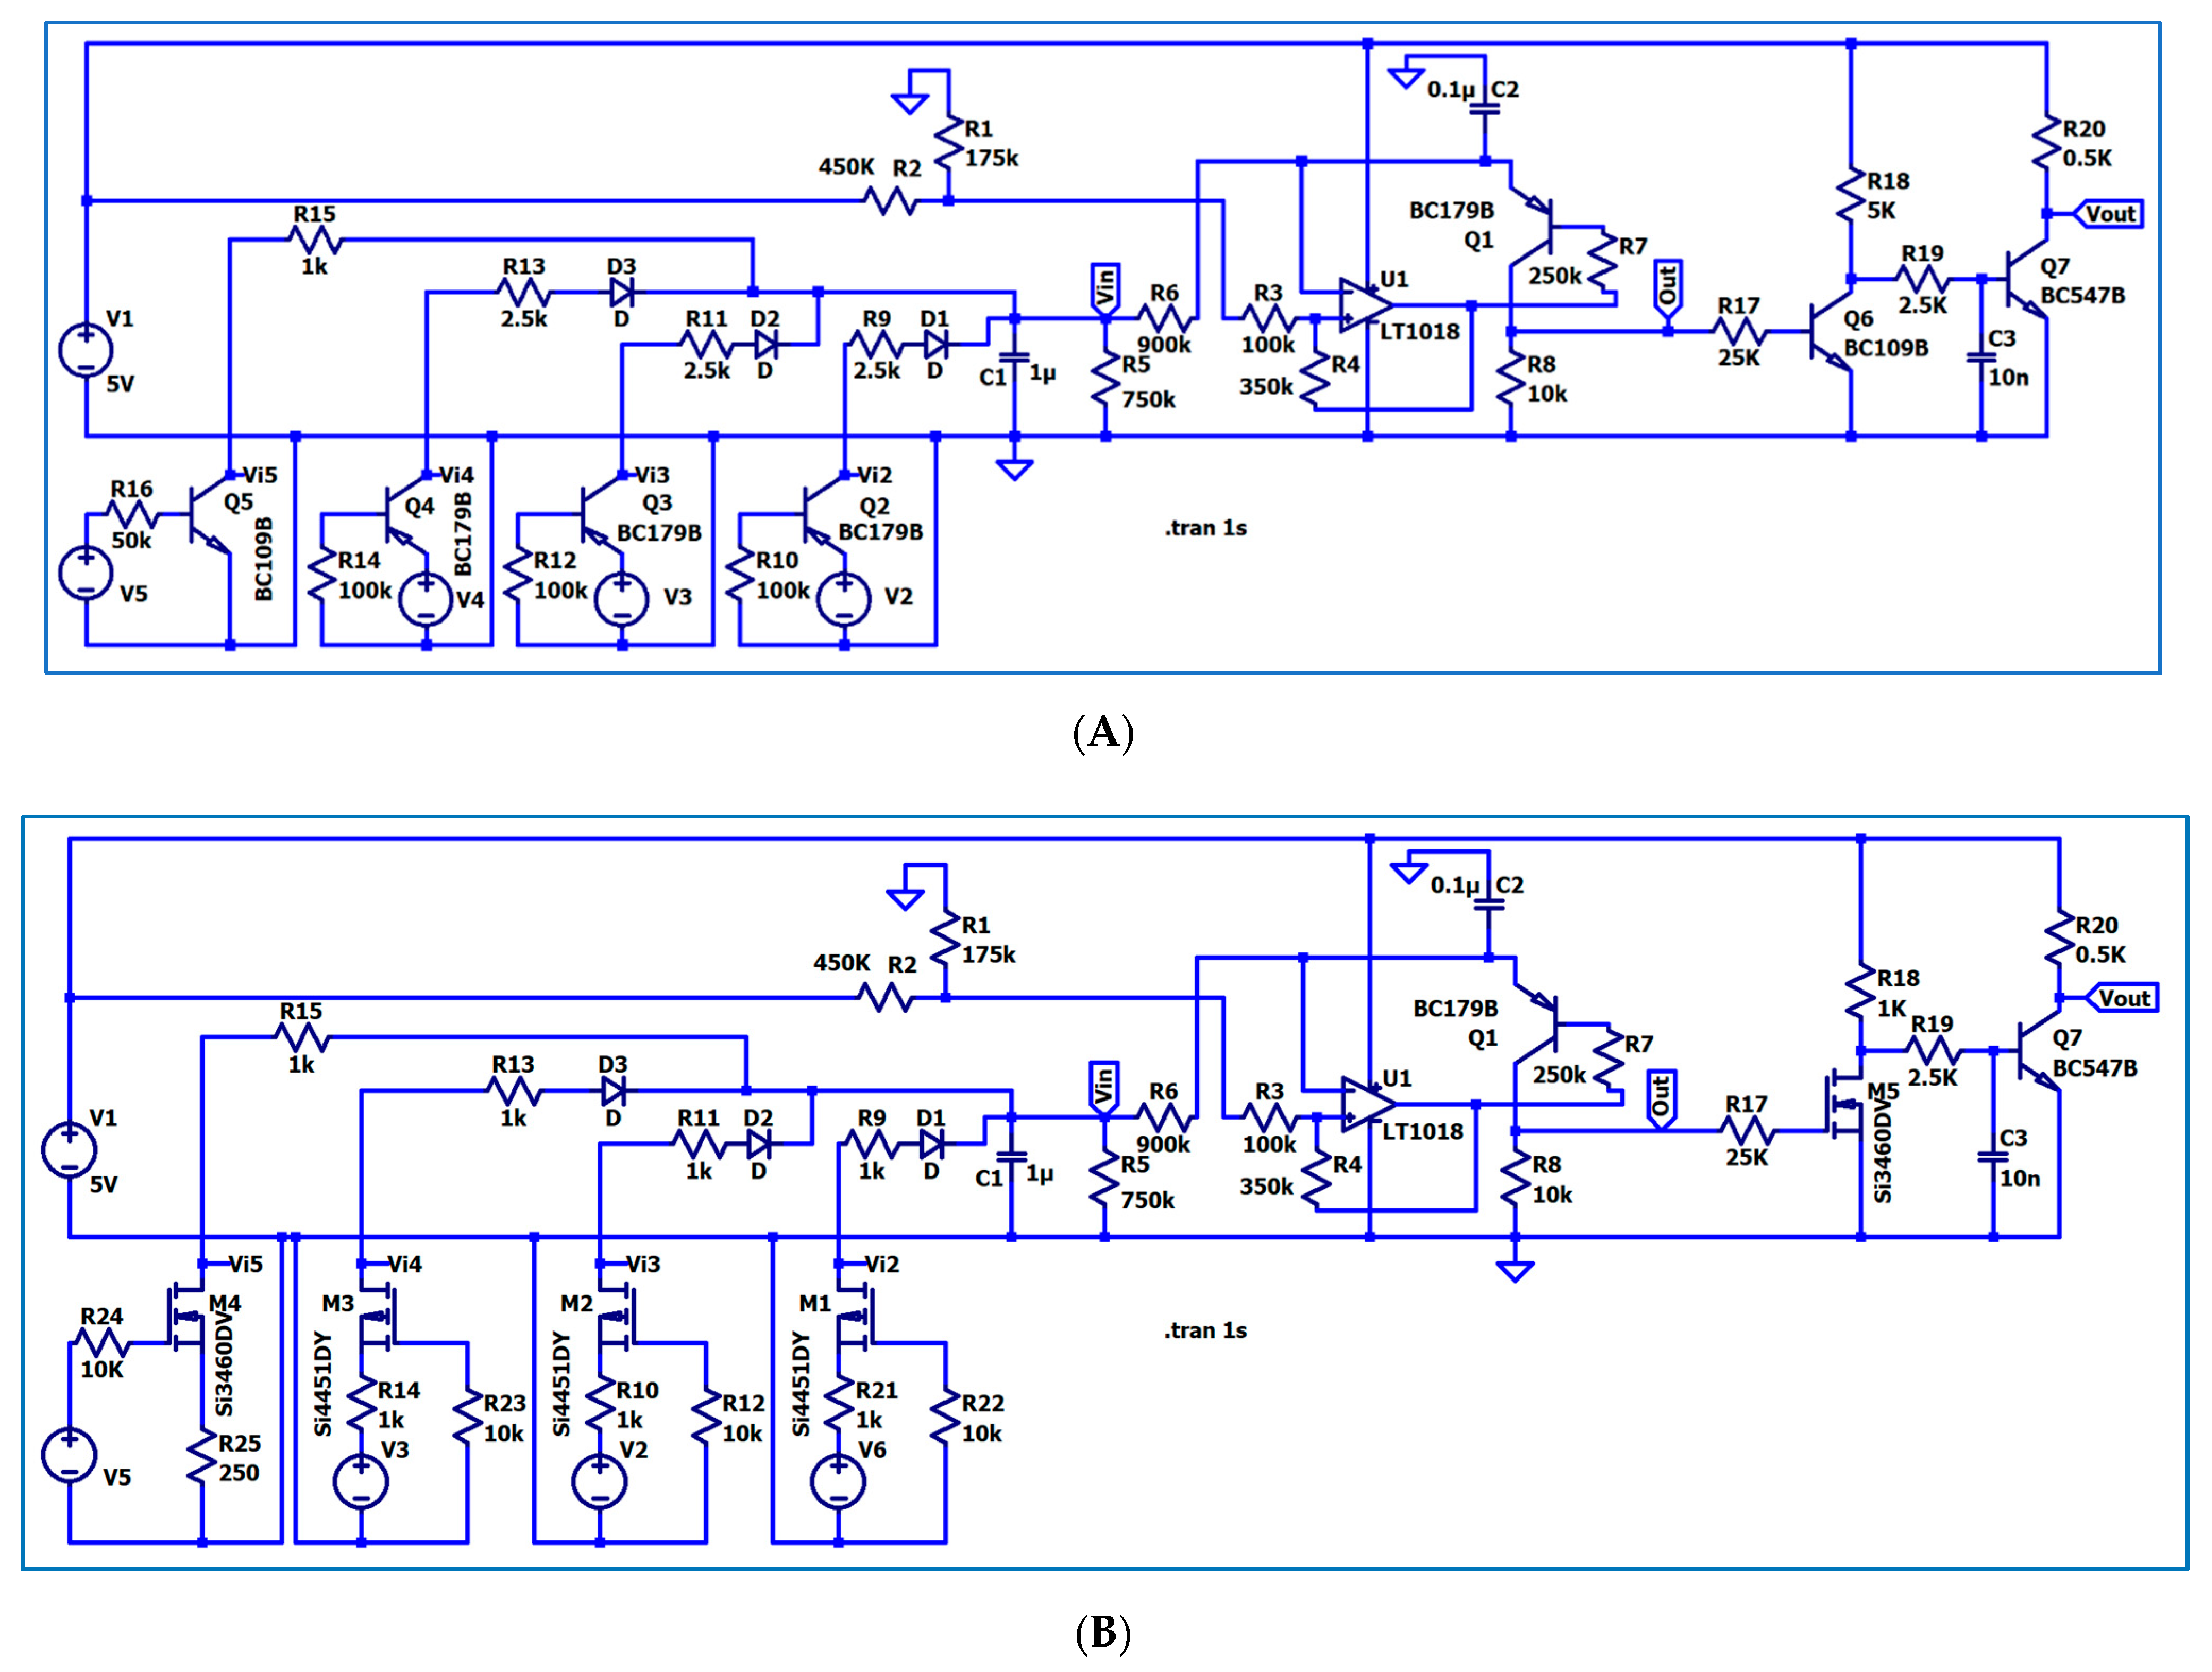
As described in the Introduction, there are four types of neurons implied in the spinal cord reflexes’ generation: α-motoneurons, sensitive neurons, facilitatory interneurons, and inhibitory interneurons. All neuronal schemes can start from the same common schemes given in Figure 2A for BJT transistors and 2.B for CMOS transistors. These neuronal schemes have three excitatory inputs, V2, V3, and V4, and one inhibitory input, V5, stimulating synaptic circuits. The excitatory inputs are generated either using pnp BC179B BJT transistors or p-channel SI4451BY CMOS transistors. The BJT npn transistors are polarized in common base mode. The CMOS p-channel transistors are polarized in common gate mode. Working as a current generator on output, they charge the capacity C1, which can be considered the membrane capacity. The inhibitory input is generated either using an npn BC109B BJT transistor or an SI3460DV CMOS transistor. The BJT npn transistors are polarized in common emitter mode. The CMOS p-channel transistors are polarized in common source mode. They discharge the capacity C1. The BJT transistors for both inputs type are working in the normal regime with the difference that the current of the inhibitory input is 2.5 times higher than that of the excitatory input. The CMOS transistors for both types of input work in the commutation regime with the difference that the current of the inhibitory input is 2.5 times higher than that of the excitatory input. The transistors for the excitatory inputs have a diode in their collectors to prevent the discharge of the capacity C1 during the pause time. Taking into account that C1 is intermittently charged, then mainly using the resistor R4, we set the discharge time of capacity C1 and its mean voltage level. The resistor R6 separates the trigger Smidt pulse oscillator, made with U1, from the input stage. U1 has a positive feedback loop made with R7 and a negative feedback loop made with the pnp transistor Q5. When the C3 voltage level, which is the same as the U1 negative input and charged by R6, exceeds the voltage level on the U1 positive input, then the U1 output will become zero, and the voltage level on the U1 positive input will decrease to the level established by the dividers R7, R5, R2, and R1. At the same time, C3 begins to discharge through the Q5 transistor, until its voltage level decreases below the voltage level on the U1 positive input. When this occurs, the voltage level on the U1 output moves to 5 V, and the level on its positive input rises to the level established again by the dividers R7, R5, R2, and R1. The output stage, made with transistors Q6 and Q7, makes the output voltage levels close to “0 V” and “5 V”. The timing parameters, respectively, the duty time and the frequency, can be established by all the mentioned components, but some of them are more influential. For example, if we keep the values of C1, R1, R2, R4, R5, and R7 constant, then the duty time will be established by the value of the pair R6 and C3 and the frequency by the values of the pair R8 and R9. Moving the output “OUT” into one or more of the excitatory inputs and removing one or more of the V2.V4 input sources creates a feedback excitation loop, resulting in an increase in the output frequency. Removing the V5 input source and moving the output into the inhibitory input creates a feedback inhibition loop, resulting in a decrease in the output frequency. Replacing one of the V2.V4 excitatory inputs with a certain continuous voltage and turning all the others into “0” will lead to a self-pulse-oscillating scheme, with the pulse duty factor and frequency established by the abovementioned components and also by the value of the input voltage.

3.1. The Electronic Scheme Model and Signal Diagram for the Common Neuron Type

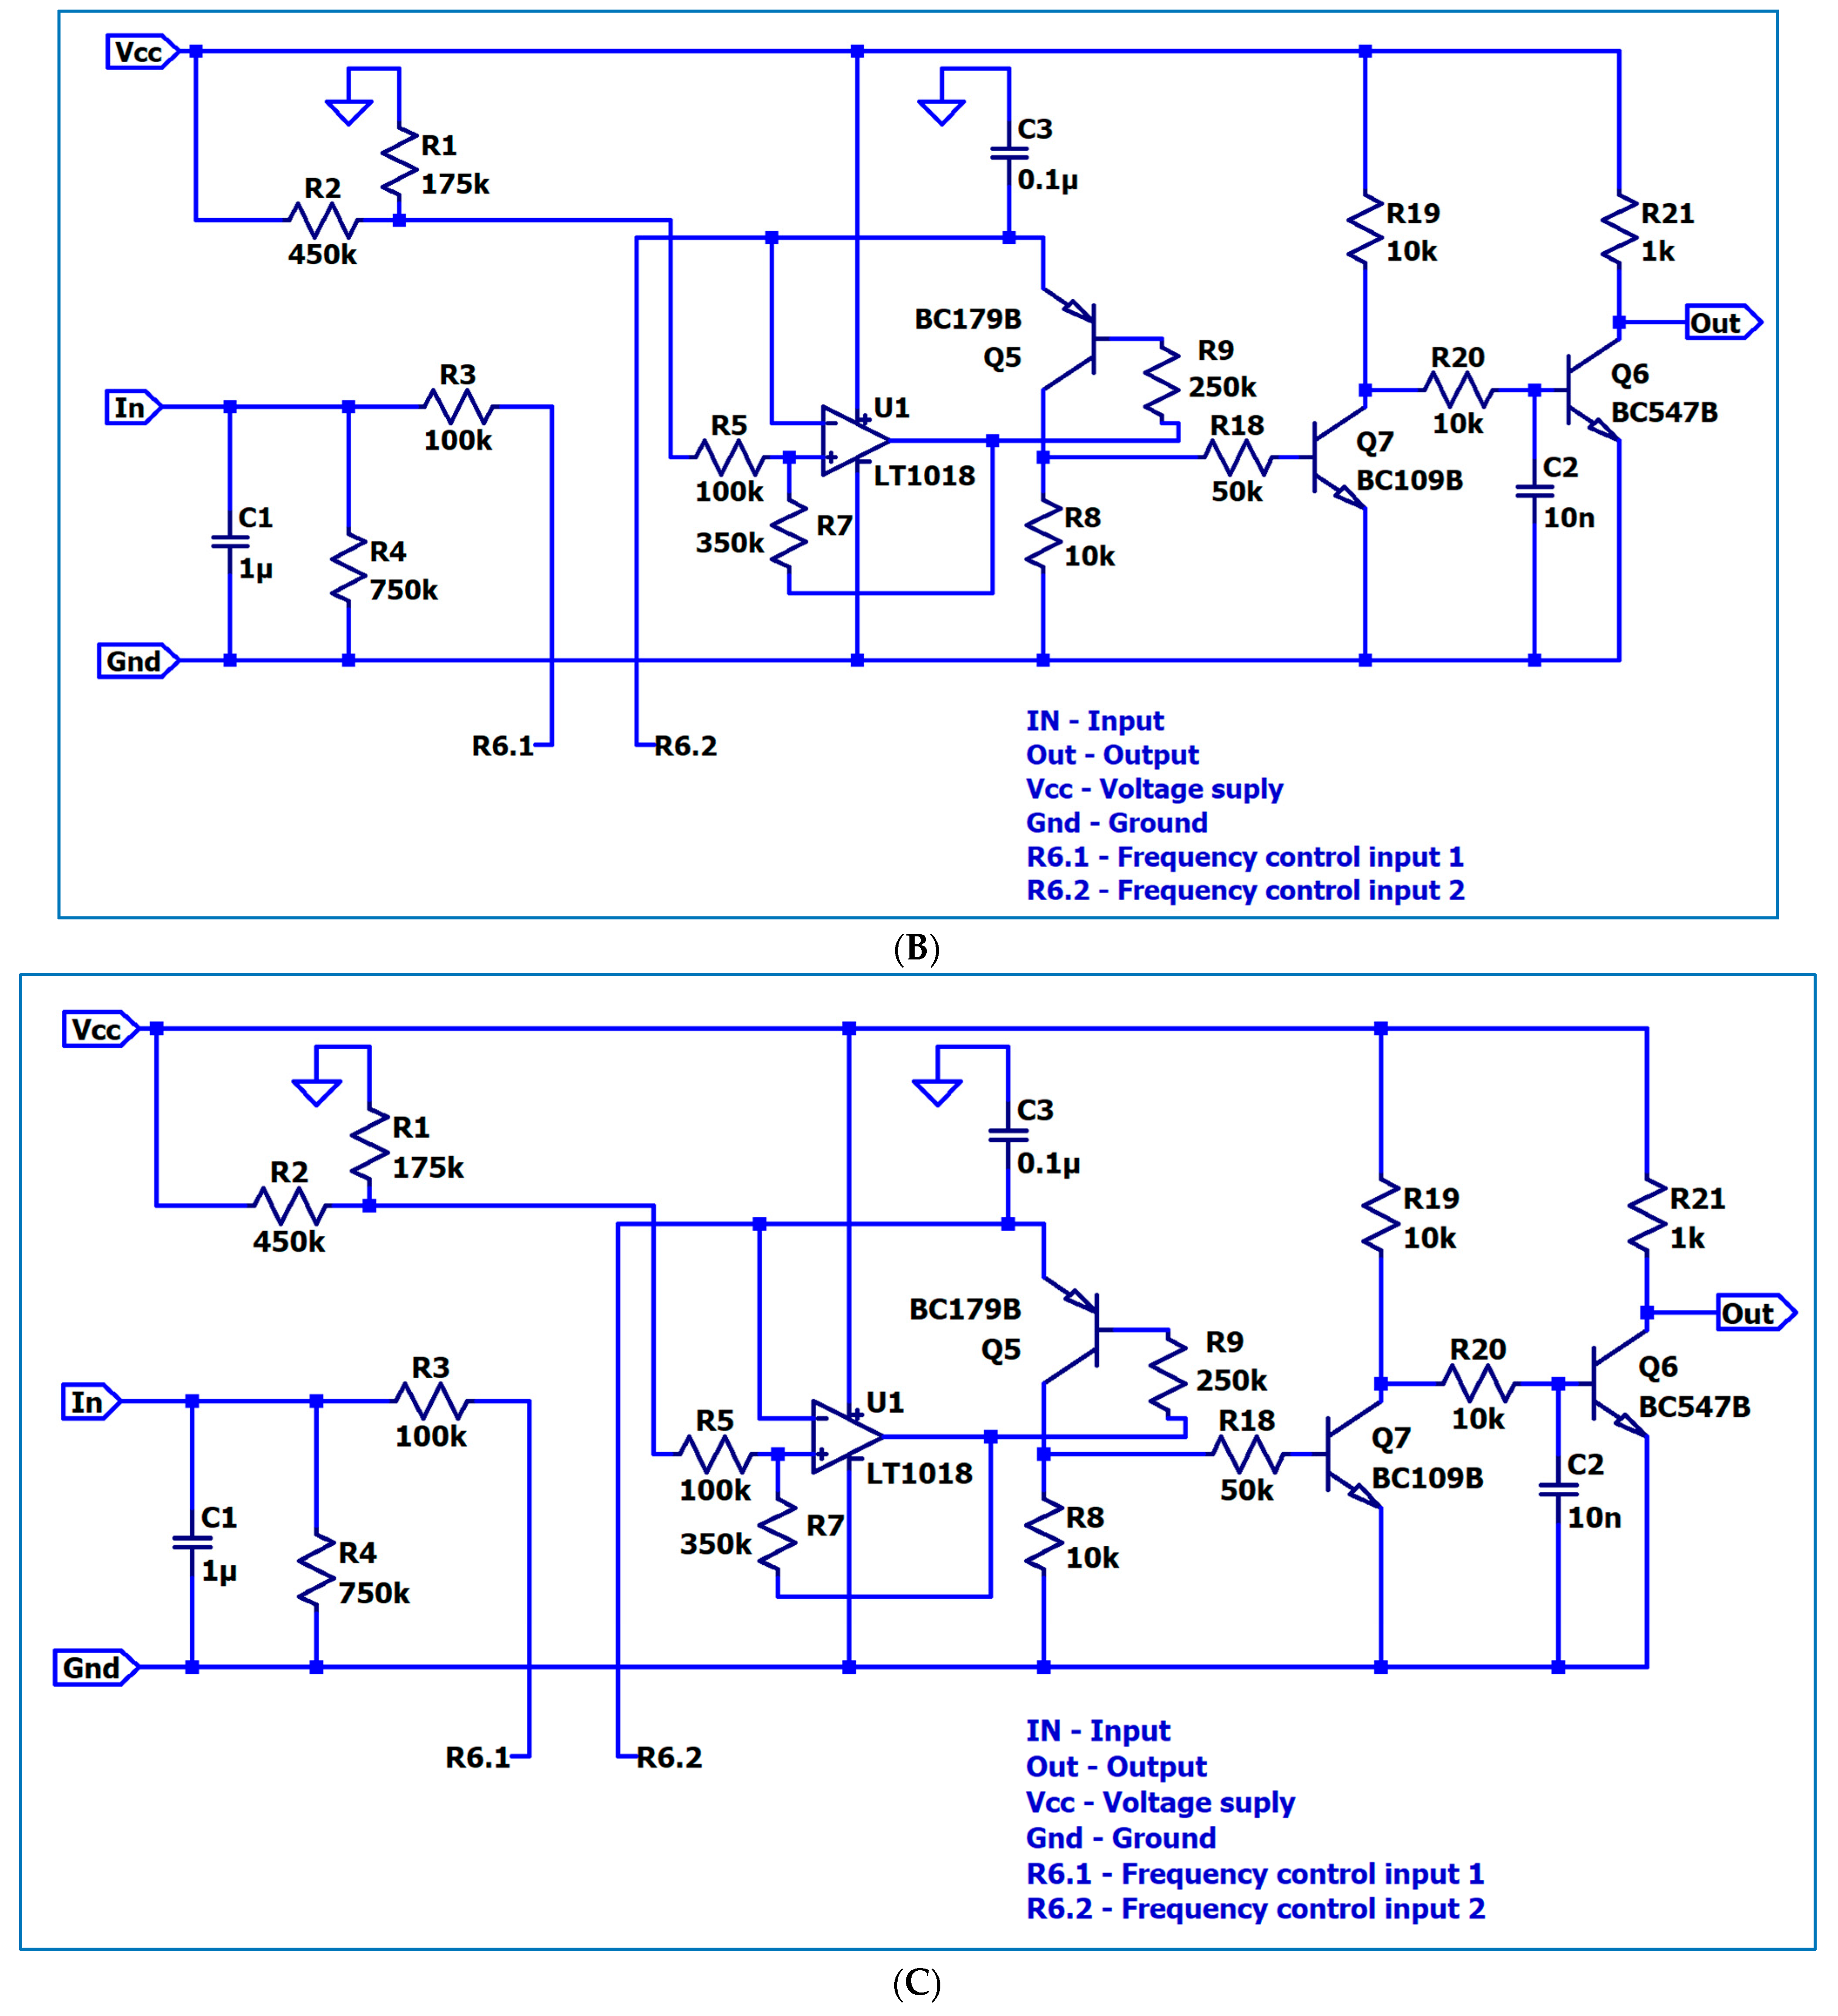
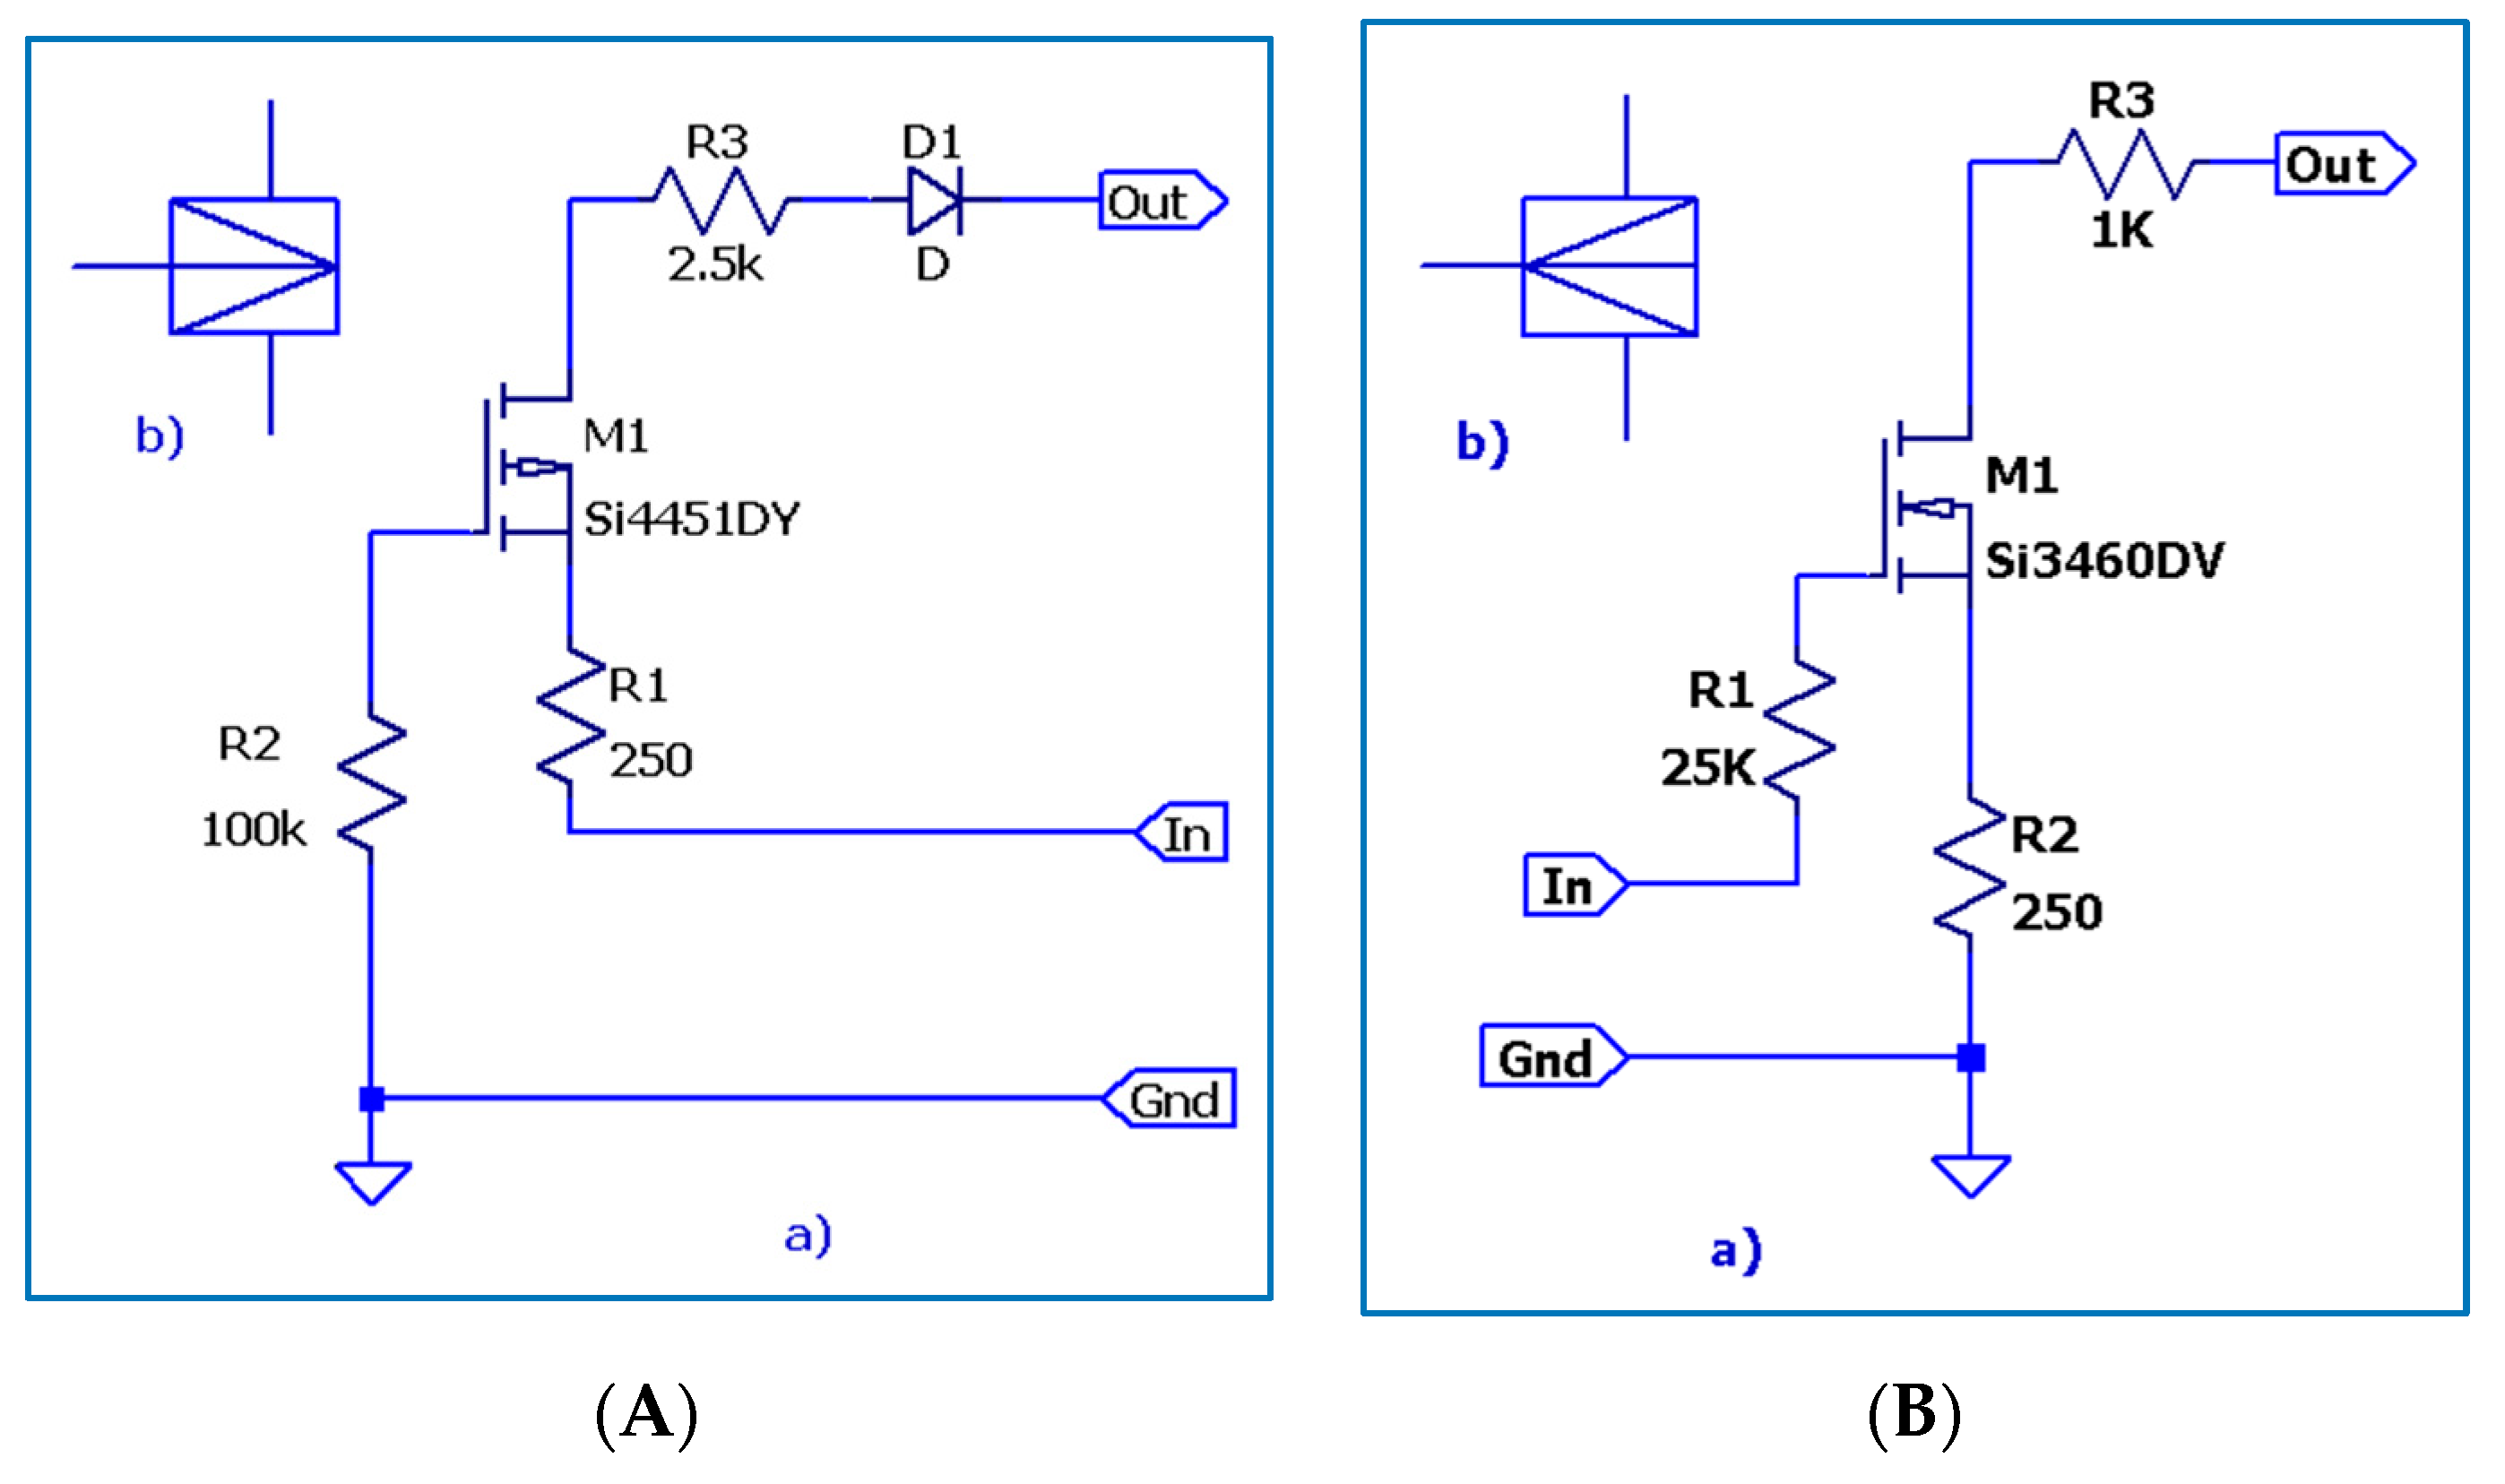
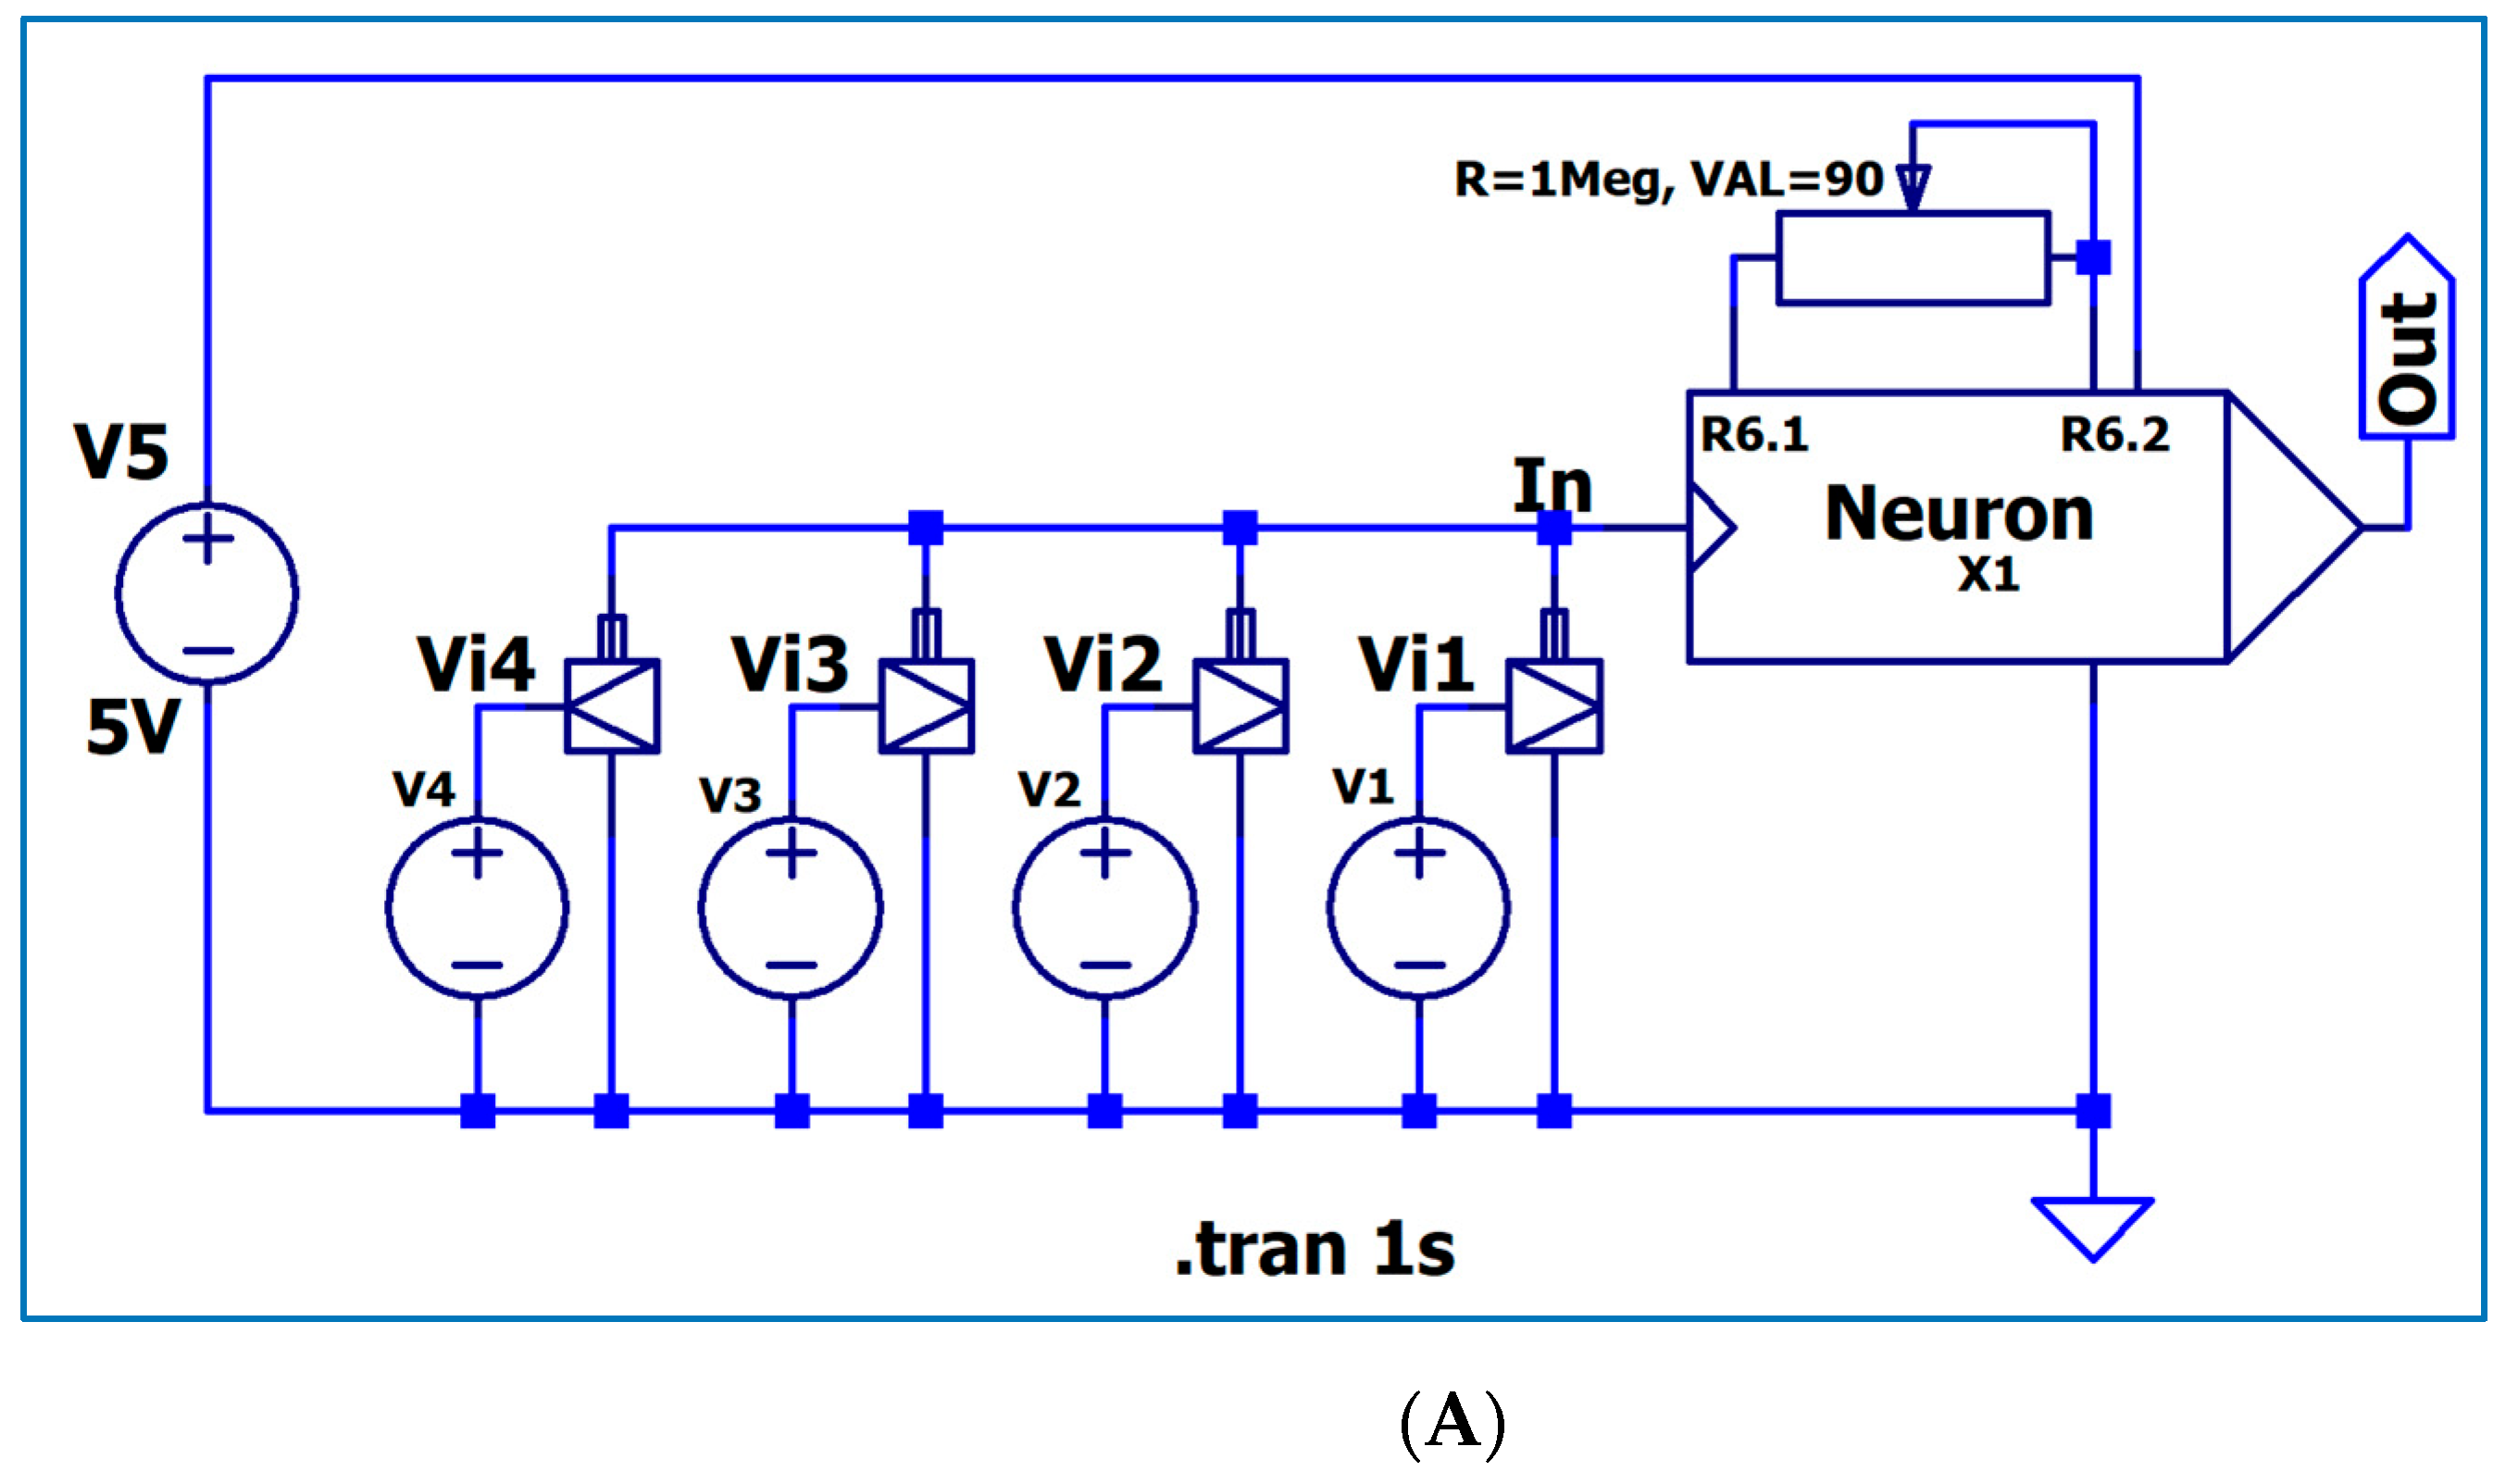
Based on the schemes in Figure 2A,B, we defined two .asc block schemes for the common neuron type without input synapses. One is represented in Figure 3B and designed solely with BJT, while the other is represented in Figure 3C and designed with BJT and CMOS. The block symbols are given in Figure 3A(a,b). By using them, all the neuron types involved in the spinal reflexes can be obtained. The schemes can be completed with any number of synapses, and they provide the user with the possibility to adjust the output frequency, while keeping the same duty factor. In Figure 4A,B, we separately represent the excitatory and inhibitory synapse schemes designed with BJT. In Figure 5A,B, we separately represent the excitatory and inhibitory synapse schemes designed with CMOS. A neuron can be considered excitatory when it is connected by an excitatory synapse with the next neuron. Similarly, it can be considered inhibitory when it is connected by an inhibitory synapse with the next neuron. Based on these defined blocks, in Figure 6A,B, we represent two block schemes equivalent with those in Figure 2A,B. The output frequency can be modified in a sufficient range by using a 1 MΩ potentiometer connected to terminals R6.1 and R6.2. The potentiometer has a scheme, which is too simple to need any further details. We must mention though that it has two parameters, R for the whole resistance and Val for the cursor position. As it is always used with the cursor connected at the same voltage as the terminal number “1”, a value Val = 10 for R = 1 M will introduce a resistance of 900 k into the circuit. Similarly, a value Val = 90 for R = 1 M will introduce a resistance of 100 k into the circuit.
We conducted simulations by exciting the V2 and V3 excitatory synapses in order to obtain some diagrams. For both types of commercially available transistors BJT and CMOS, the results were practically identical. The same was the case with the results for the generic BJT. Figure 7 represents the signal diagram when only one synapse Vi1 synapse is excited, the excitation being a pulse signal, with a 5 V amplitude, 50 Hz frequency, and 1 ms duty time. The potentiometer resistance is set at 100 k. The obtained output frequency is approximately equal to the excitatory pulse signal frequency. Figure 8 represents the diagram for the scheme and conditions represented in the Figure 7 diagram, changing only the potentiometer resistance at 900 K. It can be observed that the output signal frequency is five (5) times lower than the excitatory pulse signals. Figure 9 represents the diagram for the scheme and conditions represented in the Figure 8 diagram, with the added excitation of the synapse Vi2 with a pulse signal identical to the one applied to Vi1. It can be observed that the output signal frequency is four (4) times lower than the excitatory pulse signals this time. To determine what is happening at a low frequency excitation, we kept the scheme and the conditions identical for the diagram shown in Figure 8, only changing the excitation pulse signal frequency to 10 Hz, and we obtained the diagram shown in Figure 10. It can be observed that the output signal has a frequency more than two times lower that of the pulse input signal. Figure 11 represents the diagram for the scheme and conditions represented in Figure 10, with the added excitation of the synapse Vi2 with a pulse signal identical to the one applied to Vi1. It can be observed that the output signal frequency is only 1.5 times lower than that of the exciting signals. By comparing the results, we come to the conclusion that the efficiency of the output signal is higher at low frequencies.

3.2. The Electronic Scheme Model and Signal Diagram for the Sensitive Neuron

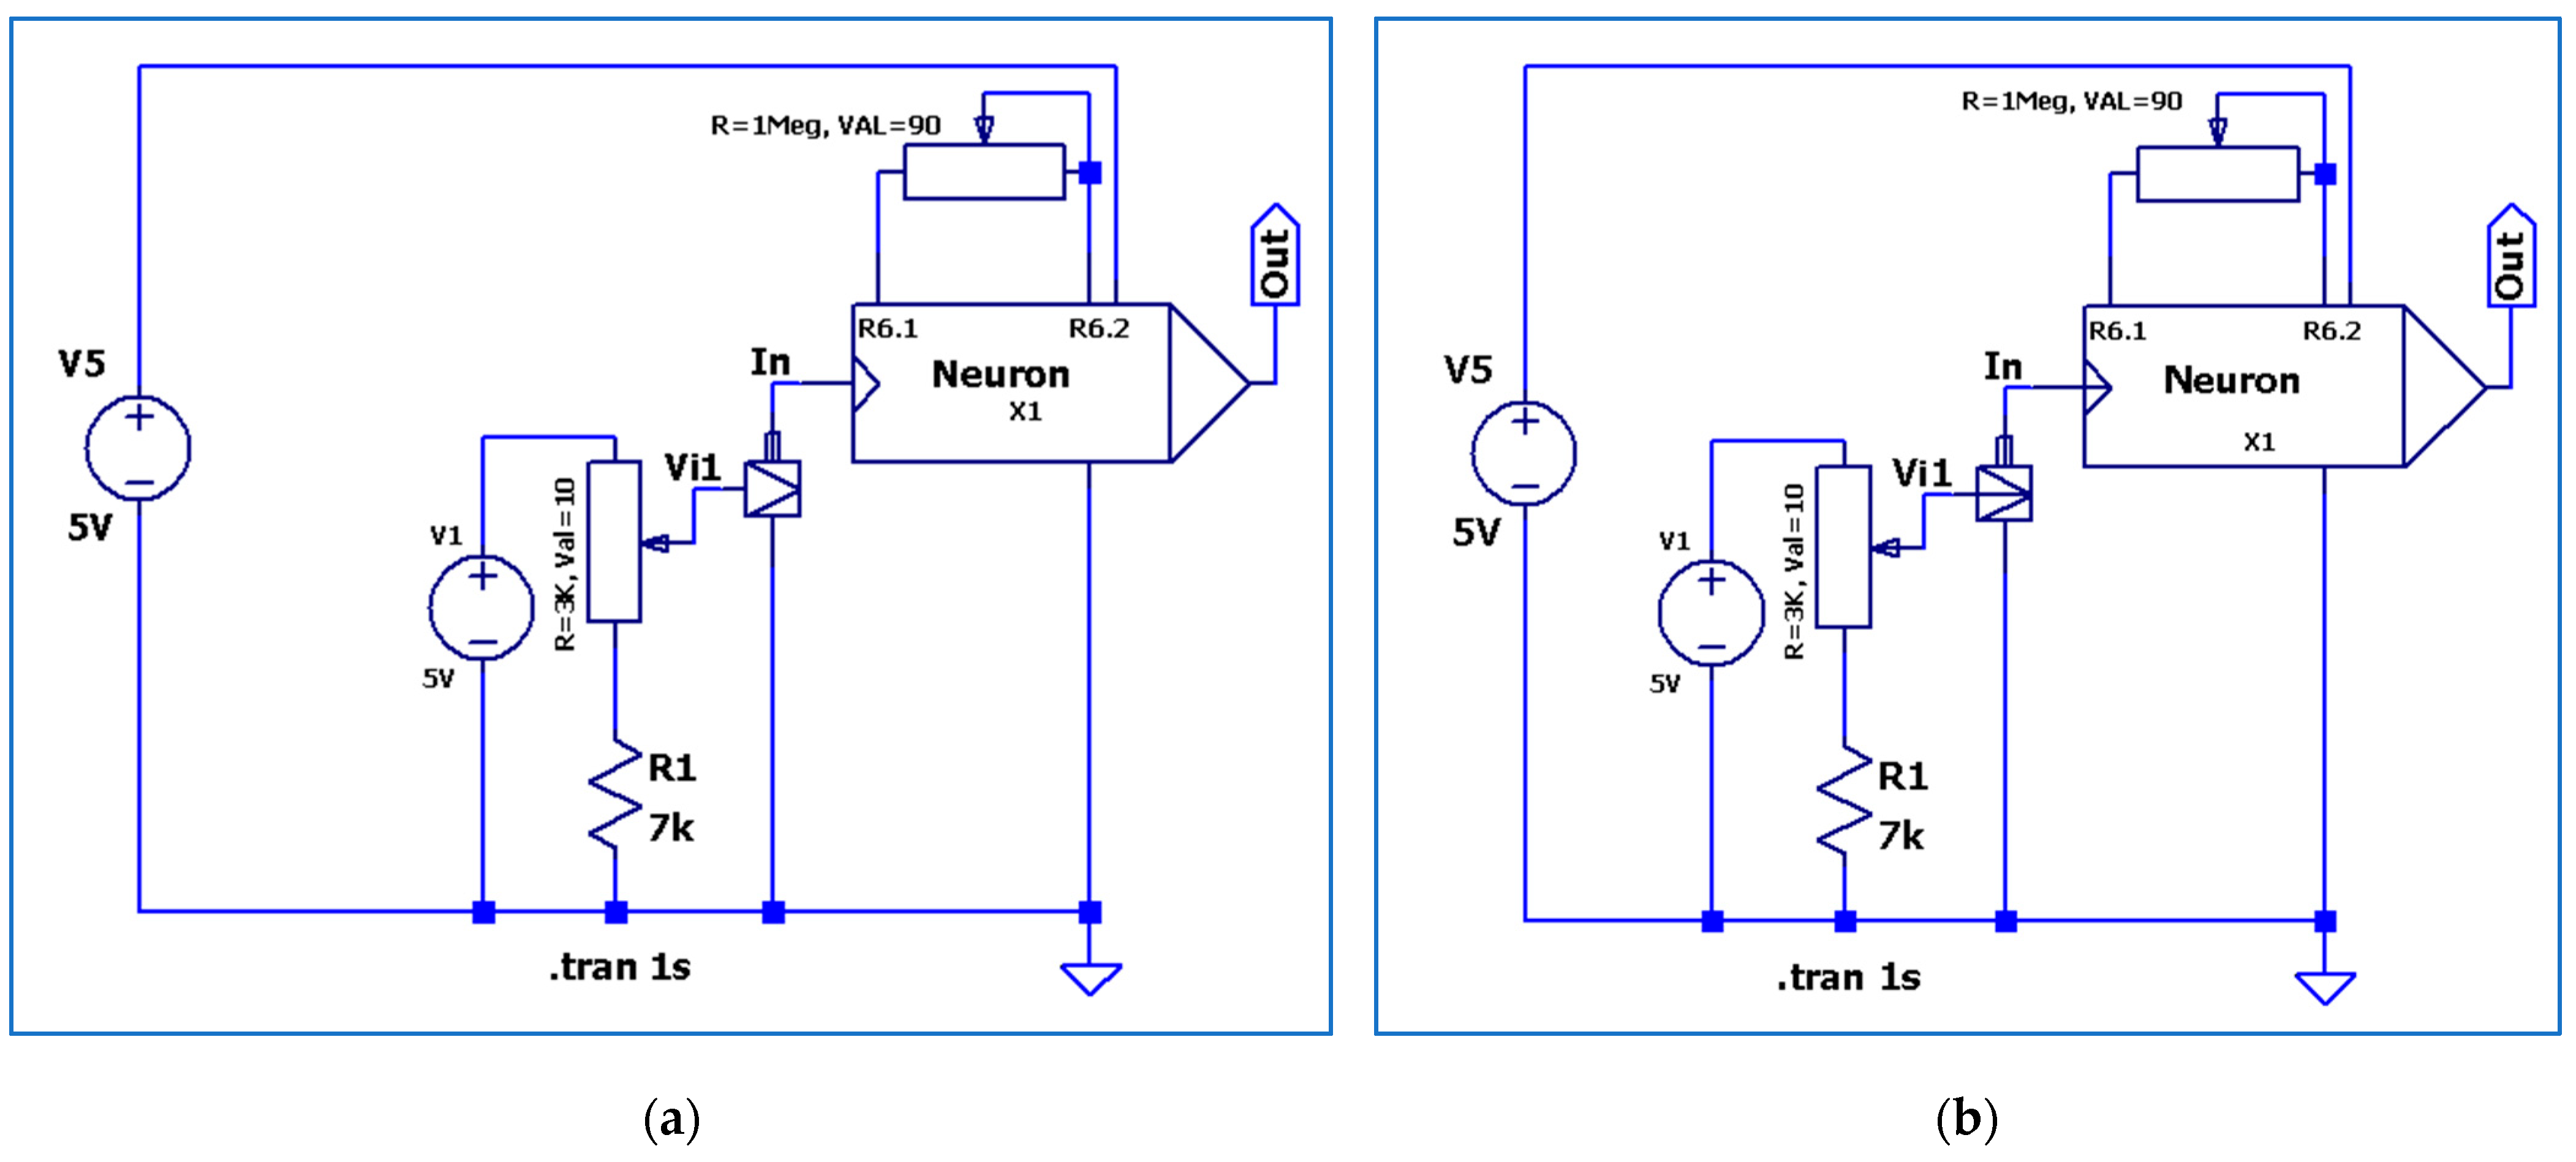
Taking into account the symbols in Figure 3A(a,b), Figure 4A,B and Figure 5A,B, we made the block schemes shown in Figure 12a,b. The neuron excitation is created by an excitatory synapse, this time using a continuous voltage, simulating an external sensation. At a certain value of the input voltage, simulating a threshold, a pulse signal is obtained at the output of the sensitive neuron. With an increase in the input voltage, the output pulse frequency also increases. The signal diagram, shown in Figure 13, is obtained for a 3.65 V dc value of the input voltage and a value of 100 kΩ for the potentiometer used to establish the output signal frequency.

3.3. The Electronic Scheme Model and Signal Diagram for the Recurrent Inhibition Reflex

The schemes in Figure 14A,B show two models, one with BJT and one with CMOS, for the loopback inhibition, using a Renshaw neuron. We used a pulse signal V2 of 5 V, 50 Hz, and 1 ms duty time, applied to the excitatory Vi1 synapse input. We collected the output signal and made a negative feedback loop, routing it to the neuron input using a potentiometer with one of its terminals connected to the Vi4 inhibitory synapse input. Knowing that the Renshaw neuron is used only for negative feedback, we considered it sufficient to simulate it by the feedback potentiometer. We obtained the diagram shown in Figure 15 for poor feedback and the diagram shown in Figure 16 for strong feedback. It can be observed that the output signal frequency significantly decreases when the feedback is stronger. To conduct the simulations, an 1 MΩ potentiometer was sufficient for the blocks designed with BJT. For the blocks designed with CMOS, a potentiometer with one order of magnitude greater was necessary. This is the only difference observed between the simulations with BJT and CMOS.
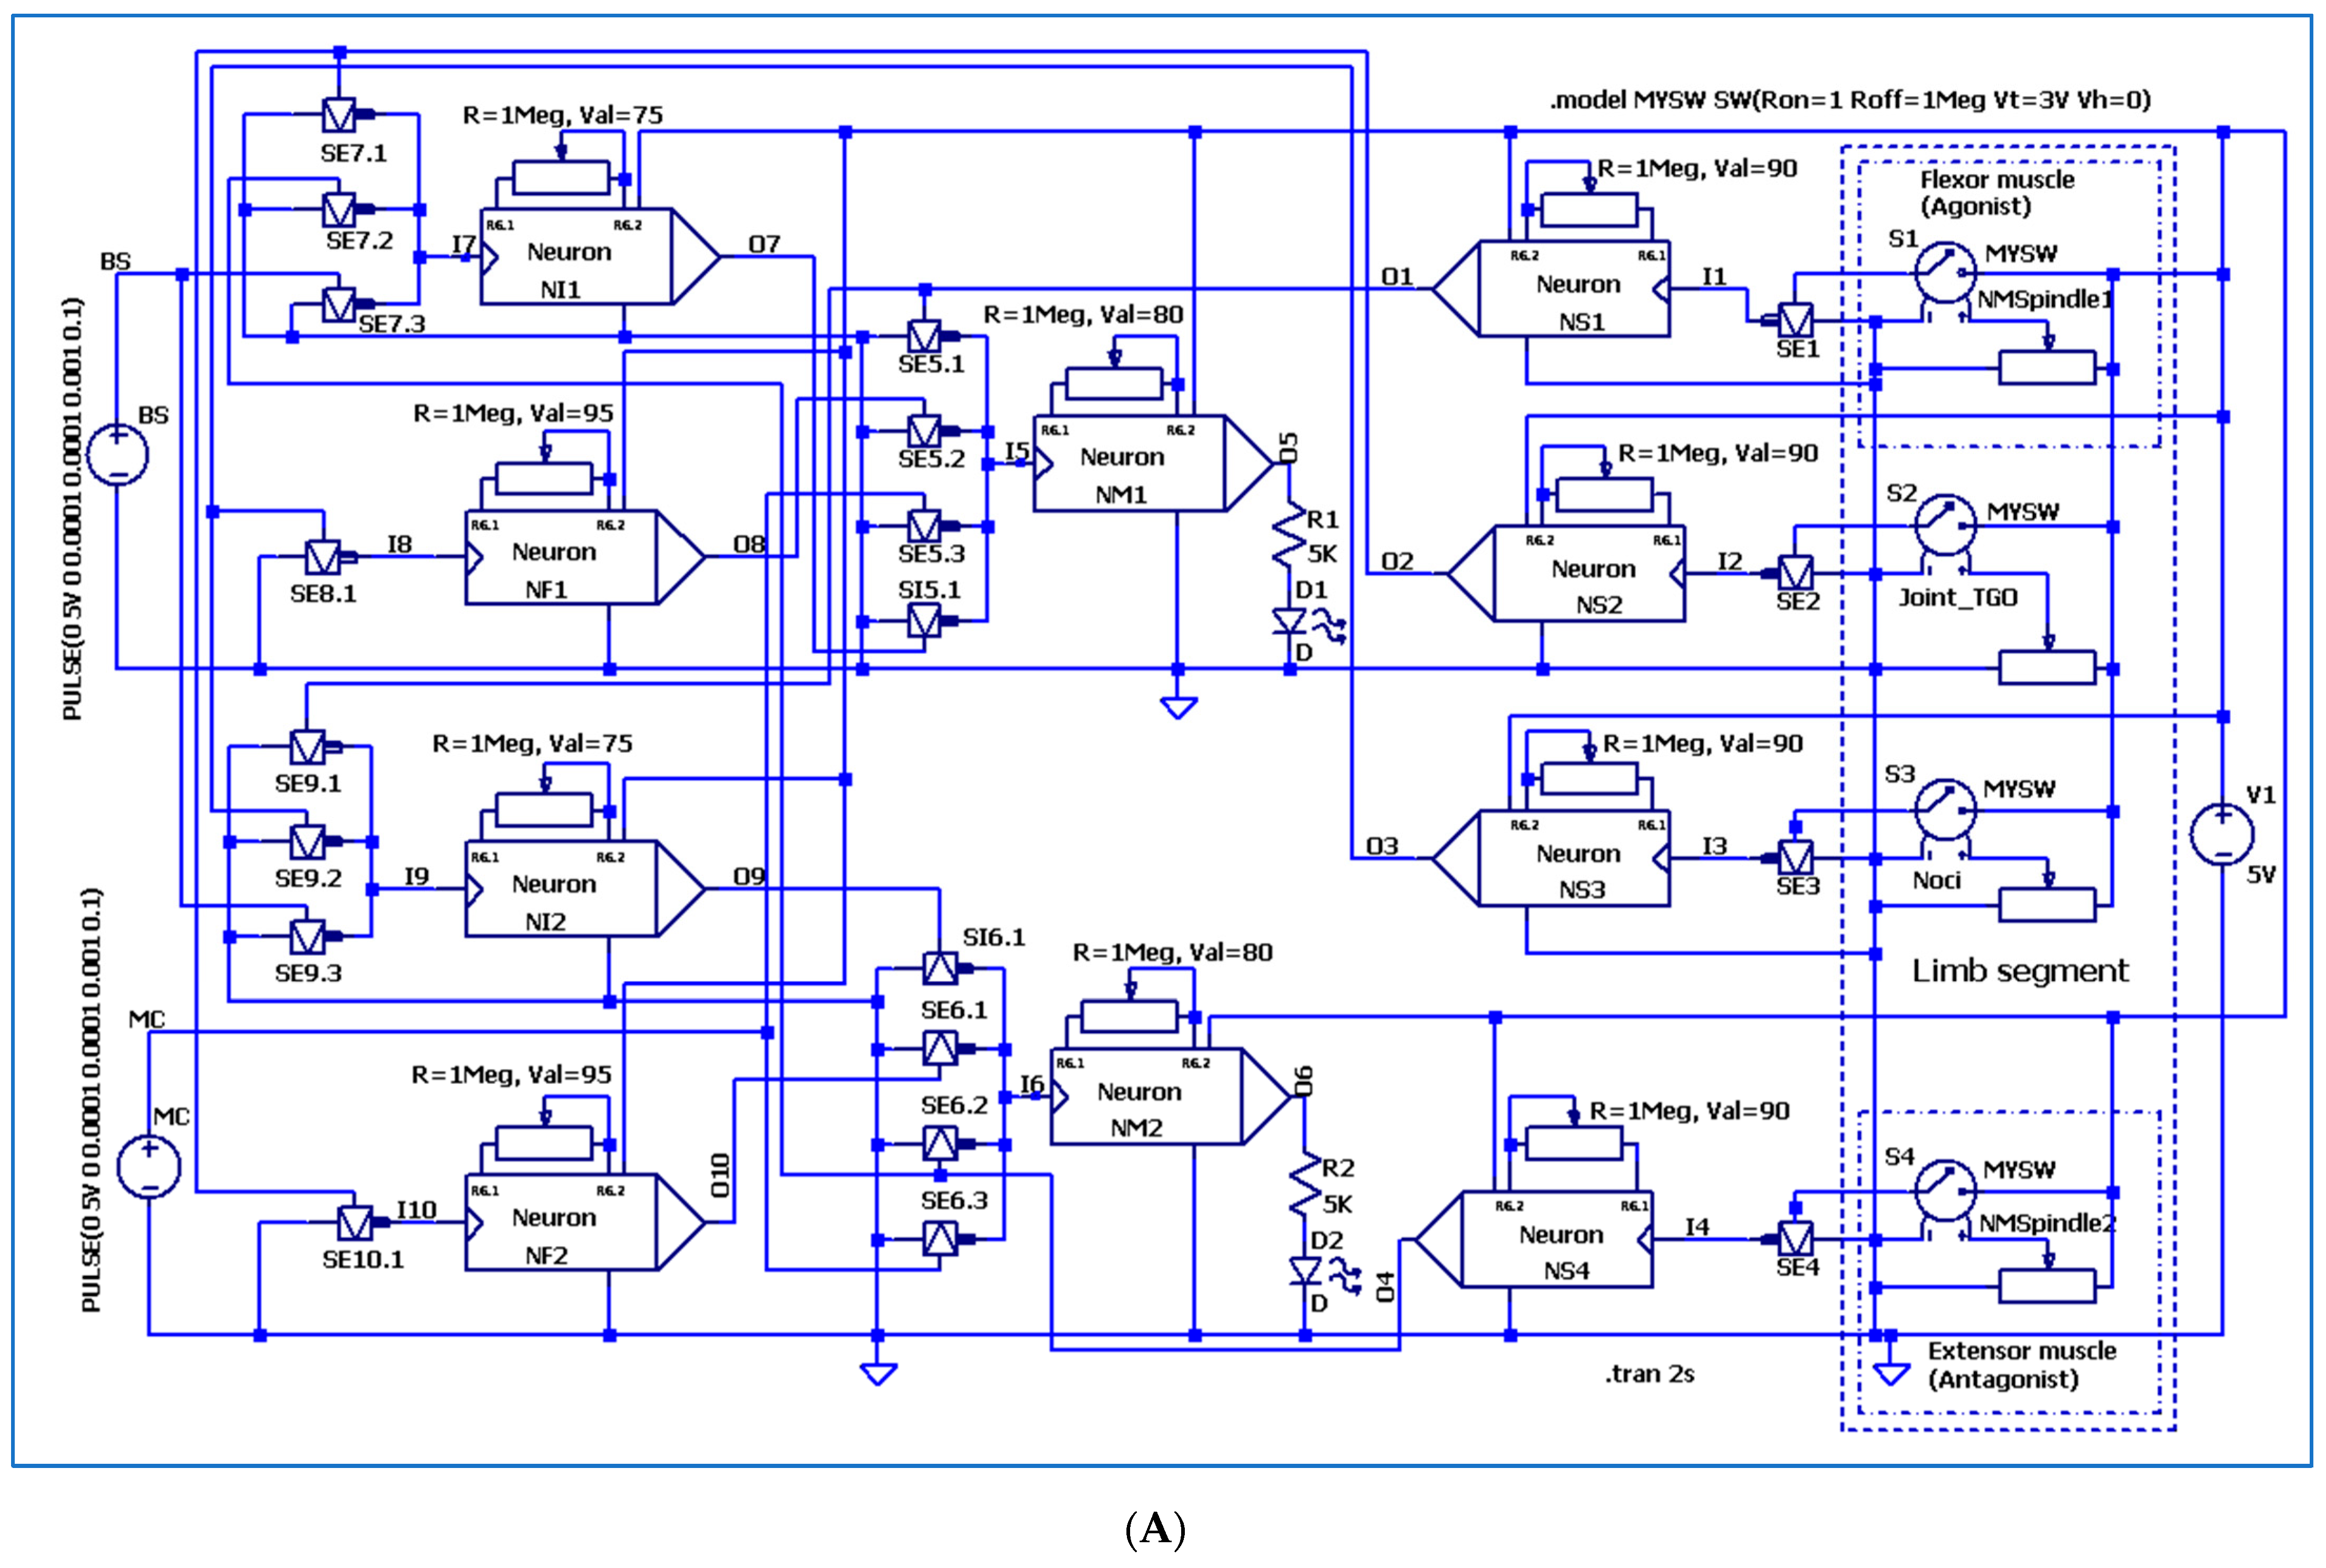
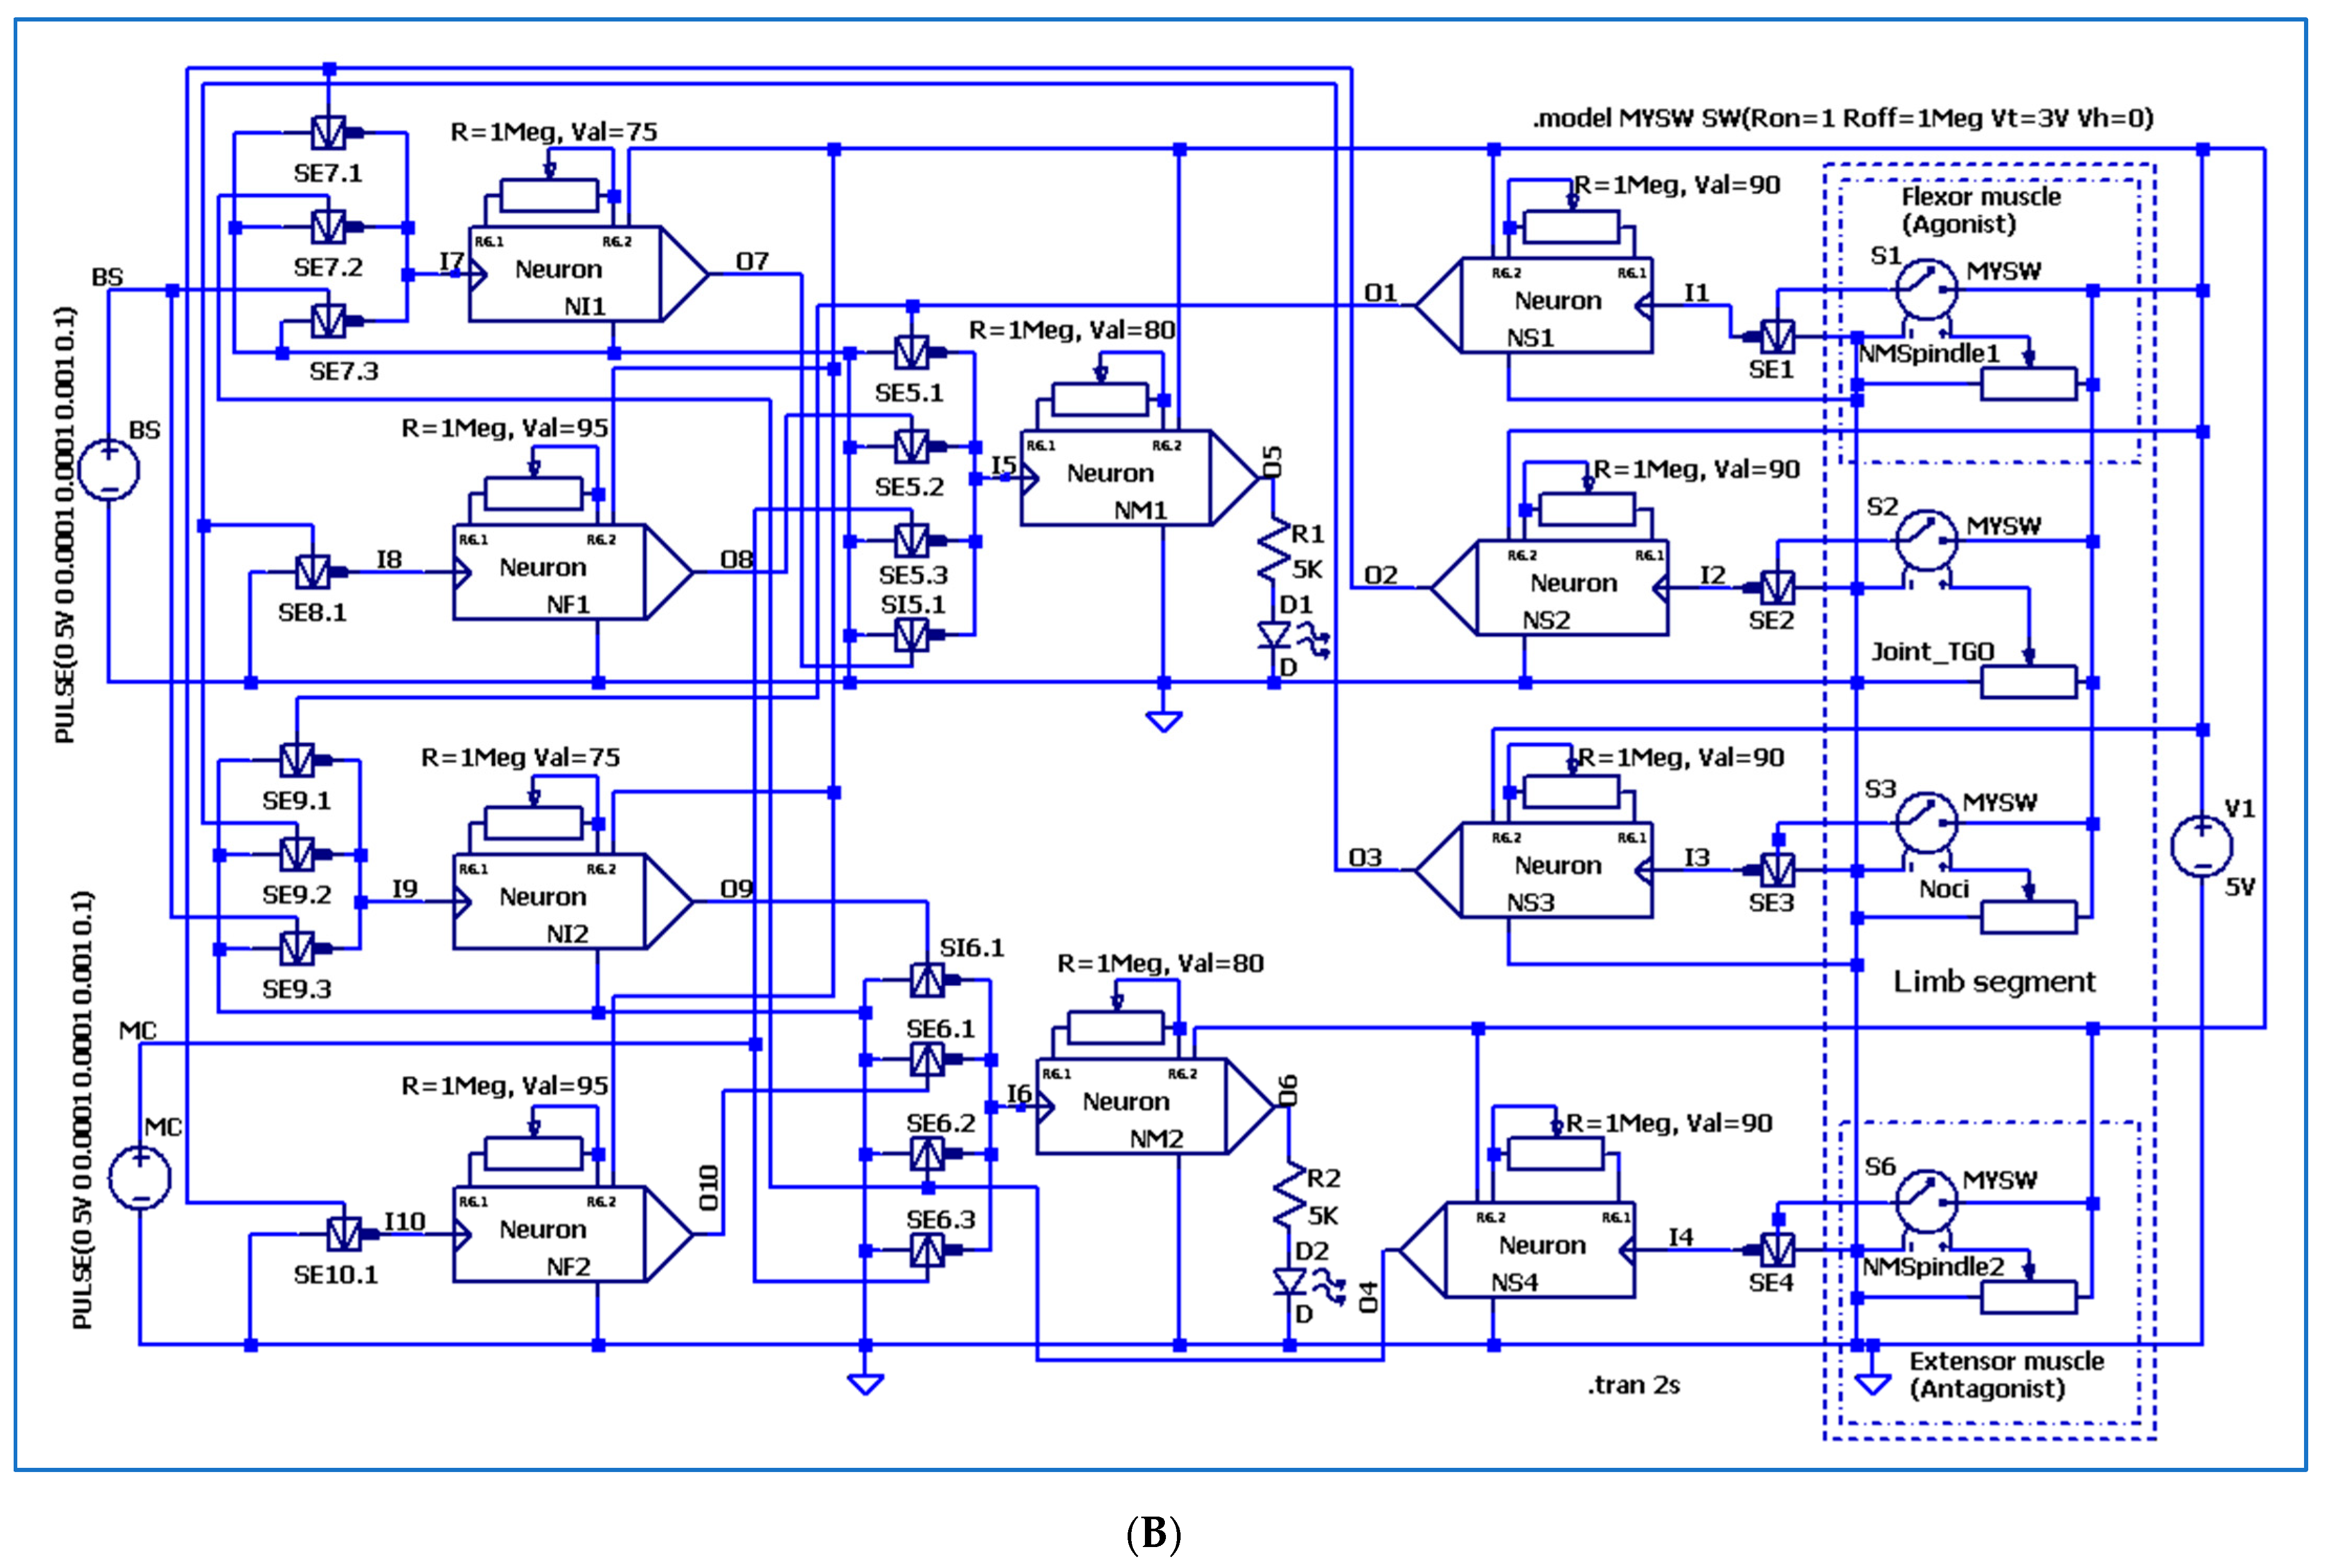
Figure 17A,B provide the schemes for the spinal reflexes, as they are described in [1]. We took into account the loops for the stretch reflex of the flexor muscle and the extensor muscle acting as a limb segment in one of the limb joints. The loops for the autogenic inhibition reflex, present as the agonist muscle for the flexor muscle, which is inhibited, and for the extension muscle as the antagonist muscle, which is facilitated, were all considered. So too were the loops for the flexion reflex at a nociceptor, present in the flexor muscle as the agonist muscle and in the extension muscle as the antagonist muscle. Every instantaneous sensation generating a reflex was simulated by using voltage-controlled switches with their control voltage established by a potentiometer. Using the directive “.model”, we established that when the voltage at the potentiometer cursor exceeds 3 V, the switch is turned on obtaining 5 V at the excitation synapse input of the associated sensitive neuron and a 50 Hz pulse signal at its output. Every motor neuron has an associated inhibition neuron acting through an inhibition synapse and an associated excitation neuron acting through an excitation synapse. Input signals are coming from the brain stem BS for both of the inhibitory neurons. Input signals are coming from the motor cortex MC, acting directly on motor neurons by excitation synapses. The pulse signal frequency from BS and MC is 10 Hz, simulating rest. Taking into account the neuronal signal frequency, the signals coming from BS and MC should not interfere with the pulse signal from the sensitive neuron, which has a much higher frequency value.
The signal diagram for the myotatic reflex present in the flexor muscle and reciprocal inhibition reflex present in the extensor muscle is given in Figure 18 and follows the paths I1-O1-I5-O5 and I1-O1-I9-O9-I6-O6.
The signal diagram for the myotatic reflex present in the extensor muscle and reciprocal inhibition reflex present in the flexor muscle is given in Figure 19 and follows the paths I4-O4-I6-O6 and I4-O4-I7-O7-I5-O5.
The autogenic inhibition reflex and the reciprocal excitation is illustrated only for the flexor muscle as agonist and the extensor muscle as antagonist. It is given in the signal diagram shown in Figure 20 and follows the paths I2-O2-I7-O7-I5-O5 and I2-O2-I10-O10-I6-O6.
The flexion reflex together with the reciprocal inhibition for the flexion reflex is illustrated only for the flexor muscle as agonist and the extensor muscle as antagonist. The crossed extension reflex was not illustrated due to the lack of space. It is given in the signal diagram of Figure 21 and follows the paths I3-O3-I8-O8-I5-O5 and I3-O3-I9-O9-I6-O6.
To illustrate the signals from the MC and BS and their effect on the motor neuron outputs when there is no condition for a spinal reflex, we provide the signal diagram shown in Figure 22.

4. Discussion

The schemes present some models for the spinal reflexes. With a few changes, such as removing the local supply and pulses sources, we have defined blocks in order to simplify our work. By using real electronic circuits, the source voltages were those deemed necessary to supply these circuits.
The knowledge from references [5,6,7,8,9,10,11,12,13,14,15,16,17,18,19,20] with their applications helped us to gain experience with the simulation environment. The knowledge from [21,22,23,24,25,26,27,28,29,30,31,32,33,34] made us aware of the neuroscience domain. Recent research [32,33,34] published in IEEE journals shows us that software simulations and system modeling are not only useful but a regular procedure in medical practice and rehabilitation. Other publications were consulted as well, but they are not mentioned in the references.
There are a lot of papers, e.g., [35,36], that provide a very precise mathematical model of the spiking neuron. Our aim was the simulation of the spinal cord reflexes using an idealized model of the neuron spikes, and we used short rectangular pulses. Of course, the simulation environment would allow changing the pulse aspect, decreasing the ON time to zero, in order to exactly mimic the pulse aspect. Even the y-axis position, with respect to the pulses, could be resolved using a resistive divisor and a second power source. We considered that our simplifications would not dramatically change the electronic schemes and the simulation results.

5. Conclusions

Advancing, using the small steps theory, we succeeded in simulating the entire complexity of the spinal cord reflexes as recent neuroscience textbooks and papers present them. Starting from these schemes, in the future, we also intend to use biomimetic circuits to conduct our simulations.
By using the same technique, we would like to take the simulations further to the upper levels of the nervous system. Thus, we hope to be able to conduct simulations for all the control loops of the nervous system, mainly for the locomotion system as part of the somatic system. One of our aims is to understand the nervous system better and use this experience for treatments and rehabilitation.
As we take this study further, the schemes we present could also be improved and the diagrams modified. All the feedback received, even negative, would be welcome, and we would appreciate critical perspectives that will prove useful.

Author Contributions

For this article, the individual contributions of authors were conceptualization, paper writing by M.P. and supervision by C.R. All authors have read and agreed to the published version of the manuscript.

Funding

The paper was partially supported by the PubArt Project from UPB-Bucharest, Romania.

Institutional Review Board Statement

Not applicable.

Informed Consent Statement

Not applicable.

Data Availability Statement

The data that support the findings of this study are available from the corresponding author upon reasonable request. The data are not publicly available due to privacy.

Conflicts of Interest

The authors declare no conflicts of interest. The funders had no role in the design of the study, in the writing of the manuscript, or in the decision to publish the results.

References

  1. Byrne, G.H.; Dafny, N. Neuroscience Online: An Electronic Textbook for the Neurosciences; Department of Neurobiology and Anatomy, University of Texas Medical School at Houston: Houston, TX, USA, 1997; Available online: https://nba.uth.tmc.edu/neuroscience/m/ (accessed on 1 December 2023).
  2. Guertin, P.A. Central pattern generator for locomotion: Anatomical, physiological, and pathophysiological considerations. Front. Neurol. 2013, 3, 183. [Google Scholar] [CrossRef] [PubMed]
  3. Mescher, A.L. Junqueira’s Basic Histology: Text and Atlas; McGraw Hill: New York, NY, USA, 2018. [Google Scholar]
  4. Morega, M. Bioelectromagnetism, 1st ed.; Matrix Rom: Bucharest, Romania, 1999; pp. 57–128. [Google Scholar]
  5. Cruz, P.M.R.; Cossins, J.; Beeson, D.; Vincent, A. The Neuromuscular Junction in Health and Disease: Molecular Mechanisms Governing Synaptic Formation and Homeostasis. Front. Mol. Neurosci. 2020, 13, 610964. [Google Scholar] [CrossRef] [PubMed]
  6. Balal, A.; Rukh, S.; Balali, S. Designing a Dual Active Transformer DC-DC Forward Converter for DC Micro-Grid Applications Using LTSPICE. Int. J. Appl. Eng. Res. 2021, 16, 327–331. [Google Scholar]
  7. Engelhardt, M. Using Transformers in LTspice/SwitcherCAD III. Linear Technol. Mag. 2006, 23–24. [Google Scholar]
  8. Ahmed, M.R.; Todd, R.; Forsyth, A.J. Predicting SiC MOSFET behavior under hard-switching, soft-switching, and false turn-on conditions. IEEE Trans. Ind. Electron. 2017, 64, 9001–9011. [Google Scholar] [CrossRef]
  9. Babacan, Y. An operational transconductance amplifier-based memcapacitor and meminductor. Electrica 2018, 18, 36–38. [Google Scholar] [CrossRef]
  10. Wang, X.; Jin, C.; Eshraghian, J.K.; Iu HH, C.; Ha, C. A behavioral spice model of a binarized memristor for digital logic implementation. Circuits Syst. Signal Process. 2021, 40, 2682–2693. [Google Scholar] [CrossRef]
  11. Alonso, G. Get Up and Running with LTspice. 41 Underst. Fundam. Earthq. Signal Sens. Netw. 2019, 53, 60. [Google Scholar]
  12. Akram, S.; Bertilsson, K.; Siden, J. LTspice electro-thermal model of joule heating in high density polyethylene optical fiber microducts. Electronics 2019, 8, 1453. [Google Scholar] [CrossRef]
  13. Viswanathan, S.M. Design and Analysis of Operational Transconductance Amplifier (OTA) Under 180 nm Technology Using LTspice. JASC 2020, 1076–5131, 107–115. [Google Scholar]
  14. Liu, G.; Shen, S.; Jin, P.; Wang, G.; Liang, Y. Design of memristor-based combinational logic circuits. Circuits Syst. Signal Process. 2021, 40, 5825–5846. [Google Scholar] [CrossRef]
  15. Menzio, L.U.C.A.; Arcidiacono, R.; Borghi, G.; Boscardin, M.; Cartiglia, N.; Vignali, M.C.; Costa, M.; Dalla Betta, G.F.; Ferrero, M.; Ficorella, F.; et al. DC-coupled resistive silicon detectors for 4D tracking. Nucl. Instrum. Methods Phys. Res. Sect. A Accel. Spectrometers Detect. Assoc. Equip. 2022, 1041, 167374. [Google Scholar] [CrossRef]
  16. Khawaldeh, H.A.; Al-Soeidat, M.; Lu DD, C.; Li, L. Simple and Fast Dynamic Photovoltaic Emulator based on a Physical Equivalent PV-cell Model. J. Eng. 2021, 2021, 276–285. [Google Scholar] [CrossRef]
  17. Özer, E.; Başak, M.E.; Kaçar, F. Realizations of lossy and lossless capacitance multiplier using CFOAs. AEU-Int. J. Electron. Commun. 2020, 127, 153444. [Google Scholar] [CrossRef]
  18. Başak, M.E.; Kaçar, F. Lossy/lossless grounded inductance simulators using current feedback operational amplifier (CFOA). Electrica 2018, 18, 95–99. [Google Scholar]
  19. Grasso, F.; Manetti, S.; Piccirilli, M.C.; Reatti, A. A Laplace transform approach to the simulation of DC-DC converters. Int. J. Numer. Model. Electron. Netw. Devices Fields 2019, 32, e2618. [Google Scholar] [CrossRef]
  20. Maranhão, G.; Guimarães, J.G. Low-power hybrid memristor-CMOS spiking neuromorphic STDP learning system. IET Circuits Devices Syst. 2021, 15, 237–250. [Google Scholar] [CrossRef]
  21. Choi, M.; Jang, M.; Yoo, S.S.; Noh, G.; Yoon, K. Deep Neural Network for Navigation of a Single-Element Transducer During Transcranial Focused Ultrasound Therapy: Proof of Concept. IEEE J. Biomed. Health Inform. 2022, 26, 5653–5664. [Google Scholar] [CrossRef]
  22. Mikkelsen, J.H. Ltspice—An Introduction; Technical Report; Institute of Electronic Systems, Aalborg University: Aalborg, Denmark, 2005. [Google Scholar]
  23. Chung, E.J.; Yang, B.E.; Park, I.Y.; Yi, S.; On, S.W.; Kim, Y.H. Effectiveness of cone-beam computed tomography-generated cephalograms using artificial intelligence cephalometric analysis. Sci. Rep. 2022, 12, 20585. [Google Scholar] [CrossRef]
  24. Moon, H.C.; Park, S.J.; Kim, Y.D.; Kim, K.M.; Kang, H.; Lee, E.J.; Kim, M.S.; Kim, J.W.; Kim, Y.H.; Park, C.K.; et al. Navigation of Frameless Fixation for Gama Knife Radiosurgery Using Fixed Augumented Reality. Sci. Rep. 2022, 12, 4486. [Google Scholar] [CrossRef]
  25. Marican, N.D.; Halim, M.H.A.; Nor, M.A.M.; Nasir, M.F.M. Reflexology, A Modality in Manipulative and Body Based Method. Indian J. Public Health Res. 2019, 10, 515–519. [Google Scholar] [CrossRef]
  26. Kaur, N.; Bhanot, K.; Ferreira, G. Lower Extremity and Trunk Electromyographic Muscle Activity During Performance of the Y-Balance Test on Stable and Unstable Surfaces. Int. J. Sports Phys. Ther. 2022, 17, 483–486. [Google Scholar] [CrossRef] [PubMed]
  27. Voicu, M. Systems Theory; Romanian Academy: Bucharest, Romania, 2008; pp. 29–89. [Google Scholar]
  28. Eigenschink, M.; Dearing, L.; Dablander, T.E.; Maier, J.; Sitte, H.H. A critical examination of the main premises of Traditional Chinese Medicine. Wien. Clin. Wkly. J. 2020, 132, 260–273. [Google Scholar] [CrossRef] [PubMed]
  29. Procacini, C.; Pucino, V.; De Rosa, V.D.; Marone, G.; Matarese, G. Neuro-Endocrine Networks Controlling Immune System in Health and Disease. Front. Immunol. 2014, 5, 143. [Google Scholar]
  30. Mueler, B.; Figueroa, A.; Papp, J.R. Structural and Functional Connection Between the Autonomic Nervous System, Hypothalamic-Pituitary-Adrenal Axis, and the Immune System: A Contex and Time Dependant Stress Response Network. Neurol. Sci. 2022, 43, 951–960. [Google Scholar] [CrossRef]
  31. Dantzer, R. Neuroimune Interactions: From the Brain to the Immune System and Vice Versa. Physiol. Rev. 2018, 98, 477–504. [Google Scholar] [CrossRef]
  32. Fang, X.; Collins, S.; Nanivadekar, A.C.; Jantz, M.; Gaunt, R.A.; Capogrosso, M. An Open-source Computational Model of Neurostimulation of the Spinal Pudendo-Vesical Reflex for the Recovery of Bladder Control After Spinal Cord Injury. In Proceedings of the 2022 44th Annual International Conference of the IEEE Engineering in Medicine & Biology Society (EMBC), Glasgow, Scotland, UK, 11–15 July 2022; pp. 1607–1610. [Google Scholar] [CrossRef]
  33. Perreault, E.J.; Crago, P.E.; Kirsch, R.F. Estimation of intrinsic and reflex contributions to muscle dynamics: A modeling study. IEEE Trans. Biomed. Eng. 2000, 47, 1413–1421. [Google Scholar] [CrossRef]
  34. Zheng, Z.; Mo, F.; Liu, T.; Li, X. A Novel Neuromuscular Head-Neck Model and Its Application on Impact Analysis. IEEE Trans. Neural Syst. Rehabil. Eng. 2021, 29, 1394–1402. [Google Scholar] [CrossRef]
  35. Fortuna, L.; Buscarino, A. Spiking neuron mathematical models: A compact overview. Bioengineering 2023, 10, 174. [Google Scholar] [CrossRef]
  36. Jolivet, R.; Kobayashi, R.; Rauch, A.; Naud, R.; Shinomoto, S.; Gerstner, W. A benchmark test for a quantitative assessment of simple neuron models. J. Neurosci. Methods 2008, 169, 417–424. [Google Scholar] [CrossRef]
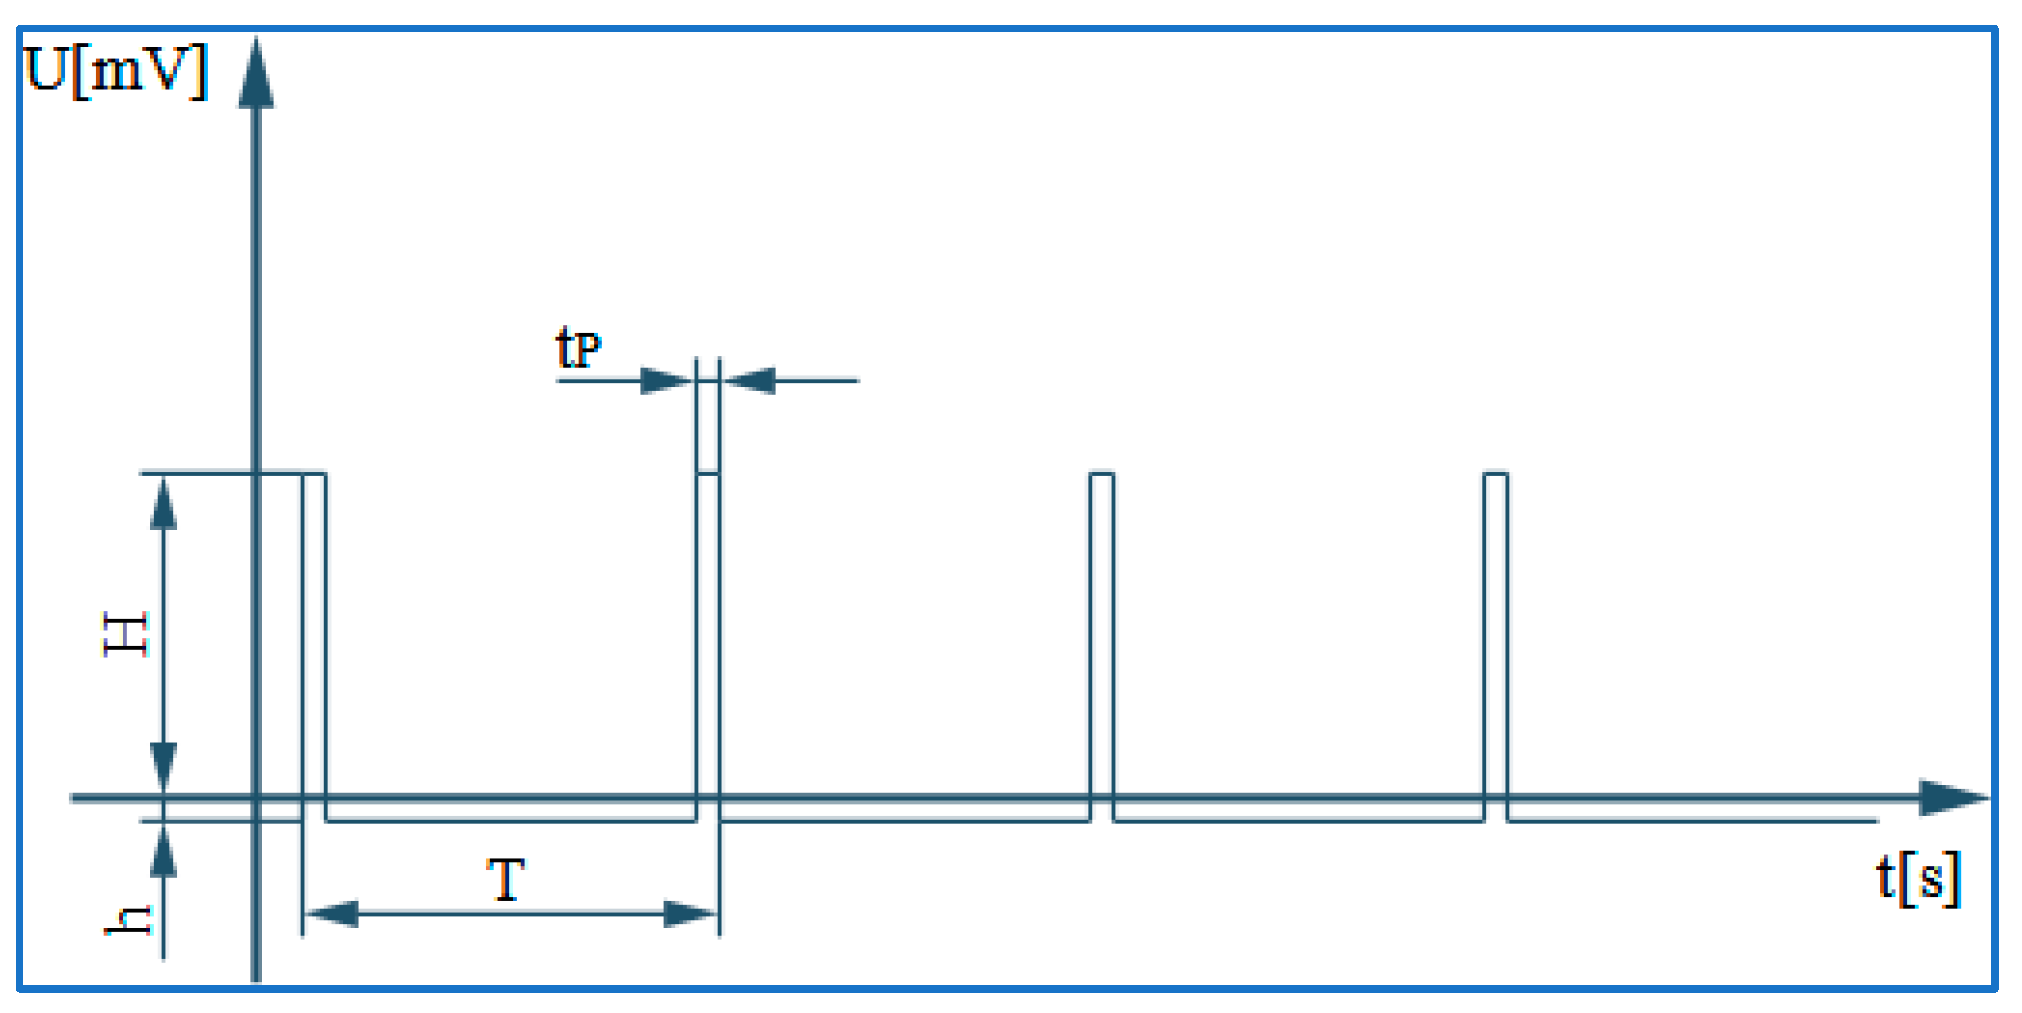
Figure 1. Neuronal pulse train parameters.
Applsci 14 00310 g001
Figure 2. (A) Scheme for the general neuron electronic model with input polarization using BJT. (B) Scheme for the general neuron electronic model with input polarization using CMOS and BJT transistors.
Applsci 14 00310 g002
Figure 3. (A) General neuron symbol without input synapses using BJT (a) and CMOS (b). (B) General neuron electronic model using BJT without input synapses. (C) General neuron electronic model with BJT and CMOS without input synapses.
Applsci 14 00310 g003aApplsci 14 00310 g003b
Figure 4. (A) Excitatory synapse scheme (a) and symbol (b) using BJT. (B) Inhibitory synapse scheme (a) and symbol (b) using BJT.
Applsci 14 00310 g004
Figure 5. (A) Excitatory synapse scheme (a) and symbol (b) using CMOS. (B) Inhibitory synapse scheme (a) and symbol (b) using CMOS.
Applsci 14 00310 g005
Figure 6. (A) Block scheme for the general neuron type with input polarization using BJT. (B) Block scheme for the general neuron type with input polarization using CMOS.
Applsci 14 00310 g006aApplsci 14 00310 g006b
Figure 7. Signal diagram for the general neuron type with R6 = 100 K, V1 type pulse 5 V, 50 Hz, and 0.001 s duty time.
Applsci 14 00310 g007
Figure 8. Signal diagram for the general neuron type with R6 = 900 K, V1 type pulse 5 V, 50 Hz, and 0.001 s duty time.
Applsci 14 00310 g008
Figure 9. Signal diagram for the general neuron type with R6 = 900 K, V1 and V2 type pulse 5 V, 50 Hz, and 0.001 s duty time.
Applsci 14 00310 g009
Figure 10. Signal diagram for the general neuron type with R6 = 900 K, V1 type pulse 5 V, 10 Hz, and 0.001 s duty time.
Applsci 14 00310 g010
Figure 11. Signal diagram for the general neuron type with R6 = 900 K, V1 and V2 type pulse 5 V, 10 Hz, and 0.001 s duty time.
Applsci 14 00310 g011
Figure 12. Block scheme for the general neuron type with R6 = 100 K and V1 d.c. 3.65 V acting like a sensitive neuron, using BJT (a) and CMOS (b).
Applsci 14 00310 g012
Figure 13. Signal diagram for the sensitive neuron model with R6 = 100 K, and V1 = 3.65 V d.c.
Applsci 14 00310 g013
Figure 14. (A) General neuron scheme with Renshaw neuron feedback with R6 = 900 K, Vi1 Pulse (5 V, 50 Hz, and 0.001 s duty time), with BJT blocks. (B) General neuron scheme with Renshaw neuron feedback with R6 = 900 K, Vi1 Pulse (5 V, 50 Hz, and 0.001 s duty time), with CMOS blocks.
Applsci 14 00310 g014
Figure 15. Scheme diagram for the general neuron with Renshaw neuron feedback with R6 = 900 K and poor feedback.
Applsci 14 00310 g015
Figure 16. Scheme diagram for the general neuron with Renshaw neuron feedback with R6 = 900 K and pronounced feedback.
Applsci 14 00310 g016
Figure 17. (A) Scheme model for spinal reflexes with BJT blocks. (B) Scheme model for spinal reflexes with CMOS blocks.
Applsci 14 00310 g017aApplsci 14 00310 g017b
Figure 18. Scheme diagram for the myotatic reflex of a limb flexor muscle.
Applsci 14 00310 g018
Figure 19. Scheme diagram for the myotatic reflex of a limb extensor muscle.
Applsci 14 00310 g019
Figure 20. Scheme diagram for an autogenic inhibition reflex.
Applsci 14 00310 g020
Figure 21. Scheme diagram for the flexion reflex.
Applsci 14 00310 g021
Figure 22. Spinal reflexes scheme diagram for no external excitation.
Applsci 14 00310 g022
Disclaimer/Publisher’s Note: The statements, opinions and data contained in all publications are solely those of the individual author(s) and contributor(s) and not of MDPI and/or the editor(s). MDPI and/or the editor(s) disclaim responsibility for any injury to people or property resulting from any ideas, methods, instructions or products referred to in the content.