Article

Designing a Synthetic 3D-Printed Knee Cartilage: FEA Model, Micro-Structure and Mechanical Characteristics

by
Gianmarco Dolino
1,†,
Damiano Coato
1,†,
Riccardo Forni
1,2,*,
Gabriele Boretti
1,
Federica Kiyomi Ciliberti
1 and
Paolo Gargiulo
1,3
1
Institute of Biomedical and Neural Engineering, Reykjavik University, 102 Reykjavík, Iceland
2
Department of Electric, Electronic and Information Engineering Guglielmo Marconi, Bologna University, 40136 Bologna, Italy
3
Department of Science, Landspitali Huniversity Hospital, 105 Reykjavik, Iceland
*
Author to whom correspondence should be addressed.
These authors contributed equally to this work.
Appl. Sci. 2024, 14(1), 331; https://doi.org/10.3390/app14010331
Submission received: 30 November 2023 / Revised: 24 December 2023 / Accepted: 26 December 2023 / Published: 29 December 2023
(This article belongs to the Special Issue Biomechanics of Soft and Hard Tissues)

Abstract

:
Articular cartilage morphology and composition are essential factors in joint biomechanics, and their alteration is a crucial aspect of osteoarthritis (OA), a prevalent disease that causes pain and functional loss. This research focuses on developing patient-specific synthetic cartilage using innovative Digital Anatomy polymers. The objectives include investigating the morphology, characterizing the mechanical properties, and replicating the architecture of natural cartilage. This approach offers potential alternatives to traditional manufacturing methods and reduces the need for expensive in vivo experiments. Finite Element Analysis (FEA) validates a novel patient-specific measurement setup. It provides insights into the role of morphology in the distribution of stress and strain within cartilage. CAD design is also utilized to create standardized fiber-reinforced samples that mimic the layered micro-architecture of natural cartilage, allowing for the study of their contribution to the overall mechanical properties. The results demonstrate that 3D-printed polymers can effectively replicate the elastic properties of cartilage. The proposed patient-specific simulator produces reliable results, which have been validated through FEM analysis. While the recreated microstructure closely resembles biological cartilage samples, the elastic properties are slightly underestimated. In conclusion, designing an in silico knee joint is a feasible approach that offers numerous advantages for further development. The Young’s modulus values of our synthetic cartilage modules range from 2.43 MPa to 7.24 MPa, within the range reported in the literature. Moreover, Young´s modulus at the micro level shows the differences between surface 1.74 MPa and internal substrate 1.83 MPa depending on the fiber orientation. Finally, our model proves to be mechanically and morphologically accurate at both the macro and micro levels.

1. Introduction

Articular cartilage is a complex anisotropic tissue composed of a high percentage of water and biological components, such as collagen and glycosaminoglycans (GAGs), and plays a pivotal role in providing a cushioning effect, reducing friction between bones, and ensuring seamless articulation. The mechanical performance of native cartilage is mainly contributed by collagen fibers and their orientation throughout the tissue. The cartilage can be divided into four zones based on depth: superficial zone (10–20% of total thickness); middle zone (40–60%); deep zone (20–30%); and calcified zone [1,2]. These zones differ in composition, with variations in GAGs and collagen content, collagen fiber orientation, and cell density. The transition between the deep and calcified zones is known as the tidemark, where the cartilage tissue merges into the subchondral bone.
Osteoarthritis (OA) is the most common form of cartilage and joint disease globally [3]. It is a prevalent cause of pain, functional loss, and adult disability in Western countries [4].
OA is characterized by the gradual erosion and degeneration of the articular cartilage within the joint, which serves as a critical component in facilitating smooth joint movement. However, in OA, this protective cartilage undergoes significant changes. As the disease progresses, the cartilage begins to wear away, leading to an uneven distribution of mechanical forces within the joint. This imbalance triggers the generation of fibrocartilage, an inferior type of tissue that lacks the resilience and functionality of healthy cartilage. Concurrently, catabolic reactions ensue, further contributing to the breakdown of the cartilaginous matrix. The non-physiological mechanical stimulation of chondrocytes, the specialized cells within the cartilage responsible for maintaining its structure, adds another layer of complexity to the OA pathophysiology. These chondrocytes, instead of promoting cartilage repair, become active participants in the degenerative process [5].
Currently, the gold standards for diagnosing knee OA include clinical evaluation, medical history, and imaging techniques. Physical examination and medical history help assess symptoms, joint deformities, and previous joint-related conditions. Imaging techniques such as X-ray, Magnetic Resonance Imaging (MRI), and Computed Tomography (CT) provide valuable information on the degree and location of joint damage, confirming the diagnosis and assessing the extent of damage [6].
Unfortunately, there is currently no disease-modifying therapy available for OA, and medications aimed at treating its symptoms are generally not very successful. Therefore, the focus in cartilage treatments is to develop methods with consistent regenerative potential [7]. Animal models are crucial for bridging the gap between in vitro experiments and human clinical studies when introducing these treatments into clinical practice. Choosing an appropriate animal model involves considering multiple factors, including research funding, costs of animal purchase and housing, and the suitability of each model for specific cartilage research projects [8].
Amid increasing awareness about the importance of reducing animal experiments, cutting costs, and accelerating development timelines, our study aims to design and create synthetic cartilage tissue using computational modeling and 3D-printing technology. Three-dimensional printing, also known as additive manufacturing, involves the layer-by-layer deposition of materials to create three-dimensional objects. It is widely used in various industries for producing prototypes, customized products, and complex geometries [9]. In healthcare, 3D printing is utilized for creating patient-specific implants [10], prosthetics, and anatomical models for surgical planning [11]. While previous 3D-printed anatomical models have achieved similarities to human tissue in shape, they have not fully replicated mechanical responsiveness [12]. Digital Anatomy Printing is an advanced form of 3D printing specifically designed for the medical field. It involves the use of specialized materials that mimic the properties of human tissues, allowing for the creation of highly detailed anatomical models [13]. Digital Anatomy Printing bridges the gap between traditional 3D printing and BioPrinting by simulating the look and feel of human tissues without the ability to create functional living tissues [14]. On the other hand, BioPrinting stands out for its ability to create functional living tissues and organs, ushering in a new era of possibilities in the fields of medicine and biotechnology [15]. However, the dimension is still limited due to the absence of vascularization [16]; the mechanical properties of these functionalized tissues have not reached yet those of their native counterparts [17].
This proposed methodology not only provides a promising alternative to traditional manufacturing methods but also enables the use of Finite Element Analysis (FEA) to assess the mechanical characteristics of materials in a simulated environment, reducing the need for expensive and complex in vivo experiments [12,18]. In this article, we will explore the process of developing patient-specific synthetic cartilage tissue, with a specific focus on mechanical properties, morphology, and microstructure.
The main goals of the study are (1) the morphological investigation and characterization of the knee joint in healthy and osteoarthritic patients with the segmentation of medical images through FEM and mechanical tests; (2) the mechanical characterization of 3D-printed innovative Digital Anatomy polymers capable of matching the behavior of cartilage native tissue; (3) mimicking the cartilage morphology by taking into account the micro-structure of the tissue and thus incorporating the fibers inside the samples and assessing their contribution to the mechanical response.

2. Materials and Methods

2.1. Clinical Data

Patients diagnosed with Degenerative OA (D) and healthy Control subjects (C) were recruited within the EU project RESTORE (https://restore-project.ru.is, accessed 1 July 2022). A further explanation of the acquisition protocol and the facilities utilized is described in a previous work [19].
Within the aim of relating material properties and morphological changes due to OA, one young healthy subject and one elder with clinically evaluated cartilage degeneration were chosen. The subjects description is as follows:
-
Subject 1: group = D, age = 68, sex = M, knee = left, BMI = 27.47;
-
Subject 2: group = C, age = 26, sex = M, knee = left, BMI = 22.28.
The medical imaging processing utilized is based on a workflow specifically developed for knee cartilages and bones [20].
From the various anatomical components, only femoral cartilage, femur and tibia data were extracted. The choice was made in order to put the focus on the cartilage itself while avoiding unnecessary computational costs and material waste as it will be further explained in the following chapters.

2.2. Meshes Generation for FEM Analysis and 3D Printing

Geometries of the femur, tibia and cartilage were imported on the CAD software 3-Matic 17.0 (Materialise, Belgium) to generate the needed superficial and volumetric mesh for FEM and 3D-printing steps. Since the focus of the analysis is on cartilage, the bones were meshed coarsely to reduce the computational requirements, while a finer mesh was used for the femoral cartilage. Specifically, a 2D triangular mesh with a size of 4 mm was used for most of the bone surface, while a 2 mm triangular mesh was used for the cartilage. To achieve a better load distribution at the transition from bone to cartilage, called the chondral zone, the bone mesh was refined towards the contact zones with the cartilage, ultimately reaching 2 mm. Moreover, a 1 mm mesh was employed to finely mesh the cartilage regions containing geometric singularities (holes caused by chondral defects).
The volume mesh was generated using quadratic tetrahedral elements (TET10) for femoral cartilage, while for the femur and tibia, as the bone components were of the least focus, were used linear tetrahedral elements (TET4) [21]. In the Control model, the average 3D element mesh size measured 0.81 mm, whereas in the Degenerative model, it was 0.79 mm.
Anatomical supports for mechanical testing were also designed to realize a physical model of the knee joint to compress cartilages with standard universal testing machines. A 80 × 80 mm square was created with the intent of providing a surface area sizable enough to guarantee adequate compression force distribution. A 25 × 25 × 10 mm rectangle was created to enable accurate closure between the testing machine’s grips and suitable positioning of the square support on the end of the grips. The superficial and volume meshes generated for the anatomical supports were the same as mentioned above.

2.3. Design of Cartilage Tissue Micro-Structure

To replicate the micro-structure of femoral cartilage and the orientation of type II collagen fibers in different layers, three fiber-reinforced materials were designed. Collagen-like fibers were realized and integrated into ASTM D695 and D638 standardized samples (Figure 1) on the open-source 3D computer graphics software Blender 4.0. The minimum fiber diameter was set to 60 μ m due to the printer resolution [13]. The length was accordingly scaled up to maintain the aspect ratio of the single fiber.
The superficial zone, in the specimens, was represented by fibers oriented tangentially to the load axis. Beneath the superficial zone is the middle zone: fibers representative of this layer were randomly oriented, with a tendency for a 45° angle. To mimic the deep zone, fibers were oriented in parallel with respect to the long axis of the specimens. Our design did not include the calcified zone due to its mixed composition, which positions it between cartilage and bone mechanical response.
The fibers were designed with a standardized length due to a lack of uniformity in the measurement results of the biological samples [22,23]. On the other hand, there are several proofs that the fibril diameter changes along with the cartilage depth [24]. From the superficial to the deep layer, the diameter increases due to the fibers aggregate. As can be seen in Table 1, we designed three different fiber types mimicking diameter changes.
Collagen generally accounts for a maximum of a 15–20% of the total wet weight of cartilage tissue [24,25]. To study the effect of fibers integration on the composite’s mechanical properties, 1% and 5% volume contents were chosen to contain the computational effort required to handle and print complex structures (Figure 1).

2.4. Synthetic Materials and 3D Printing

The blends of materials used to replicate the characteristics of native cartilage tissue were designed using the GrabCAD Digital Anatomy Creator 1.73 (GrabCAD-Stratasys, Cambridge, MA, USA) software. The objective was to create a composition that closely mimicked the mechanical properties of natural cartilage.
For this purpose, a combination of three materials was utilized: B o n e M a t r i x , A g i l u s 30 , and G e l M a t r i x . B o n e M a t r i x is an elasto-plastic material with Young’s modulus ranging from 2000 to 3000 MPa and was chosen to incorporate the desired stiffness into the synthetic cartilage. A g i l u s 30 , on the other hand, is a flexible rubber-like material with a shore hardness of 30A, which was essential for replicating the flexibility of natural cartilage. Lastly, G e l M a t r i x is a polymeric, uncompressible gel specifically designed to mimic the compressibility of real cartilage.
Two different composites were created using these materials. The first composite called S o f t   C a r t i l a g e , consisted of 70% flexible material, 15% gel polymer, and 15% stiff polymer. The second composite, named M e d i u m   C a r t i l a g e , had a composition of 85% flexible material and 15% stiff polymer. These variations were introduced to study the mechanical properties of the synthetic cartilage under different degrees of flexibility and stiffness.
To fabricate these synthetic materials, the J850 Digital Anatomy Printer (Stratasys, Eden Prairie, MN, USA), a cutting-edge 3D printer specifically designed for anatomical models, was employed. Additionally, the Objet260 Connex 3 (Stratasys, Eden Prairie, MN, USA) was used to print anatomically shaped supports for the subsequent mechanical tests. These supports were printed using the rigid V e r o W h i t e material, ensuring stable and accurate testing conditions (Figure 2).
In cases where fiber reinforcement was required, a blend of 50% A g i l u s 30 and T i s s u e M a t r i x material was used. The fibers themselves were printed using the rigid V e r o W h i t e material, enabling the incorporation of reinforced structural elements in the synthetic cartilage samples.

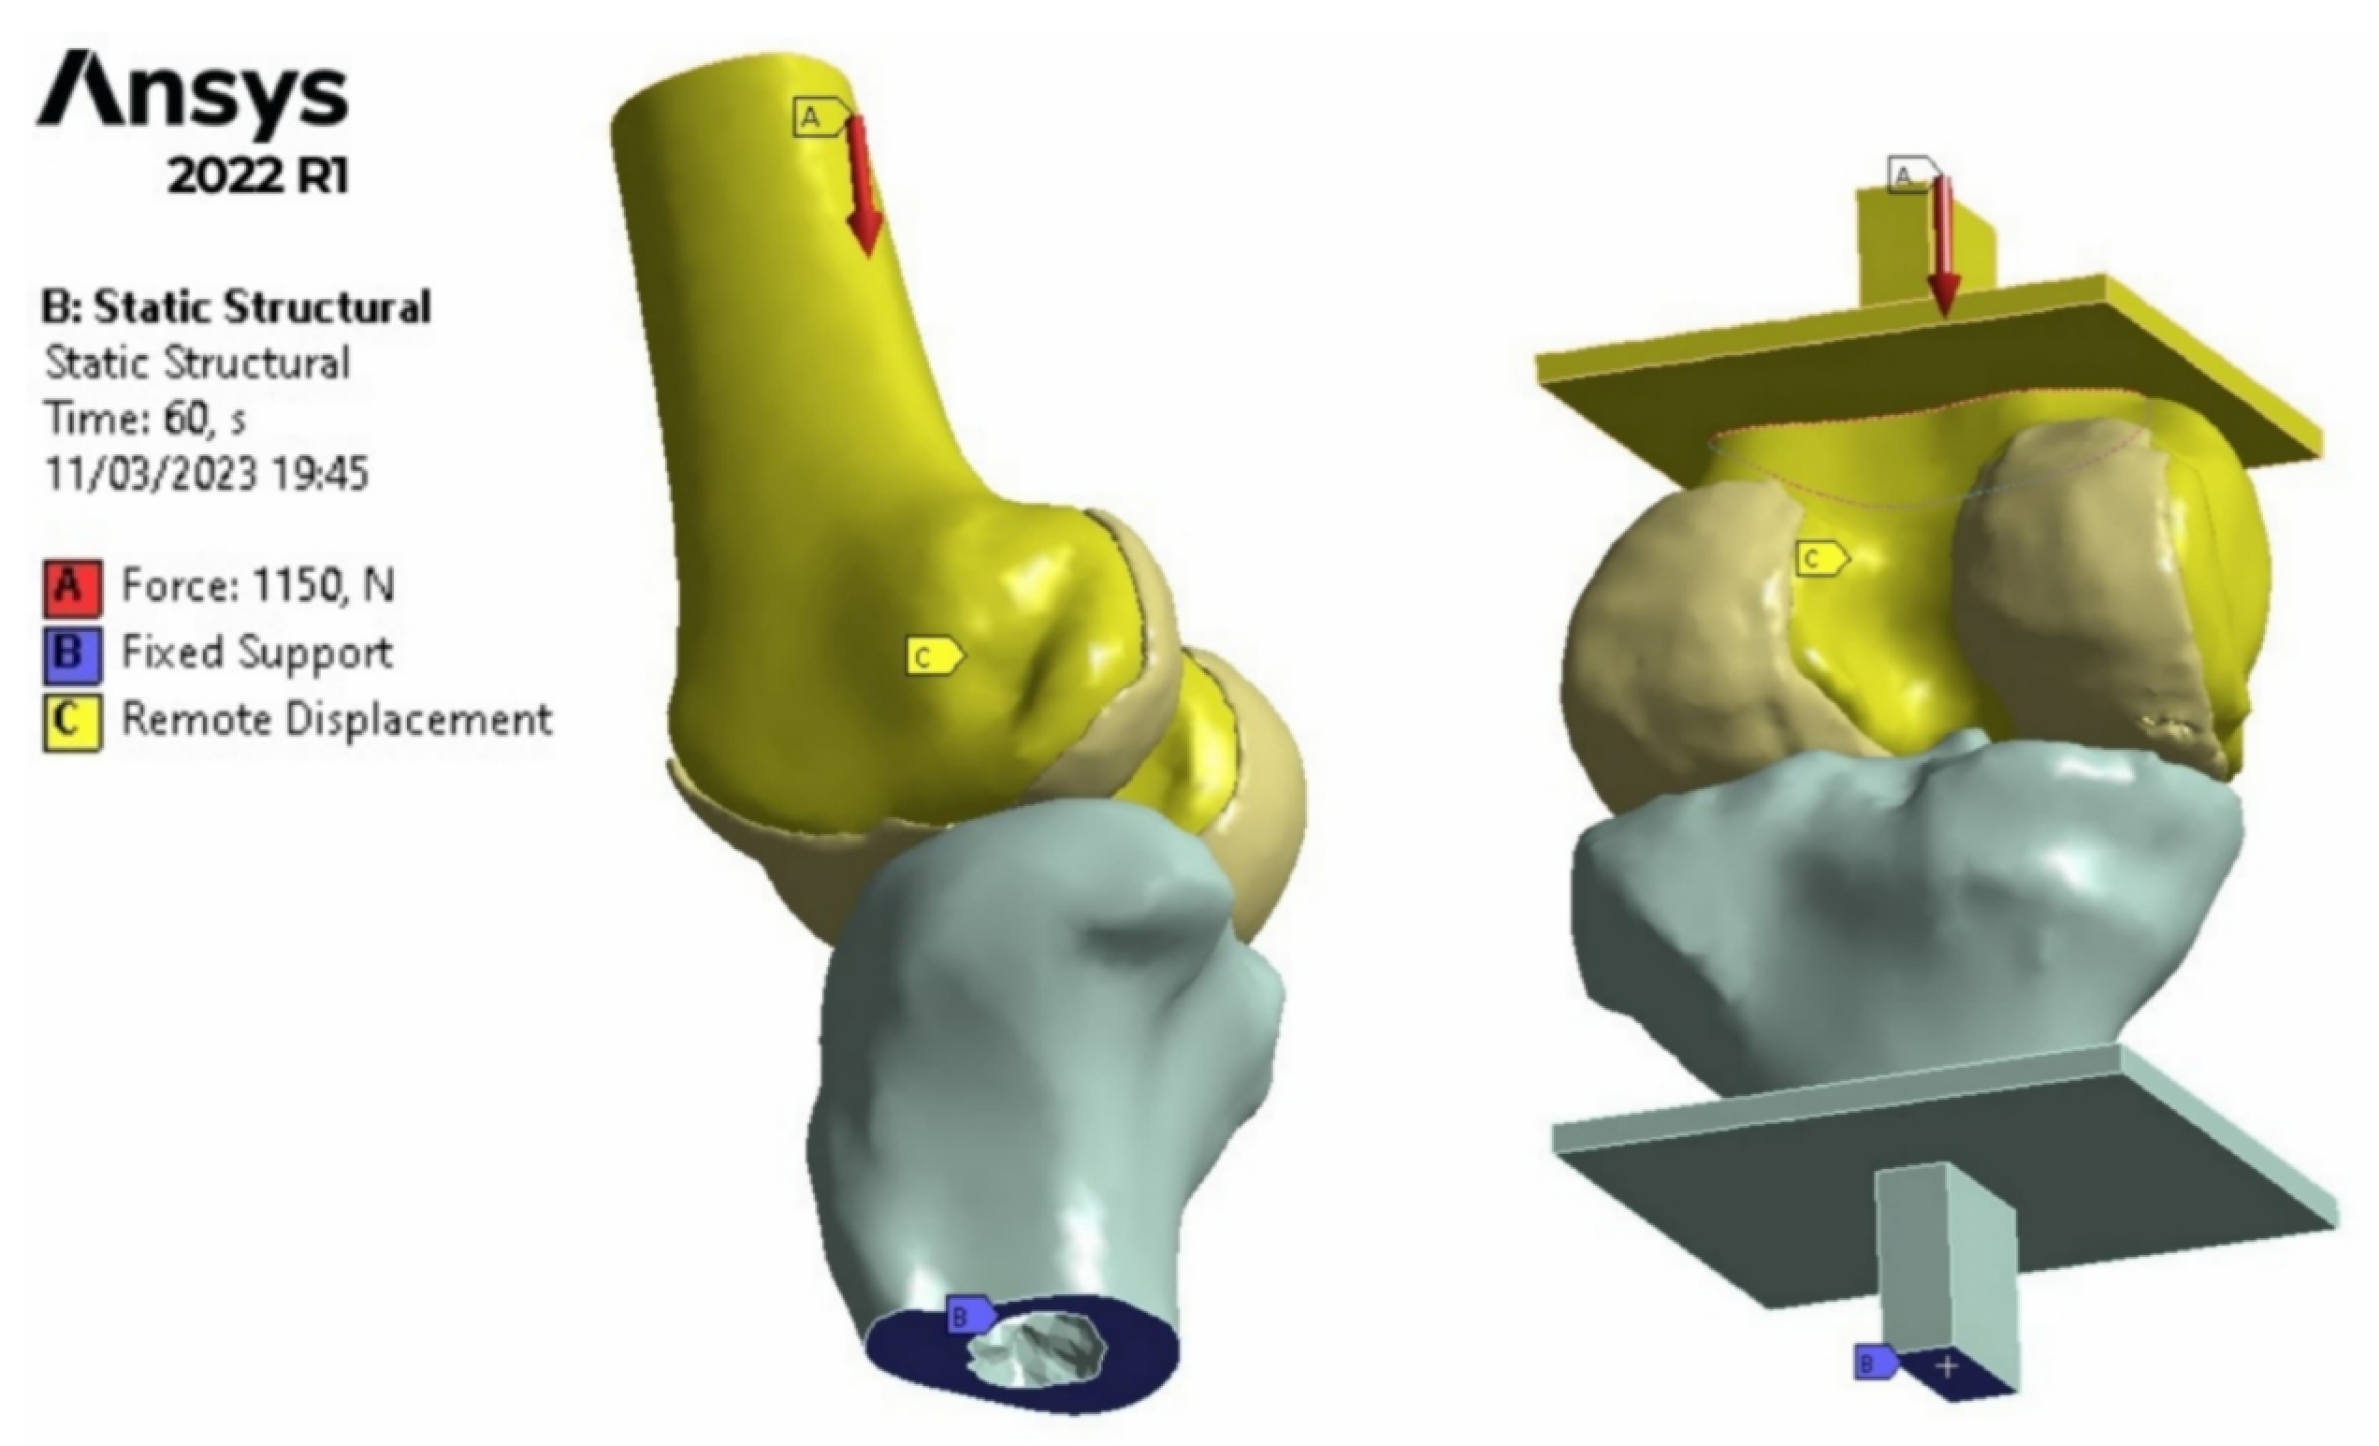
2.5. Finite Element Method Analysis

On ANSYS 2022 (Canonsburg, PA, USA), models of the bones (with and without supports), and femoral cartilage from each subject were imported to understand the influence of OA defects onto the cartilage mechanical properties through computational analysis. Here, the different parts were assembled into a single model, and the material properties, loads and boundary conditions were assigned. Five different materials were chosen during the simulation: C a r t i l a g e   L i t e r a t u r e , B o n e   L i t e r a t u r e , P r i n t e d   C a r t i l a g e   S o f t , P r i n t e d   C a r t i l a g e   M e d i u m and P r i n t e d   B o n e .
From a biomechanical standpoint, articular cartilage can be effectively represented as an elastic isotropic material during dynamic loading [26]. This is because the loading time of interest, corresponding to that of a fully extended leg touching the ground, is much shorter than the viscoelastic time constant of cartilage, which is 1500 s [27]. This approximation proves accurate for short-term cartilage response as demonstrated by Donzelli et al. [28], who proved that there are no significant changes in the cartilage contact response shortly after loading. Cartilage behaves as an incompressible material in its short-term (instantaneous) response ( ν ≈ 0.5), while it reflects characteristics of a compressible material in its long-term response ( ν ≈ 0) [29]. Therefore, in order to capture the intermediate behavior observed during physiological walking, which falls between the instantaneous and long-term responses to functional loads, a Young’s modulus of 5 MPa and a Poisson’s ratio of 0.45 were chosen to represent the cartilage behavior [30,31,32].
We assessed the impact of bone properties on cartilage with a FEM analysis. We assigned the materials P r i n t e d   B o n e and B o n e   L i t e r a t u r e to the bones and then evaluated the results. Despite the substantial difference in stiffness values between the two materials, the observed variations in stress and strain within the femoral cartilage were close to 1%. Therefore, since the influence of bones properties on cartilage was minimal, we decided to model the bones as an isotropic linear elastic material with a Young’s modulus of 17,000 MPa and a Poisson’s ratio of 0.31 [33] in order to avoid unnecessary computational costs as confirmed in the literature [31,34]. Elastic properties of the designed materials are reported in Table 2.
The connections between femur–cartilage and cartilage–tibia were defined as bonded [35] due to a partially mineralized zone between that secure cortical bone and the articular cartilage by anchoring the collagen fibrils of the deep zone to the subchondral bone [1]. Due to the simplification applied to the model, by excluding menisci and tibial cartilages, a pinball region was set to compensate for the gap between the tibia and femoral cartilage. The asymmetric behavior and the augmented Lagrange formulation were used for handling contacts. In the analyses, flexo-extension and varus-valgus rotations were constrained for the femur in order to analyze the knee joint in full extension. The tibia was constrained on the lower surface with a fixed support. A compressive force of 1150 N was applied perpendicularly to the upper surface of the femur, which matches the force acting during a gait cycle for a full extension position [36] (Figure 3, Left). The values of Equivalent Elastic Strain [mm/mm] and Equivalent (von Mises) Stress [MPa] for the femoral cartilage were exported, and the stress–strain graphs were created to analyze the joint behavior with different material properties.
The first FEM analyses on both subjects were carried out by assigning the S o f t and M e d i u m materials to the femoral cartilages and the P r i n t e d   B o n e ( V e r o W h i t e ) material to the bones, using their native geometry. Subsequently, to compare and validate the obtained results, a further analysis was conducted by assigning to the models the literature values of cartilage and bone tissues. After that, the same analysis was performed on the models designed for 3D printing to evaluate the effect of the supports and the compression mechanism. Bone material’s properties were changed to P r i n t e d   B o n e , and thus the cartilage’s ones ( S o f t and M e d i u m ). In the real setting, the grip is clamped on the sides but, after a simulation, it turned out to be equivalent to applying the 1150 N load on the upper surface of the grip in the computational environment (Figure 3, Right).

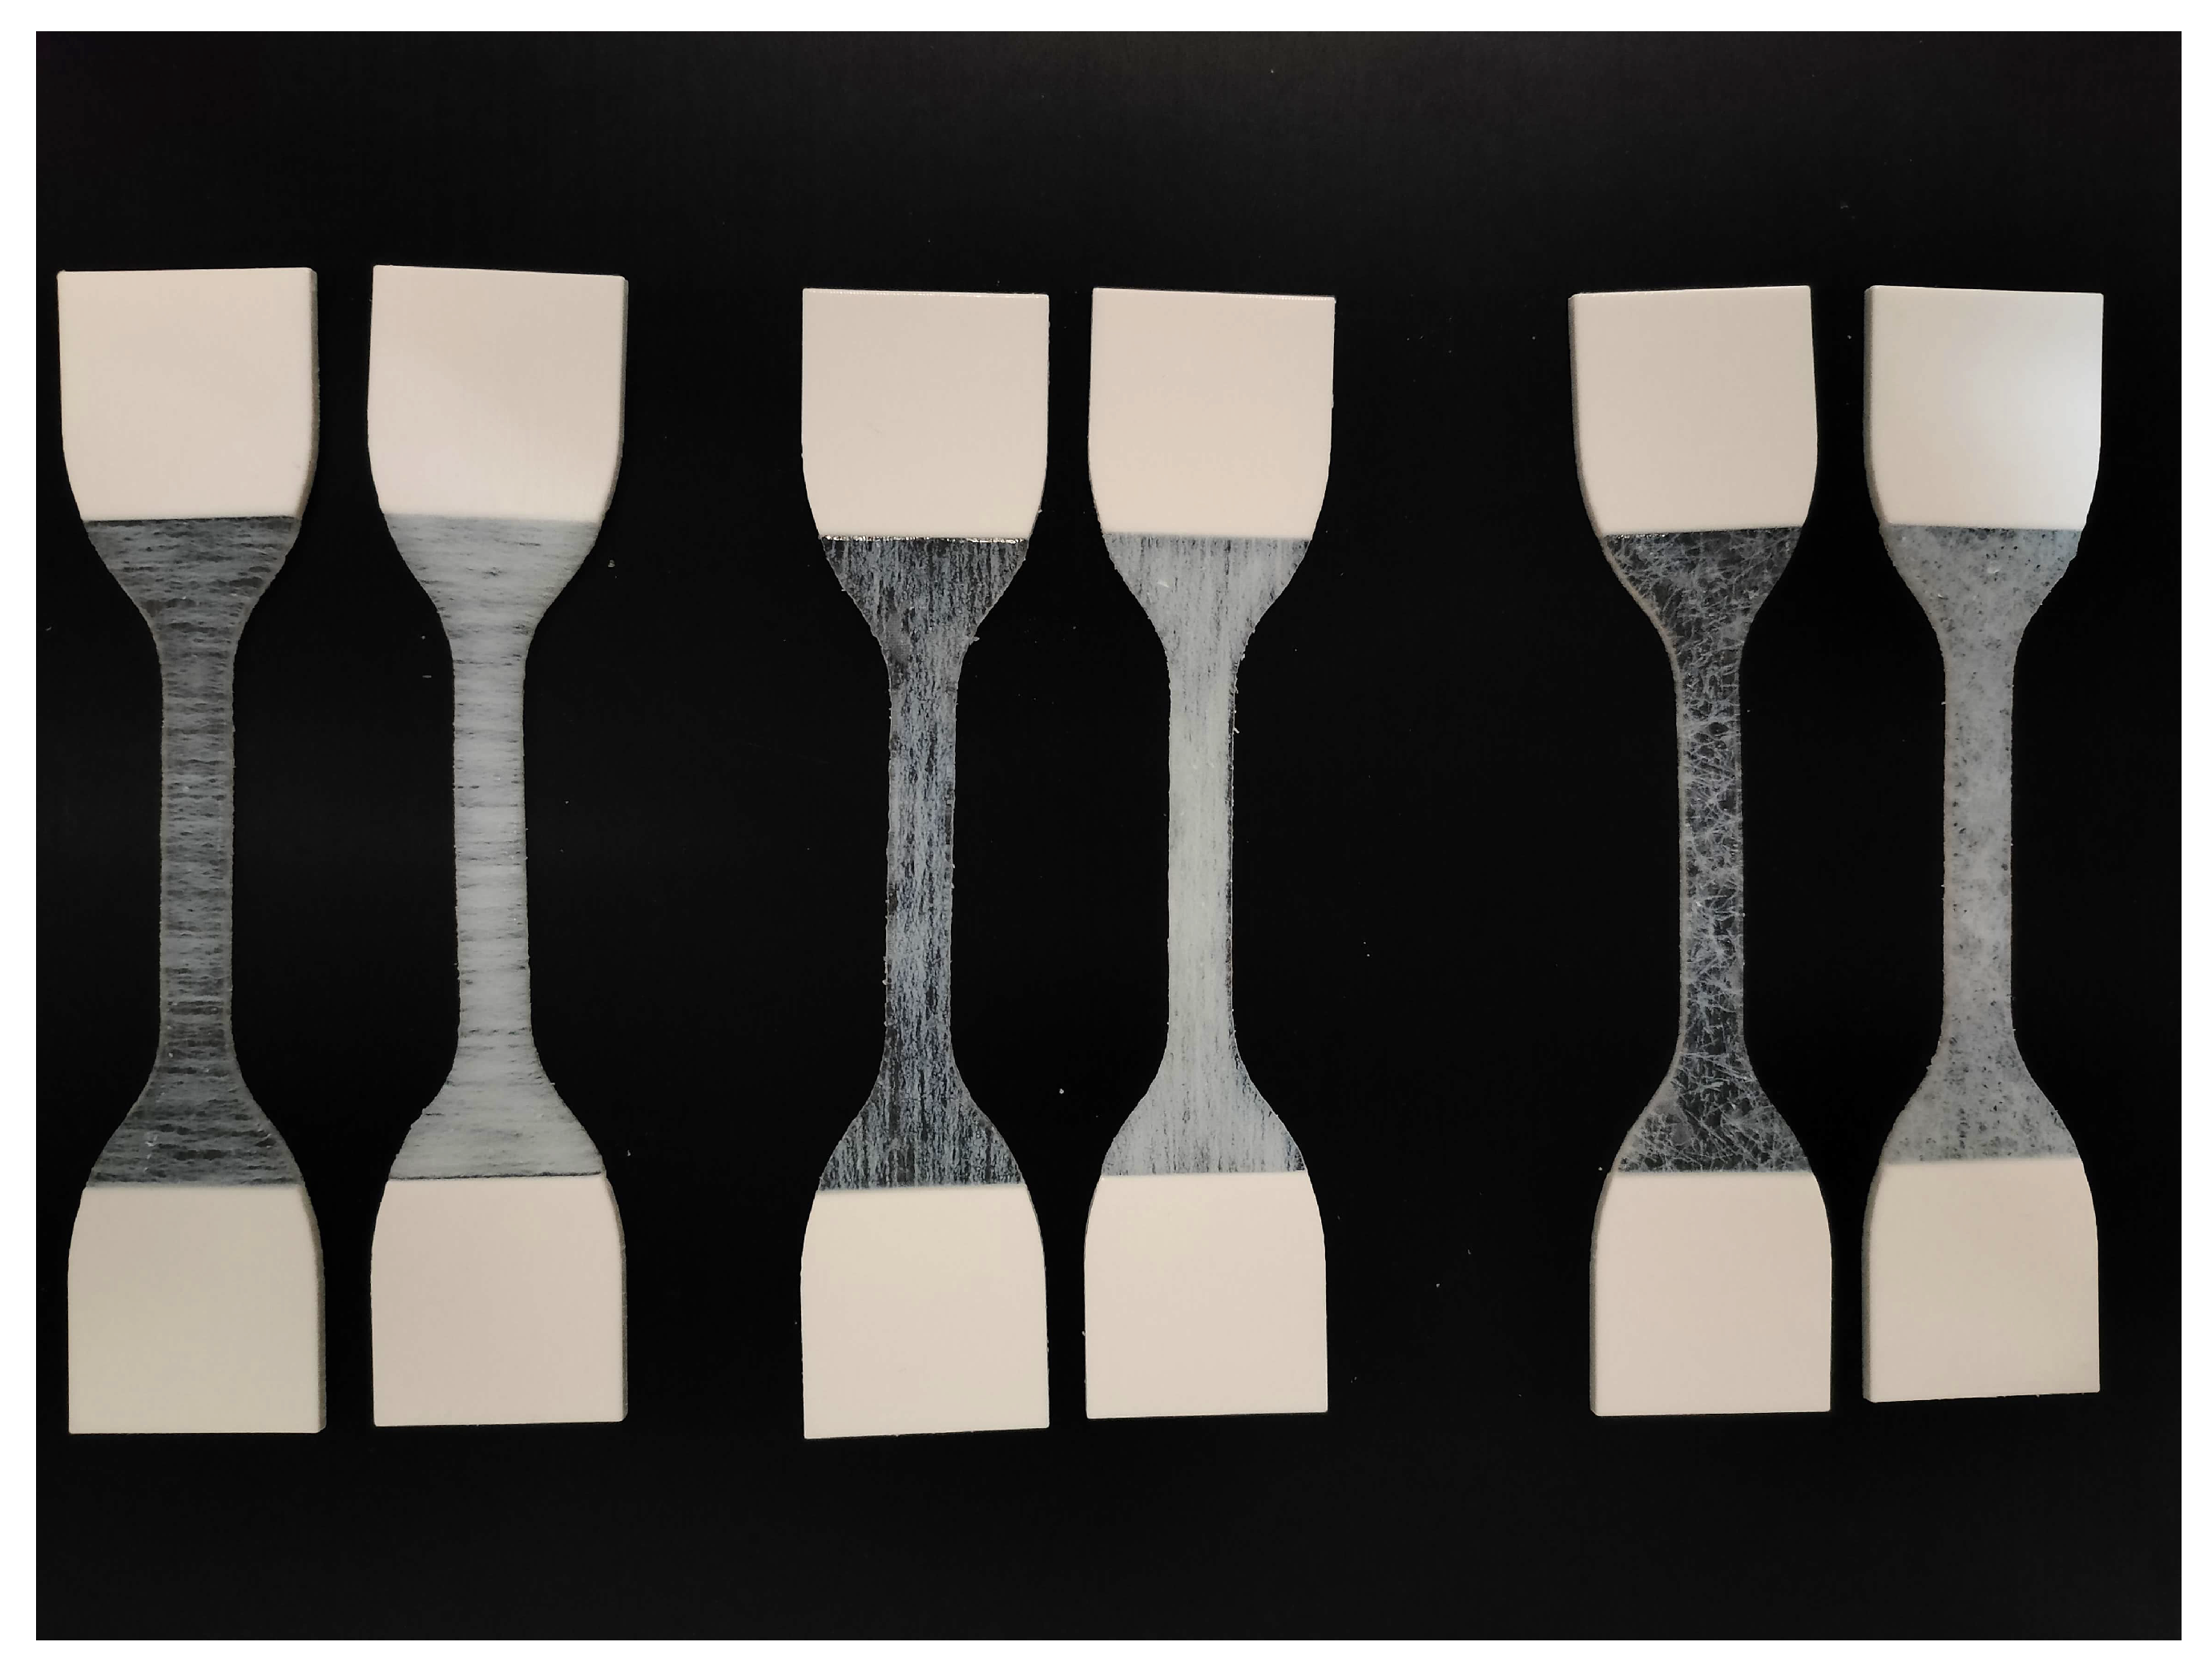
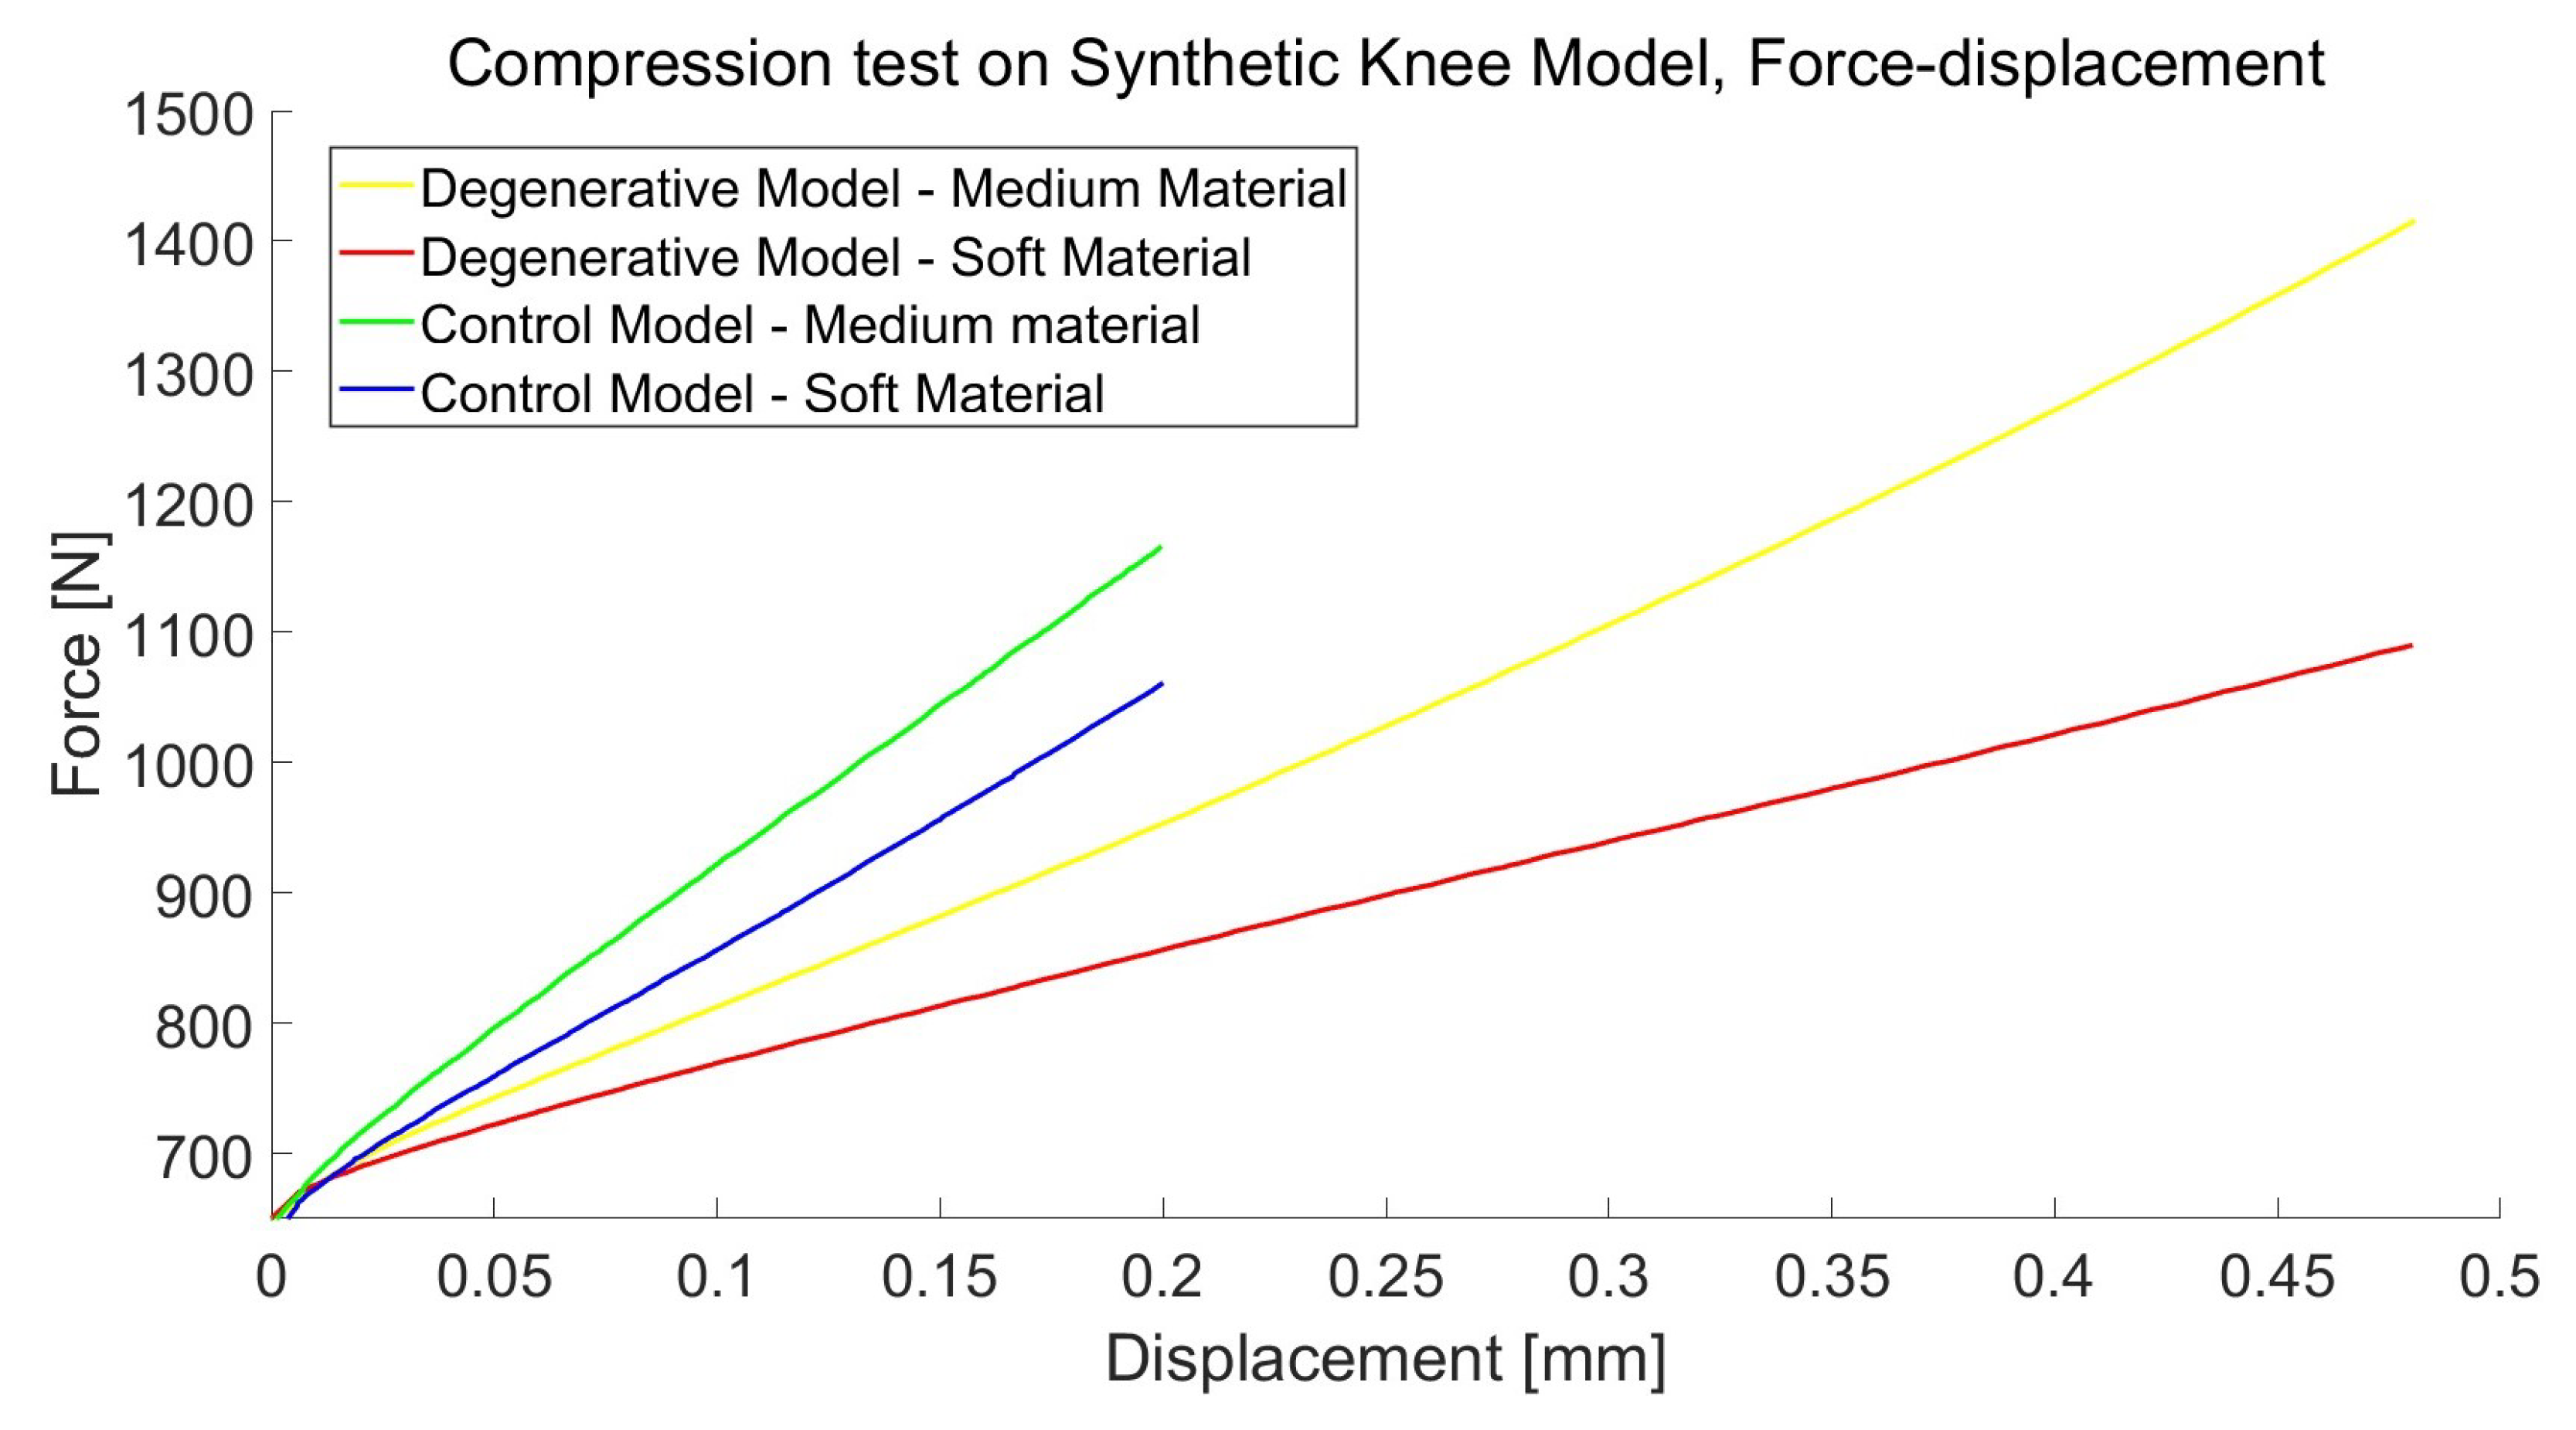
2.6. Mechanical Tests

The mechanical characterization of the printed specimens and anatomical models was carried out with the MTS Insight™ (Electromechanical-10 kN Standard Length) testing system at Tæknisetur (Reykjavik, Iceland).
The mechanical properties of the two custom materials were evaluated using a total of 20 standardized samples. Specifically, ten cylindrical samples were printed to meet the dimensional requirements outlined by the ASTM D695 compression protocol, five using the S o f t material and five using the M e d i u m material. Additionally, ten dog-bone specimens were printed for the ASTM D638 tensile test, with an equal split of five for each material type. The Young’s modulus of each polymeric blend was computed, as an average, from the stress–strain charts in the linear region. This was done by following the corresponding ASTM guidelines for the calculation of elastic parameters.
For patient-specific testing (Figure 2), a total of 20 synthetic cartilages were realized, 10 for healthy subjects and 10 for degenerative conditions. Each patient had five cartilages printed with the S o f t material and five with the M e d i u m material. Before the test, every cartilage was measured with a digital caliber in six different points: two for the width and four for the thickness. Both the femur and tibia were fixed, and the jaws were positioned to keep the cartilage perfectly in place, as in a physiological condition. To secure the positioning, a pre-load of 650 N was applied to the cartilage. This choice also has physiological justification since the loads acting on the knee joint (for a leg in full extension position) during the standing phase of the gait cycle range from 700 N to 1150 N on average [31]. The compressive load was increased at a uniform rate of 1.3 mm/min along the longitudinal direction until a 20% strain of the total average thickness was reached. After that, the cartilage underwent the same measurements described above. This procedure was carried out for both subjects.
A total of 36 fiber-reinforced samples were realized and tested under uni-axial compression and tension to extract the Young’s modulus. The results were then compared to assess the contribution of fibers dimension and orientation. Half of these were printed with 1% fiber content, while the remaining had 5% fiber content. Within each fiber volume, 18 samples were created—3 S u p e r f i c i a l , 3 M i d d l e , and 3 D e e p —both for the tensile and compression tests. The zones of the dog-bone samples that are clamped during the measurements were printed with a reinforced material ( V e r o W h i t e ) to ensure a solid grip as can be seen in Figure 1. Several tests were conducted to exclude the possibility for the samples to break at the transition zone.

3. Results

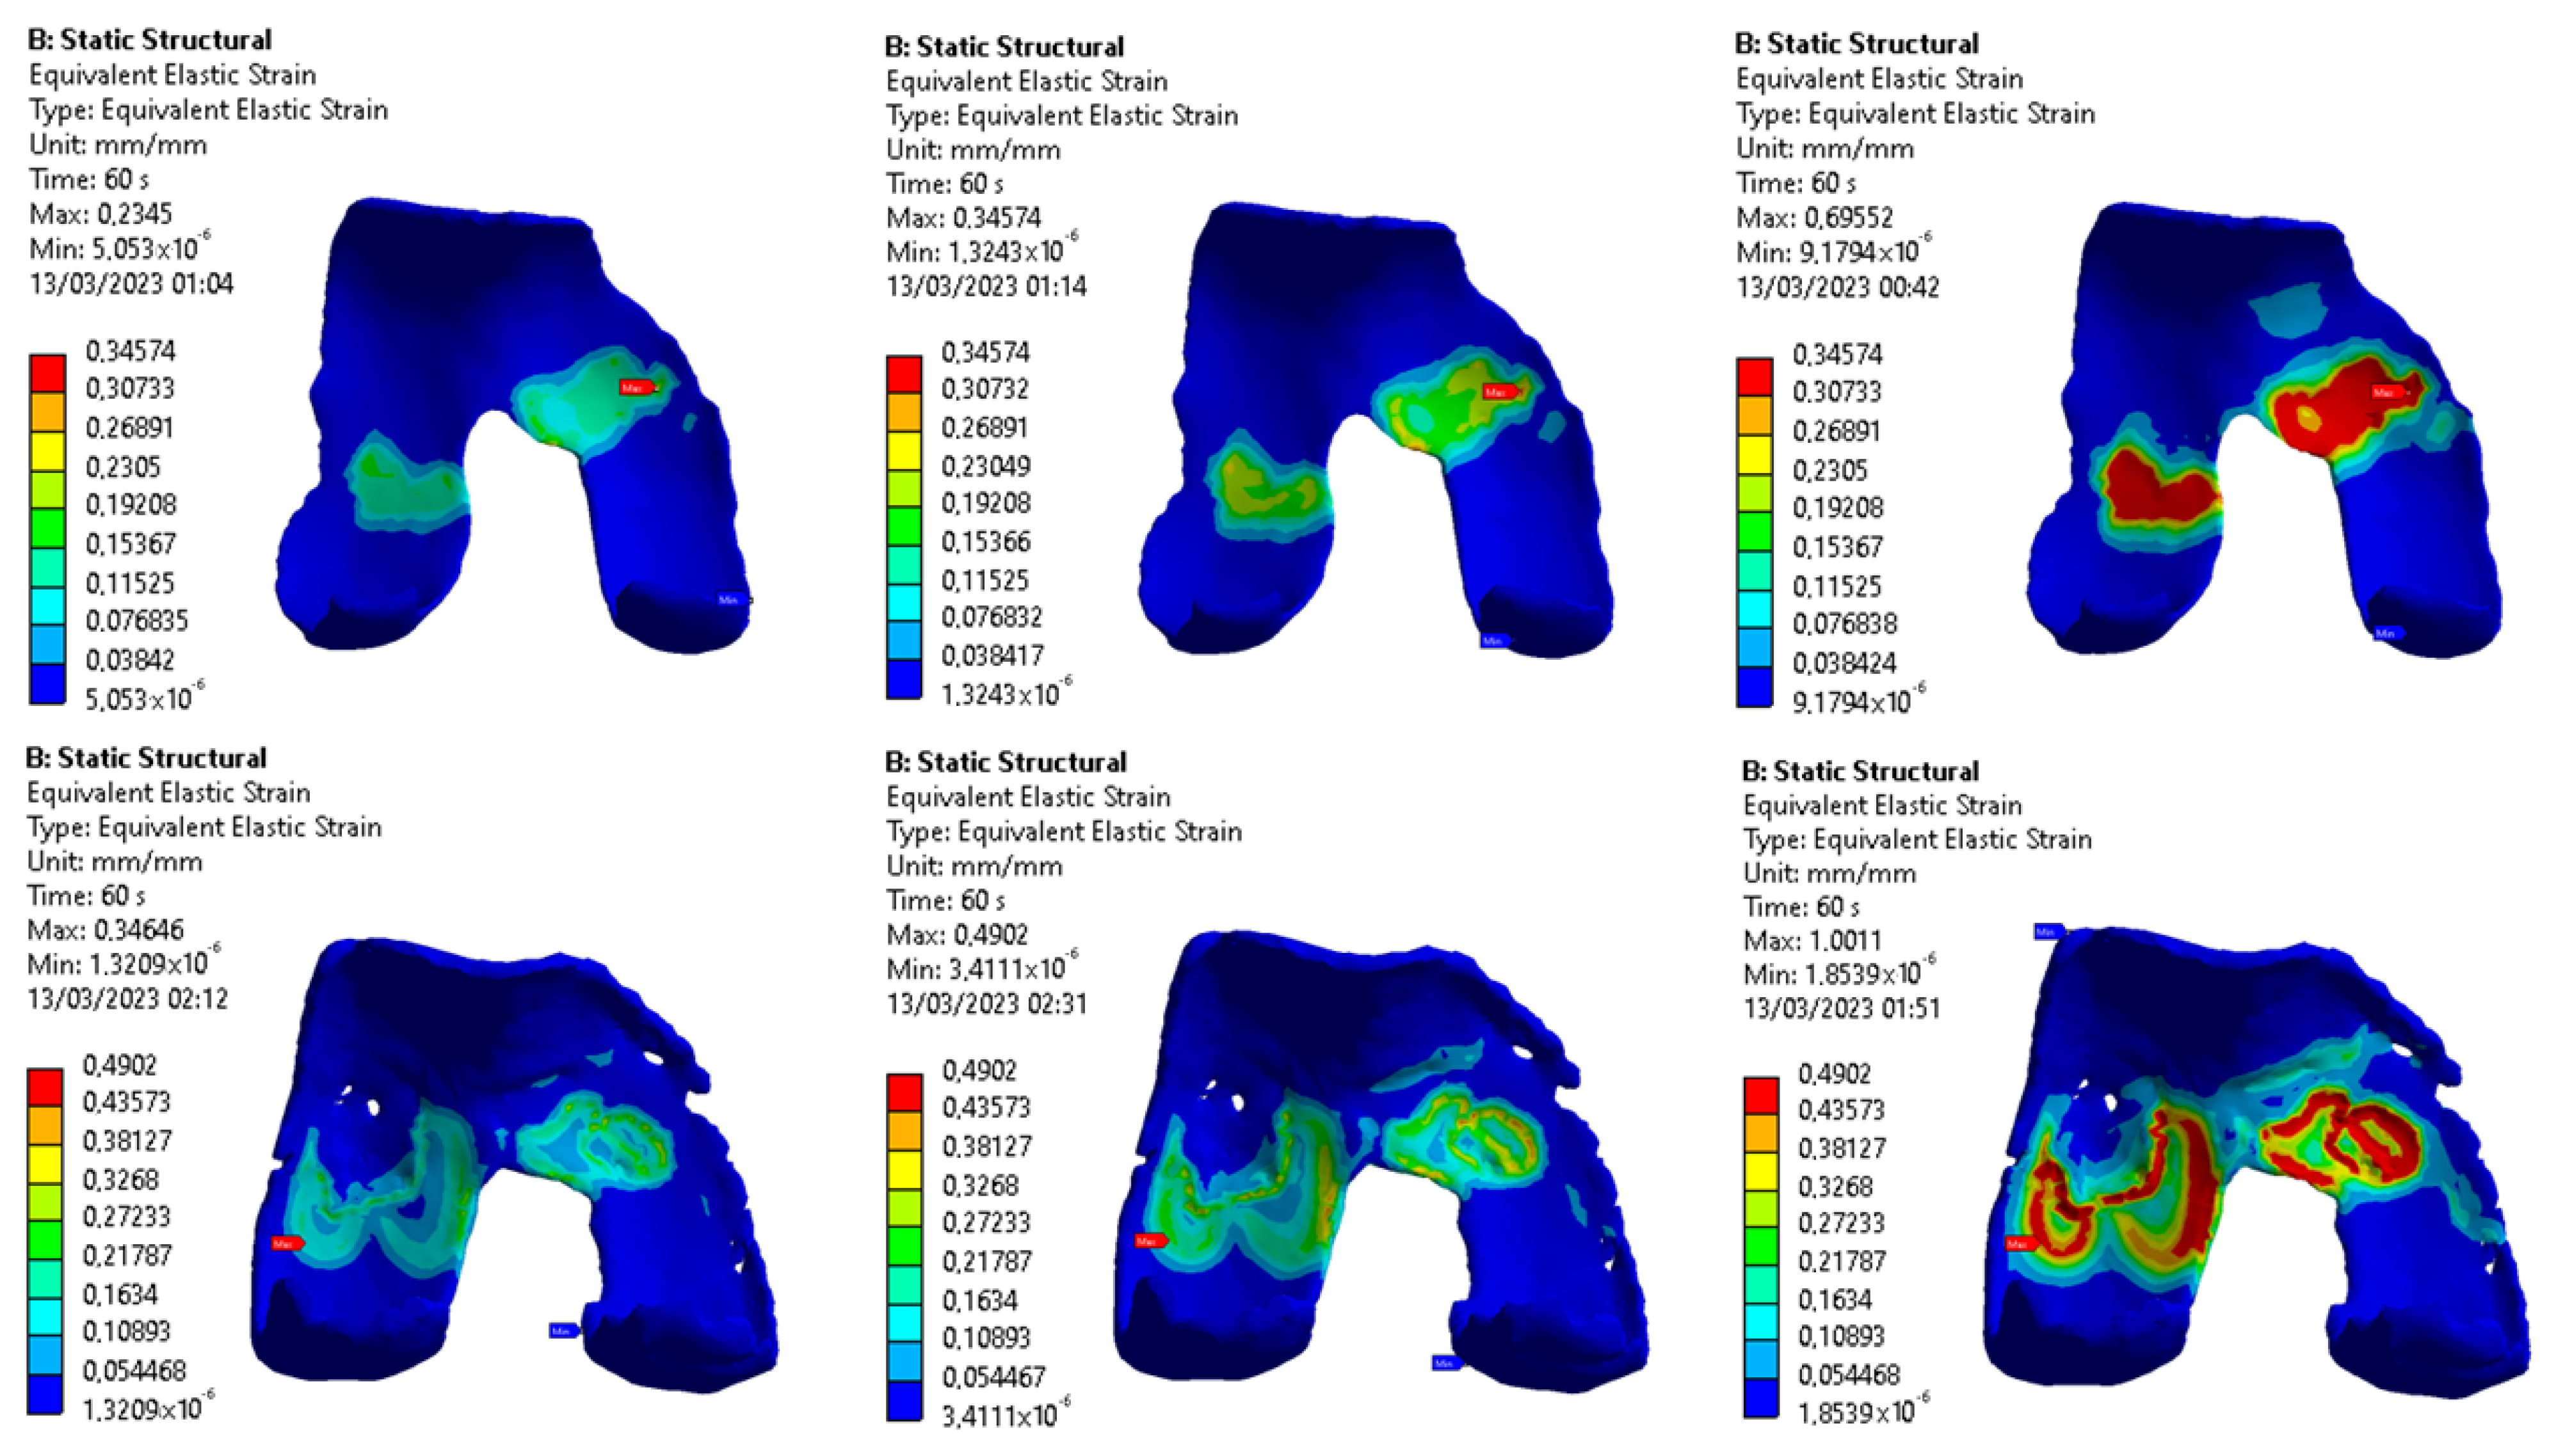
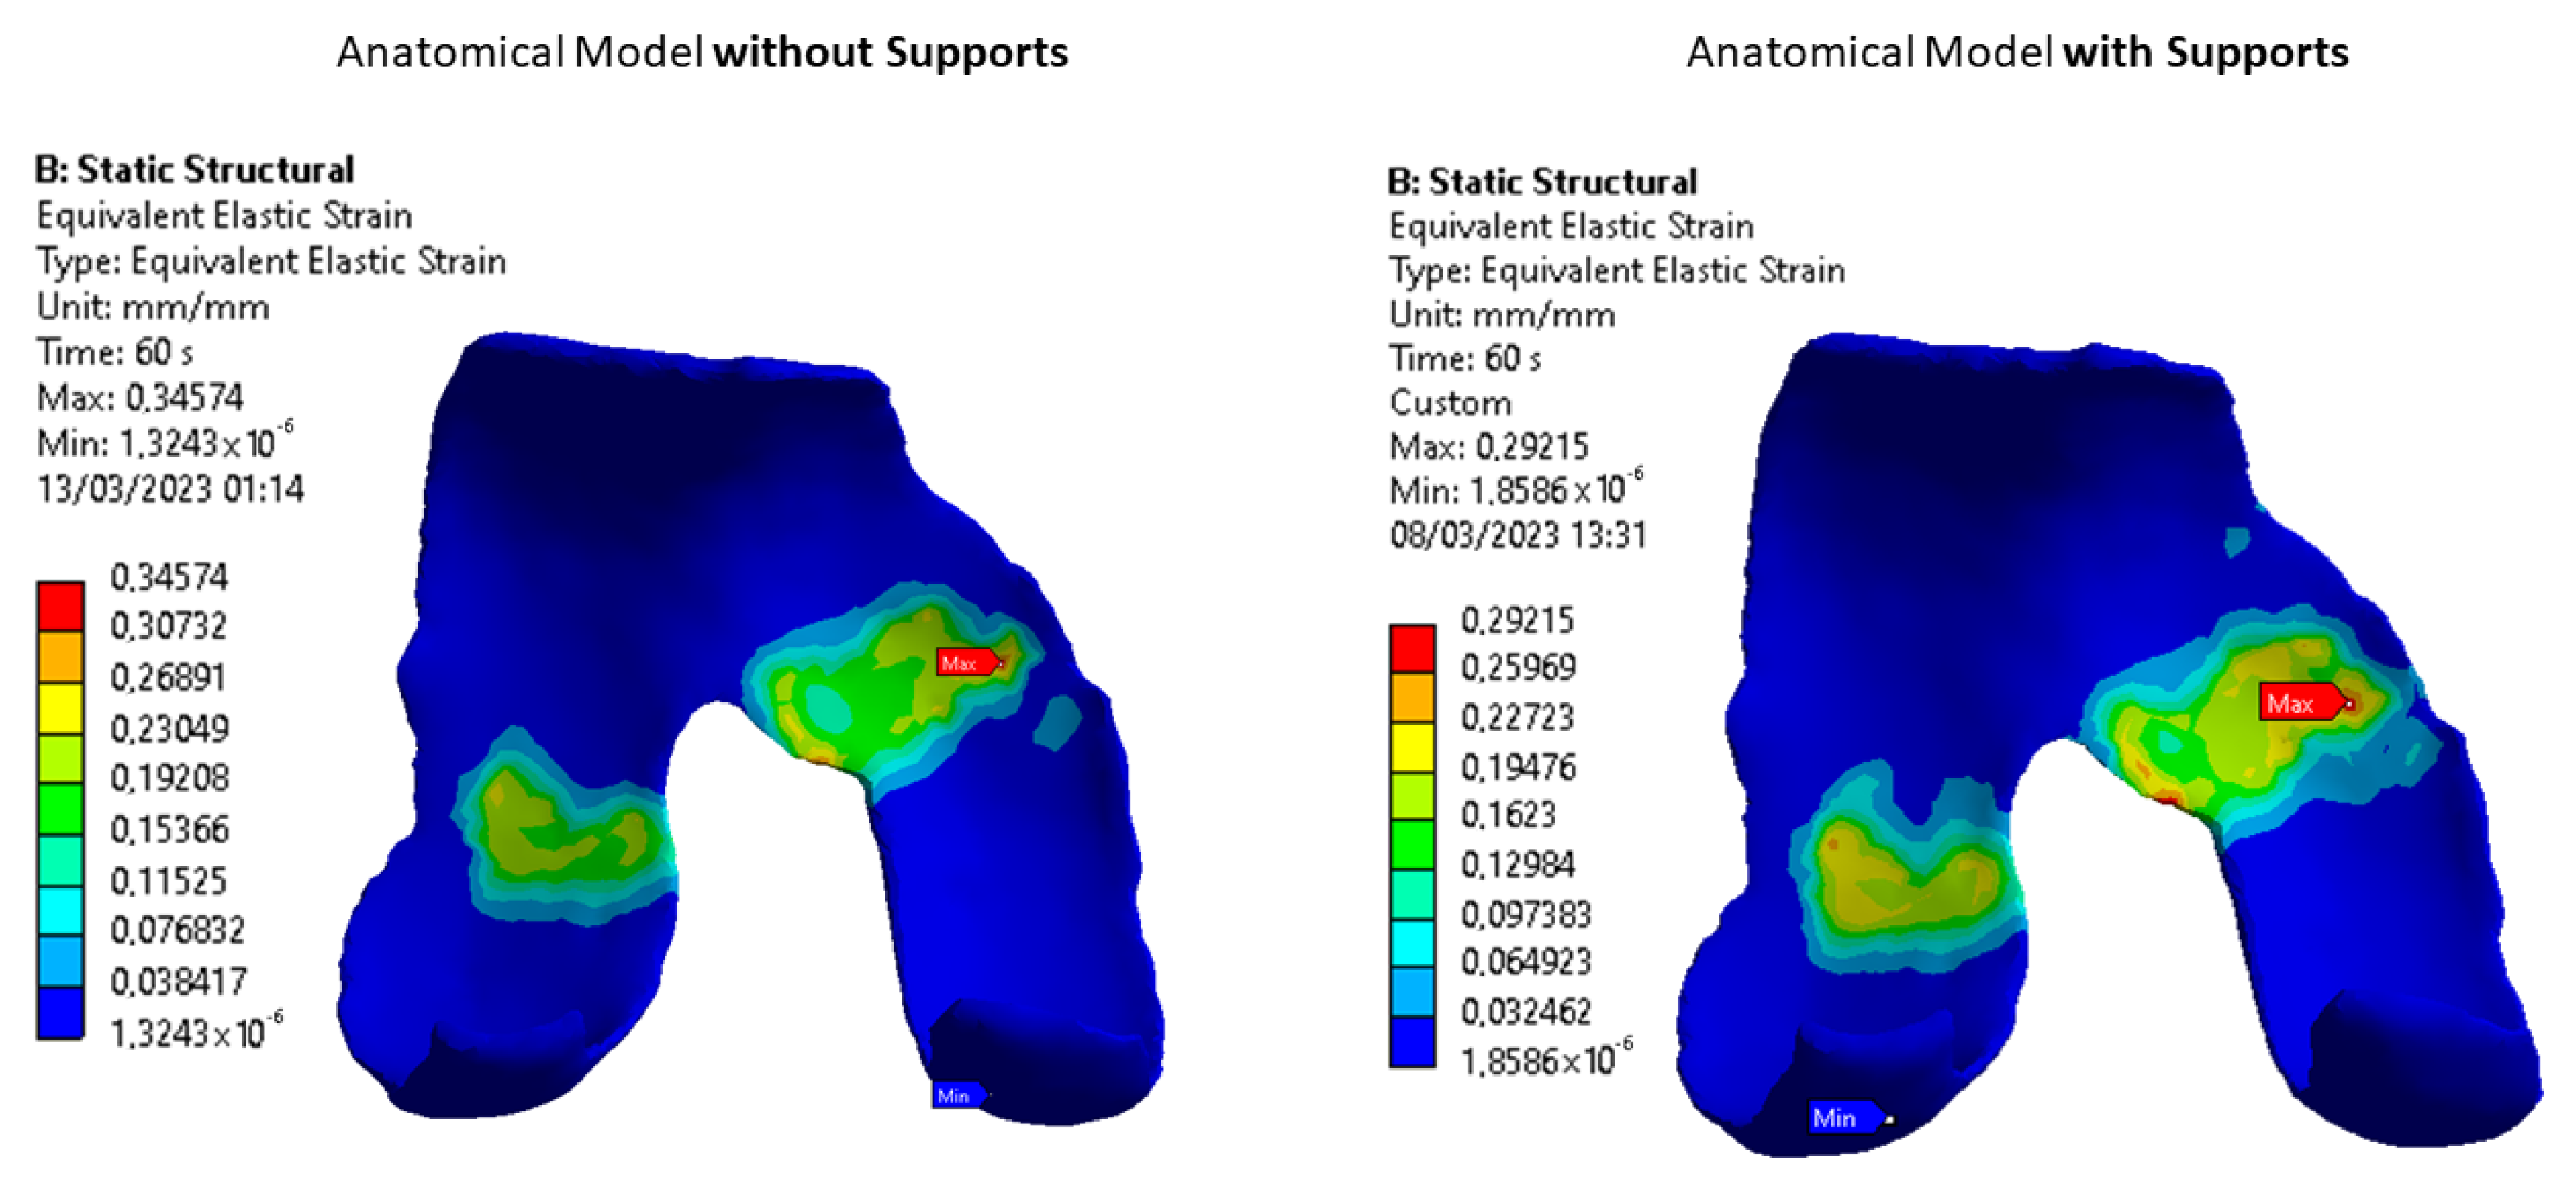
3.1. Images Post-Processing and FEA Results

From the image analysis, several characteristics were extracted, including the cartilage volume. Specifically, for the femoral cartilage, subject 1 (D) presents volume = 23,682.14 mm 3 , and subject 2 (C) presents volume = 16,401.17 mm 3 .
The FEA was used to validate what was measured with the synthetic knee because it allows for a controlled environment, where the geometries are aligned and changes due to OA can show the effect of the degeneration. The results shown in Figure 4 represent the strain distribution on the healthy (upper row) and osteoarthritic (lower row) morphologies taken into account for the computational simulation. M e d i u m material (left column) exhibits the lowest deformation, whereas the S o f t one undergoes the highest. Figure 5 reports the linear stress–strain chart for both synthetic and literature materials according to the constitutive model.
As can be seen in Figure 6, the strain map computed within the femoral cartilage after the simulation using the models with supports closely resembles that of anatomical models without supports, both under identical loading conditions. This indicates that the designed models with supports serve as effective physical simulators for studying the strain of synthetic cartilages.

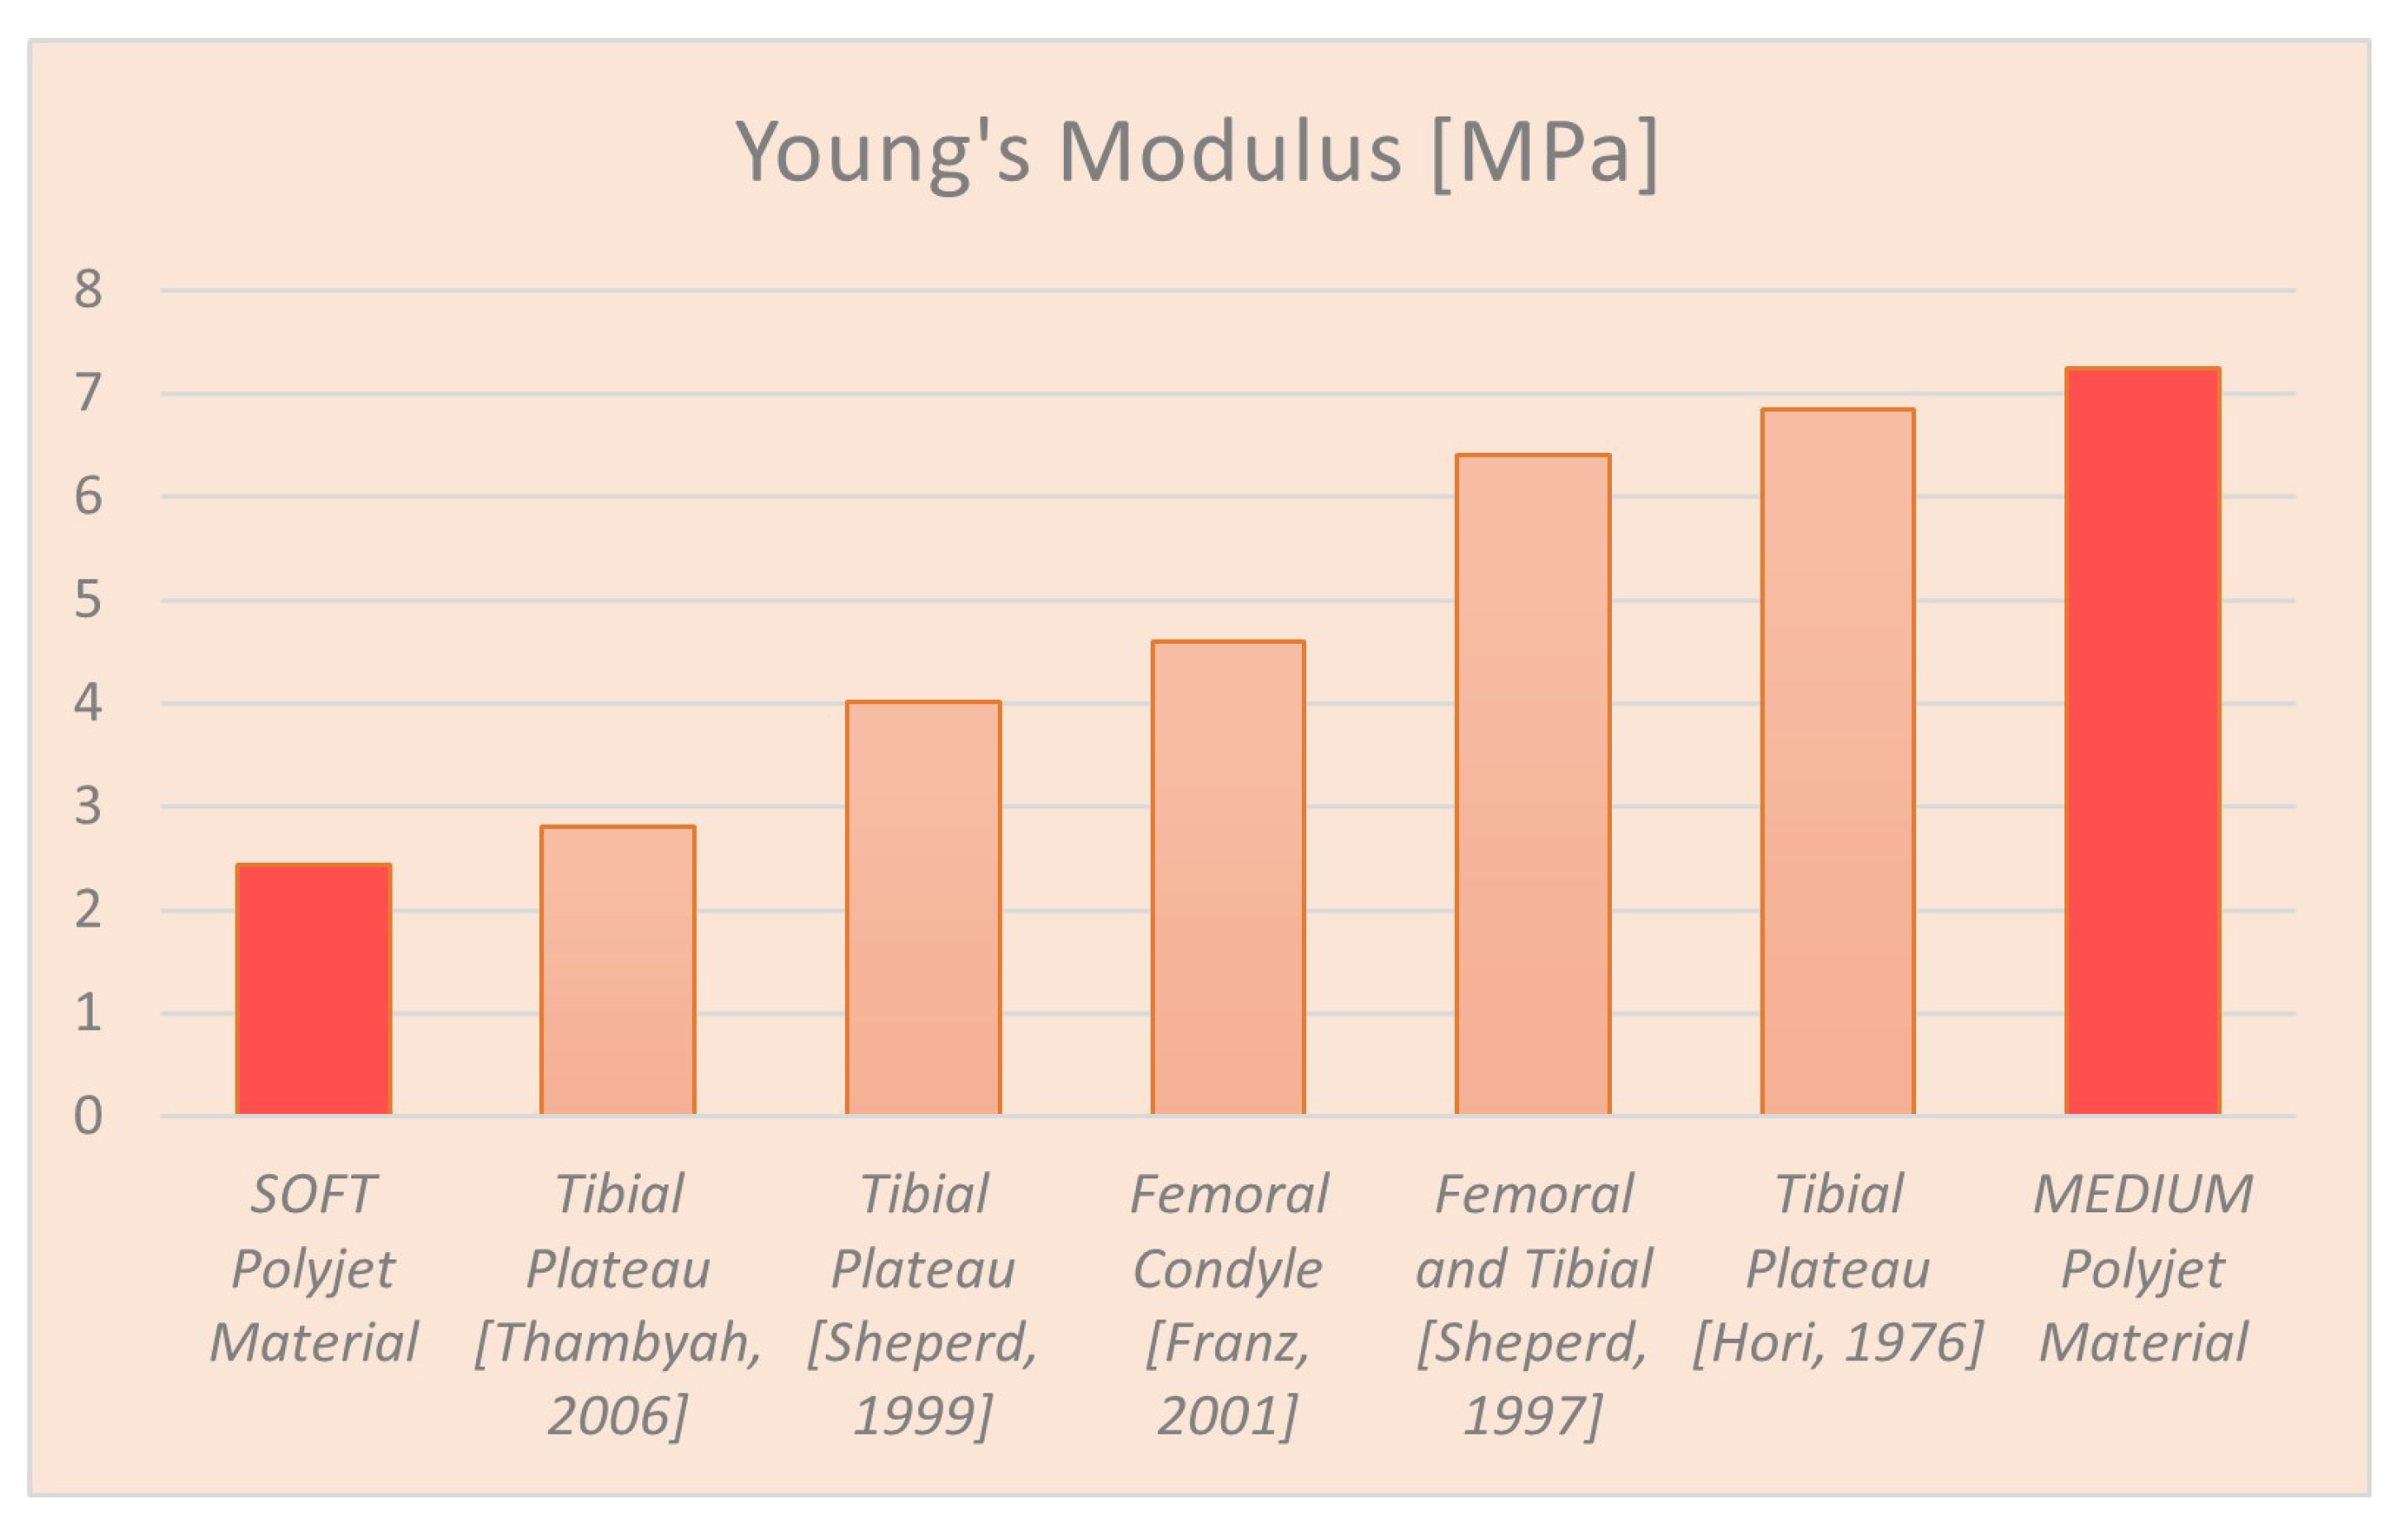
3.2. Mechanical Properties of Synthetic Polymers

The Young’s modulus of S o f t and M e d i u m cartilage extracted from the mechanical test are, respectively, 2.43 MPa (R-square = 0.999 and RMSE = 0.01188) and 7.24 MPa (R-square = 0.9998 and RMSE = 0.1047).
Figure 7 reports the graphs related to the physical simulator setup that was the prototype during the study. The chart was reported as force–displacement since it was not feasible to measure the surface and the thickness of the contacting point. As can be seen, the Degenerative curves lie below the Control ones, despite the different materials. All tests were run until the 20% strain was reached and since the degenerative cartilage had a bigger volume, the final displacement was higher.
Figure 8 reports the stress–strain curves of the customized specimens with fibers. Under uni-axial compression, the behavior of the 1 % groups is similar, with a decreasing failure strain from the outside ( S u p e r f i c i a l ) to the inside ( D e e p ) of the cartilage. The increase in fibers volume content corresponded to an increase in the mechanical performance results: the stress is two times higher compared to the 1 % group within the same strain range. Conversely, D e e p 5% reported a nearly-linear behavior for small deformations, yielding a transaction around 0.1 MPa and a failure around 0.2 strain, making it the less flexible material.
The tensile behavior is linear for all six groups and also for the matrix itself (AGTM no fibers curve). This comparison was not possible under compression due to bending since the beginning of the test. Firstly, the presence of fibers increased the stress handled by the material but decreased the maximum elongation of the specimens. S u p e r f i c i a l and M i d d l e samples, both percentages, showed a similar trend, with S u p e r f i c i a l having slightly higher stress. The presence of fibers aligned to the load direction led to an optimization of the structure and an increased response to a tensile load. The D e e p family had the higher Young’s modulus for both compositions. The elastic properties are reported in Table 3 for the compression tests and in Table 4 for the tensile tests.

4. Discussion

4.1. Radiological Data and FEA Simulation

Starting from patient-specific data, the segmentation workflow of medical images led to a reliable three-dimensional virtual model of the knee joint, with a focus on the main bones and cartilage tissue that compose it. This will support various clinical applications and allows for a better understanding of the knee biomechanics through a realistic 3D-printed model. Subject 1 (D), characterized by a greater volume, indicates potential fluid infiltration into the pathologic cartilage, leading to swelling and, thus, more intense strain [37]. In addition, the cartilage surface of Subject 2 appears to exhibit greater homogeneity compared to that of Subject 1 (D), accounting for the uneven distribution of holes and deformities in the latter.
Upon analyzing the Finite Element Analysis (FEA) results in Figure 5, it is evident that the stress–strain curves display a linear trend with remarkably similar slopes. The mechanical performance of biological cartilage tissue is intricately influenced by various factors, such as age, osteoarthritis (OA), and physical activity, making it challenging to establish a standardized mechanical profile [38]. Despite the distinct biochemical composition, the synthetic cartilage demonstrates promising overall elastic properties, thanks to the manual tunability achieved by adjusting the proportions of elastic or gel-like materials. This adaptability allows for the calibration of synthetic cartilage to match the desired reference values. The results position the printed materials as the endpoints on a spectrum, with S o f t representing the lower limit and M e d i u m representing the upper limit of the mechanical properties akin to knee joint cartilage (Figure 9). As stresses and deformations escalate, the impact of geometric variations becomes more pronounced, underscoring the role of osteoarthritis in modifying the mechanical response of cartilage [37]. These insightful comparisons underscore the potential of 3D printing and synthetic materials in effectively mimicking the elastic properties of natural cartilage tissue.
The FEM analyses carried out on the models with supports were used to verify that the created supports were actually able to simulate the correct distribution of loads in the knee. Despite surface modifications caused by the supports, the results of the stresses and strain distributions on the cartilages remained almost unchanged (Figure 6). Moreover, the materials’ behavior in the stress–strain graphs remained consistent, affirming the minimal influence from the introduced supports on force transmission. These results validated the implementation of the mechanical setup with 3D-printed patient-specific phantoms shown in Figure 2.
Conventional testing techniques usually do not take into account tissue morphology and geometrical structure, in favor of concentrating only on the mechanical properties [44]. One significant simplification relates to the native cartilage’s biomechanical behavior, which is bi-phasic poro-viscoelastic [45,46], but in this instance, it is assumed to be linear isotropic elastic. Nonetheless, several studies have found that this is suitable for instantaneous tissue deformation [26,28]. Moreover, other anatomical components of the knee joint, such as the tibial cartilages, menisci, and ligaments were not taken into account for the scope of this study. Even though these structures are essential to the health and function of the joint, their absence made it possible to gain a greater awareness of the behavior of pathological femoral cartilage and how it affects the health of the knee joint. This understanding permitted us to identify potential failure mechanisms associated with damage to the femoral cartilage.

4.2. Synthetic Knee Joint Testing

The curve behavior represented in Figure 7 is comparable to what is expected from the extrapolated parameters. The M e d i u m material is stiffer, and thus a higher applied load is needed to reach 20 % of the total deformation, compared to its soft counterpart; this applies for both control and degenerative morphologies, despite having different thicknesses and thus requiring more load in general to reach the deformation wanted. Overall, due to the curves’ relative position, we can confirm that the presence of OA changes the response of cartilage to mechanical stimulation. In particular, the response is decreased for both materials, highlighting the role of geometry in the mechanics of the knee joint.
The results from FEA and synthetic testing align and show how morphology plays a crucial role in joint biomechanics, especially in the chain of degradation. The pathology causes the formation of brittle points; these degenerations leads to non-physiological load distributions that amplify the effect of the disease. The brittle points found in the FEA and in the synthetic tests are comparable and coincide with the failure areas in the synthetic setup. This means that a degenerative morphology is more suited to be implemented in this kind of parallel approach. And, in general, this leads to the conclusion that having a wider interacting surface on the virtual model is an important point in order to have comparable results to the mechanical test. For instance, OA cartilage tissue can be considered a perfect study case for this approach since it has been reported [20] to have an increased volume (and, thickness) due to swelling of the tissue, compared to the healthy physiological condition.
Furthermore, the stress on the tissue is unevenly distributed as can be observed in our analyses. The deformation is also increased in damaged areas since OA conditions bring wear and degradation. The strain distribution from the FEA (Figure 10) reveals the brittle regions of patient-specific cartilage during an extended-leg stride. As a first insight of this potential, we can qualitatively assess that the area experiencing higher deformations is much thinner and more convoluted in the degenerative knee, a consequence of the uneven load distribution between bones and cartilage.

4.3. Fibers Contribute Evaluation

As shown in Figure 8, the mechanical behavior of fiber-reinforced samples is related to the spatial position of the samples. This corresponds with the literature findings demonstrating the highly anisotropic nature of cartilage, with Young’s modulus exhibiting variations depending on the orientation of the fibers and direction of the applied load, thus highlighting a gradient [47,48].
The compressive resistance of cartilage tissue is guaranteed in the first place by the fiber’s orientation in the S u p e r f i c i a l sample. This is partially achieved in our samples: except for the 5% D e e p samples, we can denote that this is true, with the S u p e r f i c i a l samples showing the highest Young modulus. This is because fibers oriented tangentially to the applied force can prevent the cylindrical sample from barreling and bending, thus enhancing the resistance of the sample [47], even if the fibers’ contribution seems to vary slightly among the different orientations when it comes to compressive properties.
From the tensile tests, the D e e p samples show the highest Young modulus in both percentage configurations. In particular, the 5% D e e p sample shows a greatly increased modulus compared to the others from the same group. This is an expected result, given the ability of fibers to enhance the tensile mechanical performance if oriented along the direction where the load is applied [48].
Again, by looking at the results of the compression and tensile tests, it is interesting to notice that the M i d d l e samples show lower performance results for both fiber concentrations. It seems that a randomly oriented pattern of fibers yields a lower modulus compared to the parallel and tangential orientation. In the cartilage tissue, the middle layer acts as a transitional layer between the superficial and deep layers, ensuring an intermediate behavior between the two and helping to avoid abrupt compositional changes. Laasanen et al. [49] demonstrated that compressibility is lower in the middle zone, where the collagen II fibril network is less rigorously arranged. This aligns with our findings.
Overall, the elastic properties of our fiber-reinforced polymers have the same relationship observed in native cartilage layers, albeit with a lower absolute value.

5. Conclusions

In summary, while acknowledging the limitations of our 3D-printed cartilage, such as the challenges in replicating the exact biochemical composition and water content of natural cartilage, our primary focus was on assessing the potential of Digital Anatomy Printer (DAP) technology to emulate the mechanical behavior of knee cartilage. We explored the capability of DAP technology to modify overall mechanical responses through adjustments in polymer compounds and the manipulation of stiffness and elasticity. Our efforts also aimed at precisely tuning compressive and extension responses by varying fiber incorporation within the polymer compound, allowing the replication of specific load-bearing characteristics observed in natural knee cartilage.
To examine the knee mechanical behavior under osteoarthritis conditions, this study integrated 3D printing, advanced image-processing techniques, and computational simulations. The importance of considering the global morphology of cartilage tissue in designing knee osteoarthritis treatment plans was underscored in the first two parts of the study. Future studies and medical advancements may benefit from employing a synthetic knee joint model and computational simulation to comprehensively investigate the cartilage morphology and mechanical behavior in parallel, providing a more holistic understanding of osteoarthritis pathology.
In the final phase, the study assessed the feasibility of mimicking cartilage tissue’s internal structure and components, utilizing fiber-reinforced material printed with PolyJet technology. The subsequent plan involves designing a multi-layer model that incorporates the native cartilage’s zone micro-structure division, optimizing parameters through a more accurate mathematical model. This approach aims to enhance the understanding of Short Fiber-Reinforced Polymer Composites’ mechanical performance, optimizing the fibers’ volume fraction, and evaluating the impact of the fiber dimensions, thereby saving cost and time.
In conclusion, this work demonstrated the potential to replicate the patient-specific morphology and mechanical properties of biological tissues with 3D-printable polymers. The envisioned future application involves the use of 3D-printed osteoarthritis cartilage as a scaffold for bioinjection, offering promising prospects for advancements in medical treatment.

Author Contributions

Conceptualization, R.F. and P.G.; methodology, D.C., G.D. and R.F.; tests, R.F., G.B., D.C. and G.D.; formal analysis, D.C. and G.D.; investigation, D.C. and G.D.; writing—original draft preparation, D.C. and G.D.; writing—review and editing, G.B., F.K.C., R.F. and P.G.; supervision and funding acquisition, P.G. All authors have read and agreed to the published version of the manuscript.

Funding

This research was funded by EU Horizon Projects RESTORE grant ID: 814558.

Institutional Review Board Statement

Not applicable.

Informed Consent Statement

Not applicable.

Data Availability Statement

The data presented in this study are available on request from the corresponding author. The data are not publicly available due to privacy.

Conflicts of Interest

The authors declare no conflicts of interest.

References

  1. Sophia Fox, A.J.; Bedi, A.; Rodeo, S.A. The basic science of articular cartilage: Structure, composition, and function. Sport Health 2009, 1, 461–468. [Google Scholar] [CrossRef]
  2. Mansour, J.M. Biomechanics of cartilage. Kinesiol. Mech. Pathomech. Hum. Mov. 2003, 2, 66–79. [Google Scholar]
  3. Zhang, Y.; Jordan, J.M. Epidemiology of osteoarthritis. Clin. Geriatr. Med. 2010, 26, 355–369. [Google Scholar] [CrossRef]
  4. Long, H.; Liu, Q.; Yin, H.; Wang, K.; Diao, N.; Zhang, Y.; Lin, J.; Guo, A. Prevalence trends of site-specific osteoarthritis from 1990 to 2019: Findings from the Global Burden of Disease Study 2019. Arthritis Rheumatol. 2022, 74, 1172–1183. [Google Scholar] [CrossRef] [PubMed]
  5. Buckwalter, J.A.; Martin, J.A.; Brown, T.D. Perspectives on chondrocyte mechanobiology and osteoarthritis. Biorheology 2006, 43, 603–609. [Google Scholar] [PubMed]
  6. Roemer, F.W.; Demehri, S.; Omoumi, P.; Link, T.M.; Kijowski, R.; Saarakkala, S.; Crema, M.D.; Guermazi, A. State of the art: Imaging of osteoarthritis—Revisited 2020. Radiology 2020, 296, 5–21. [Google Scholar] [CrossRef] [PubMed]
  7. Farr, J.; Cole, B.; Dhawan, A.; Kercher, J.; Sherman, S. Clinical cartilage restoration: Evolution and overview. Clin. Orthop. Relat. Res. 2011, 469, 2696–2705. [Google Scholar] [CrossRef] [PubMed]
  8. Chu, C.R.; Szczodry, M.; Bruno, S. Animal models for cartilage regeneration and repair. Tissue Eng. Part B Rev. 2010, 16, 105–115. [Google Scholar] [CrossRef]
  9. MacDonald, E.; Wicker, R. Multiprocess 3D printing for increasing component functionality. Science 2016, 353, aaf2093. [Google Scholar] [CrossRef]
  10. Gargiulo, P.; Giménez, C.C.; Pirozzi, M.A.; Thórdarson, Á.; Ricciardi, C.; Forni, R.; Bjornsson, G.A. 20 years of 3D printing in surgical planning of distraction osteogenesis. In Handbook of Surgical Planning and 3D Printing; Elsevier: Amsterdam, The Netherlands, 2023; pp. 95–123. [Google Scholar]
  11. Forni, R.; Agnarsdóttir, S.; Torfason, B.; Gargiulo, P. Heart surgery: Septal defect. In Handbook of Surgical Planning and 3D Printing; Elsevier: Amsterdam, The Netherlands, 2023; pp. 143–169. [Google Scholar]
  12. Ventola, C.L. Medical applications for 3D printing: Current and projected uses. Pharm. Ther. 2014, 39, 704. [Google Scholar]
  13. J850 Digital Anatomy Printer Website. Available online: https://www.stratasys.com/en/3d-printers/printer-catalog/polyjet/j850-digital-anatomy/ (accessed on 30 November 2023).
  14. Severseike, L.; Lee, V.; Brandon, T.; Bakken, C.; Bhatia, V. Polyjet 3D printing of tissue-mimicking materials: How well can 3D printed synthetic myocardium replicate mechanical properties of organic myocardium? BioRxiv 2019. [Google Scholar] [CrossRef]
  15. Mandrycky, C.; Wang, Z.; Kim, K.; Kim, D.H. 3D bioprinting for engineering complex tissues. Biotechnol. Adv. 2016, 34, 422–434. [Google Scholar] [CrossRef] [PubMed]
  16. Vijayavenkataraman, S.; Yan, W.C.; Lu, W.F.; Wang, C.H.; Fuh, J.Y.H. 3D bioprinting of tissues and organs for regenerative medicine. Adv. Drug Deliv. Rev. 2018, 132, 296–332. [Google Scholar] [CrossRef] [PubMed]
  17. Wu, Y.; Kennedy, P.; Bonazza, N.; Yu, Y.; Dhawan, A.; Ozbolat, I. Three-dimensional bioprinting of articular cartilage: A systematic review. Cartilage 2021, 12, 76–92. [Google Scholar] [CrossRef] [PubMed]
  18. Sun, Y.; Zhang, D.; Liu, Y.; Lueth, T.C. Fem-based mechanics modeling of bio-inspired compliant mechanisms for medical applications. IEEE Trans. Med Robot. Bionics 2020, 2, 364–373. [Google Scholar] [CrossRef]
  19. Aubonnet, R.; Ramos, J.; Recenti, M.; Jacob, D.; Ciliberti, F.; Guerrini, L.; Gislason, M.K.; Sigurjonsson, O.; Tsirilaki, M.; Jónsson, H., Jr.; et al. Toward New Assessment of Knee Cartilage Degeneration. Cartilage 2023, 14, 351–374. [Google Scholar] [CrossRef] [PubMed]
  20. Ciliberti, F.K.; Guerrini, L.; Gunnarsson, A.E.; Recenti, M.; Jacob, D.; Cangiano, V.; Tesfahunegn, Y.A.; Islind, A.S.; Tortorella, F.; Tsirilaki, M.; et al. CT-and MRI-based 3D reconstruction of knee joint to assess cartilage and bone. Diagnostics 2022, 12, 279. [Google Scholar] [CrossRef]
  21. Maas, S.A.; Ellis, B.J.; Rawlins, D.S.; Weiss, J.A. Finite element simulation of articular contact mechanics with quadratic tetrahedral elements. J. Biomech. 2016, 49, 659–667. [Google Scholar] [CrossRef]
  22. Minns, R.; Steven, F. The collagen fibril organization in human articular cartilage. J. Anat. 1977, 123, 437. [Google Scholar]
  23. Muir, H.; Bullough, P.; Maroudas, A. The distribution of collagen in human articular cartilage with some of its physiological implications. J. Bone Jt. Surg. Br. Vol. 1970, 52, 554–563. [Google Scholar] [CrossRef]
  24. Responte, D.J.; Natoli, R.M.; Athanasiou, K.A. Collagens of articular cartilage: Structure, function, and importance in tissue engineering. Crit. Rev. Biomed. Eng. 2007, 35, 363–411. [Google Scholar] [CrossRef] [PubMed]
  25. Xia, Y.; Momot, K. Biophysics and Biochemistry of Cartilage by NMR and MRI; Royal Society of Chemistry: Cambridge, UK, 2016. [Google Scholar]
  26. Trad, Z.; Barkaoui, A.; Chafra, M.; Tavares, J.M.R. FEM Analysis of the Human Knee Joint: A Review; Springer: Berlin/Heidelberg, Germany, 2018. [Google Scholar]
  27. Armstrong, C.; Lai, W.; Mow, V. An analysis of the unconfined compression of articular cartilage. J. Biomech. Eng. 1984, 106, 165–173. [Google Scholar] [CrossRef] [PubMed]
  28. Donzelli, P.S.; Spilker, R.L.; Ateshian, G.A.; Mow, V.C. Contact analysis of biphasic transversely isotropic cartilage layers and correlations with tissue failure. J. Biomech. 1999, 32, 1037–1047. [Google Scholar] [CrossRef] [PubMed]
  29. Mak, A.; Lai, W.M.; Mow, V.C. Biphasic indentation of articular cartilage—I. Theoretical analysis. J. Biomech. 1987, 20, 703–714. [Google Scholar] [CrossRef] [PubMed]
  30. Li, G.; Lopez, O.; Rubash, H. Variability of a three-dimensional finite element model constructed using magnetic resonance images of a knee for joint contact stress analysis. J. Biomech. Eng. 2001, 123, 341–346. [Google Scholar] [CrossRef] [PubMed]
  31. Pena, E.; Calvo, B.; Martinez, M.; Doblare, M. A three-dimensional finite element analysis of the combined behavior of ligaments and menisci in the healthy human knee joint. J. Biomech. 2006, 39, 1686–1701. [Google Scholar] [CrossRef] [PubMed]
  32. Blankevoort, L.; Huiskes, R. Validation of a three-dimensional model of the knee. J. Biomech. 1996, 29, 955–961. [Google Scholar] [CrossRef]
  33. Bachtar, F.; Chen, X.; Hisada, T. Finite element contact analysis of the hip joint. Med. Biol. Eng. Comput. 2006, 44, 643–651. [Google Scholar] [CrossRef]
  34. Haut Donahue, T.L.; Hull, M.; Rashid, M.M.; Jacobs, C.R. A finite element model of the human knee joint for the study of tibio-femoral contact. J. Biomech. Eng. 2002, 124, 273–280. [Google Scholar] [CrossRef]
  35. Yang, Z. Finite Element Analysis for Biomedical Engineering Applications; CRC Press: Boca Raton, FL, USA, 2019. [Google Scholar]
  36. Bendjaballah, M.; Shirazi-Adl, A.; Zukor, D. Finite element analysis of human knee joint in varus-valgus. Clin. Biomech. 1997, 12, 139–148. [Google Scholar] [CrossRef]
  37. Peters, A.E.; Akhtar, R.; Comerford, E.J.; Bates, K.T. The effect of ageing and osteoarthritis on the mechanical properties of cartilage and bone in the human knee joint. Sci. Rep. 2018, 8, 5931. [Google Scholar] [CrossRef] [PubMed]
  38. Peters, A.E.; Akhtar, R.; Comerford, E.J.; Bates, K.T. Tissue material properties and computational modelling of the human tibiofemoral joint: A critical review. PeerJ 2018, 6, e4298. [Google Scholar] [CrossRef] [PubMed]
  39. Thambyah, A.; Nather, A.; Goh, J. Mechanical properties of articular cartilage covered by the meniscus. Osteoarthr. Cartil. 2006, 14, 580–588. [Google Scholar] [CrossRef] [PubMed]
  40. Shepherd, D.; Seedhom, B. The ’instantaneous’ compressive modulus of human articular cartilage in joints of the lower limb. Rheumatology 1999, 38, 124–132. [Google Scholar] [CrossRef] [PubMed]
  41. Franz, T.; Hasler, E.; Hagg, R.; Weiler, C.; Jakob, R.; Mainil-Varlet, P. In situ compressive stiffness, biochemical composition, and structural integrity of articular cartilage of the human knee joint. Osteoarthr. Cartil. 2001, 9, 582–592. [Google Scholar] [CrossRef] [PubMed]
  42. Shepherd, D.; Seedhom, B. A technique for measuring the compressive modulus of articular cartilage under physiological loading rates with preliminary results. Proc. Inst. Mech. Eng. Part H J. Eng. Med. 1997, 211, 155–165. [Google Scholar] [CrossRef] [PubMed]
  43. Hori, R.Y.; Mockros, L. Indentation tests of human articular cartilage. J. Biomech. 1976, 9, 259–268. [Google Scholar] [CrossRef]
  44. Patel, J.M.; Wise, B.C.; Bonnevie, E.D.; Mauck, R.L. A systematic review and guide to mechanical testing for articular cartilage tissue engineering. Tissue Eng. Part C Methods 2019, 25, 593–608. [Google Scholar] [CrossRef]
  45. Setton, L.A.; Zhu, W.; Mow, V.C. The biphasic poroviscoelastic behavior of articular cartilage: Role of the surface zone in governing the compressive behavior. J. Biomech. 1993, 26, 581–592. [Google Scholar] [CrossRef]
  46. Eschweiler, J.; Horn, N.; Rath, B.; Betsch, M.; Baroncini, A.; Tingart, M.; Migliorini, F. The biomechanics of cartilage—An overview. Life 2021, 11, 302. [Google Scholar] [CrossRef]
  47. Petitjean, N.; Canadas, P.; Royer, P.; Noël, D.; Le Floc’h, S. Cartilage biomechanics: From the basic facts to the challenges of tissue engineering. J. Biomed. Mater. Res. Part A 2023, 111, 1067–1089. [Google Scholar] [CrossRef] [PubMed]
  48. Antons, J.; Marascio, M.G.M.; Nohava, J.; Martin, R.; Applegate, L.; Bourban, P.; Pioletti, D. Zone-dependent mechanical properties of human articular cartilage obtained by indentation measurements. J. Mater. Sci. Mater. Med. 2018, 29, 1–8. [Google Scholar] [CrossRef] [PubMed]
  49. Laasanen, M.; Töyräs, J.; Korhonen, R.; Rieppo, J.; Saarakkala, S.; Nieminen, M.; Hirvonen, J.; Jurvelin, J. Biomechanical properties of knee articular cartilage. Biorheology 2003, 40, 133–140. [Google Scholar] [PubMed]
Figure 1. Standardized samples (ASTM D638) with different fiber orientations and concentrations. From left to right, respectively, we have the following: Superficial ( 1 % and 5 % ), Deep ( 1 % and 5 % ), and Middle ( 1 % and 5 % ).
Applsci 14 00331 g001
Figure 2. Three-dimensionally printed functional model of the knee joint (femur, tibia and femoral cartilage) during the mechanical evaluation.
Applsci 14 00331 g002
Figure 3. Boundary conditions and loading configuration utilized during the FEM analysis.
Applsci 14 00331 g003
Figure 4. Strain map after 1150 N uni-axial load. Conditions in rows ( C o n t r o l and D e g e n e r a t i v e , respectively) and materials in columns ( M e d i u m , L i t e r a t u r e , and S o f t , respectively). The color map was normalized on the values of the literature material.
Applsci 14 00331 g004
Figure 5. Stress-strain curves obtained after the simulation in ANSYS of a single-leg gait cycle in full-extended position utilizing the anatomical model without supports.
Applsci 14 00331 g005
Figure 6. Strain distribution on healthy control cartilages following the computational simulation that differed between the two scenarios. On the left, anatomical models without supports were employed, whereas on the right, models designed with supports were utilized.
Applsci 14 00331 g006
Figure 7. Force–displacement curves obtained from the compression test on the synthetic knee setup. It includes the results from the two patient-specific morphologies (Control and Degenerative).
Applsci 14 00331 g007
Figure 8. Stress-strain behavior for compressive and tensile tests of fiber-reinforced samples mimicking the three layers of native cartilage tissue. The tensile chart included a curve for the plain material (without fibers) to estimate the properties of the matrix itself.
Applsci 14 00331 g008
Figure 9. Young’s modulus comparison of presented materials with different literature sources (from left to right: [39,40,41,42,43]). References come from healthy patients and different sites within the knee joint.
Applsci 14 00331 g009
Figure 10. Qualitative assessment of brittle points on Control and Degenerative cartilages printed with M e d i u m and S o f t materials.
Applsci 14 00331 g010
Table 1. Dimensions of designed fibers escalating through consecutive layers, expressed in mm.
LayerLengthDiameter
Superficial60.06
Middle60.12
Deep60.18
Table 2. Material properties used in the simulation; Printed Cartilage modules were calculated as stated in Section 2.6.
NameYoung’s Modulus (MPa)
Cartilage Literature5.00
Printed Cartilage Soft2.43
Printed Cartilage Medium7.24
Bone Literature17,000.00
Printed Bone2500.00
Table 3. Compression Young modulus of fiber-reinforced samples, calculated on average for each group and expressed in MPa [N/mm 2 ].
Layer1% Volume5% Volume
Superficial0.8391.740
Middle0.7941.707
Deep0.7841.829
Table 4. Tensile Young modulus of fiber-reinforced samples, calculated on average for each group and expressed in MPa [N/mm 2 ].
Layer1% Volume5% Volume
Superficial0.2330.409
Middle0.2210.379
Deep0.3371.266
Disclaimer/Publisher’s Note: The statements, opinions and data contained in all publications are solely those of the individual author(s) and contributor(s) and not of MDPI and/or the editor(s). MDPI and/or the editor(s) disclaim responsibility for any injury to people or property resulting from any ideas, methods, instructions or products referred to in the content.

