Abstract
This study focuses on mitigating the decrease in the quality of mulberry after harvest and increasing the value of mulberry products through microwave vacuum drying. The effects of mulberry moisture content on texture properties were investigated, and the test method was optimized through the membership function model and the central composite technique. The influences of the material surface temperature, vacuum degree, and microwave power on the quality of instant mulberry were analyzed comprehensively. A regression model was established to analyze the relationship between each test factor and quality index. The results show that, with increases in the moisture content, both the hardness and chewiness of mulberry present a decreasing trend; when elasticity increases gradually, adhesivity is presented in an inverted V-shaped variation trend, and the cohesiveness remains basically constant. Moreover, the moisture content of mulberry had significant correlations with elasticity, glueyness, chewiness, and hardness (R2 > 0.9). When the moisture content of the samples reached ≤44.07%, the total plate count reached a minimum and changed gradually; thus, the moisture content (44.07%) of mulberry was determined for the technological optimization test. The combination of optimal technological parameters was as follows: material surface temperature = 51.0 °C, vacuum degree = 0.07 MPa, and microwave power = 370 W. Under these optimal technological parameters, the soluble solid content was 42.37%, chewiness was 9.08, and the Vc content was 0.725 mg·(100 g)−1. The average error between the test results and software optimization parameters was 5.88%. The optimized microwave vacuum drying technological parameters improved the drying quality of mulberry significantly. The results can provide theoretical support for the microwave vacuum drying of berries.
1. Introduction
Mulberry, also known as mulberry fruit and sorosis, is the fruit of the mulberry tree Moraceae. Owing to its unique flavor and nutrient-rich characteristics, it is widely consumed [1]. Mulberry has a short shelf life due to its thin pericarp and high moisture content. It is mainly consumed fresh in markets, or after drying. In comparison to other fruit products, the unity of mulberry product restricts the development of the mulberry industry. Drying is a method that eliminates most water in fruits and vegetables, decreases the activity of enzymes, inhibits microbial growth and reproduction, and prolongs their storage period [2]. Changes in moisture content during the drying process often influence the taste and flavor of fruit. Hence, controlling the moisture content is important when drying products. Since mulberry has a high sugar content, high viscosity, and strong water retention, it is often difficult to dehydrate, has a long drying time, and incurs serious damage owing to the active components that are at play under high-temperature and oxygen-enrichment conditions during drying [3]. Microwave vacuum drying is a new technology that integrates the advantages of microwave drying and vacuum drying, and it involves heating the materials using microwaves under vacuum conditions. It combines the fast temperature rise and uniform heating of microwave drying with the low boiling point of water and low oxidizing reaction of materials under negative pressure. Applying microwave vacuum drying technology to the drying of agricultural products can mitigate the adverse influences of excessive drying temperatures on the product, and it can shorten the drying period of products significantly [4]. Hence, microwave vacuum drying is more applicable to the drying production and processing of mulberry.
Recently, microwave vacuum drying has been applied increasingly for the drying production of fruits and vegetables. To improve the quality of dry products, Alvi [5] found that the microwave power, vacuum degree, and processing time had great influences on the color, rehydration capacity, and drying characteristics of tomatoes during microwave vacuum drying. Zhang Qian et al. [6] carried out orthogonal test optimization experiments of microwave vacuum drying for Undaria pinnatifida under different microwave power densities, vacuum degrees, and pulse intervals. The results showed that the rehydration rate of Undaria pinnatifida was 1885.69% after continuous drying for 16 min under a microwave power density of 4.5 W/g and a vacuum degree of 80 kPa. The leaves were deep green and had flat surfaces without burnt flavor and bubbles, thus exhibiting the best quality. Wang Li et al. [7] discussed the effects of the infiltration dehydration of mulberry before drying on the drying kinetics. Their results showed that the drying rate and water diffusion rate declined due to infiltration dehydration, while the internal resistance against the external diffusion of water increased. Senem Suna et al. [8] discussed the effects of hot wind, microwaves, and vacuum drying on the drying characteristics, effective water diffusion rate, color, and oxidation resistance of mulberry bark. They found that the microwave drying technique is more suitable for the production of mulberry products than hot wind drying and vacuum drying as it shortened the drying time most significantly. Moreover, the total phenol content and oxidation resistance of mulberry were increased by (1.41–57.13%) and (0.37–72.79%), respectively. The abovementioned studies have proven the potential of microwave vacuum drying technology in food drying; further, it has been shown that the drying test parameters can influence the taste and quality of products to different extents. However, the ultimate moisture content was controlled to below 20% (wet basis) in most studies on the drying of fruit and vegetables. Further, there is a lack of research on instant fruit and vegetable foods with a fresh and sweet taste, and the influences of moisture content on the nutrients and taste are often ignored. Mitra and Meda et al. [9] explored the influences of microwave vacuum drying technology on the moisture content and water activity of berries by using a central composite rotatable design and response surface method, and then they carried out technological optimization. Their results showed that the moisture content and moisture activity production of fruits decreased by 20% and 0.50% after drying for 51.5–55 min under a microwave power of 5.7–6 kW and a fruit load of 10–9.75 kg. However, they did not discuss the influences of dry control parameters on the drying quality of berries. Nagalakshmi et al. [10] studied the effects of microwave processing variables on the quality of microwave drying products through the central composite rotatable design and response surface method, whereby they constructed a regression model of the hardness, adhesivity, chewiness, microwave power, drying time, and fruit loads of dried berries. However, they did not optimize the drying quality factors and parameters of the berries. Meda et al. [11] explored the influences of microwave vacuum drying technological variables on the moisture content, rehydration ratio, hardness, L value, and total chromatic aberration of berries by combining the response surface method and central composite rotatable design. The results showed that the moisture content of fruit declines quickly when the microwave power and drying time increase and the vacuum degree decreases. However, the rehydration rate, hardness, L value, and chromatic aberration was found to increase. None of the abovementioned studies considered the influences of the material surface temperature on the quality of berries under drying conditions. Moreover, the influence laws of different parameters on the nutrient quality of mulberry must be further investigated.
In this study, a safe moisture content of mulberry products was chosen according to changes in the total plate count in mulberry under different moisture contents in storage, and the influences of the moisture content of mulberry on texture characteristics were discussed. Moreover, the influences of material surface temperature, power, and vacuum degree on the quality of instant mulberry were discussed using the membership function model. The optimal microwave drying technological parameters of mulberry were discussed by combining factor analysis and response surface optimization to enrich the processing techniques of mulberry and increase the economic value of mulberry products.
2. Materials and Methods
2.1. Materials
Purple-black mulberry samples were collected from Alear City, Xinjiang, China. Complete individuals were measured and screened using a vernier caliper (Shanghai Shenhan Measuring Tools Co., Shanghai, China; Accuracy 0.02 mm) and an electronic scale (FA1104, Shanghai Sunny Hengping Scientific Instrument Co., Ltd., Shanghai, China; Accuracy 0.01 g). The longitudinal diameter and horizontal diameter were measured to be 33 ± 0.5 mm and 16.5 ± 0.5 mm, respectively. Fresh mulberries, with a weight of 3 ± 0.5 g per fruit, were chosen as the test objects. The microwave vacuum drying box (HTWB-01: Nanjing Huaiteng Machinery Technology Co., Ltd., Nanjing, China) used in this test was configured with a temperature control module and a temperature induction system that can detect the surface temperature of materials at any time. The material surface used the preset temperature to avoid burning owing to excessively high temperatures at drying. The magnitude of the vacuum degree in the tests was determined using the vacuum gauge above the drying box, whose accuracy was ±0.001 MPa; the accuracy of the temperature sensor was ±0.5 °C. The initial moisture content of the mulberry was tested to be 79.7 ± 0.5% through the vacuum drying technique [12].
2.2. Drying Test
2.2.1. Effect of the Moisture Content on the Texture Characteristics, Sensory Quality, and Colony Number
To investigate the influencing laws of drying control parameters on the drying features of mulberry and to obtain the optimal parameter combination, an appropriate number of fresh mulberries was put in a microwave vacuum drying box. The material surface temperature, microwave power, and vacuum degree were 40.0 °C, 500 W, and 0.08 MPa, respectively. According to the pre-experiment conducted, the drying time required for mulberries was 23 h, the drying interval was 2 h, and the corresponding test times were set to be 11 times according to different drying times. In order to reduce errors, each experiment was repeated 3 times. The safe water content of mulberries was determined by exploring the changes between the water content and texture characteristics, sensory evaluation, and the total number of bacterial colonies.
2.2.2. Parameter Optimization Tests
Before the test, mulberry samples were taken out and left at room temperature for 1 h for cooling. The bases of the mulberry samples were eliminated, and the samples were rinsed; this was followed by drying on spun lace non-woven fabric for subsequent testing. The safe water content of the mulberries was determined based on an analysis of the change of the total number of colonies with water content. During the tests, the material surface temperature, vacuum degree, and microwave power were chosen as the test factors, and their independent influences when the moisture content of mulberry was 44.07% were analyzed. The drying parameters are listed in Table 1. The specific test process was as follows: ① 110 ± 3 g of mulberry samples were placed uniformly on the entire tray before drying (tray size: 137 mm × 158 mm, mulberry thickness: 10 mm). ② Trays full of mulberry samples were put in the microwave vacuum drying box, and the samples were dried according to the preset drying conditions and intervals. ③ When samples were dried to the target moisture content, the samples were taken out to detect their color, moisture content, soluble solid content, and texture characteristics. Three parallel tests were carried out and the mean was selected.

Table 1.
Single-factor test factors and levels.
2.3. Evaluation Indexes
2.3.1. Moisture Content
The vacuum drying technique was chosen to test the moisture content. A total of 2.00–5.00 g of mulberry samples were weighed and put in a weighing disk dried to a constant weight. The control parameters of the vacuum oven were set as follows: temperature = 70.0 °C, and vacuum degree = 93.3–98.6 KPa until reaching the constant weight [10].
2.3.2. Testing of Microbiological Indexes
This section references GB 4789.2-2022 [13] State Criteria for Food Safety Total Plate Count Test of Food Microbiological Test.
2.3.3. Color Changes
The apparent color of mulberry can be measured directly using a chromatic aberration meter (SC-10, 3nh, Guangzhou, China; repeatability accuracy ≤ 0.03 and difference between stations ≤ 0.2). To mitigate the influence of the mulberry size and shape on the test results, samples were first ground and then put into the instrument disk for compaction. Each sample was measured 3 times. The means of L*, a*, and b* were chosen [14]. According to CIE color spaces, the color indexes were expressed as L″, a′, and b, respectively. The color values of each sample were tested 6 times, and the test results were expressed by their mean + standard deviation. The chromaticity (C) and chromatic aberration (∆, E) were calculated according to the measured basic color parameters:
where is the brightness color value of mulberry before drying; is the red-green color value of mulberry before drying; is the yellow-blue color value of mulberry before drying; is the brightness color value of mulberry after drying for t; is the red-green color value of mulberry after drying for t; and is the yellow-blue color value of mulberry after drying for t.
2.3.4. Soluble Solid Content
The soluble solid content was tested by a portable refractometer (PAL-1, ATAGO CO., Ltd., Tokyo, Japan, measuring range Brix 0.0–53.0%, measuring accuracy 0.01%) [15], and it was expressed as a mass fraction (%).
2.3.5. Texture Analysis
The texture was tested according to the methods found in other studies, and the TPA analysis of mulberry samples was carried out using a TMS-Pro texture analyzer (TMS-Pro, Sterling, VA, USA; force range 1–2500 N, stroke range 330 mm, and measurement accuracy is ±0.015% of the selected sensor range). The P/5 cylindrical probe was used, and the test speed was 60 mm/min. The deformation quantity was 50% and the recovery height was 20 mm. Each group of samples was compressed and tested 10 times, and the means were then chosen [16].
2.3.6. Vc Test
A total of 50 mL of the extraction liquid was collected accurately, to which 75 mL was freshly boiled and cooled distilled water was added. Further, 10 mL of 2 mol/L of acetum solution and 3 mL of 0.5% starch solution were added. The calibrated iodine standard solution with a standard concentration was used for titration, and the consumed volume of iodine standard solution was recorded. The means of three repeated tests were collected, and the baseline value was deducted [17]. The Vc content in the samples was then calculated.
2.3.7. Sensory Evaluation
Group scoring was applied for the sensory evaluation of the instant mulberry in this test. Some adjustment was made based on the state criteria [18]. Ten people (aged 20–40) with experience in the research and development of instant foods were invited, including 5 males and 5 females, to describe the qualities of the mulberry samples with different moisture contents from their appearance, sweetness, flavor, and taste. Each index had 5 scores, with a total score of 20. The evaluation standards are listed in Table 2. The score was determined using the average score of the 10-member evaluation group.
Table 2.
Sensory evaluation standards of the dried mulberry.
2.3.8. Statistical Analysis of Data
The membership function comprehensive evaluation method, as a mathematical method of fuzzy comprehensive evaluation, can quantify some factors with unclear boundaries, but they are difficult to quantify. After this, comprehensive evaluation was carried out. In order to obtain a more accurate optimization effect, the membership function comprehensive evaluation method was selected [19]. Then, the principal component analysis (PCA) results and membership function method were combined to comprehensively assess the mulberry drying quality in single-factor tests. The evaluation index system includes the chromatic aberration value, soluble solid content, chewiness, and hardness, that is, the factor set U = (chromatic aberration (μ1), soluble solid content (μ2), chewiness (μ3), elasticity (μ4), and Vc (μ5)). According to the positive and negative influences on mulberry quality, the index data can be divided into positive indexes (soluble solid content (μ2), chewiness (μ3), and Vc (μ5)) and negative indexes (chromatic aberration (μ1) and hardness (μ4)). The fuzzy transfer matrix [20] was then built.
The standardization formula for indexes is
where xj is the jth comprehensive index, u(xj) is the membership function value of the jth comprehensive index, and xmax and xmin are the maximum and minimum of the jth comprehensive index, respectively.
The Excel 2019 statistical data were chosen. SPSS26.0 was used for variance and correlation analysis. The test design and results analysis were carried out in Design-Expert12.
3. Results and Discussion
Various mulberry indexes with different water contents were determined, and the total number of colonies was taken as the end point of spoilage at different water contents to ascertain the law of influence of the water content on the texture characteristics of the mulberry products. The results of this study will help optimize the drying process of mulberries, improve the quality and taste of products, and better meet the needs of consumers for high-quality food.
3.1. Effects of the Moisture Content of Mulberry on the Texture Characteristics and Total Plate Count
3.1.1. Effects of the Moisture Content on the Texture Parameters of Instant Mulberry
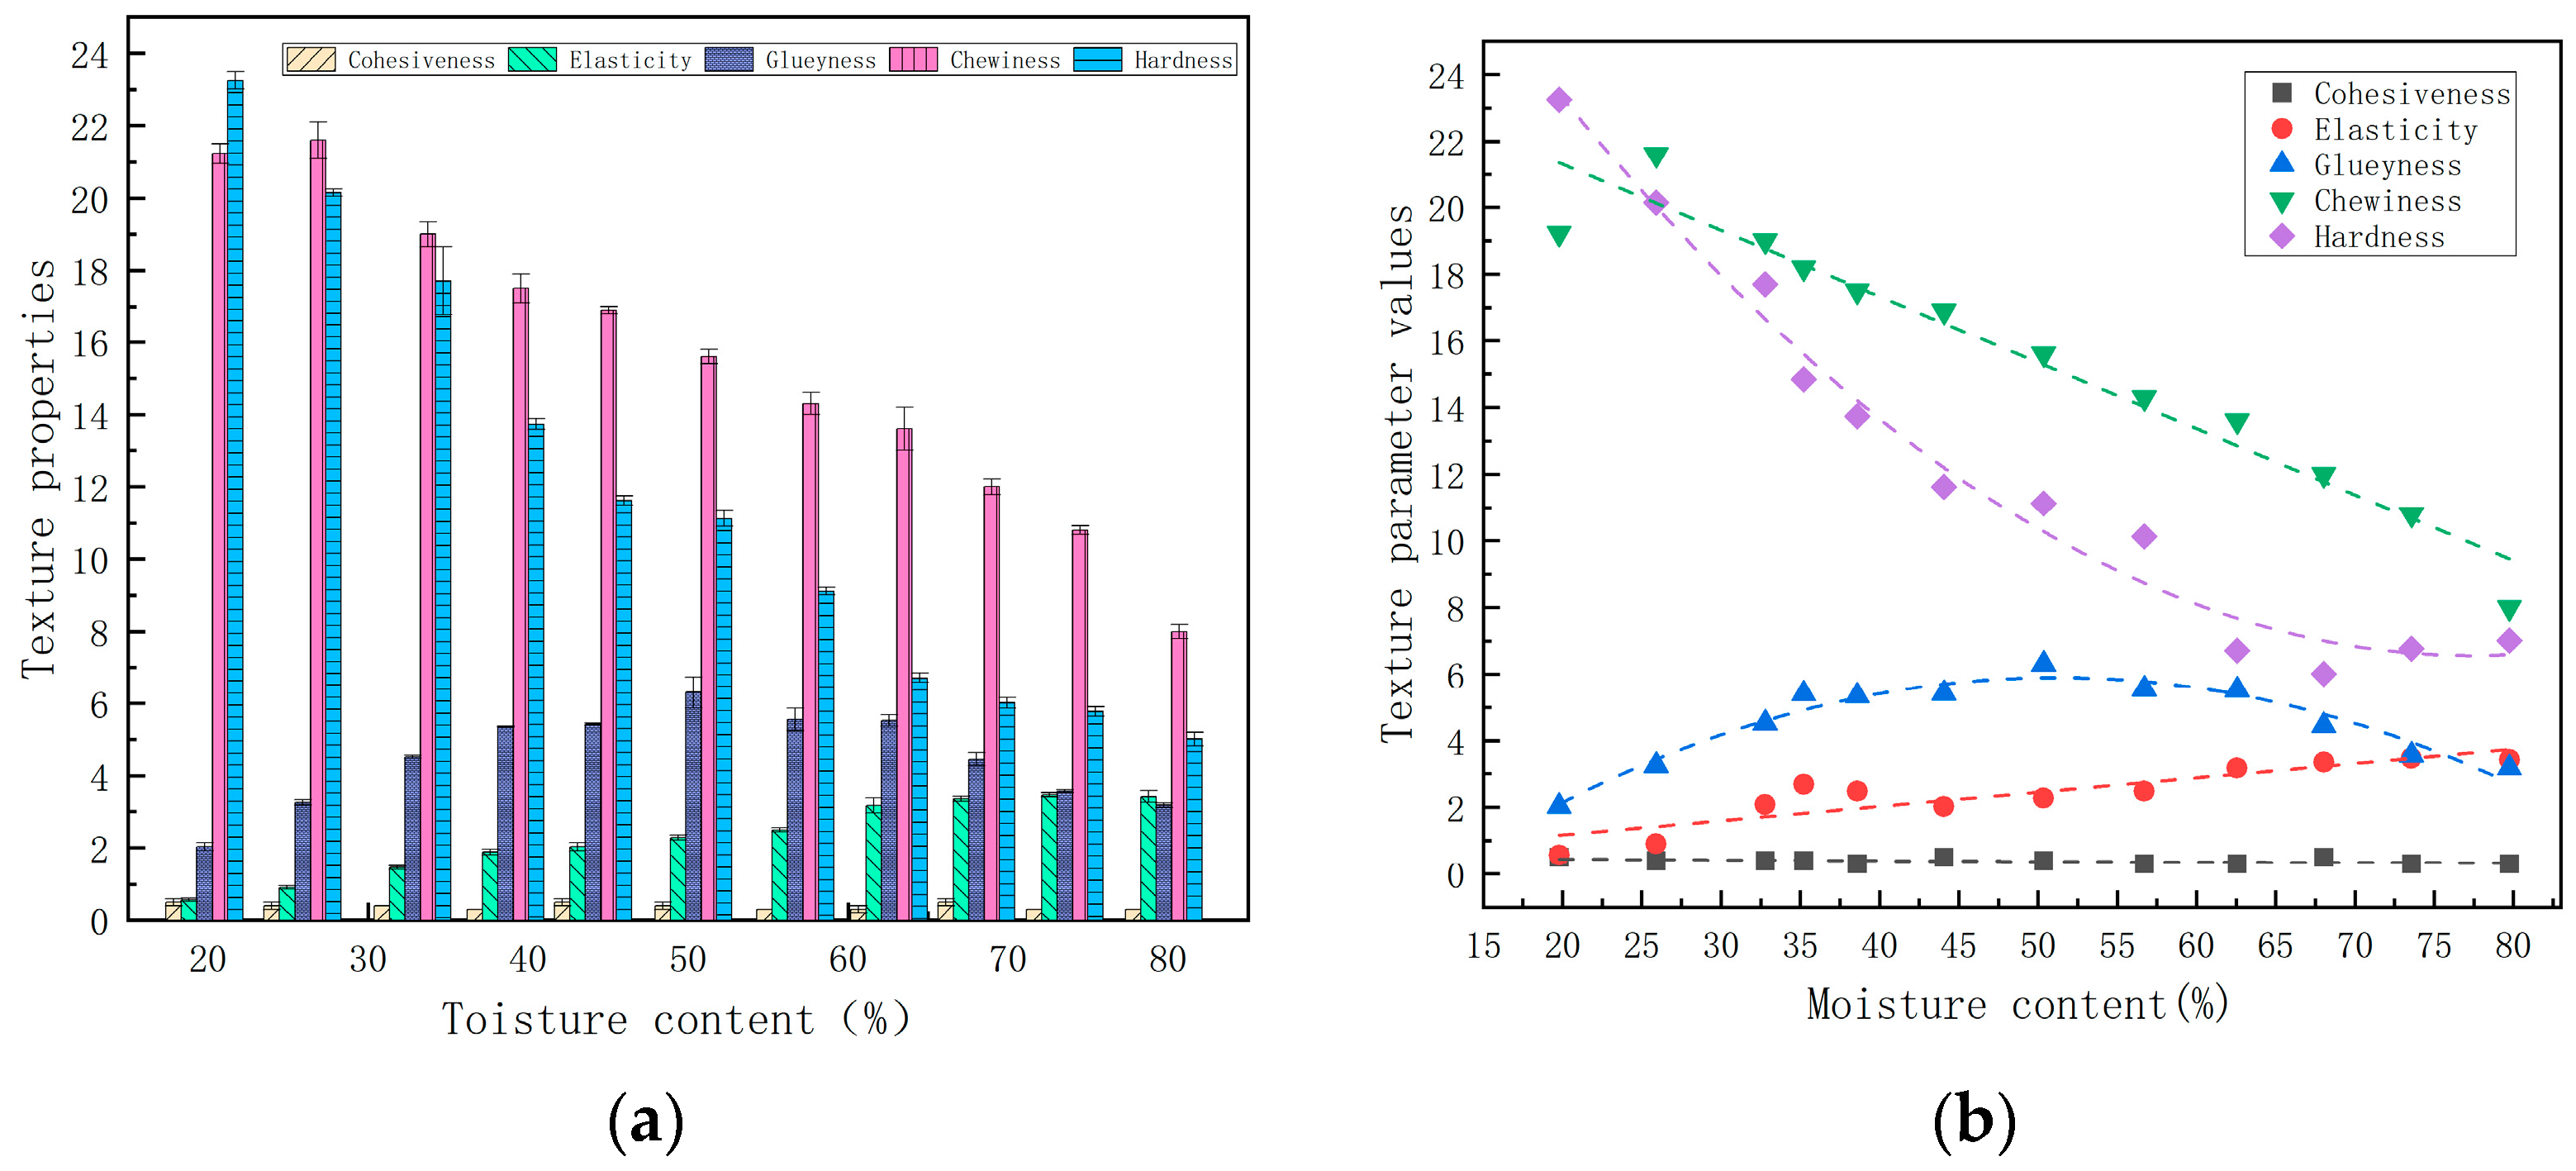
Texture profile analysis is widely used to understand the taste quality of products, and it can simulate the action of chewing food and provide the texture parameters of the product under test. A texture analyzer can ascertain the correlation between food texture and its mechanics. This can help quantify the test results, thereby mitigating the subjective influence of human factors and increasing the accuracy and objectivity of findings [21]. It can be seen from Figure 1a that, with an increase in the moisture content in the samples, the hardness and chewiness of mulberry exhibit a decreasing trend. Further, the elasticity increases gradually, adhesivity increases first and then decreases, and the cohesiveness remains nearly constant. This is basically consistent with the research results of Yao Zhoulin et al. [22] on texture parameters. Furthermore, the cohesiveness could reflect the structural integrity and contractility among cells in the internal tissue of samples [23]. The cohesiveness of mulberry under different moisture contents changes slightly, fluctuating between 0.3 and 0.5. The results show that the internal tissue structure of mulberry is maintained well during microwave vacuum drying. Moreover, there is no obvious effect of moisture content on the tissue structure of mulberry. This is consistent with research conclusions of Moghaddam et al. [24].
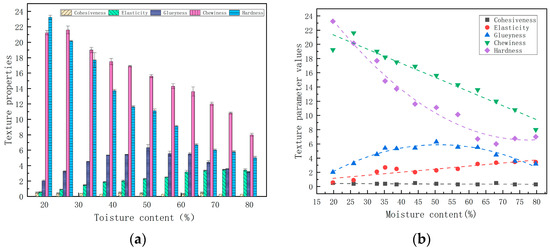
Figure 1.
(a) Effects of the moisture content on the cohesiveness, elasticity, adhesivity, chewiness, and hardness of mulberry. (b) The structural characteristics of the mulberries with different moisture content were fitted.
The correlation analysis results of the texture characteristics of mulberry when the moisture content was in the range of 79.74–19.78% are shown in Table 3. The fitting effect of its linear equation is shown in Figure 1b. Specifically, the elasticity, glueyness, chewiness, and hardness all had significant correlations with the moisture content. The relative structural parameters of the elasticity, adhesion, mastication, and hardness of mulberries can be calculated by the fitting formula.
Table 3.
Equation of the regression between the moisture contents of the mulberry and the texture characteristics.
3.1.2. Effects of the Moisture Content on the Sensory Quality of Mulberry
Sensory quality is an important index to measure the quality of ready-to-eat products, and the water content has a great influence on the sensory quality of such products. The sensory assessment results are listed in Table 4. It can be seen from the table that the sensory taste results of dried mulberry with different moisture contents differed significantly. The dried mulberry with a higher moisture content had higher sensory scores, but the sweetness score increased with reductions in the moisture content. This might be because drying may remove the water in mulberry, thus concentrating the sugar content. An overall analysis of the appearance, fragrance, and tastes of mulberry was carried out. Dried mulberry with a higher moisture content was found to be more appreciated.
Table 4.
The sensory score of mulberry with different moisture contents.
3.1.3. Effects of the Moisture Content on the Total Plate Count of Instant Mulberry
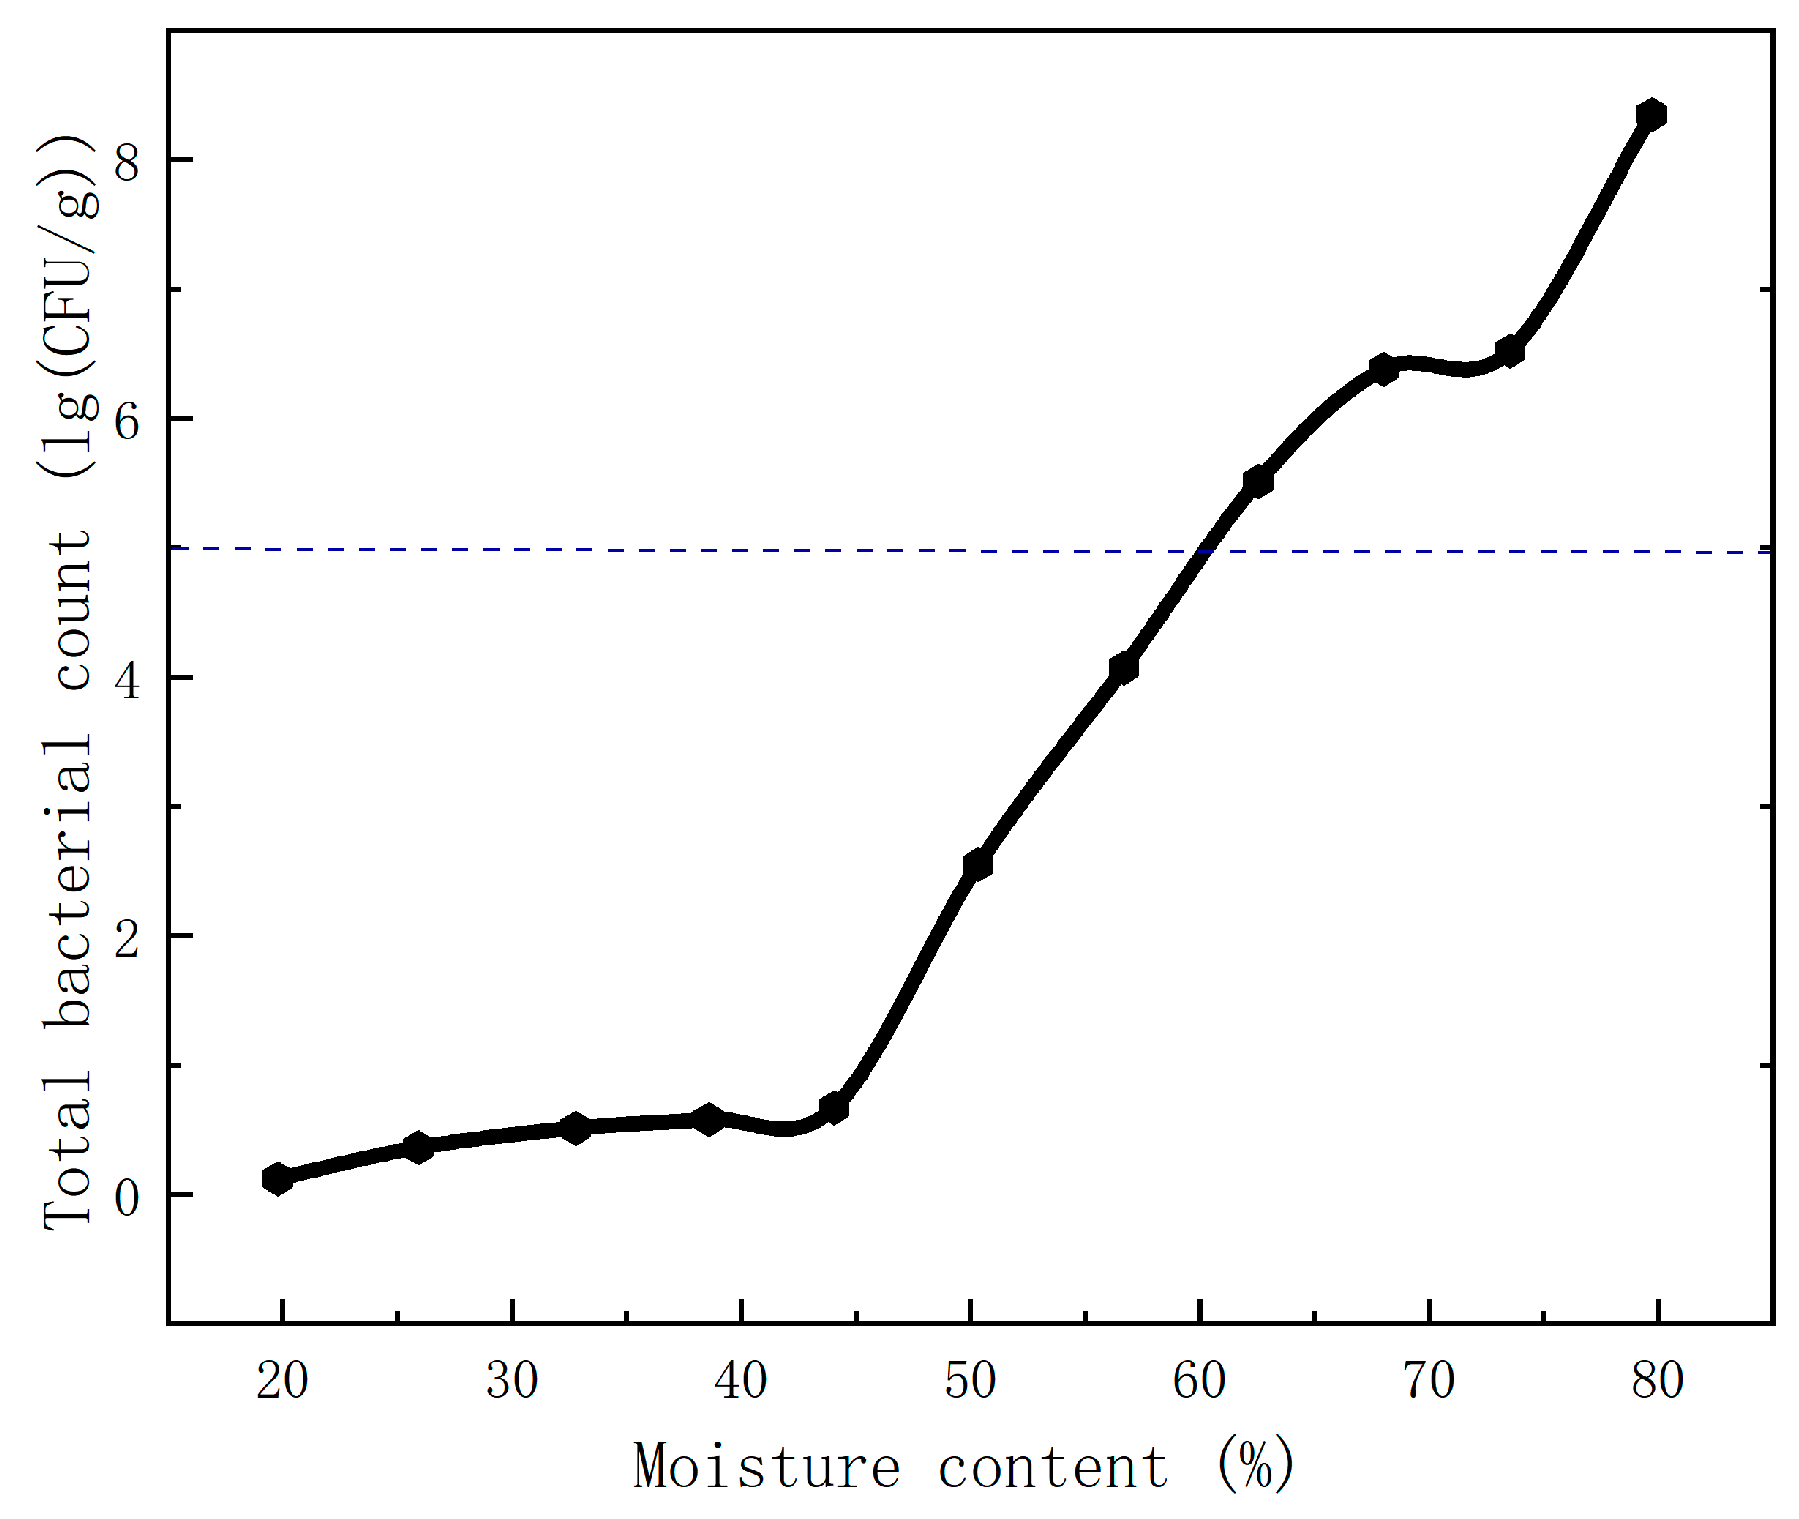
Mulberry samples with different moisture contents were put in a refrigerator at 4.0 °C for 5 d before testing the total plate count; the results are shown in Figure 2. The total plate count of the samples declined with decreases in the moisture content. This is a similar result to the conclusions of Faiqa et al. [25]: the sterilizing effect was strengthened as the microwave processing time increased, and the total plate count presented an increasing trend. This can be explained as follows: the microbial metabolism and reproduction capacity increased with increases in the moisture content, thus resulting in the fast growth of the total plate count between 44.07% and 79.74%. Foods qualify if their total plate count is lower than 5 log (CFU/g). Hence, instant mulberry conforms to the safety standards of bacterial colonies when the moisture content is lower than 60%. However, the total plate count changes greatly and has poor stability when the moisture content of the mulberry is between 44.07% and 79.74%, and it reaches the minimum when the moisture content is lower than 44.07%, where it is accompanied by stable changes. Therefore, the moisture content of mulberry should be controlled to lower than 44.07%.
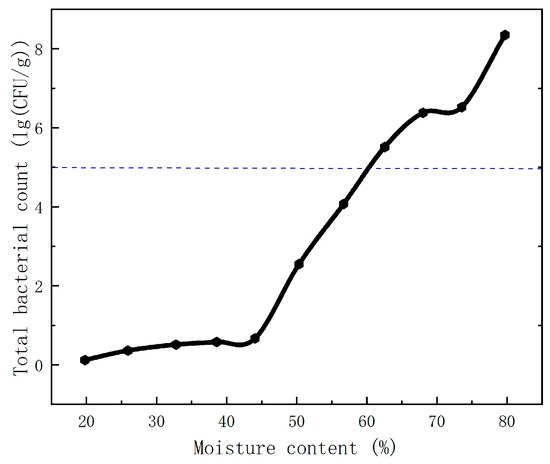
Figure 2.
The total plate count of mulberry with different moisture contents.
3.2. Optimization Results and Analysis of Mulberry Drying Technology
By studying the influence of the water content on the number of bacterial colonies, the safe water content of mulberry was determined to be 44.07% based on the total number of bacterial colonies, and the mulberry was dried to 44.07%. The effects of the material surface temperature, vacuum degree, and microwave power on the dry color difference, sugar content, chewing ability, hardness, and Vc of mulberry were investigated. Compared with traditional sensory evaluation, texture analyzers have the advantages of abundant and quick operation when evaluating the texture indexes of fruits and vegetables. Texture data mainly include the following types of metrics: hardness, elasticity, cohesion, viscosity, and chewability [26]. According to a study by Li [27], there is a close relationship among the metrics in the texture data, where hardness and elasticity are usually inversely proportional, that is, objects with a higher hardness have a lower elasticity. Chen’s research [28] found that there was a very significant positive correlation between the texture adhesiveness and masticity (p < 0.01). In the pre-test of the mulberry drying, it was found that the cohesiveness of the mulberry changed little during the drying process. Therefore, hardness and chewability were selected as the representative indexes of the texture characteristics according to the pre-test studies and the previous literature.
3.2.1. Effects of the Material Surface Temperature on Mulberry Quality
Single drying was performed by fixing the vacuum degree at 0.07 MPa and microwave power at 350 W to investigate the effects of mulberry surface temperature (40.0 °C, 42.0 °C, 44.0 °C, 46.0 °C, 48.0 °C, 50.0 °C, 52.0 °C, 54.0 °C, 56.0 °C, 58.0 °C, and 60.0 °C) on its quality. The test results are listed in Table 5. With increases in the drying temperature, the chromatic aberration of mulberry first decreased and then increased; the soluble solid content and Vc content increased first and then decreased; and then the chewiness decreased gradually. The hardness increased with increases in the temperature.
Table 5.
Effects of the material surface temperature on the drying quality of mulberry.
3.2.2. Effects of the Vacuum Degree on Mulberry Quality
The effects of the vacuum degree (0.01 MPa, 0.02 MPa, 0.03 MPa, 0.04 MPa, 0.05 MPa, 0.06 MPa, 0.07 MPa, 0.08 MPa, and 0.09 MPa) on the mulberry quality were investigated at a fixed material surface temperature (52.0 °C) and microwave power (350 W). The test results are shown in Table 6. With an increase in the vacuum degree, the chromatic aberration and chewiness of the mulberry products increased first and then decreased; the soluble solid content and Vc content presented a rising trend; and the hardness declined accordingly.
Table 6.
Effects of the vacuum degree on the drying quality of mulberry.
3.2.3. Effects of the Microwave Power on the Quality of Mulberry
The effects of microwave power (200 W, 250 W, 300 W, 350 W, 400 W, 450 W, and 500 W) on the mulberry quality were investigated at a fixed material surface temperature (52.0 °C) and vacuum degree (0.07 MPa). The test results are shown in Table 7. With an increase in the microwave power, the chromatic aberration of the mulberry increased and then stabilized. In contrast, the chewiness, soluble solid content, and hardness evidently increased, and the Vc content presented an inverted V-shaped variation trend.
Table 7.
Effects of the microwave power on the drying quality of mulberry.
3.2.4. Variance Analysis of the Mulberry Quality under Different Drying Technological Parameters
The variance analysis of the abovementioned test factors was carried out using SPSS26.0. The calculation results are shown in Table 8. The material surface temperature, vacuum degree, and microwave power all had significant influences on the indexes of the dried mulberry (p < 0.05). The drying optimization test was carried out according to the analysis results.
Table 8.
Variance analysis of the mulberry quality under different drying technological parameters.
3.2.5. Determining the Weights of the Comprehensive Indexes
The common factor variance in the evaluation indexes was determined by principal component analysis (PCA), and the proportions of the common factor variance of the indexes were used as weights for the indexes [29]. The results are shown in Table 9. The soluble solid content, chewiness, and VC content of the mulberry all accounted for more than 20% of the weights. According to the test results, these were the three indexes for the microwave vacuum drying of mulberry.
Table 9.
The linear combination coefficient and weight results.
3.2.6. Comprehensive Evaluation of the Mulberry Quality Based on the Membership Function Model
The membership function values and comprehensive scores of the mulberry quality under single-factor control parameters were calculated. Higher scores indicate a higher comprehensive mulberry drying quality (Table 10). The optimal ranges of the single-factor control parameters were determined as follows: material surface temperature—46.0–54.0 °C; vacuum degree—0.05–0.09 MPa; and microwave power—300–500 W. Under these conditions, the mulberry quality reached its highest after microwave vacuum drying. The comprehensive score ranking of the membership function reflects the comprehensive results of the effects of the single-factor test control parameters on the indexes of the mulberry products. To acquire more accurate drying technological parameters of mulberry, the interactive influencing laws of the control parameters on mulberry indexes and the optimal parameter combination were investigated through response surface optimization analysis.
Table 10.
Membership functional values of the test factors and comprehensive evaluation results.
3.3. Optimization of the Microwave Vacuum Drying Technology
3.3.1. Test Design Scheme and Results
To investigate the influencing laws of the drying control parameters on the drying features of mulberry and to obtain the optimal parameter combination—in addition to determining the influence laws of the drying control parameters on the drying features of mulberry and to obtain the optimal parameter combination—mulberries with a longitudinal diameter of 33 ± 0.5 mm and a horizontal diameter of 16.5 ± 0.5 mm were chosen as research objects, and these were determined according to the single-factor experimental results. The material surface temperature (X1), vacuum degree (X2), and microwave power (X3) were chosen as independent variables, while the sweetness (Y1), chewiness (Y2), and VC content (Y3) were chosen as dependent variables. The ternary quadratic regression orthogonal rotary optimization test was carried out using the star point design–response surface method. The factor level codes are listed in Table 11, and the experimental design and results are shown in Table 12.
Table 11.
The test-factor level codes.
Table 12.
The technological parameter test design and results of the microwave vacuum drying of the mulberry.
3.3.2. Construction of the Regression Model and Variance Analysis
The quadratic multinomial regression models of the material surface temperature, vacuum degree, and microwave power with the soluble solid content, chewiness, and Vc content were constructed. The coding spatial regression equation after insignificant factors were eliminated as follows:
where Y1, Y2, and Y3 are the soluble solid content, chewiness, and Vc content, respectively, and x1, x2, and x3 are the material surface temperature, vacuum degree, and microwave power (code values), respectively.
Y1 = 388.13x2 + 0.169x3 − 0.188x12 − 524.6,
Y2 = 6.67 − 0.919x1 + 0.1x3 − 768.19x22,
Y3 = 262.7x2 + 0.223x3 − 0.0008x1x3 − 0.057x12 − 0.00026x32 − 208.7,
It can be seen in Table 13 that, after the variance analysis of the test results, the regression equation models of the soluble solid content, chewiness, and Vc content were extremely significant in the significance test results (p < 0.01), and the lack-of-fit test results were also found to be insignificant (p > 0.05). This indicates that the regression model had a good fitting degree in the test range.
Table 13.
Variance analysis results of the regression models.
3.3.3. Effects of the Interaction of Factors on Test Indexes
The experimental data were analyzed and processed using Design-Expert12. According to the established regression models, the surface diagrams of the effects of the factor interaction on the indexes was obtained [30] (Figure 3, Figure 4 and Figure 5).
- (1)
- Effects of the test factors on the soluble solid content
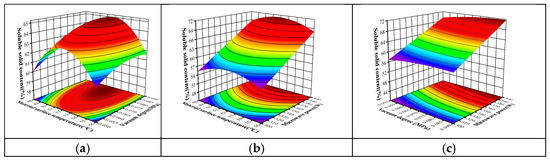
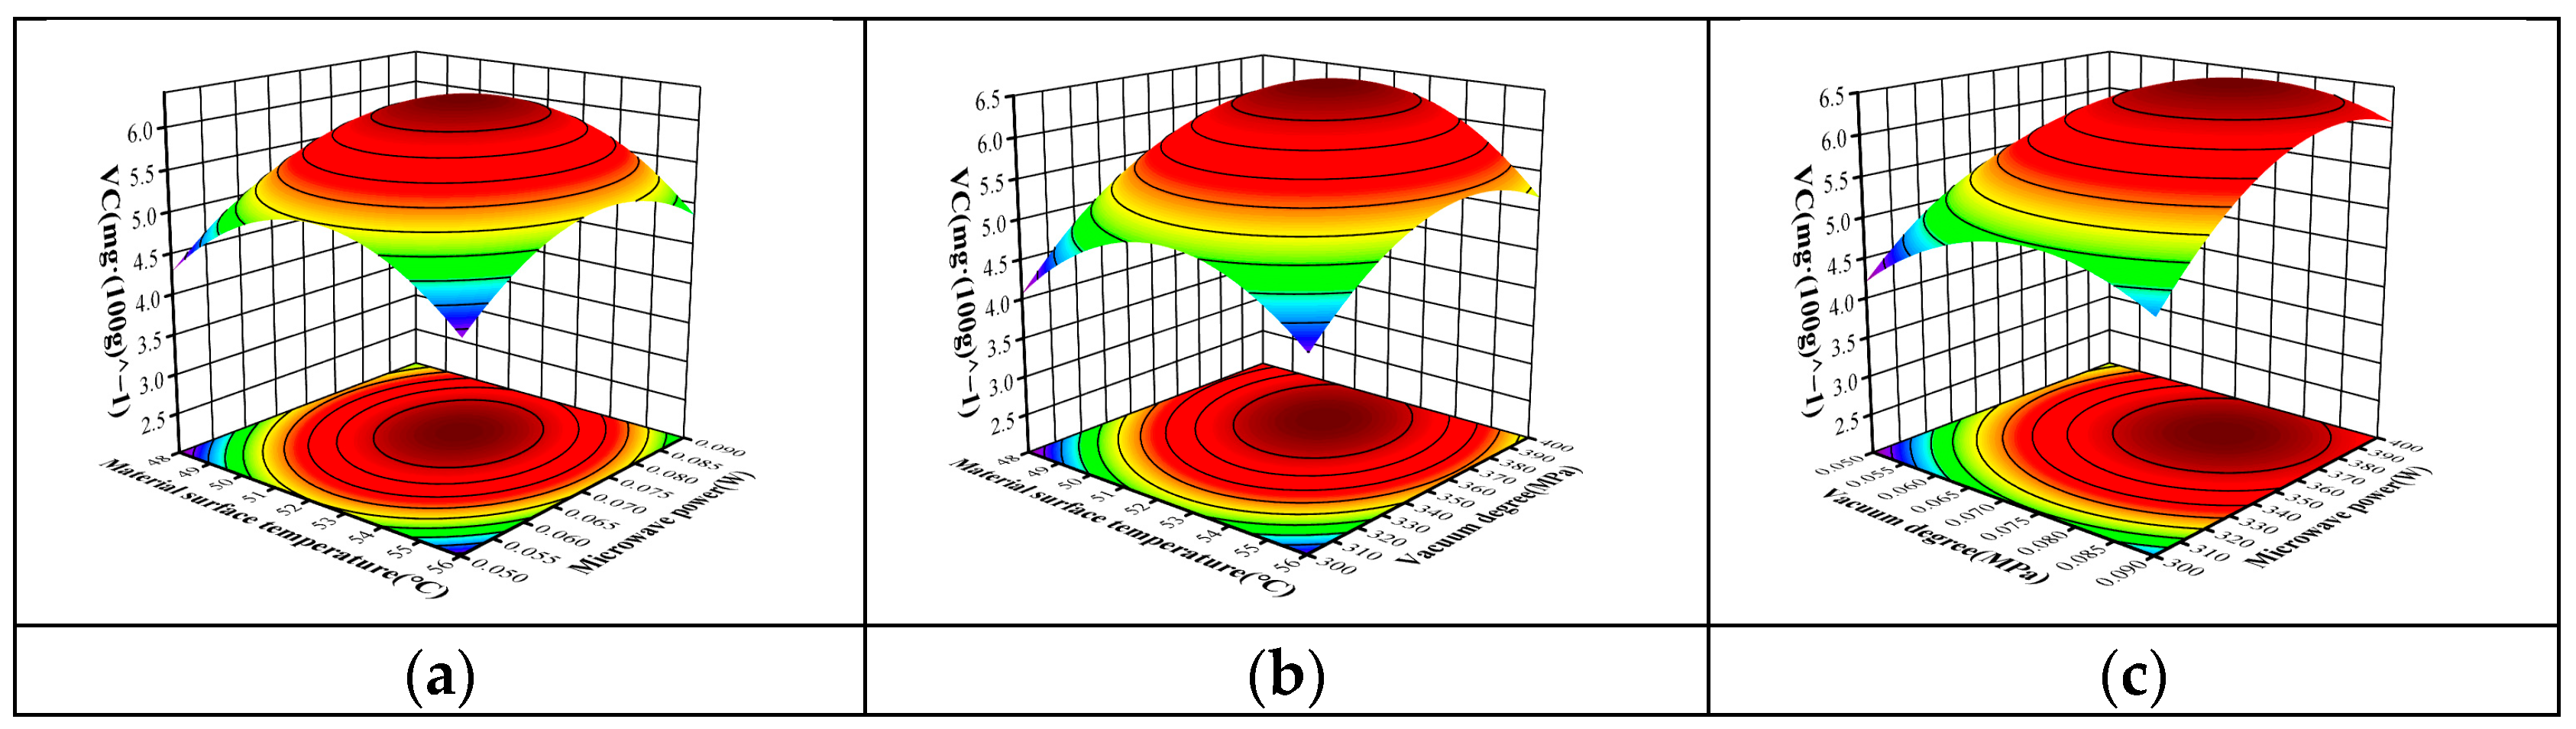
Figure 3.
Effects of two factors on the soluble solid content. (a) Effect of the surface temperature and vacuum degree on the soluble solid content. (b) Effect of the material surface temperature and microwave power on the soluble solid content. (c) Effect of the vacuum degree and microwave power on the soluble solid content. Note: The response surface color in the figure is usually used to represent the numerical size or degree of the response variable, where darker areas represent higher response values and lighter areas represent lower response values.

It can be seen from Figure 3 that the soluble solid content increased and then decreased with increases in the material surface temperature, and it only increased with increases in the microwave power and vacuum degree. At a fixed microwave power (350 W), the soluble solid content changes in the mulberry during microwave vacuum drying were mainly divided into two classes in the temperature range of 48.0–56.0 °C. One was caused by dehydration and the other was caused by the cleavage reaction of the polysaccharide structure. The water content in the mulberry decreased owing to drying and heating. As the concentration of polysaccharide molecules increased, the soluble solid content of the mulberry increased. When the drying temperature exceeded 52.0 °C, the spatial structures of the internal polysaccharides changed. However, the interaction of the polysaccharide molecules was enhanced after cooling, thus inducing aggregation. At high temperatures, hydrogen bonds break and some heteropolysaccharides are decomposed into monosaccharides, thus decreasing the heteropolysaccharide content [31]. This is consistent with research results of Huang Yan [32] and Alagbe et al. [33]. At a constant temperature, the soluble solid content of mulberry increases gradually with increases in the vacuum degree and microwave power in the threshold intervals; the retention rate of polysaccharides was also increased to a certain extent. This might be because the corresponding drying temperature increases with decreases in the vacuum degree. Due to microwave radiation, the degradation of polysaccharides in mulberry increases, thus increasing the degree of the Maillard reaction at the same time. Hence, the vacuum degree should be increased appropriately to decrease the loss of polysaccharides in the products. Given the small microwave intensity, it takes a longer time to dry products, and it also takes longer time for the heating-induced degradation of polysaccharides and the Maillard reaction of proteins to take place. As a result, the soluble solid content decreased. This conclusion is similar to the research results of Gómez [34].
- (2)
- Effects of the test factors on the chewiness

Figure 4.
Effects of the two factors on chewiness. (a) Effect of the surface temperature and vacuum degree on the chewability of the materials. (b) Effect of the surface temperature and microwave power on the masticability of the materials. (c) Effect of the vacuum degree and microwave power on the mastication of the materials. Note: The response surface color in the figure is usually used to represent the numerical size or degree of the response variable, where darker areas represent higher response values and lighter areas represent lower response values.
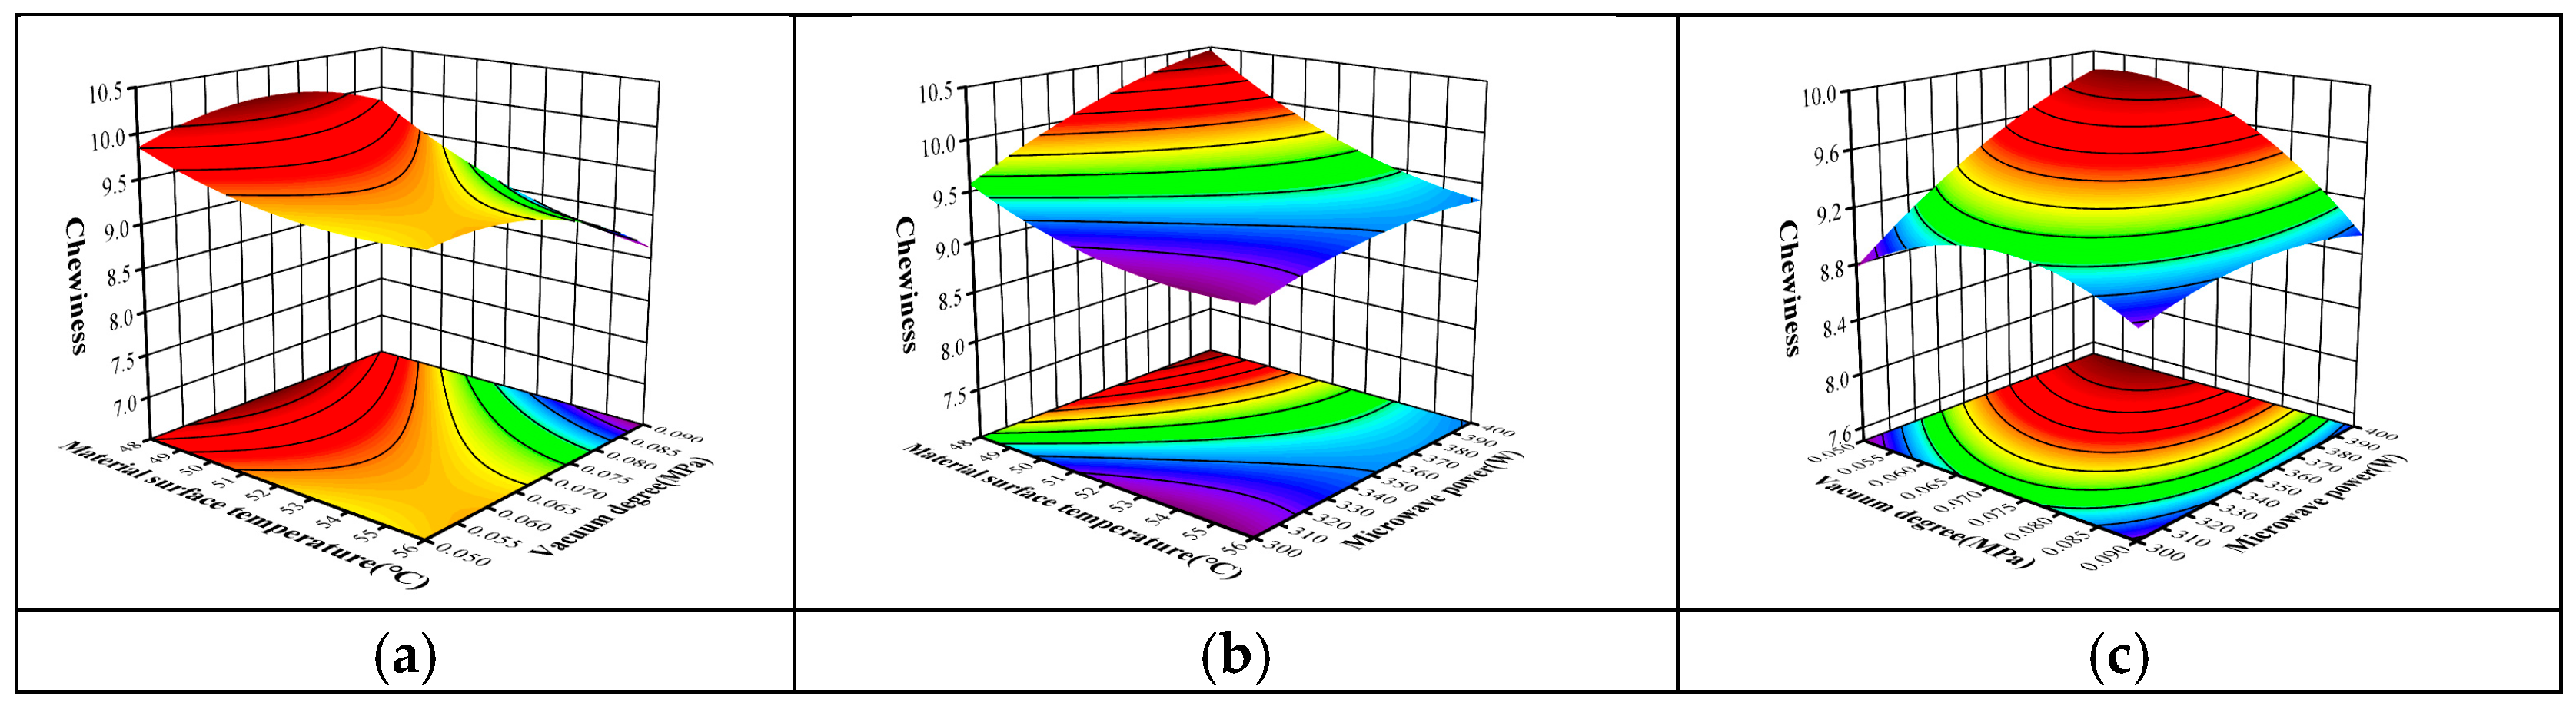
It can be seen from Figure 4 that the chewiness decreased gradually with increases in the material surface temperature, and this then increased with increases in the microwave power; however, it increased first and then decreased with increases in the vacuum degree. The reasons for this are as follows. Given the fixed microwave power and vacuum degree, the time for mulberry drying was shortened significantly with increases in the temperature, and the dehydration volume of the mulberry per unit time increased. The pulp cells shrank quickly and formed a layer of hard film on the mulberry surface. The internal structure of the products was tight [35], thus increasing the hardness significantly, as well as tightening the internal structure and decreasing chewiness [36]. At a fixed vacuum degree (0.07 MPa) and material surface temperature (52.0 °C), the chewiness of the mulberry increased with increases in the microwave power. At a fixed material surface temperature and microwave power, the vacuum degree had positive effects on the chewiness of the mulberry. Similarly, at a fixed material surface temperature and microwave power, the vacuum degree had negative linear effects on the chewiness of the mulberry. The maximum chewiness force was observed when the material surface temperature was 52.0 °C, the microwave power was 350 W, and the vacuum degree was 0.07 MPa. The variation found in the chewiness of the mulberry with microwave power and vacuum degree conformed to the research conclusions of Agalakshmi [10].
- (3)
- Effects of the test factors on the Vc content
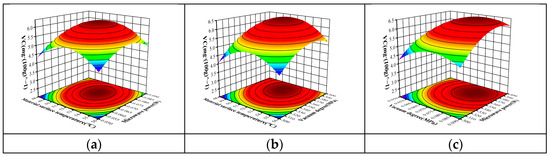
Figure 5.
Effects of two factors on the VC content. (a) Effect of the material surface temperature and microwave power on the Vc content. (b) Effect of the material surface temperature and vacuum degree on the Vc content. (c) Effect of the vacuum degree and microwave power the on Vc content. Note: The response surface color in the figure is usually used to represent the numerical size or degree of the response variable, where darker areas represent higher response values and lighter areas represent lower response values.
It can be seen from Figure 5 that the Vc content increased first and then declined with increases in the material surface temperature and power; however, it only increased with increases in the vacuum degree. The Vc is extremely sensitive to heat, and it can be lost at high temperatures and oxidization levels [37]. With increases in the temperature, the drying time of mulberry was shortened, decelerating the Vc degradation [38]. However, the Vc may be oxidized to a brown color at high temperatures; such browning pigments are furfural compounds [39]. When the drying temperature is relatively high, the Vc was significantly destroyed. This is consistent with the research results of Silvana M et al. [40], where the Vc was damaged more seriously if the microwave power was higher because excessive microwave power can destroy the cell structure and release bioactive compounds to the external environment [41]. Hence, the thermal degradation of the Vc content at 400 W of microwave power was higher than that at 350 W. The Vc content in the mulberry increased first and then decreased with increases in the microwave temperature and power, which is consistent with research results of Deepa [42]. Moreover, it takes a longer time to dry if the vacuum degree is lower and the Vc is damaged more severely. Sernikli et al. [43] found that Vc degradation is increased as the drying process is prolonged. It can prevent the degradation of easy-to-oxidize component substances effectively at low-temperature and vacuum conditions; however, the Vc retention degree remained relatively high. Therefore, the vacuum degree must be increased appropriately to maintain the Vc content.
3.3.4. Parameter Optimization
To obtain the combination of optimal microwave vacuum drying parameters, the model was optimized using the Design-Expert software (v.13) under the target values of the soluble solid content, chewiness, and maximum Vc content. On this basis, the combination of optimal technological parameters in the experimental range was a material surface temperature of 50.761 °C, a vacuum degree of 0.073 MPa, and a microwave power of 370.558 W. Under these conditions, the soluble solid content, chewiness, and Vc content were 43.967%, 9.701, and 0.785 mg·(100 g)−1, respectively.
A verification experiment was carried out with the optimization parameters in the laboratory. To eliminate random errors, experimental parameters were optimized and rounded-off numbers were taken: material surface temperature—51.0 °C, vacuum degree—0.07 MPa, and microwave power—370 W. Three repeated tests were carried out and the mean was chosen (Table 14). According to the analysis, the average error between the test results and software-optimized parameter values was 5.88%. This proves that the test results were basically consistent with the optimization results. In other words, it is reasonable for choosing the influencing factors of mulberry drying quality.
Table 14.
The test results of the optimization parameters.
4. Conclusions
In this study, the effects of the microwave vacuum drying technological parameters on the sensory quality and nutrient quality of the mulberry drying were studied through single-factor and multi-factor tests. Some conclusions can be drawn:
- (1)
- According to the analysis of the single-factor test results, the material surface temperature, vacuum degree, and microwave power had significant influences on the drying quality of the mulberry (p < 0.05).
- (2)
- The comprehensive scores of the single-factor test factors were compared against the membership function model. The best mulberry quality was achieved when the material surface temperature was 46.0–54.0 °C, the vacuum degree was 0.05–0.09 MPa, and the microwave power was 300–500 W.
- (3)
- The following optimal parameter combinations for the microwave vacuum drying technology was obtained through a central composite test design: material surface temperature—50.761 °C, vacuum degree—0.073 MPa, and microwave power—370.558 W. Under the optimal parameters, the soluble solid content, chewiness, and Vc content were 43.967%, 9.701, and 0.785 mg·(100 g)−1, respectively. To eliminate random errors, the test parameters were optimized, and the integral values were chosen as follows: material surface temperature—51 °C, vacuum degree—0.07 MPa, and microwave power—370 W. Under these conditions, the soluble solid content was 42.37%, chewiness was 9.08, and Vc content was 0.725 mg·(100 g)−1. The average error between the test results and software optimization parameters was 5.88%, thereby indicating that the optimized technological parameters can improve the drying quality of mulberry.
An optimized technological parameter combination of microwave vacuum drying can effectively decrease nutrient loss and improve the drying quality of mulberry. It can provide references for the practical initial processing technology of mulberry, as well as offer some theoretical references to further understand the importance of the drying of mulberry.
Author Contributions
Conceptualization, H.Z. and Y.C.; methodology, Y.C.; software, Y.C.; validation, Y.T.; formal analysis, Y.L.; investigation, Y.C.; resources, H.Z.; data curation, Y.C.; writing—original draft preparation, Y.C.; writing—review and editing, H.Z. and Y.L.; visualization, Z.L. and X.Y.; supervision, H.Z. and Y.L.; project administration, J.M. (Jiale Ma) and J.M. (Jiaxin Ma); funding acquisition, H.Z. All authors have read and agreed to the published version of the manuscript.
Funding
This research was financially supported by the Tarim University Graduate Research Innovation Project (TDGRI202246): Dynamics and Quality Analysis of Mulberry Microwave Vacuum Drying; the Chinese Natural Science Foundation (12002229, 31160196), the President’s Foundation of Tarim University (TDZKBS202001), the Open Project of the Modern Agricultural Engineering Key Laboratory (TDNG2022101, TDNG2021104), and the Shishi Science and Technology Program (Grant No. 2021ZB01).
Institutional Review Board Statement
Not applicable.
Informed Consent Statement
Not applicable.
Data Availability Statement
The raw data supporting the conclusions of this article will be made available by the authors on request.
Acknowledgments
The authors thank Hong Zhang from Tarim University for their thesis supervision. The authors are grateful to the anonymous reviewers for their comments.
Conflicts of Interest
The authors declare no conflicts of interest.
References
- Martins, M.S.; Gonçalves, A.C.; Alves, G.; Silva, L.R. Blackberries and Mulberries: Berries with Significant Health-Promoting Properties. Int. J. Mol. Sci. 2023, 24, 12024. [Google Scholar] [CrossRef] [PubMed]
- Cui, Z.-W.; Xu, S.-Y.; Sun, D.-W. Dehydration of garlic slices by combined microwave-vacuum and air drying. Dry. Technol. 2003, 21, 1173–1184. [Google Scholar] [CrossRef]
- Xia, X.Y.; Wang, F.J.; Fu, Q.; Zhang, N.; Guo, Q.Q. Thermal stability and degradation kinetic model of proanthocyanidins in blueberry (Vaccinium spp.) juice beverage. J. Nanjing For. Univ. 2019, 43, 89–95. [Google Scholar]
- Pakeeza, K.; Anindita, K.; Ivi, C. Microwave-vacuum drying: Modeling validation of drying and rehydration kinetics, moisture diffusivity and physicochemical properties of dried dragon fruit slices. Food Humanit. 2024, 2, 100292. [Google Scholar]
- Alvi, T.; Khan, M.K.I.; Maan, A.A.; Rizwan, M.; Aamir, M.; Saeed, F.; Ateeq, H.; Raza, M.Q.; Afzaal, M.; Shah, M.A. Microwave-vacuum extraction cum drying of tomato slices: Optimization and functional characterization. Food Sci. Nutr. 2023, 11, 4263–4274. [Google Scholar] [CrossRef] [PubMed]
- Zhang, Q.; Li, S.Y.; Li, X.C.; Mu, G.; Dai, Y.J.; Zhang, G.C. Mass and heat transfer characteristics and quality optimization of microwave vacuum drying for wakame. Food Mach. 2022, 38, 166–173. [Google Scholar]
- Wang, L.; Wen, H.; Yang, N.; Li, H. Effect of vacuum freeze drying and hot air drying on dried mulberry fruit quality. PLoS ONE 2023, 18, e0283303. [Google Scholar] [CrossRef] [PubMed]
- Senem, S.; Azime, Ö.K. Investigation of drying kinetics and physicochemical properties of mulberry leather (pestil) dried with different methods. Food Process. Preserv. 2019, 43, e14051. [Google Scholar]
- Pranabendu, M.; Venkatesh, M. Optimization of Microwave-Vacuum Drying Parameters of Saskatoon Berries Using Response Surface Methodology. Dry. Technol. 2009, 27, 1089–1096. [Google Scholar]
- Nagalakshmi, A.S.; Mitra, P.; Meda, V. Color, Mechanical, and Microstructural Properties of Vacuum Assisted Microwave Dried Saskatoon Berries. Int. J. Food Prop. 2014, 17, 2142–2156. [Google Scholar] [CrossRef]
- Meda, V.; Mitra, P.; Lee, J.H.; Chang, K.S. Optimization of microwave-vacuum dryingprocessing parameters on the physical propertiesof dried Saskatoon berries. Open Agric. J. 2016, 1, 7–17. [Google Scholar] [CrossRef]
- Rogovskii, I.L.; Titova, L.L.; Trokhaniak, V.I.; Solomka, V.; Popyk, P.S.; Shvidia, V.O.; Stepanenko, S.P. Experimental Studies on Drying Conditions of Grain Crops with High Moisture Content in Low-Pressure Environment. INMATEH Agric. Eng. 2019, 57, 141–146. [Google Scholar] [CrossRef]
- GB4789.2-2022; Microbiological Testing of Food Hygiene—Determination of Total Colonies. National Health Commission: Beijing, China, 2022.
- Huang, Y.Z.; Han, L.; Yang, X.; Liu, Y.; Zhu, B.-W.; Dong, X.-P. Enhanced batch sorting and rapid sensory analysis of Mackerel products using YOLOv5s algorithm and CBAM: Validation through TPA, colorimeter, and PLSR analysis. Food Chem. X 2023, 19, 100733. [Google Scholar] [CrossRef] [PubMed]
- Sugiura, A.; Kataoka, I.; Tomana, T. Use of refractometer to determine soluble solids of astringent fruits of Japanese persimmon (Diospyros kaki L.). J. Hortic. Sci. 2015, 58, 241–246. [Google Scholar] [CrossRef]
- Ozgüney, I.; Kardhiqi, A. Properties of bioadhesive ketoprofen liquid suppositories: Preparation, determination of gelation temperature, viscosity studies and evaluation of mechanical properties using texture analyzer by 4 × 4 factorial design. Pharm. Dev. Technol. 2014, 19, 968–975. [Google Scholar] [CrossRef] [PubMed]
- Feszterová, M.; Mišiaková, M.; Kowalska, M. Bioactive Vitamin C Content from Natural Selected Fruit Juices. Appl. Sci. 2023, 13, 3624. [Google Scholar] [CrossRef]
- GBT 16860-1997; Sensory Analysis Method Inspection of Texture Profile. National Health Commission: Beijing, China, 1997.
- Li, X.; Ullah, S.; Chen, N.; Tong, X.; Yang, N.; Liu, J.; Guo, X.; Tang, Z. Phytotoxicity assessment of dandelion exposed to microplastics using membership function value and integrated biological response index. Environ. Pollut. 2023, 333, 121933. [Google Scholar] [CrossRef]
- Liao, G.; Jiang, Z.; He, Y.; Zhong, M.; Huang, C.; Qu, X.; Xu, X. The Comprehensive Evaluation Analysis of the Fruit Quality in Actinidia eriantha Pollinated with Different Pollen Donors Based on the Membership Function Method. Erwerbs-Obstbau 2022, 64, 91–96. [Google Scholar] [CrossRef]
- Li, C.; Wang, X.; Zhang, D.; Chen, Y.; Jiang, X.; Ni, D. Study on the Variation Law of the Main Mechanical Properties in the Processing of Longjing Tea. Foods 2023, 12, 2587. [Google Scholar] [CrossRef]
- Yao, Z.L.; Sang, W.G.; Lin, M. Texture Properties of Sleeve-fish Chips with Different Water Content Using Texture Analyzer. J. Agric. Sci. Technol. 2010, 21, 272–273. [Google Scholar]
- Liu, L.; Wang, N.; Xu, L.; Yu, X.; Zhang, R.; Wang, T. A Novel Method of Determining Wax Cohesiveness by Using a Texture Analyzer. J. Texture Stud. 2016, 47, 161–166. [Google Scholar] [CrossRef]
- Toktam, M.M.; Seyed, M.R.; Ameneh, S.; Masoud, T. Predicting the moisture content and textural characteristics of roasted pistachio kernels using Vis/NIR reflectance spectroscopy and PLSR analysis. J. Food Meas. Charact 2018, 12, 346–355. [Google Scholar]
- Malik, F.; Nadeem, M.; Ainee, A.; Kanwal, R.; Sultan, M.; Iqbal, A.; Mahmoud, S.F.; Alshehry, G.A.; Al-Jumayi, H.A.; Algarni, E.H.A. Quality Evaluation of Lemon Cordial Stored at Different Times with Microwave Heating (Pasteurization). Sustainability 2022, 14, 1953. [Google Scholar] [CrossRef]
- Qiu, X.; Zhang, H.; Zhang, H.; Duan, C.; Xiong, B.; Wang, Z. Fruit textural characteristics of 23 plum (Prunus salicina Lindl)cultivars: Evaluation and cluster analysis. HortScience 2021, 56, 816–823. [Google Scholar] [CrossRef]
- Li, L.N.; Zhao, W.Q.; Zeng, X.Y.; Xue, S.; Huo, Y.Y.; Fang, Y.; Guo, Y.R. Correlation between texture and sensory evaluation of Apple. Food Mach. 2017, 33, 37–41, 45. [Google Scholar]
- Chen, Y.Q.; Niu, P. Correlation Analysis of Sensory Evaluation and Texture Characteristics of Dried Kiwifruit of Different Varieties under Hot Air Drying. Sci. Technol. Food Ind. 2024, 1–12. [Google Scholar] [CrossRef]
- Liu, T. Research on the Application of Factor Analysis Model. J. Phys. Conf. Ser. 1952, 042061. [Google Scholar] [CrossRef]
- Behera, G.; Sutar, P.P. Starch gelatinization and drying of paddy using microwave rotary drum dryer: Optimization, kinetics, and cooking studies. Dry. Technol. 2020, 39, 965–981. [Google Scholar] [CrossRef]
- Seeberger, P.H.; Tuck, O.T.; Sletten, E.T.; DangladFlores, J. Towards a Systematic Understanding of the Influence of Temperature on Glycosylation Reactions. Angew. Chem. 2022, 61, e202115433. [Google Scholar]
- Huang, Y.; Lin, J.J. Comparison of Drying Characteristics and Quality of Apple Crisps under Three Drying Methods. Mod. Food Sci. Technol. 2021, 37, 227–232. [Google Scholar]
- Alagbe, E.E.; Amlabu, Y.S.; Daniel, E.O.; Ojewumi, M.E. Effect of Varying Drying Temperature on the Soluble Sugar and Nutritional Content of Banana. Open J. Chem. Eng. 2020, 14, 11–16. [Google Scholar] [CrossRef]
- Gómez, H.C.; Villegas, M.; Velásquez, C.J.; Serpa, A.; Gómez, H.B.; Gañán, P.; Zuluaga, R. Effect of the drying temperature of cornhusk on glucose and fructose concentration to control the size distribution of silver nanoparticles. Mater. Res. Express 2019, 6, 065052. [Google Scholar] [CrossRef]
- Parul, B.; Asha, K. Effect of Pre-Treatments and Drying Air Temperature on the Quality of Dehydrated Oyster Mushroom (Pleurotus florida). Indian J. Nutr. Diet. 2019, 56, 34–39. [Google Scholar]
- Huang, Y.B. Research on Influence of Microwave Vacuum Drying on Drying Characteristics and Quality of Lemon Slice; Southwest University: Chongqing, China, 2017. [Google Scholar]
- Berit, K.M.; Kjersti, A.; Grete, S. Effect of temperature on stability of anthocyanins, ascorbic acid and color in strawberry and raspberry jams. Food Chem. 2020, 316, 126297. [Google Scholar]
- Wiset, L.; Poomsa-Ad, N.; Onsaard, W. Drying characteristics and quality evaluation in microwave-assisted hot air drying of cherry tomato. Eng. Appl. Sci. Res. 2021, 48, 724–731. [Google Scholar]
- Lewicki, P.P.; Michaluk, E. Drying of Tomato Pretreated with Calcium. Dry Technol. 2004, 22, 1813–1827. [Google Scholar] [CrossRef]
- Silvana, M.D.; Irigoyen, R.M.T.; Sergio, A.G. Vacuum drying of rosehip leathers: Modelling of coupled moisture content and temperature curves as a function of time with simultaneous time-varying ascorbic acid retention. J. Food Eng. 2018, 233, 9–16. [Google Scholar]
- Liu, Y.; Sabadash, S.; Duan, Z.H. Research of physicochemical properties and antioxidant activity of beetroots as affected by vacuum microwave drying conditions. Technol. Audit. Prod. Reserves 2021, 5, 40–45. [Google Scholar] [CrossRef]
- Deepa, N.; Charanjit, K.; Binoy, G.; Balraj, S.; Kapoor, H.C. Antioxidant constituents in some sweet pepper (Capsicum annuum L.) genotypes during maturity. LWT—Food Sci. Technol. 2005, 40, 121–129. [Google Scholar] [CrossRef]
- Sernikli, C.; Kadakal, C. Thermal degradation kinetics of ascorbic acid and some bcomplex vitamins in black mulberry (Morus nigra) juice. CBU J. Sci. 2020, 16, 379–386. [Google Scholar]
Disclaimer/Publisher’s Note: The statements, opinions and data contained in all publications are solely those of the individual author(s) and contributor(s) and not of MDPI and/or the editor(s). MDPI and/or the editor(s) disclaim responsibility for any injury to people or property resulting from any ideas, methods, instructions or products referred to in the content. |
© 2024 by the authors. Licensee MDPI, Basel, Switzerland. This article is an open access article distributed under the terms and conditions of the Creative Commons Attribution (CC BY) license (https://creativecommons.org/licenses/by/4.0/).