Article

Stability and Distribution of Rock Slope under Asymmetric Excavation

1
School of Civil and Resource Engineering, University of Science and Technology Beijing, Beijing 100083, China
2
Beijing Key Laboratory of Urban Underground Space Engineering, University of Science and Technology Beijing, Beijing 100083, China
3
Shenyang Research Institute of China Coal Science and Technology Group Co., Ltd., Fushun 113122, China
4
State Key Laboratory of Coal Mine Safety Technology, Fushun 113122, China
*
Authors to whom correspondence should be addressed.
Appl. Sci. 2024, 14(11), 4384; https://doi.org/10.3390/app14114384
Submission received: 14 April 2024 / Revised: 9 May 2024 / Accepted: 14 May 2024 / Published: 22 May 2024
(This article belongs to the Special Issue Smart Geotechnical Engineering)

Abstract

:
The asymmetric excavation unloading activity of a rock slope with a fault has an important influence on the stability of the slope and the division of the surrounding surface influence area. Based on the engineering background of the West Open-Pit Mine in Fushun City, orthogonal testing, K-means clustering, range analysis, and variance analysis were used to study the linkage mechanism of the asymmetric excavation unloading action and the weak structure in the rock slope, as well as their effects on slope stability and the influence area. This analysis showed that the significant factors affecting the stability zones of the north and south slopes were the excavation inclination angles of the opposite slopes. When the excavation inclination of the north slope increased by 10 degrees, the safety factors decreased by 25.9% and 16.6%. When the excavation inclination of the south slope increased by 10 degrees, the safety factors decreased by 13.7% and 1.9%. A second significant factor was the excavation depth. The occurrence of faults in the slope was the main factor affecting the range of slope instability. In order to ensure production safety, the excavation inclination angle of a slope with a fault should be limited to no more than 40°, and the excavation depth of an unstable area with two slopes should be designed to be no more than 450 m. The influence of asymmetric excavation unloading on the stability of a rock slope with a fault structure is expounded. This also provides a theoretical basis for controlling slope stability and influence areas in large-scale open-pit mining projects.

1. Introduction

In recent years, with the increase in the frequency and scale of open-pit mining activities, rock slope instability and other geological disasters have not been uncommon [1,2]. Due to the unreasonable mining methods of open-pit mines and the geological structures existing in the surrounding rock and soil bodies, the internal stress of the rock and soil bodies is redistributed, resulting in a series of geological disasters such as landslides, ground cracks, surrounding surface subsidence, and building destruction [3,4].
In view of the above problems faced by open-pit mining, a large number of scholars have carried out corresponding research. Bravo-Zapata, M.F. [5] studied the effects of geomechanical parameter values and slope geometry on the stability of a residual granite slope under dry and static conditions. Hu, B. [6] used laboratory experiments and numerical simulation to study the improvement of granite residual soil by fly ash under rainfall conditions and the stability of the slope. Wei, S.-W. [7] quantitatively studied the occurrence and development process of embankment slope erosion through similar model experiments, which provided a basis for the analysis of slope erosion stability. Wang, B. [8] studied the influence of plant roots on slope stability under different working conditions. Tang, J. [9] studied the influence of dry and wet cycling and vibration on the strength characteristics of granite residual soil, which provided a theoretical basis for slope stability analysis. Qu, M. [10] carried out fluid–structure coupling simulation of the unloading excavation of a high slope and described the failure mechanism of slope instability.
Zhang Haina [11] summarized the failure mechanism and mechanical model of block-bending composite dumping through centrifugal model tests and divided the influence area of a block-bending composite dumping slope through Matlab programming. Louise M. Vick [12] proposed a new slope instability mechanism based on the valley direction and the distance between the slope foot and the fault structure. Yun Zheng et al. [13] studied the failure mechanism of slope bending by introducing the transition coefficient of discontinuity and the failure surface. Using an analytical solution, Hadi Haghgouei [14] proved that rock pillars inside a slope cause circular shear failure in the soil mass or weak rock mass below and showed that the instability failure of a slope is related to the geometric shapes of rock pillars and the normalized column distance. Zhong Shuheng [15] studied the influence of the dip angle and buried depth of a weak interlayer on slope stability using the limit equilibrium method and clarified their influence mechanism. Da Zheng [16] analyzed the dumping deformation in front of the dam of the Gushui Hydropower Station on the southwest Lancang River and used an indoor centrifugal simulation experiment to reveal the influence of different free-surface conditions on the deep slope dumping deformation. Zhang Biao et al. [17] studied the influence of slope foot size on slope stability under a unilateral slope. Gao Anqi et al. [18] obtained the surface deformation rule of a slope-affected area through a detailed investigation of buildings in the urban area around the Fushun West Open-Pit Mine, a comprehensive analysis of urban geological conditions, surface monitoring data, and numerical simulation. Based on the indoor 60 min simulated rainfall test, Tian, H. [19] found that the rainfall intensity and slope are two key factors that determine slope velocity and summarized the functional relationship between them.
Based on the cusp mutation theory, Chen Quanchuan [20] used orthogonal tests to study the degree of influence of physical and mechanical properties of weak interlayers on slope stability. Jin Peng et al. [21] found through an analysis of factors that influence disasters that there is a chain relationship with homology and mutual causality between landslides and ground fractures and that the main factors affecting the occurrence of geological disasters in mining areas are the geological structure and control of bad engineering geological environments, the driving of mining activities, and the induction of rainfall and groundwater factors. Tian, Y. [22] conducted a comprehensive analysis of slope stability based on the aspects of failure mode, displacement, movement trajectory, stress, and strain using the three-dimensional fluid–structure coupling method (particle flow code).
Most scholars’ studies on slopes only focus on the unloading action of unilateral slope excavation or only consider the influence of fault structure on slope stability, and there are no relevant studies that consider the unloading action of asymmetric excavation on the stability of slopes with different fault occurrences and the division of surrounding affected areas. Based on the research background of the West Open-Pit Mine in Fushun City, Liaoning Province, this paper analyzed the influence of asymmetric excavation unloading on the stability and influence area of the West Open-Pit slope by numerical simulation. An orthogonal experiment was used to study the influence of different mining methods and geological structures on slope stability and the distribution of affected areas in the open-pit mining area.

2. Mining Analysis of Fushun West Open Pit

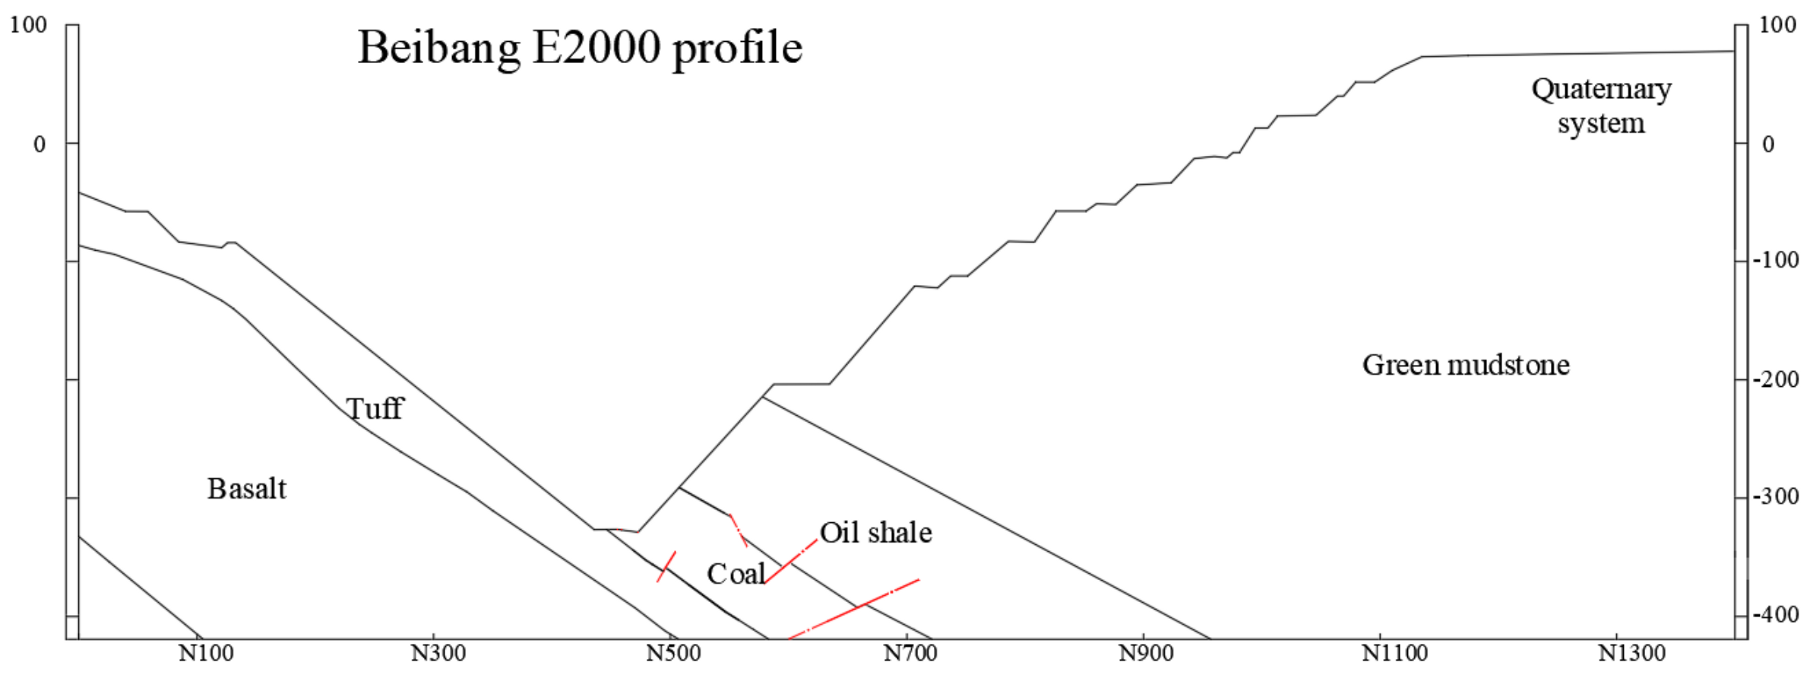
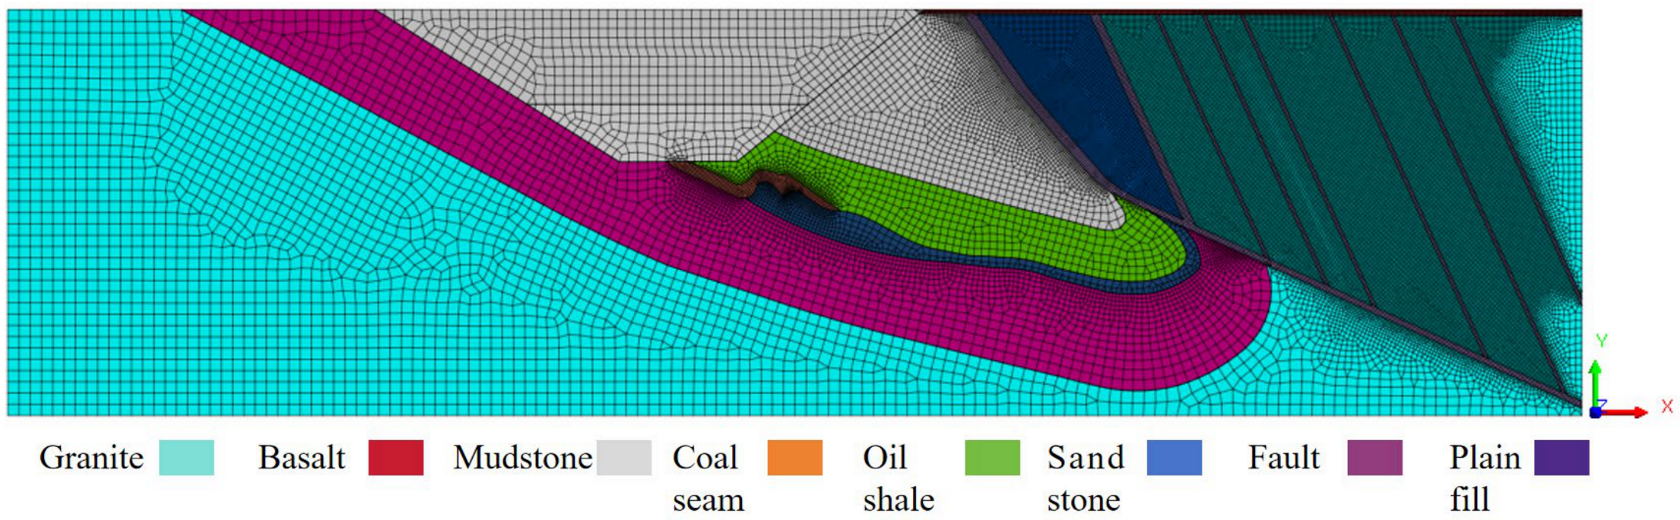
2.1. Distribution of Rock Strata and Structure in Fushun West Open Pit and Its Surrounding Area

The Fushun West Open-Pit Mine is located in the transition zone between the Songliao Plain in the west and a hilly and low mountainous area in the east. The original terrain of the mine was relatively flat. The southern part of the West Open-Pit Mine is composed of Paleogene Paleocene strata, including the Huotai Formation and the Lizigou Formation. The Huotai Formation is mainly composed of graying black basalt, the B coal Formation, and multiple layers of mudstone, sandstone, and tuff, while the Lizigou Formation is mainly composed of a tuff layer. The strata forming the northern part of the West Open Pit are the Guchengzi Formation, Archean granite gneiss, and the Lower Cretaceous Longfengkan Formation. The Guchengzi Formation is mainly composed of a coal seam, brown oil shale, and green mudstone. The upper part of the Lower Cretaceous Longfengkan Formation is composed of tuffaceous sand shale, while the middle and lower parts are mainly composed of a conglomerate and sandstone.
There are three types of structures around the West Open-Pit Mine: fault structures, fold structures, and joint structures. The faults on the north side of the West Open-Pit Mine are mainly F1, the main fault of the Hunhe fault, and F1a, the secondary fault of F1, both of which are compression–torsion reverse faults. The F1 fault formed a traction compound syncline on the north side of the West Open Pit under the influence of strong right-handed compressional and torsional dislocation in the early Tertiary period. Fault structures are mainly distributed in the western and central parts of the north side. In the eastern part, mainly fractures have developed, there is no large structure development, the geological conditions are relatively simple, and all of the fractures are exposed in a monoclinal formation.

2.2. Rock Mechanics Parameters and Slope Stability Analysis Method

Based on the mining data of the West Open-Pit Mine in Fushun, the actual excavation conditions of part of a section of the West Open Pit were simulated. The constitutive model of the rock and soil layer was a Mohr–Coulomb model, and the physical and mechanical parameters referred to the doctoral thesis of Zhan, Y [23], as shown in Table 1.
In order to analyze the influence of mining activities on the stability of the open-pit slope, the strength reduction analysis method inherent in Midas GTS NX was used, and the strength parameters of the rock and soil mass, namely cohesion and the internal friction angle, were continuously reduced until the rock and soil mass was destroyed. The final reduction ratio was the slope stability coefficient. The calculation formula was as follows:
c ¯ = c F s
φ ¯ = arctan tan φ F s
where c and c ¯ represent the cohesion of the rock and soil mass before and after the strength reduction, respectively, and φ and φ ¯ represent the internal friction angles of the rock and soil before and after the strength reduction, respectively. F s indicates the safety factor.
When calculating the slope stability coefficient of the model, the Mohr–Coulomb strength criterion was used to judge the failure of the rock and soil mass; that is, the cohesive force and internal friction angle of the rock and soil mass were the factors that determined its shear failure. The calculation results are shown in Equation (3). When the shear stress exceeded the shear stress controlled by the cohesive force and the internal friction angle of the rock and soil mass, the rock and soil mass of the slope would have shear failure.
f s = σ 1 σ 3 1 + sin φ 1 sin φ 2 c 1 + sin φ 1 sin φ
where f s is the shear stress and σ 1 and σ 3 are the maximum and small principal stress values.

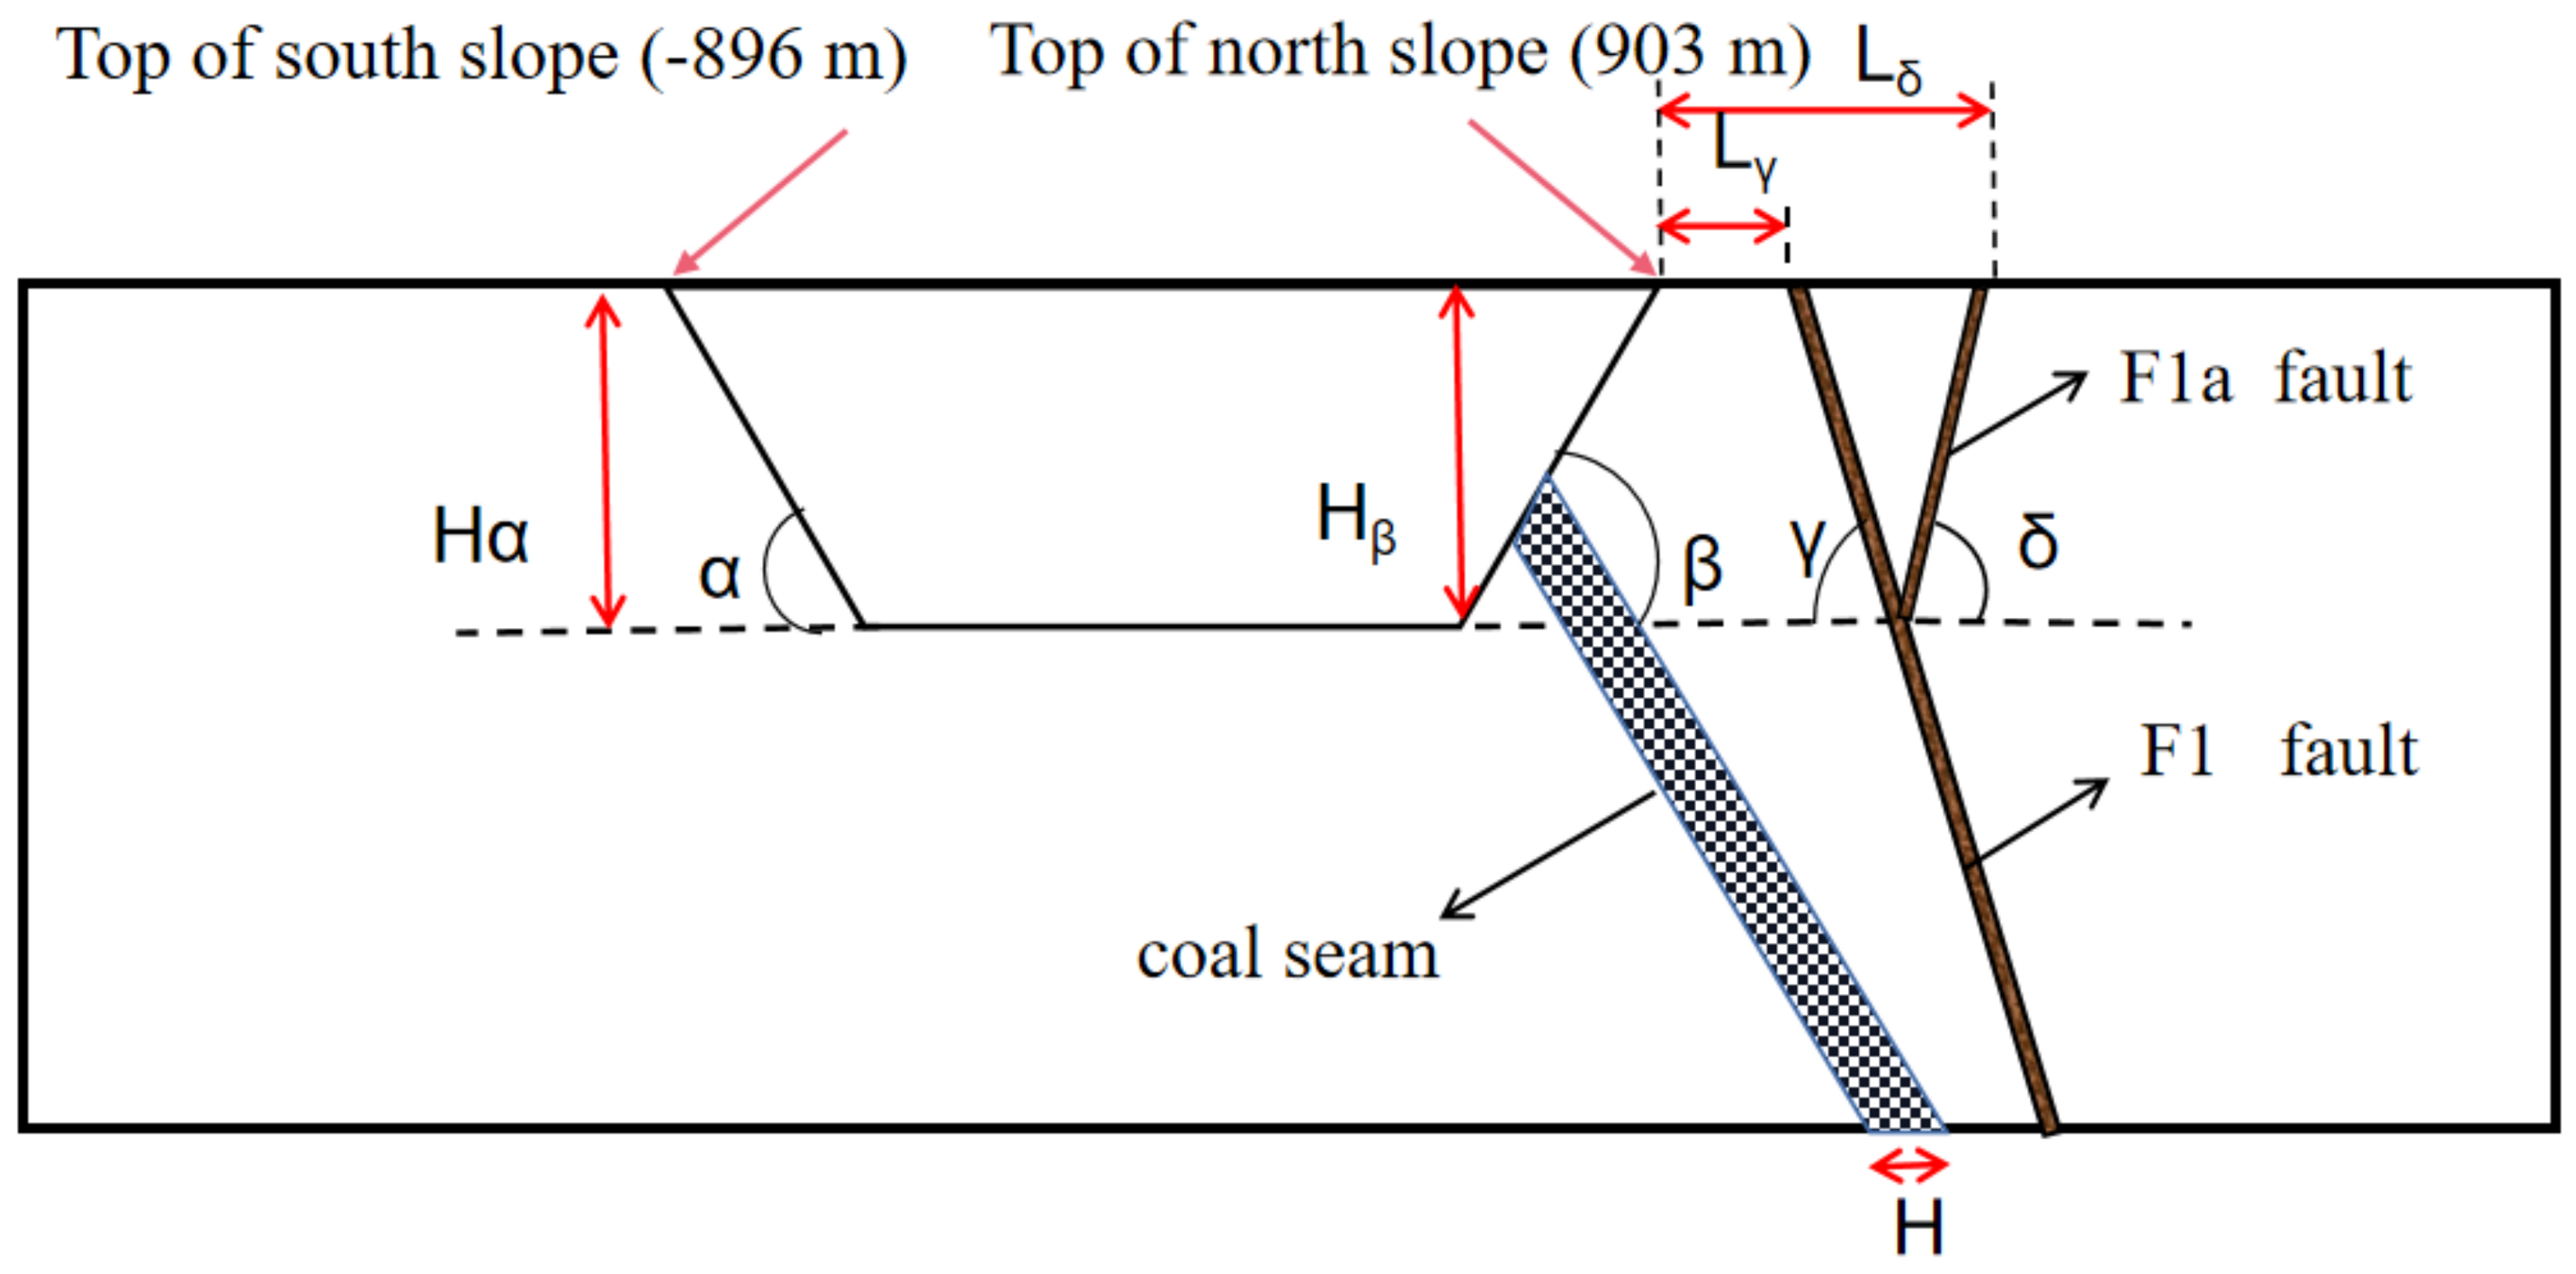
2.3. Asymmetric Excavation and Fault Impact Analysis

Based on the fault occurrence studied in reference [23] and the E2000 profile of the West Open Pit shown in Figure 1, a two-dimensional numerical model of the E2000 profile was established, as shown in Figure 2. The model is 4200 m long and 1100 m wide. Since the West Open Pit contains a tectonic area with folds and faults, there is often a large amount of horizontal tectonic stress. Therefore, a certain horizontal tectonic stress was applied in the X direction, the magnitude of which was 1.5 times that in the direction of the self-weight stress [23]. By setting the construction stage, the corresponding grid group was passivated and activated to simulate the excavation and backfill mining of the Fushun West Open Pit.
By monitoring the surface subsidence and southward deformation of W200-E3200 on the north side of the Fushun West Open Pit (Figure 3), it was seen that the subsidence and southward deformation at the E300 and E500 profiles were more serious than those at the other profiles. At the same time, the subsidence and southward deformation from profile E1800 to profile E3200 tended to be stable, and the subsidence and southward deformation of profile E2000 changed more seriously in this interval. By September 2023, a backfill mining treatment of E2000 was being carried out in the Fushun West Open-Pit Mine. The E2000 section was in the middle of the whole West Open-Pit Mine, and the geological conditions were representative to a certain extent. To sum up, four representative profiles, E200, E400, E2000, and E3200, were selected. Based on Table 2 and the geological profile, a two-dimensional excavation model was established to obtain the surface horizontal displacement, vertical displacement, and slope stability coefficient on the north side of the above profile.
Figure 4 shows the variation curves of the surface horizontal and vertical displacements on the north side of the West Open-Pit Mine with the distances from the top of the slope at the position of the E2000 profile in the numerical simulation in this paper and in the literature [23]. The horizontal displacement of the surface on the north side of the West Open Pit shows a tendency to dump into the pit. Gradually moving away from the top of the slope, the horizontal displacement of the surface of the north slope shows a gradual decreasing trend, and a sudden change occurs at the position of the F1 fault and F1a fault. After that, although there is a stepped change phenomenon at the position of the small fault, the amplitude is not large and the whole slope tends to be stable. In the vertical displacement diagram, it can be seen that the surface uplift changes before the F1 fault, while the surface displacement after the main F1 fault is dominated by subsidence. The displacement changes significantly between the two faults, with a large change rate. After that, the subsidence shows the same change trend as the horizontal displacement. By comparing the dispositions of the merged and unmerged northern faults in the E2000 section, we can see that the two main faults have a blocking effect on the surface displacement of the northern faults. The main reason for this phenomenon is that due to the poor integrity of the reverse fault, the internal stress of the rock and soil body changes under the action of excavation unloading, and deformation disharmony occurs among different structures divided by the fault, resulting in deformation mutation.
Figure 5 and Figure 6 show the displacement cloud maps at E200, E400, E2000, and E3200 and the surface displacement line map of the north slope, respectively. With the increase in the position of the F1 and F1a faults from the top of the slope and the change in the dip angle, the transverse and vertical displacement values of the surface of the north slope increase as a whole. By comparing the horizontal displacement between E2000 and the three other sections, it can be seen that the distance between the F1 fault and the top of the slope has a great influence on the surface deformation of the north slope of the open pit. The occurrence of the F1 and F1a faults and the distance between the two main faults and the top of the slope have an important influence on the slope stability of the West Open-Pit Mine.

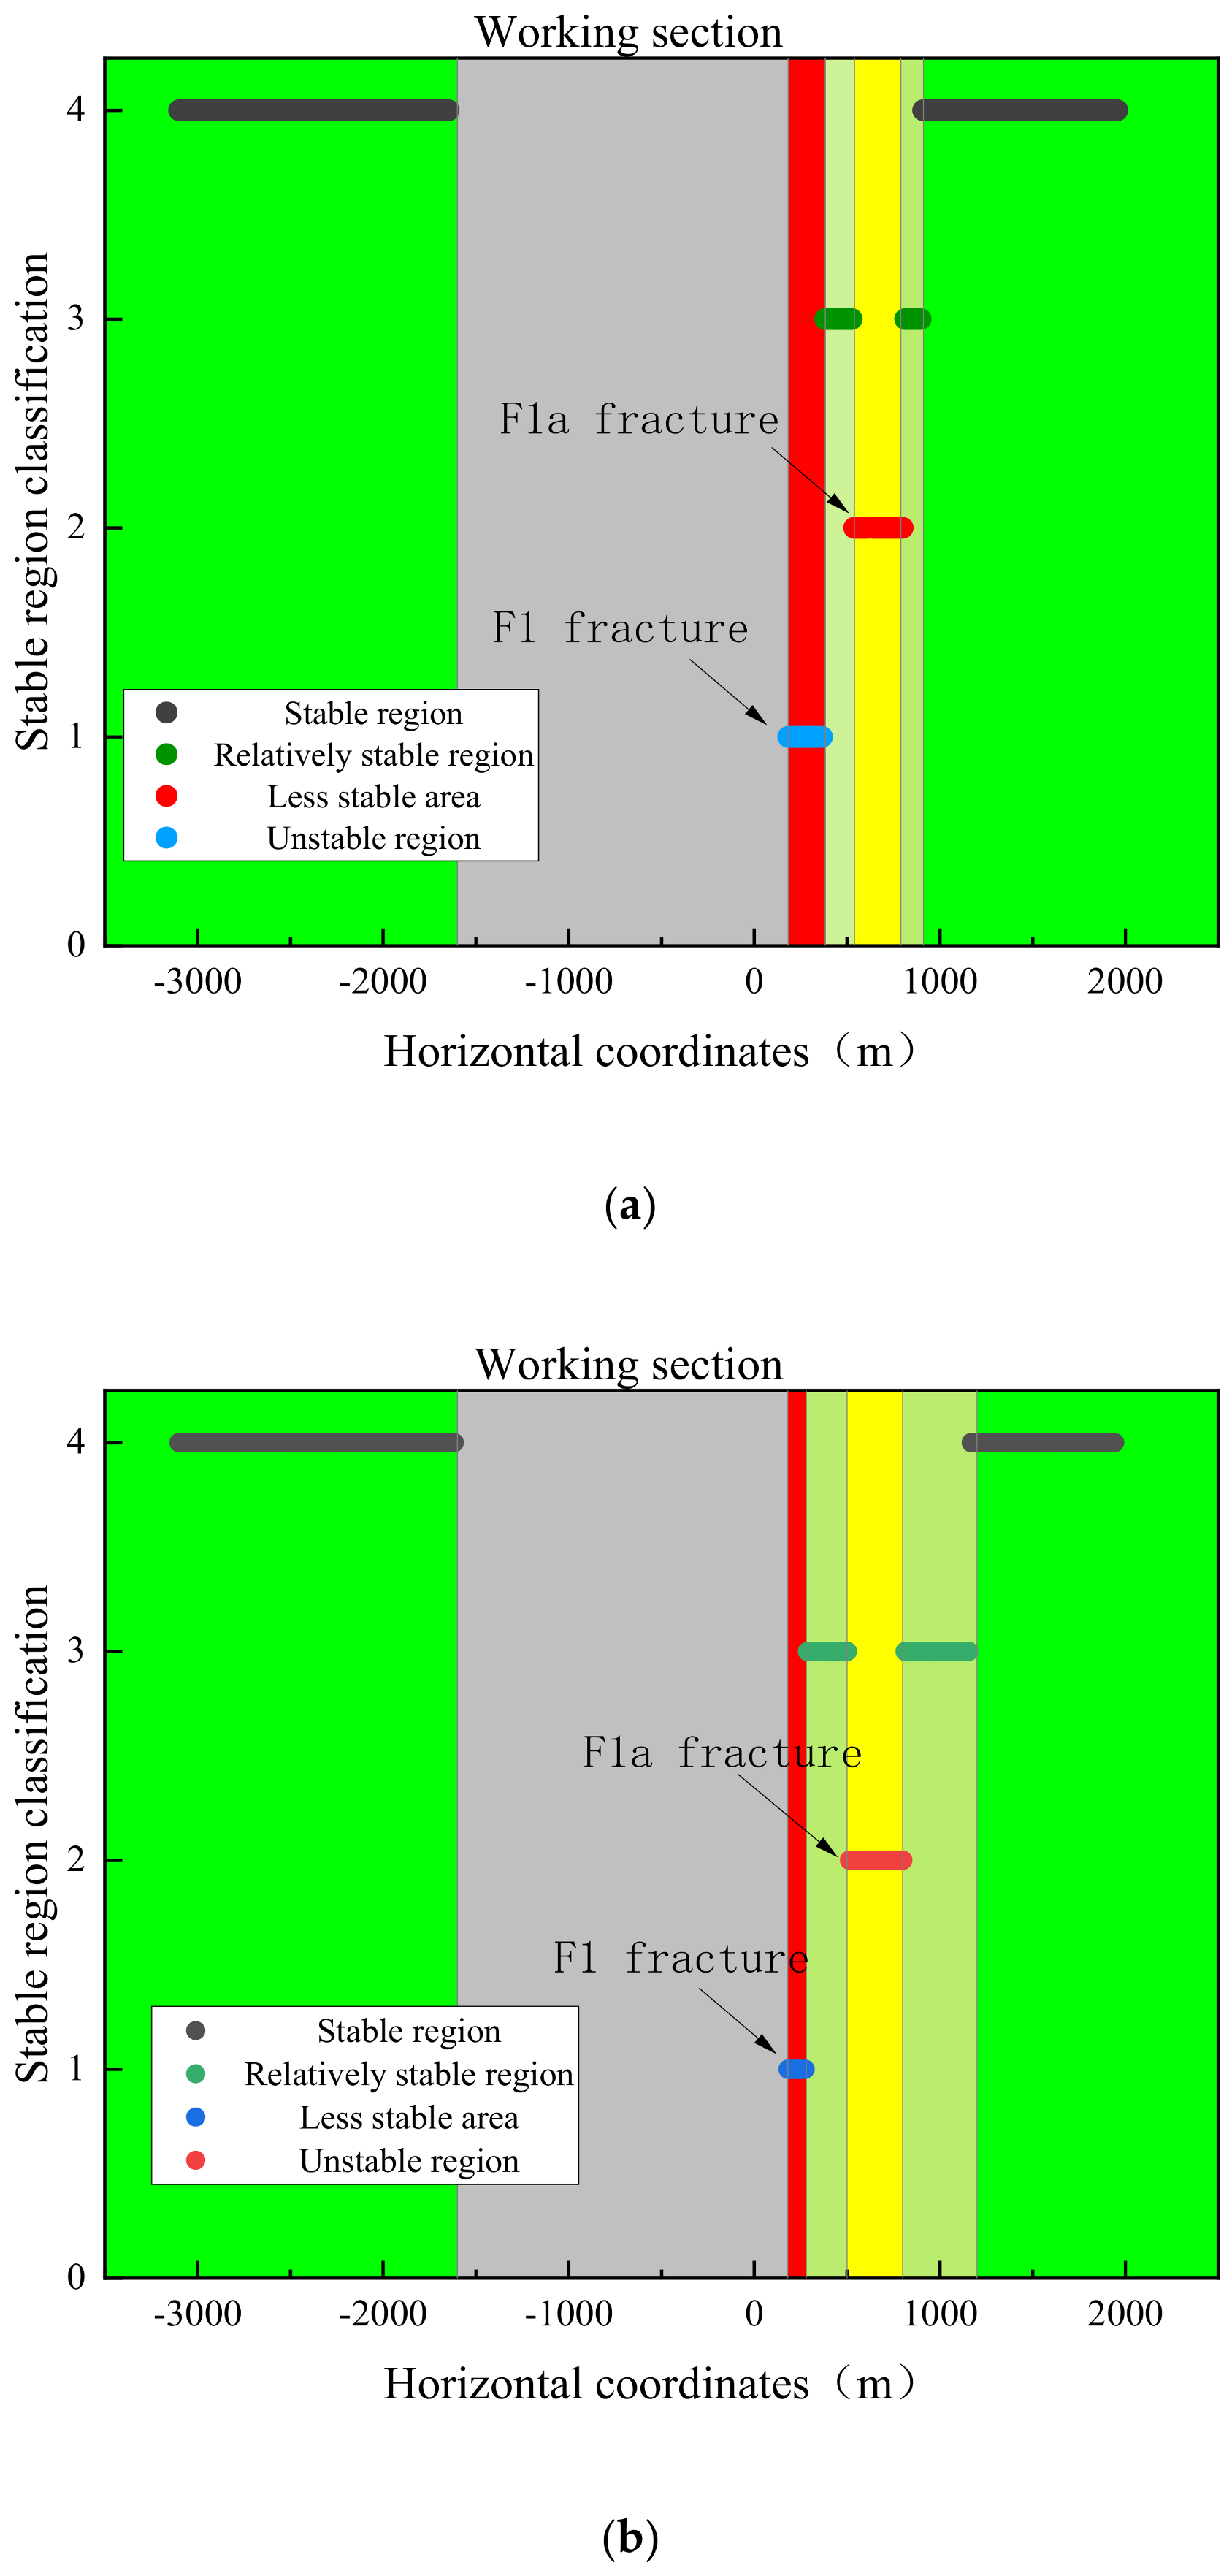
2.4. Division of Slope Influence Zone

The K-means clustering algorithm is an iterative repositioning algorithm. This algorithm iteratively calculates the distances between each sample point and divides the corresponding sample points into the nearest clusters to complete the initial clustering. The next step is to recalculate the location of each center and divide the nearest sample points into the corresponding clusters again, iterating successively until the clustering center does not change.
First, this algorithm randomly selects K initial clustering centers from the given data set, calculates the Euclidean distances of all sample points using formula 4 [24], and classifies the corresponding sample points into the corresponding clusters according to the classification principle of the nearest distance. According to formula 5 [25], the average distance between the sample points of each cluster class is calculated. Then, the cluster class center in each cluster is obtained by iterative calculation. The sum of squares of the errors in each cluster is calculated by formula 6 [26] to represent the density of the sample points in each cluster and to judge the clustering degree.
d x i , x j = i j , i , j n x i x j 2
where d x i , x j represents the Euclidean distance between sample points x i and x j , x i = x i 1 , x i 2 , , x i p and x j = x j 1 , x j 2 , , x j p are any two sample points whose dimensions are equal to p , and x i p represents the specific value of sample point i corresponding to the p dimension.
Euclidean distance is a measure of the distance between two sample points ( x i and x j ). The shorter the distance between two sample points, the more similar the two sample points are. Conversely, the longer the distance, the less similar the two sample points are.
M e a n D i s t E = 1 C n 2 i = 1 n j = 1 i d x i , x j
where n is the number of sample points in data set E , C n 2 is all optional combinations of n randomly selected sample points at the sample point, and d x i , x j represents the Euclidean distance between sample points x i and x j .
S S E = i = 1 k x c i   d x , c i 2
where k is the number of clusters, c i is the i cluster center of the C i cluster, and d x , c i represents the degree of x difference with c i . S S E is the size of the sum of squares of the error, which can represent the density of the sample points.
According to the field survey results of Gao Anqi et al. [18] and the classification of building damage disasters, it could be seen that the areas on the north and south sides affected by the open-pit mining could be divided into four parts. Based on this, this paper extracted the E200 and E2000 profiles in Section 2.2 to numerically simulate the total surface displacement, vertical displacement, horizontal displacement, maximum shear stress, effective stress, and effective plastic strain on the north and south sides of each grid. At the same time, the horizontal coordinates of the corresponding grid were taken as labels, and the six physical and mechanical indexes above were normalized and analyzed by formula 7 [27]. K-means clustering analysis was performed to obtain a clustering diagram of the E200 and E2000 profile positions, as shown in Figure 7. According to the cluster map, the surfaces of the north and south sides of the E200 and E2000 profiles were divided into four regions: two stable regions and two unstable regions. A schematic diagram of the divided areas is shown in Figure 8.
x = x x min x max x min
where x max is the maximum value in the sample data, x min is the minimum value in the sample data, and x is the linear mapping between 0 , 1 and the original data.

3. Study on the Stability of a Rock Slope and Its Influence Area Distribution

3.1. Scheme Design and Experimental Results
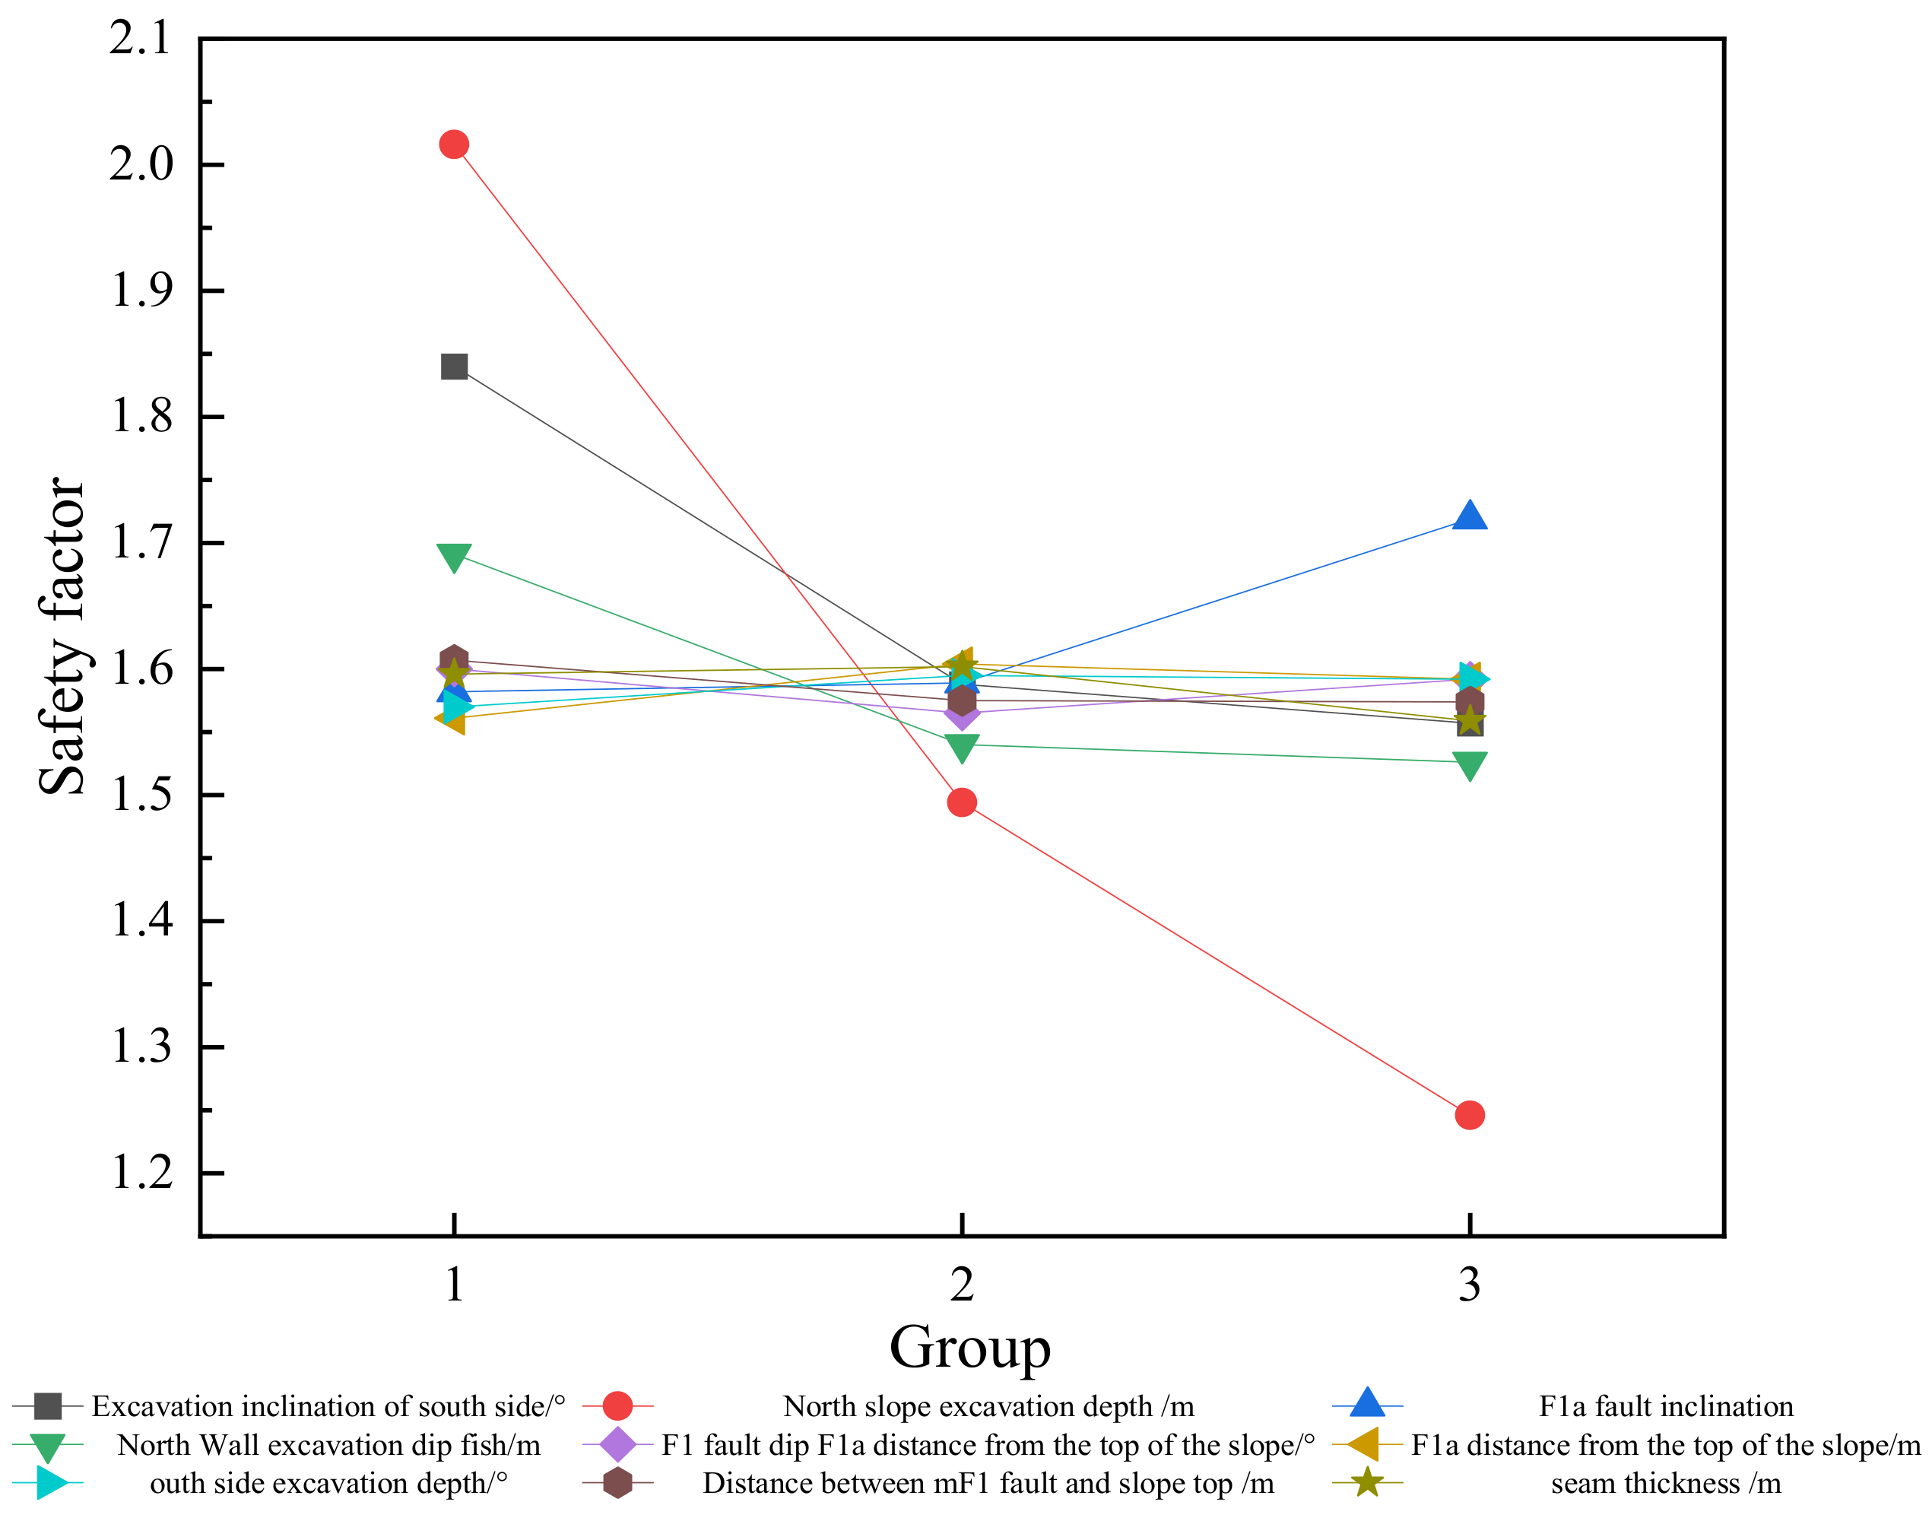
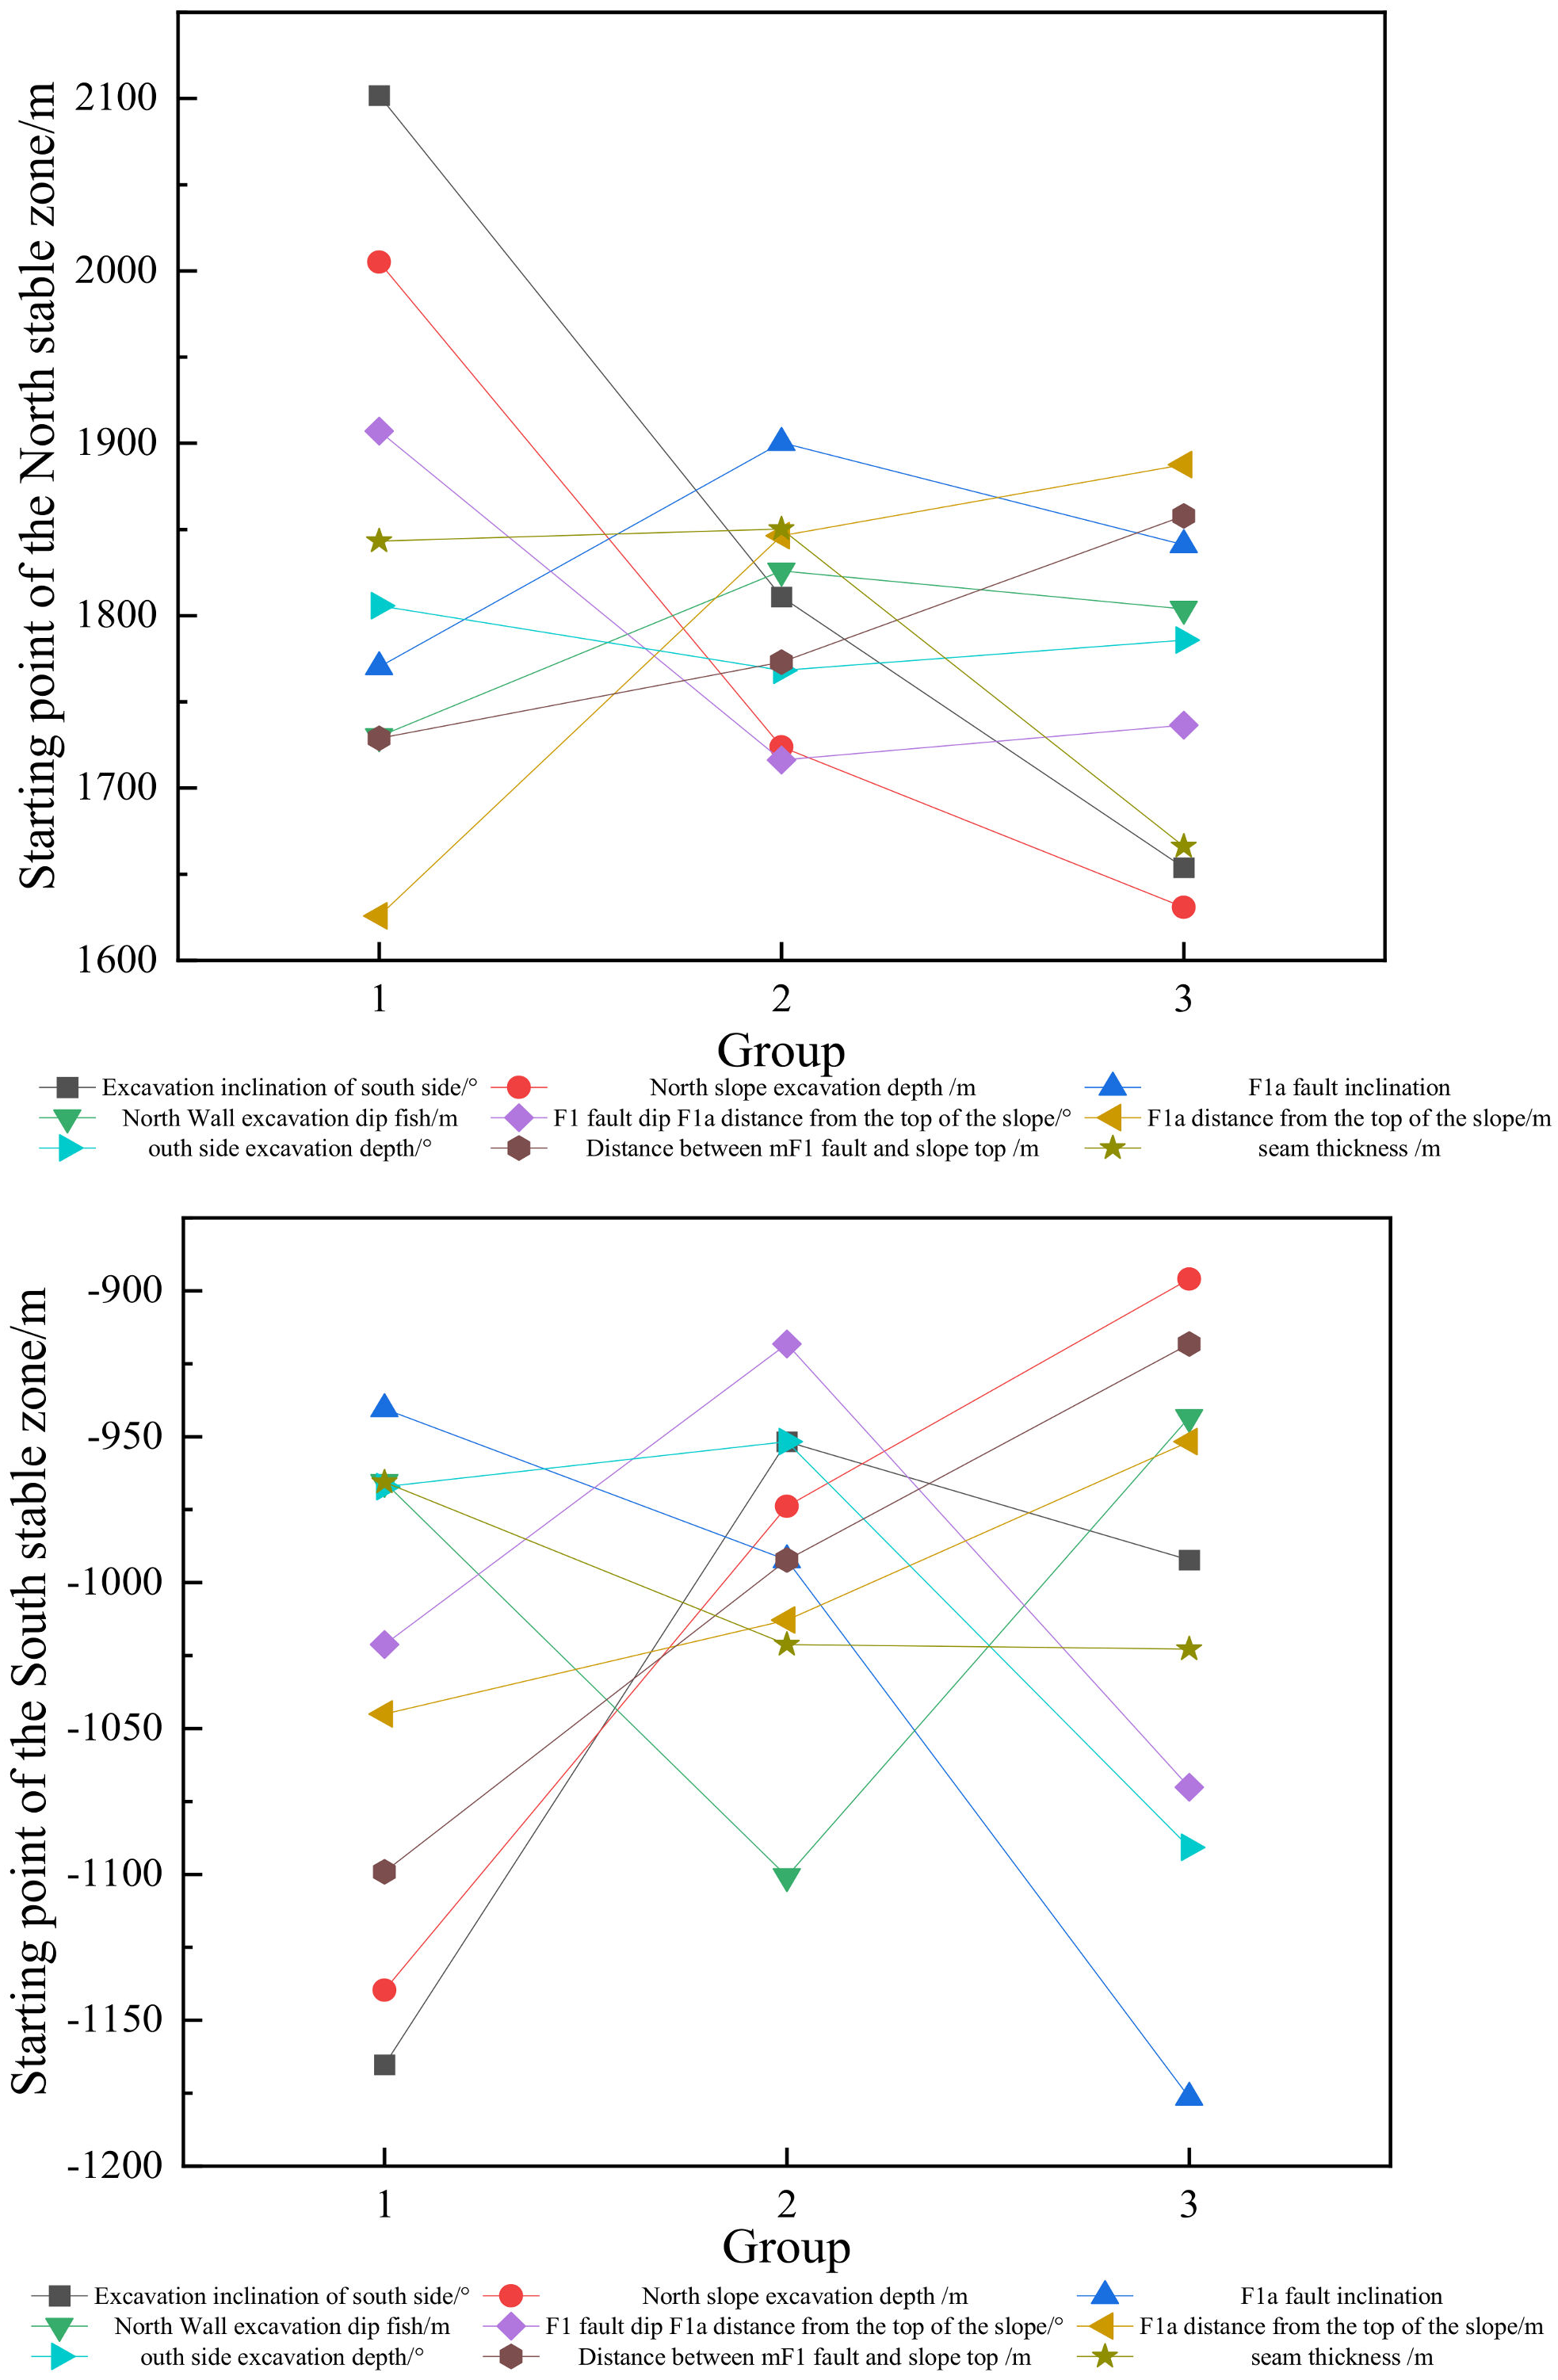
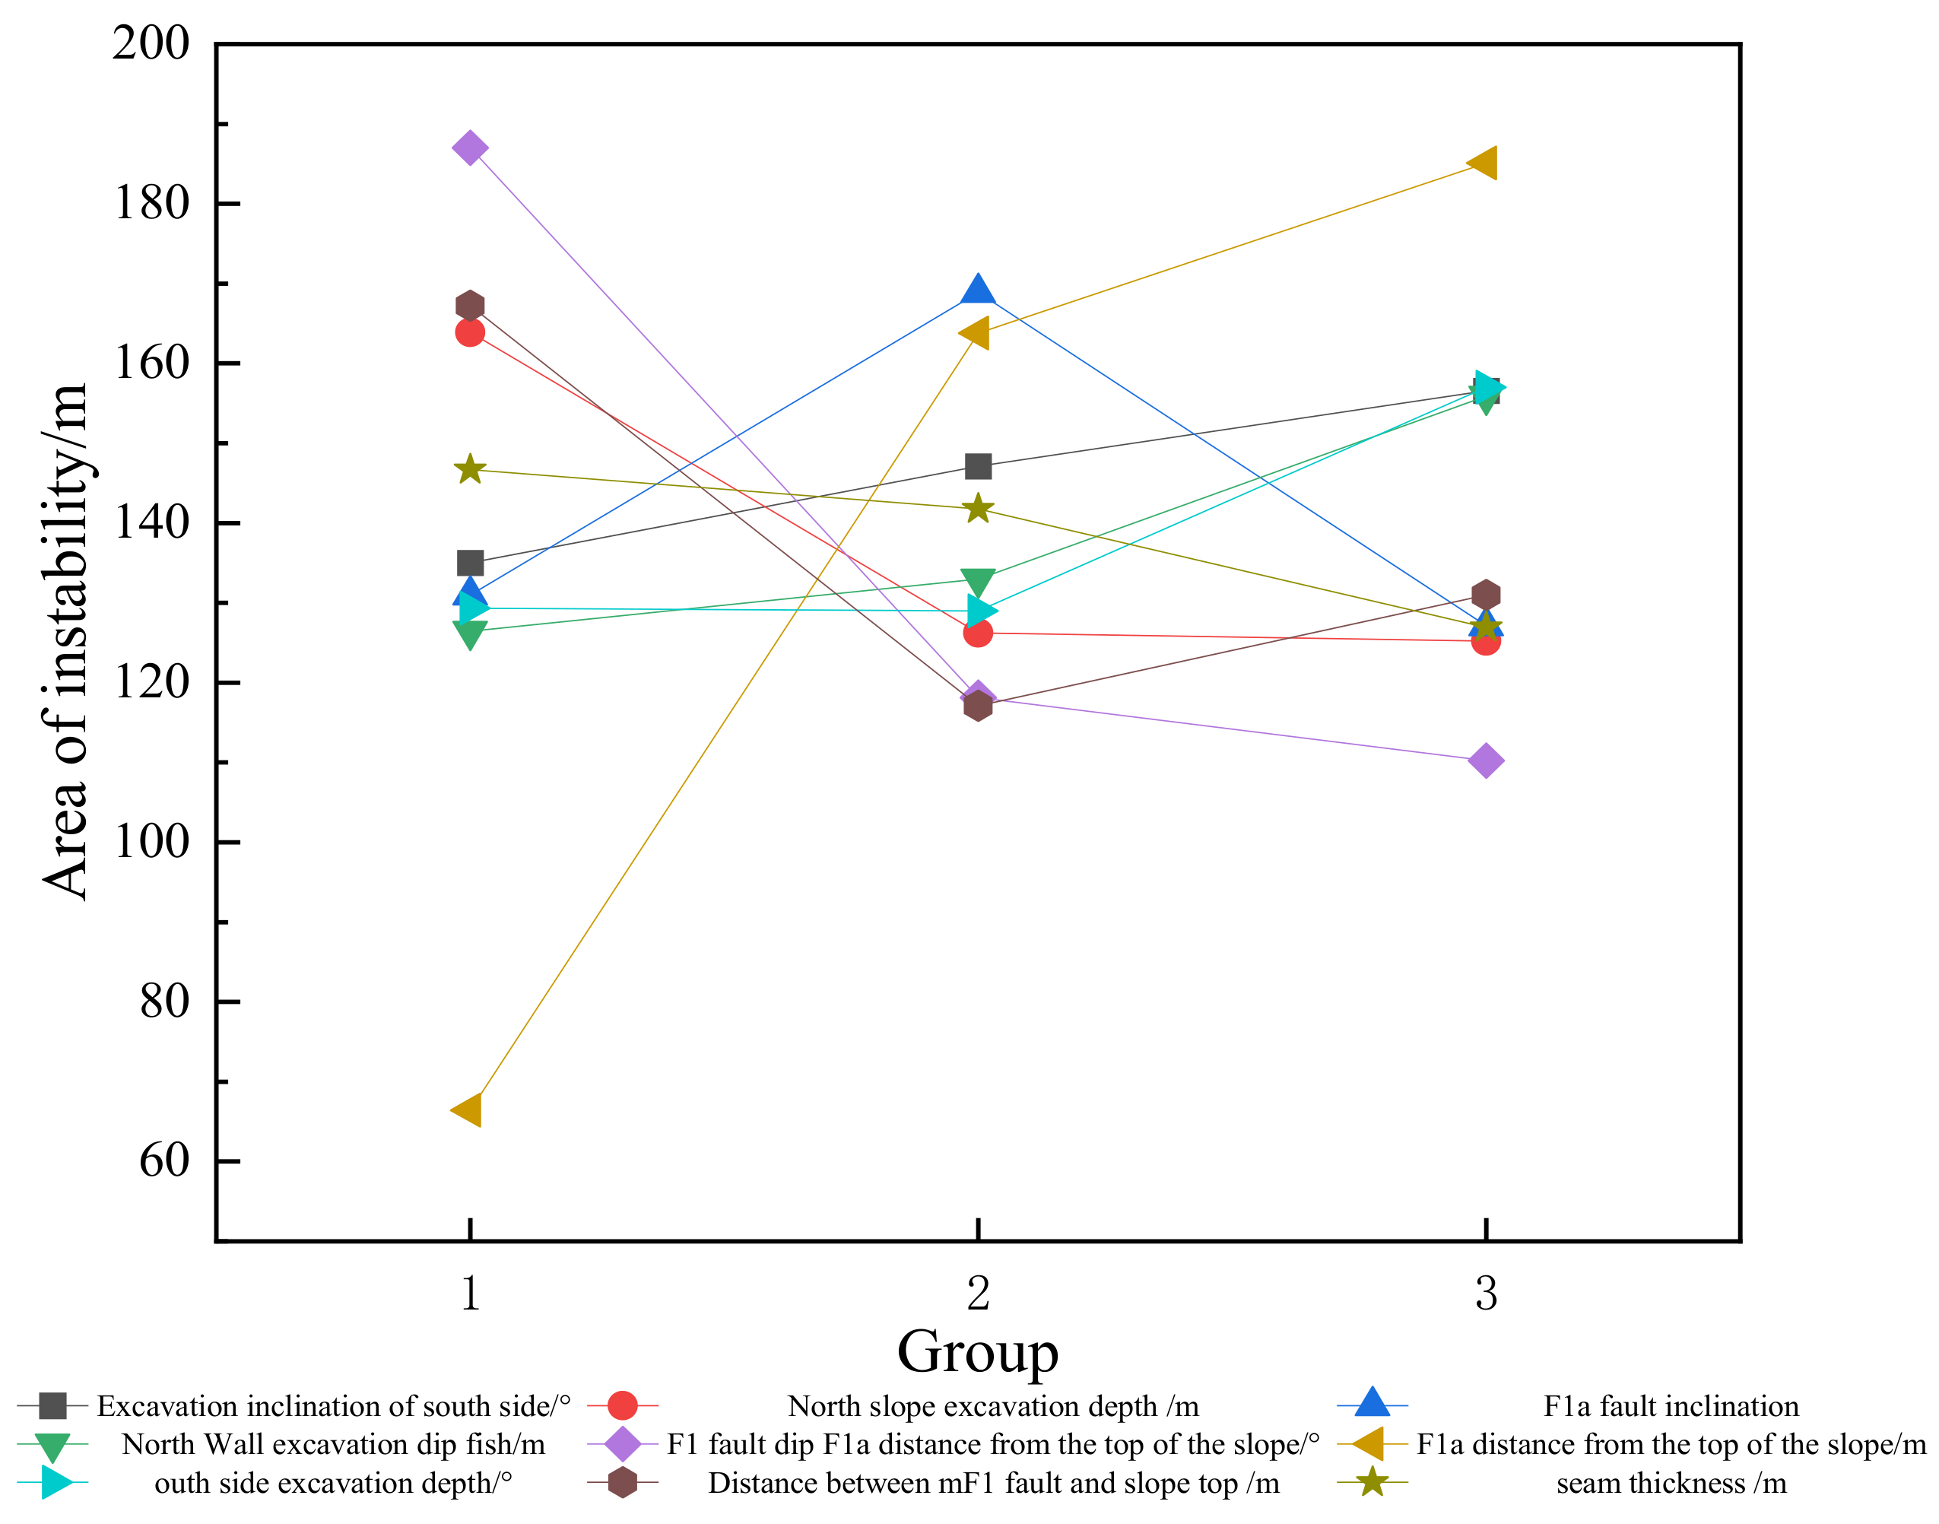
Based on the analysis in Section 2, orthogonal experiments were used to explore the influence of the excavation dip angle and depth of the south slope, the excavation dip angle and depth of the north slope, seam thickness, the occurrence of F1 and F1a faults, and the distance from the top of the slope on open-pit slope stability and the surrounding affected areas, representing a total of nine factors. Through statistical analysis of the mining methods and existing fault occurrences in each section of the West Open-Pit Mine, based on the research contents and results of Tang, J [9] and Qu, M et al. [10], three factors, the maximum, minimum, and average, were taken as the horizontal variables for each factor, and a total of 27 groups of experiments were carried out. The specific experimental scheme is shown in Table 3, and a model diagram is shown in Figure 9.
The analysis methods in Section 2.1 and Section 2.3 were used to obtain the stability coefficients of the rock slopes and the division ranges of the affected areas under 27 different excavation conditions with different fault structures. The starting points of the stable areas and the widths of the unstable areas were extracted from the surfaces of the north and south slopes, as shown in Table 4. The top of the south slope was located at the horizontal position coordinate −896 m. The top of the north slope was located at 903 m.

3.2. Range Analysis

In reference [28], the safety factors, the starting points of the stable areas on the north and south sides of the surfaces, and the widths of the unstable areas in the 27 models were analyzed according to formula 8 and formula 9, and the results are shown in Table 5. Using the results of the range analysis, the influence trends of different factors on the safety factor, the starting points of the stable areas on the north and south sides of the surface, and the range of the unstable area were drawn, as shown in Figure 8.
A range analysis identifies the difference between the maximum value and the minimum value for each factor level, which indicates the influence of each factor on the performance at different levels. The calculation formula is as follows:
B ij = m = 1 n K i j , m n
where K i j , m is the m th calculation result of factor i at level j and n is the horizontal number.
R i represents the difference between the maximum and minimum values at each level ( B i j ):
R i = max B i j min B i j
According to the range analysis results in Table 5, it can be seen that among the nine factors, the open-pit mining method had the greatest influence on the safety factor. The order of influence was as follows: excavation inclination of the north slope > excavation inclination of the south slope > excavation depth of the north slope > excavation depth of the south slope. The main influence range of the starting point of the south slope was as follows: north slope > south slope > north slope > north slope. The main influence range of the stability point of the north slope was as follows: excavation inclination of the south slope > excavation inclination of the north slope > distance between the F1 fault and the top of the slope > F1 fault inclination > coal seam thickness. The main influencing sequence of the instability range was as follows: distance between the F1 fault and the top of the slope > F1 fault dip angle > distance between the F1a fault and the top of the slope > southern excavation depth. Figure 10 shows the influence trends of nine factors on the safety factor, the starting points of the stable areas on the north and south surfaces, and the extent of the unstable area. With an increase in the north-slope excavation inclination, the decreasing trend of the safety factor increased clearly. When the north-slope excavation inclination increased by 10 degrees, the safety factor decreased by 25.9% or 16.6%. When the excavation inclination of the south slope increased by 10 degrees, the safety factor decreased by 13.7% or 1.9%. Changing the other factors had little influence on the overall open-pit excavation and led to almost no change in the safety factor.
Increases in the excavation inclination of the north slope and the distances of the F1 and F1a faults from the top of the slope had positive effects on the expansion of the stable zone of the south slope. With an increase in the excavation inclination of the north slope, the range of the stable zone of the south slope showed an increasing trend, and the range width increased by 14.6% or 8%. This was because with the changes in the three factors above, the rock and soil area south of the fault position of the north slope formed a unit, and the influence of the change in internal stress caused by the excavation decreased overall. The starting point of the stable area of the south slope gradually moved closer to the top of the south slope and expanded the scope of the stable area of the south slope. With increases in the excavation depth on the south side and the thickness of the coal seam on the north side, the range of the stable zone on the south side decreased. With an increase in the excavation depth, the initial position of the stable zone on the south side gradually moved southward, and the movement ranges were 5.5% and 18.6%. With an increase in the excavation depth on the south side, the soil mass of the slope produced an excavation unloading effect and the internal stress of the rock and soil layer was released. Large amounts of structural stress were generated, which increased the size of the unstable region. The north seam was equivalent to a weak structure, which had an adverse effect on the integrity of the open pit. With an increase in the excavation inclination angle on the south slope, the range of the stable zone on the south slope changed from small to large and then to small.
With increases in excavation inclination in the south and the north, the stable point in the north shifted to the south; that is, the range of the stable zone in the north gradually increased. An increase in the excavation inclination on the south side made the position of the stability point on the north side move 13.8% or 8.7% to the south, and an increase in the excavation inclination on the north side made the position of the stability point move 14% or 5.4% to the south. As the positions of the F1 and F1a faults gradually shifted to the north, the stable points of the north slope also moved to the north, and the range of instability gradually increased. This was because the two main faults divided the rock mass on the north side and reduce its integrity. As a result, the stress transfer in the slope of the open-pit ore body was uneven, the ground stress and surface displacement changed greatly, and the starting point of the stable area shifted to the north during the mining activities.
With an increase in the distance of the F1 fault from the top of the slope, the range of the unstable area on the north side of the open pit gradually increased, and the growth amplitude was 146% or 178%. However, with an increase in the F1 fault dip, the range of the instability zone gradually decreased, and the reduction amplitude was 36.8% or 41.1%. The main reason for this phenomenon was that with an increase in the dip value of the F1 fault, the unstable triangular structure located between the two main faults had a small and decreasing tendency to fall forward. Moreover, with an increase in the dip value on the north side, the rock and soil mass in front of the F1 fault played the role of a “retaining wall” that could effectively resist the unstable triangular structure’s tendency to fall forward.

3.3. Analysis of Variance

Combined with the results of the four factors in Table 5, a variance analysis was carried out to reveal the significant factors affecting the safety factor of open-pit mining and the range of the surface stability area.
According to the difference analysis results in Table 6, for the safety factor, the significance level values of influencing factors A, B, and D were far less than 0.05, indicating that the depth and angle of excavation on the north side and the angle of excavation on the south side were significant factors affecting the safety factor of the slope, while the other six influencing factors had less significant effects on the safety factor of the slope. For the starting point of the stable area of the south slope, the significance level values of influencing factors B and C were less than 0.05, indicating that the depth of excavation on the south slope and the excavation angle on the north slope were significant factors affecting the starting point of the stable area of the south slope, while the other seven influencing factors had less significant effects on the starting point of the stable area of the south slope. For the starting point of the stability zone of the north slope, the significance level values of influencing factors A and B were less than 0.05. The excavation angles of the north and south slopes were significant factors affecting the starting point of the stability zone of the north slope, while the other five influencing factors had less significant effects on the starting point of the stability zone of the north slope. For the range of the stable region, the significance level values of influencing factors E and F were less than 0.05, indicating that the factors affecting the range of the stable region were the F1 fault dip value and the F1 fault distance from the top of the slope, while the other seven factors were not significant influencing factors.

4. Discussion

  • Although this paper studied the influence of open-pit mining design and geological structure on the stability of an open-pit slope and the scope of the surrounding influence zone with an orthogonal experiment, it did not discuss the influence mechanisms of these nine factors, which will require similar model experiments in the future.
  • Open-pit mines are located in special geographical locations. There are large numbers of geological structures around, and open-pit mining is a long process. In the numerical analysis, the Mohr–Coulomb constitutive model adopted in this paper did not consider the creep effect caused by time to the geological structure around the open pit. In a subsequent study, the author will use a constitutive equation that is consistent with the creep effect of shallow strata to analyze the safety factor and the range of the stable zone of the open-pit slope under asymmetric unloading.

5. Conclusions

  • Due to the influence of the surrounding geological structure, the significant influencing factors affecting the initial position of the south slope were mainly the excavation dip angle and excavation depth of the north slope, and the influence of the excavation dip angle of the north slope was greater than that of the excavation depth of the south slope. When controlling the scope of the stable zone of the south surface, the excavation depth should not exceed 450 m.
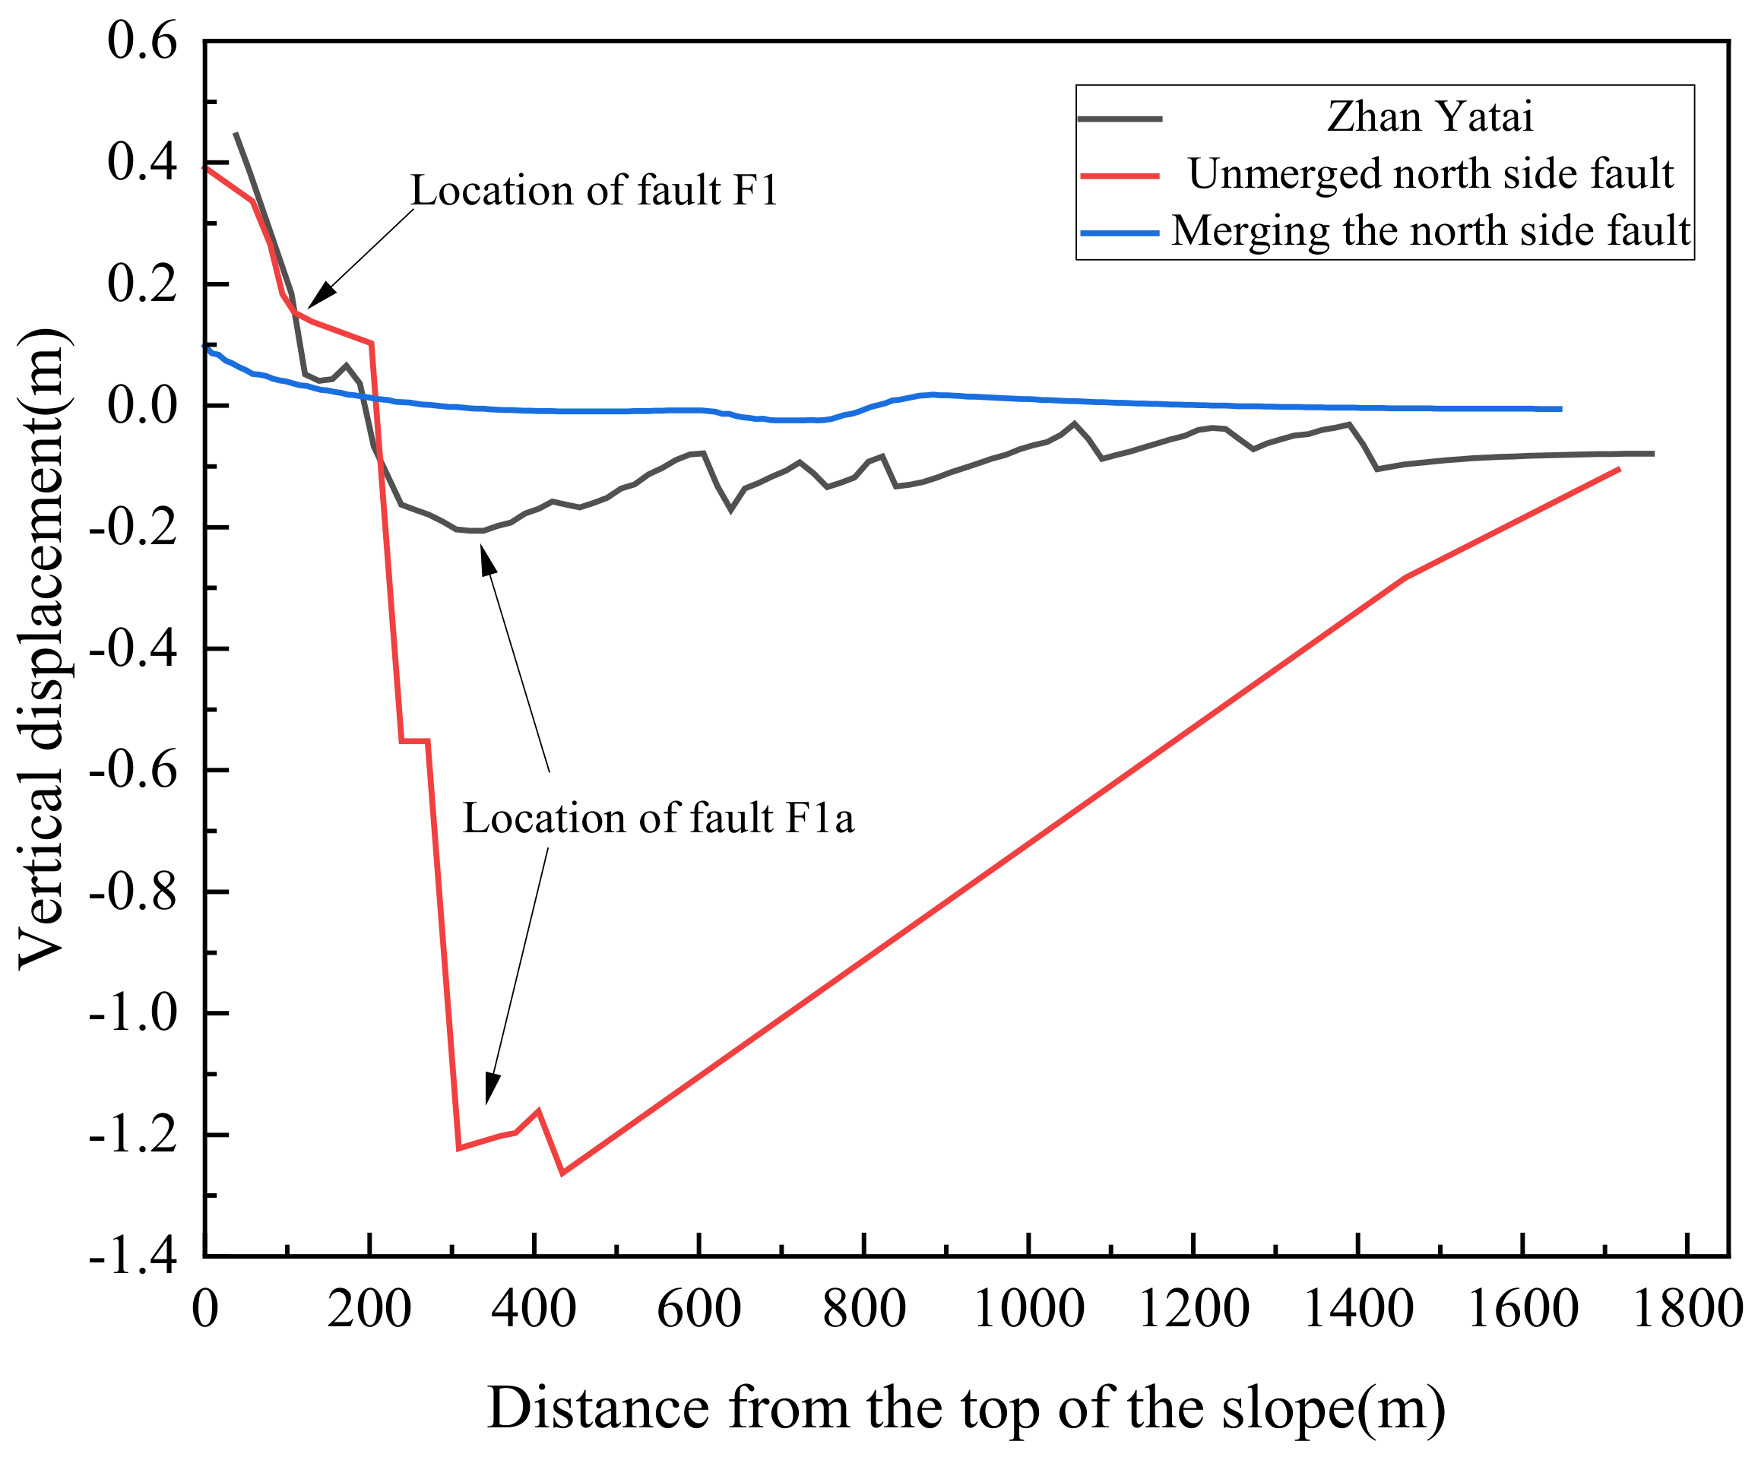
  • With an increase in the distance between the F1 fault and the top of the slope, the range of the unstable area on the north side of the open-pit mine gradually expanded, while with an increase in the F1 fault dip angle, the range of the unstable area gradually decreased. In the process of open-pit mining, the range of the unstable area in an area containing a reverse fault can be reduced by reducing the distance between the fault and the top of the slope and selecting a position with a fault dip angle less than 60° for excavation construction.
  • The significant influencing factor of the safety factor was the mode of open-pit mining, and the influencing order was as follows: north slope > south slope > north slope > south slope. With increases in the excavation inclinations of the north slope and south slope, the safety factor decreased greatly. The safety factor of the south slope should be designed to be less than 35°, and the safety factor of the north slope should be designed to be less than 30°.

Author Contributions

Conceptualization, H.S.; Writing—original draft, M.L. and H.S.; Writing—review & editing, P.X., H.J., D.Q. and W.W.; Project administration, H.J. All authors have read and agreed to the published version of the manuscript.

Funding

This research was funded by National key research and development plan project grant number 2016YFC0600801, Major scientific and technological innovation project in Shandong Province, China (2019SDZY02 and 2019SDYZ05).

Data Availability Statement

The original contributions presented in the study are included in the article, further inquiries can be directed to the corresponding authors.

Conflicts of Interest

The author Li Ming is employed by China Coal Science and Technology Group Shenyang Research Institute Co., Ltd., and is currently studying the preamble for a PhD in Civil Engineering in Civil and Resource Engineering at the University of Science and Technology Beijing. The remaining authors state that the study was conducted without any business or financial relationships, which could be interpreted as a potential conflict of interest.

References

  1. Guo, Z.; Liu, X.; Wang, L.-G.; Wang, Y. Study on slope deformation, failure and sliding law under excavation in Fushun West Open Pit. Met. Mine 2021, 2, 190–199. [Google Scholar] [CrossRef]
  2. Guo, H. The slope instability mode in Montenegro and failure mechanism study. Open-Air Min. Technol. 2021, 36, 25–28. [Google Scholar] [CrossRef]
  3. Wang, S.-Z.; Wang, J.-A.; Zhou, J.-X. Study on reinforced structural system of buildings in the affected area of open-pit slope. Min. Res. Dev. 2023, 2001, 147–153. [Google Scholar] [CrossRef]
  4. Li, Q. Coal ecotype strip mining theory and technology system and its application. J. Coal Sci. 2023, 1–18. [Google Scholar] [CrossRef]
  5. Bravo-Zapata, M.F.; Muñoz, E.; Lapeña-Mañero, P.; Montenegro-Cooper, J.M.; King, R.W. Analysis of the Influence of Geomechanical Parameters and Geometry on Slope Stability in Granitic Residual Soils. Appl. Sci. 2022, 12, 5574. [Google Scholar] [CrossRef]
  6. Hu, B.; Hu, Q.; Liu, Y.; Tao, G. Research on the Improvement of Granite Residual Soil Caused by Fly Ash and Its Slope Stability under Rainfall Conditions. Appl. Sci. 2024, 14, 3734. [Google Scholar] [CrossRef]
  7. Wei, S.-W.; Lv, S.; Jiang, J.-J.; Cai, D.-G.; Cui, Z.-D. Similarity Model Test on Rainfall Scouring Mechanism of High-Speed Railway Subgrade Slope. Appl. Sci. 2024, 14, 244. [Google Scholar] [CrossRef]
  8. Wang, B.; Wang, S. Shear Strength Analysis and Slope Stability Study of Straight Root Herbaceous Root Soil Composite. Appl. Sci. 2023, 13, 12632. [Google Scholar] [CrossRef]
  9. Tang, J.; Chen, D. Effect of Drying–Wetting Cycle and Vibration on Strength Properties of Granite Residual Soil. Appl. Sci. 2024, 14, 458. [Google Scholar] [CrossRef]
  10. Qu, M.; Dang, F. Numerical Analysis of Instability Mechanism of a High Slope under Excavation Unloading and Rainfall. Appl. Sci. 2022, 12, 7990. [Google Scholar] [CrossRef]
  11. Zhang, H.; Hu, R.; Chang, J.; Chen, X.; Zheng, Y.; Wu, R.; Jiang, X.-Y. Research on the analysis method of block-bending compound topping-failure of antidip rock slope. Chin. J. Rock Mech. Eng. 2023, 42, 1482–1496. [Google Scholar] [CrossRef]
  12. Vick, L.M.; Böhme, M.; Rouyet, L.; Bergh, S.G.; Corner, G.D.; Lauknes, T.R. Structurally controlled rock slope deformation in northern Norway. Landslides 2020, 17, 1745–1776. [Google Scholar] [CrossRef]
  13. Zhou, W.; Xu, W.; Ning, Y.; Xiao, H.; Xie, W. Analytical method of stability analyses of toppling rock slopes subjected to flexural toppling failure damage. Eur. J. Environ. Civ. Eng. 2023, 27, 2373–2387. [Google Scholar] [CrossRef]
  14. Haghgouei, H.; Kargar, A.R.; Amini, M.; Esmaeili, K. An analytical solution for analysis of toppling-slumping failure in rock slopes. Eng. Geol. 2020, 265, 105396. [Google Scholar] [CrossRef]
  15. Shuheng, Z.; Yinjun, M. Research on the influence of weak interlayer in open-pit slope on stability. Adv. Civ. Eng. 2021, 2021, 1–9. [Google Scholar] [CrossRef]
  16. Zheng, D.; Pan, Y.; Wang, Q.; Zhou, H.; Zheng, H.; Li, D. Evolutionary mechanisms of deep-seated toppling deformation of rock slope under different free-face conditions. Environ. Earth Sci. 2023, 82, 221. [Google Scholar] [CrossRef]
  17. Zhang, B.; Jiang, Y.; Zhang, J.; Liu, Z.; Wang, W. Upper limit analysis of three-dimensional rock slope stability under different saturation. Chin. J. Civ. Eng. 2023, 56, 78–90. [Google Scholar] [CrossRef]
  18. Gao, A.; Wang, J.; Li, F.; Xie, J. Analysis of building damage location characteristics around the West open pit Mine. J. China Coal Soc. 2021, 46, 1320–1330. [Google Scholar] [CrossRef]
  19. Tian, H.; Kong, Z. Influence of Rainfall Intensity and Slope on the Slope Erosion of Longling Completely Weathered Granite. Appl. Sci. 2023, 13, 5295. [Google Scholar] [CrossRef]
  20. Chen, Q.; Wang, A.; Wu, Z.; Zhu, A.; Li, L.; Tu, F. Stability of gently inclined bedding rock slope with weak interlayers based on cusp mutation theory. J. Henan Polytech. Univ. (Nat. Sci. Ed.) 2022, 41, 188–195. [Google Scholar] [CrossRef]
  21. Jin, P.; Shen, L.; Han, X.; Guo, J.; Wang, M. Spatial and temporal distribution characteristics and influencing factors of geological hazards in the West Open Pit Mine in Fushun, Liaoning Province. Chin. J. Geol. Hazards Prev. 2022, 33, 68–76. [Google Scholar] [CrossRef]
  22. Tian, Y.; Wu, Y.; Wang, H.; Li, H.; He, L.; Zhao, H. A Theory of Slope Shear Scouring and the Failure Mechanism of PFC3D on a Gangue Slope. Appl. Sci. 2023, 13, 5066. [Google Scholar] [CrossRef]
  23. Zhan, Y. Activation mechanism and long-term mechanical behavior of the Northern Slope fault zone in Fushun West Open Pit Mine. Ph.D. Thesis, Beijing University of Science and Technology, Beijing, China, 2022. [Google Scholar] [CrossRef]
  24. Jia, H.-J.; Ding, S.-F.; Shi, Z.-Z. Approximate weighted kernel k-means algorithm for solving large-scale spectral clustering. J. Softw. 2015, 2001, 2836–2846. [Google Scholar] [CrossRef]
  25. Zhang, G.; Zhang, C.; Zhang, H. Improved K-means algorithm based on density Canopy. Knowl. -Based Syst. 2018, 145, 289–297. [Google Scholar] [CrossRef]
  26. Wang, Y.; Yang, Y. Research and Application of spatial projection in K-means algorithm. Comput. Eng. Appl. 2020, 56, 200–204. [Google Scholar]
  27. Zhai, Q.; Zhou, Y.; Song, Q.; Wang, J.; Meng, Z.; Zhang, Y.L. Application of dimensionality reduction and clustering algorithm in tobacco similarity analysis. Front. Data Comput. 2021, 112–121. [Google Scholar]
  28. Shen, H.; Kong, Y.; Pang, J. Orthogonal test on strength of ceramic-based hybrid fiber concrete. J. Yangtze River Sci. Res. Inst. 2021, 38, 144–148. [Google Scholar]
Figure 1. E2000 geological profile drawing.
Applsci 14 04384 g001
Figure 2. Numerical model of the E2000 section.
Applsci 14 04384 g002
Figure 3. Surface subsidence and southward deformation of north side of Fushun West Open Pit.
Applsci 14 04384 g003
Figure 4. The horizontal and vertical displacement lines of the E2000 section.
Applsci 14 04384 g004aApplsci 14 04384 g004b
Figure 5. Displacement cloud maps of E200, E400, E2000, and E3200 profiles.
Applsci 14 04384 g005
Figure 6. Plots of the surface-level and vertical displacement in different sections of the north slope.
Applsci 14 04384 g006
Figure 7. Clustering plots of E200 and E2000 profiles.
Applsci 14 04384 g007aApplsci 14 04384 g007b
Figure 8. Stratigraphic stability zoning map of E200 and E2000 profiles: (a) E200 profile; (b) E2000 profile.
Applsci 14 04384 g008
Figure 9. Schematic diagram of the model.
Applsci 14 04384 g009
Figure 10. Nine factors affecting the safety factor, the starting points on the surface of the land, and the trend of the unstable area.
Applsci 14 04384 g010aApplsci 14 04384 g010bApplsci 14 04384 g010c
Table 1. Physical and mechanical parameters of rock mass and faults.
FormationElastic Modulus
(GPa)
Density
(g/cm3)
Cohesion
(Mpa)
Friction
Angle (°)
Poisson’s
Ratio
Tensile
Strength (Mpa)
Plain fill0.21.80.1200.290
Marlstone121.61.1300.273
Granitic gneiss302.740.24540.235
Basalt252.70.25480.232.5
Tuff0.322.350.18320.360.26
Coal seam0.221.30.28150.360.24
Kerogen shale2.81.80.6300.291.8
Green mudstone1.62.250.5250.320.22
Cretaceous sandstone2.82.30.58290.251.8
Faultage0.11.80.1370.40.22
Table 2. Excavation methods and main fault production of different section positions.
PropertySouth Slope
of Excavation (°)
North Slope of
Excavation (°)
South-Side
Excavation
Depth (m)
North-Side
Excavation
Depth (m)
F1 Fault
Dip (°)
F1 Distance
from the Top
of the Slope (m)
F1a Fault
Dip (°)
F1a Distance
from the Top
of the Slope (m)
Profile
E20025303004505016075300
E4002550400450458075200
E2000454540040055065400
E320035505005505516075300
Table 3. Orthogonal test design.
Level of FactorSouth Slope
of Excavation (α) (°)
North Slope of
Excavation (β) (°)
South-Side
Excavation
Depth (Hα) (m)
North-Side
Excavation
Depth (Hβ) (m)
F1 Fault
Dip (γ) (°)
F1 Distance
from the Top
of the Slope (Lγ) (m)
F1a Fault
Dip (δ) (°)
F1a Distance
from the Top
of the Slope (Hδ) (m)
Thickness of Coal Seam (H) (m)
125303003504506530050
23540400450508070400100
345505005505516075500150
Table 4. The starting points and widths of the unstable areas on the surfaces of the north and south slopes.
GroupStarting Point of the South Stable Zone (m)The Width of the Unstable Zone (m)Starting Point of the North Stable Zone (m)Safety Factor
1−109613830402.1
2−109613330351.975
3−89610728092.016
4−89616028621.55
5−15972534281.453
6−89615628581.538
7−89610528071.376
8−89623629381.25
9−8965027521.15
10−132210532332.152
11−139722834312
12−8965027521.919
13−8967527771.594
14−89613028321.438
15−89621029121.507
16-89616528671.438
17−89610028021.203
18−89615628581.138
19−89621029122.052
20−13365031921.92
21−132245435822.013
22−89613028321.6
23−89619028921.413
24−8966027621.355
25−8965027521.355
26−89610528071.204
27−89616028621.1
Table 5. Extreme analysis results.
FactorSouth Slope
of Excavation
North Slope of
Excavation
South-Side
Excavation
Depth
North-Side
Excavation
Depth
F1 Fault
Dip
F1 Distance
from the Top
of the Slope
F1a Fault
Dip
F1a Distance
from the Top
of the Slope
Thickness of Coal seam
Safety factor0.2830.7700.1370.1650.0360.0430.0250.0330.044
South side, hold steady 213.56243.67236.00157.33151.8993.33139.11180.8957.22
North side, hold steady 448.00374.33130.1196.11190.89261.6737.56129.00184.11
Range of instability21.5638.6741.7829.4476.78118.6728.0050.1119.78
Table 6. Results of ANOVA.
Target ParameterSource of VariationClass III Sum of SquaresMean SquareFSignificance
Safety factorExcavation inclination on south side0.0110.0062.2630.000
North slope of excavation2.7831.391568.0300.000
South-side excavation depth0.0000.0000.0440.958
Excavation depth on the north side0.1500.07530.6940.000
F1 fault dip0.0060.0031.2730.331
F1 distance from the top of the slope0.0090.0041.7890.228
F1a fault dip0.0030.0020.6980.526
F1a distance from the top of the slope0.0060.0031.2980.325
Seam thickness0.0100.0052.0440.192
South side, hold steady Excavation inclination on south side3304.5191652.2590.0880.093
North slope of excavation278,767.185139,383.57.4610.001
South-side excavation depth853,99.40742,699.702.2860.002
Excavation depth on the north side130,507.85265,253.923.4930.081
F1 fault dip108,208.07454,104.032.8960.113
F1 distance from the top of the slope40,471.18520,235.591.0830.383
F1a fault dip104,651.63052,325.812.8010.120
F1a distance from the top of the slope148,866.07474,433.033.9840.063
Seam thickness191,26.7419563.3700.5120.618
North side, hold steady Excavation inclination on south side261,609.185130,804.54.6880.000
North slope of excavation683,643.185341,821.512.2510.001
South-side excavation depth204,758.296102,379.13.6690.074
Excavation depth on the north side45,606.74122,803.370.8170.475
F1 fault dip197,923.85298,961.923.5470.032
F1 distance from the top of the slope356,293.407178,146.76.3850.028
F1a fault dip63,55.85231,77.9260.1140.894
F1a distance from the top of the slope77,378.74138,689.371.3870.045
Seam thickness195,829.40797,914.703.5090.081
Range of instabilityExcavation inclination on south side5088.2222544.1110.5340.606
North slope of excavation8744.6674372.3330.9180.092
South-side excavation depth13,601.5566800.7781.4280.295
Excavation depth on the north side4301.5562150.778.4510.652
F1 fault dip32,108.22216,054.113.3700.001
F1 distance from the top of the slope72,032.00036,016.007.5600.000
F1a fault dip4648.6672324.3330.4880.631
F1a distance from the top of the slope12,048.2226024.1111.2650.133
Seam thickness1910.222955.1110.2000.822
Disclaimer/Publisher’s Note: The statements, opinions and data contained in all publications are solely those of the individual author(s) and contributor(s) and not of MDPI and/or the editor(s). MDPI and/or the editor(s) disclaim responsibility for any injury to people or property resulting from any ideas, methods, instructions or products referred to in the content.

