
A Quantitative and Qualitative Analysis of the Lubricity of Used Lubricating Oil Diluted with Diesel Oil

Abstract
:1. Introduction
- Evaluation of the wear pattern of standardized samples only requires one measurement;
- The use of a very small amount of lubricating fluid in a single measurement;
- The low price of the samples and the ability to conveniently configure them to best replicate real friction conditions;
- Good repeatability and reproducibility of measurements;
- The ability to measure changes in electrical contact potential during a lubricity test allows for the evaluation of lubricity-enhancing additives;
- The possibility of conducting additional fretting wear tests on the same bench by using “long-strokes”.
2. Materials and Methods
3. Results and Discussion
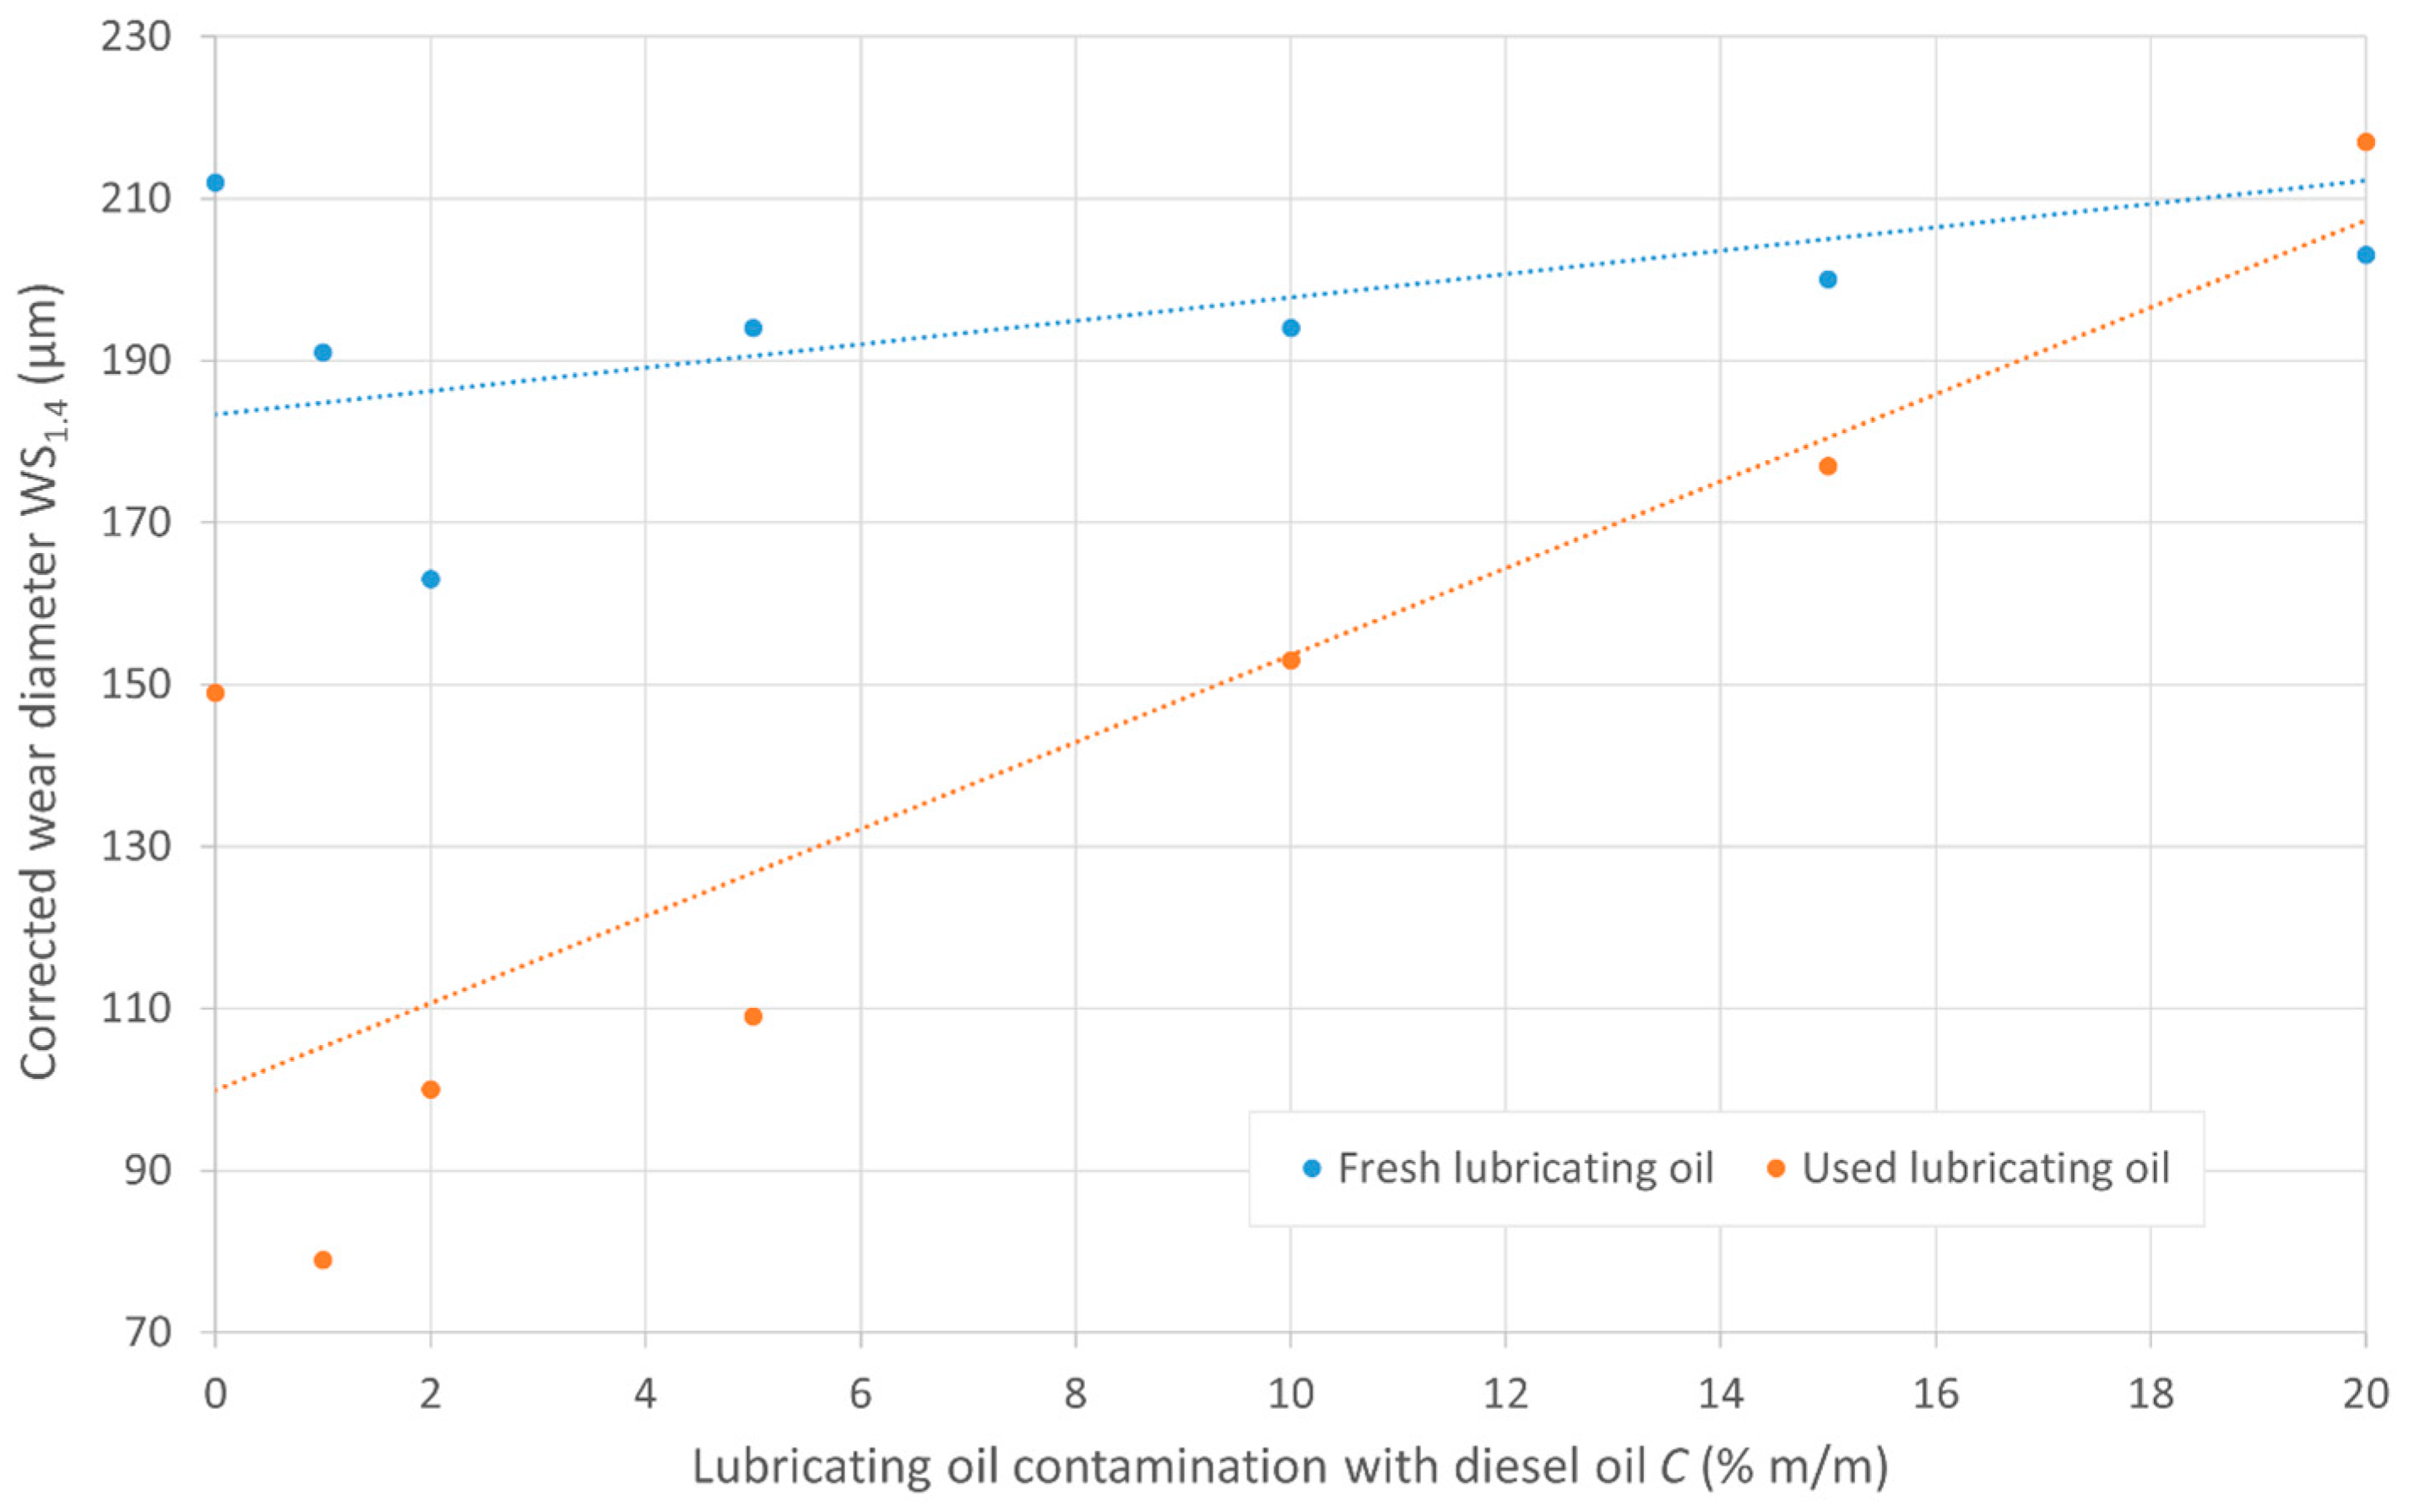
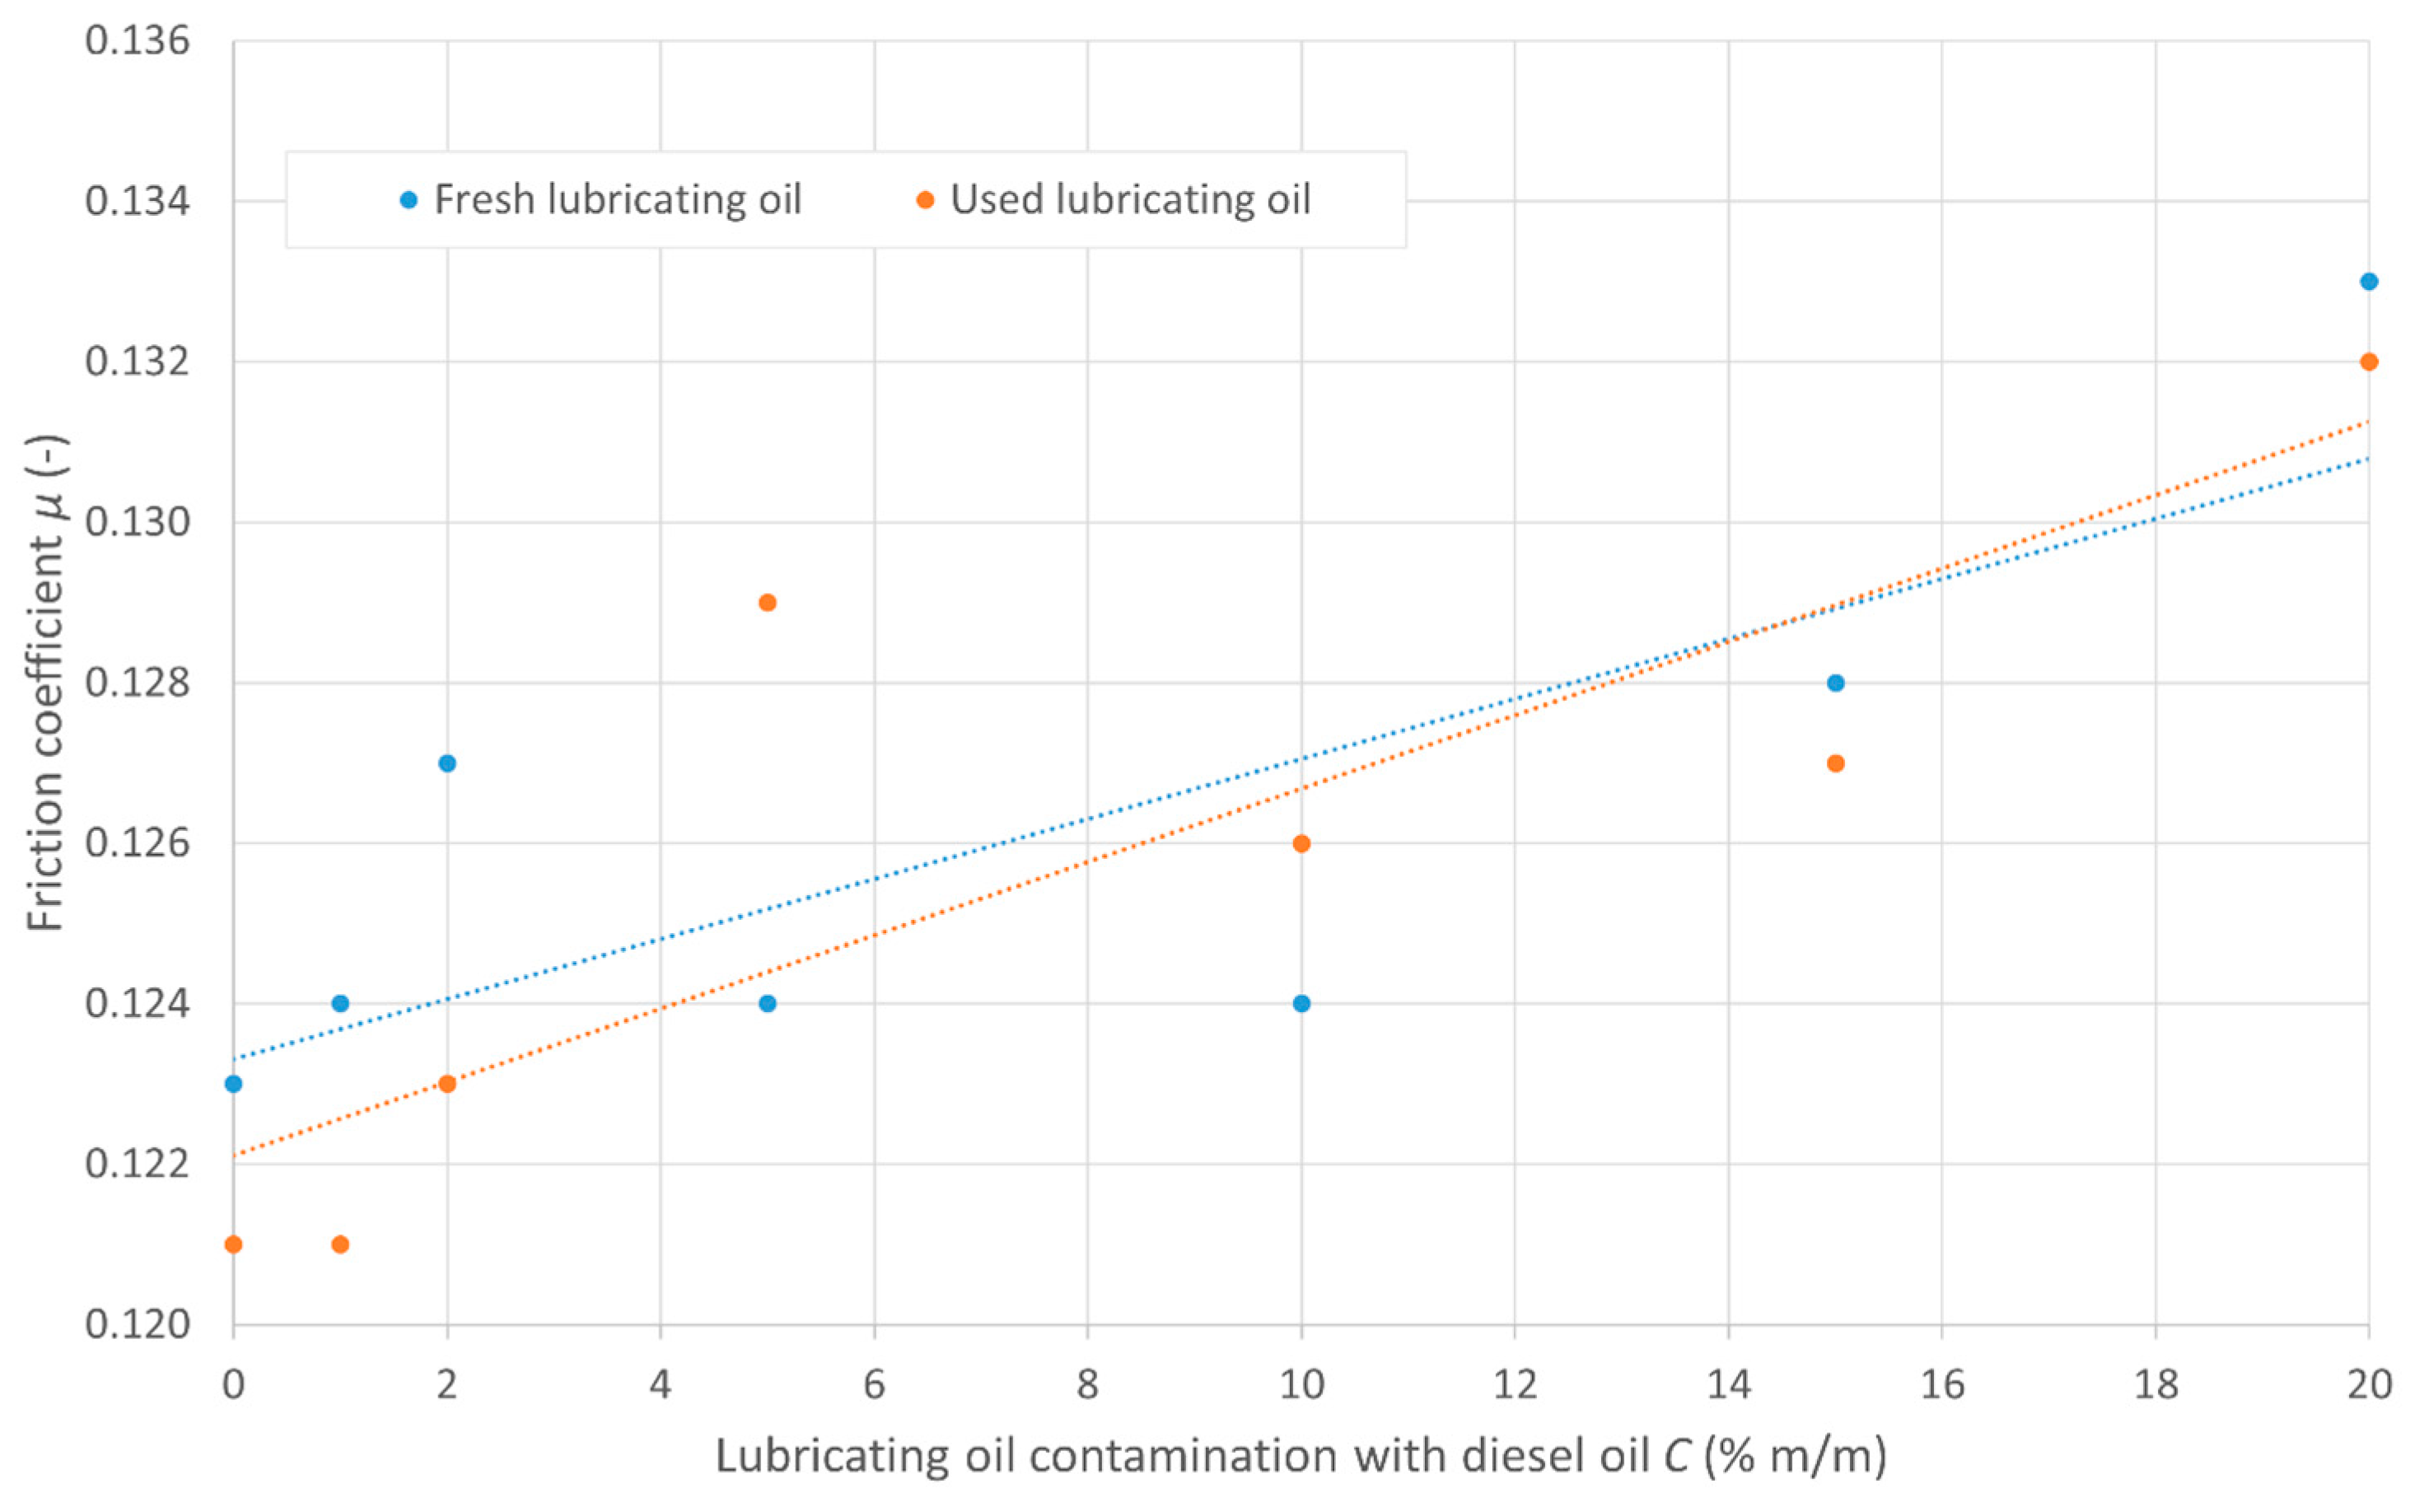
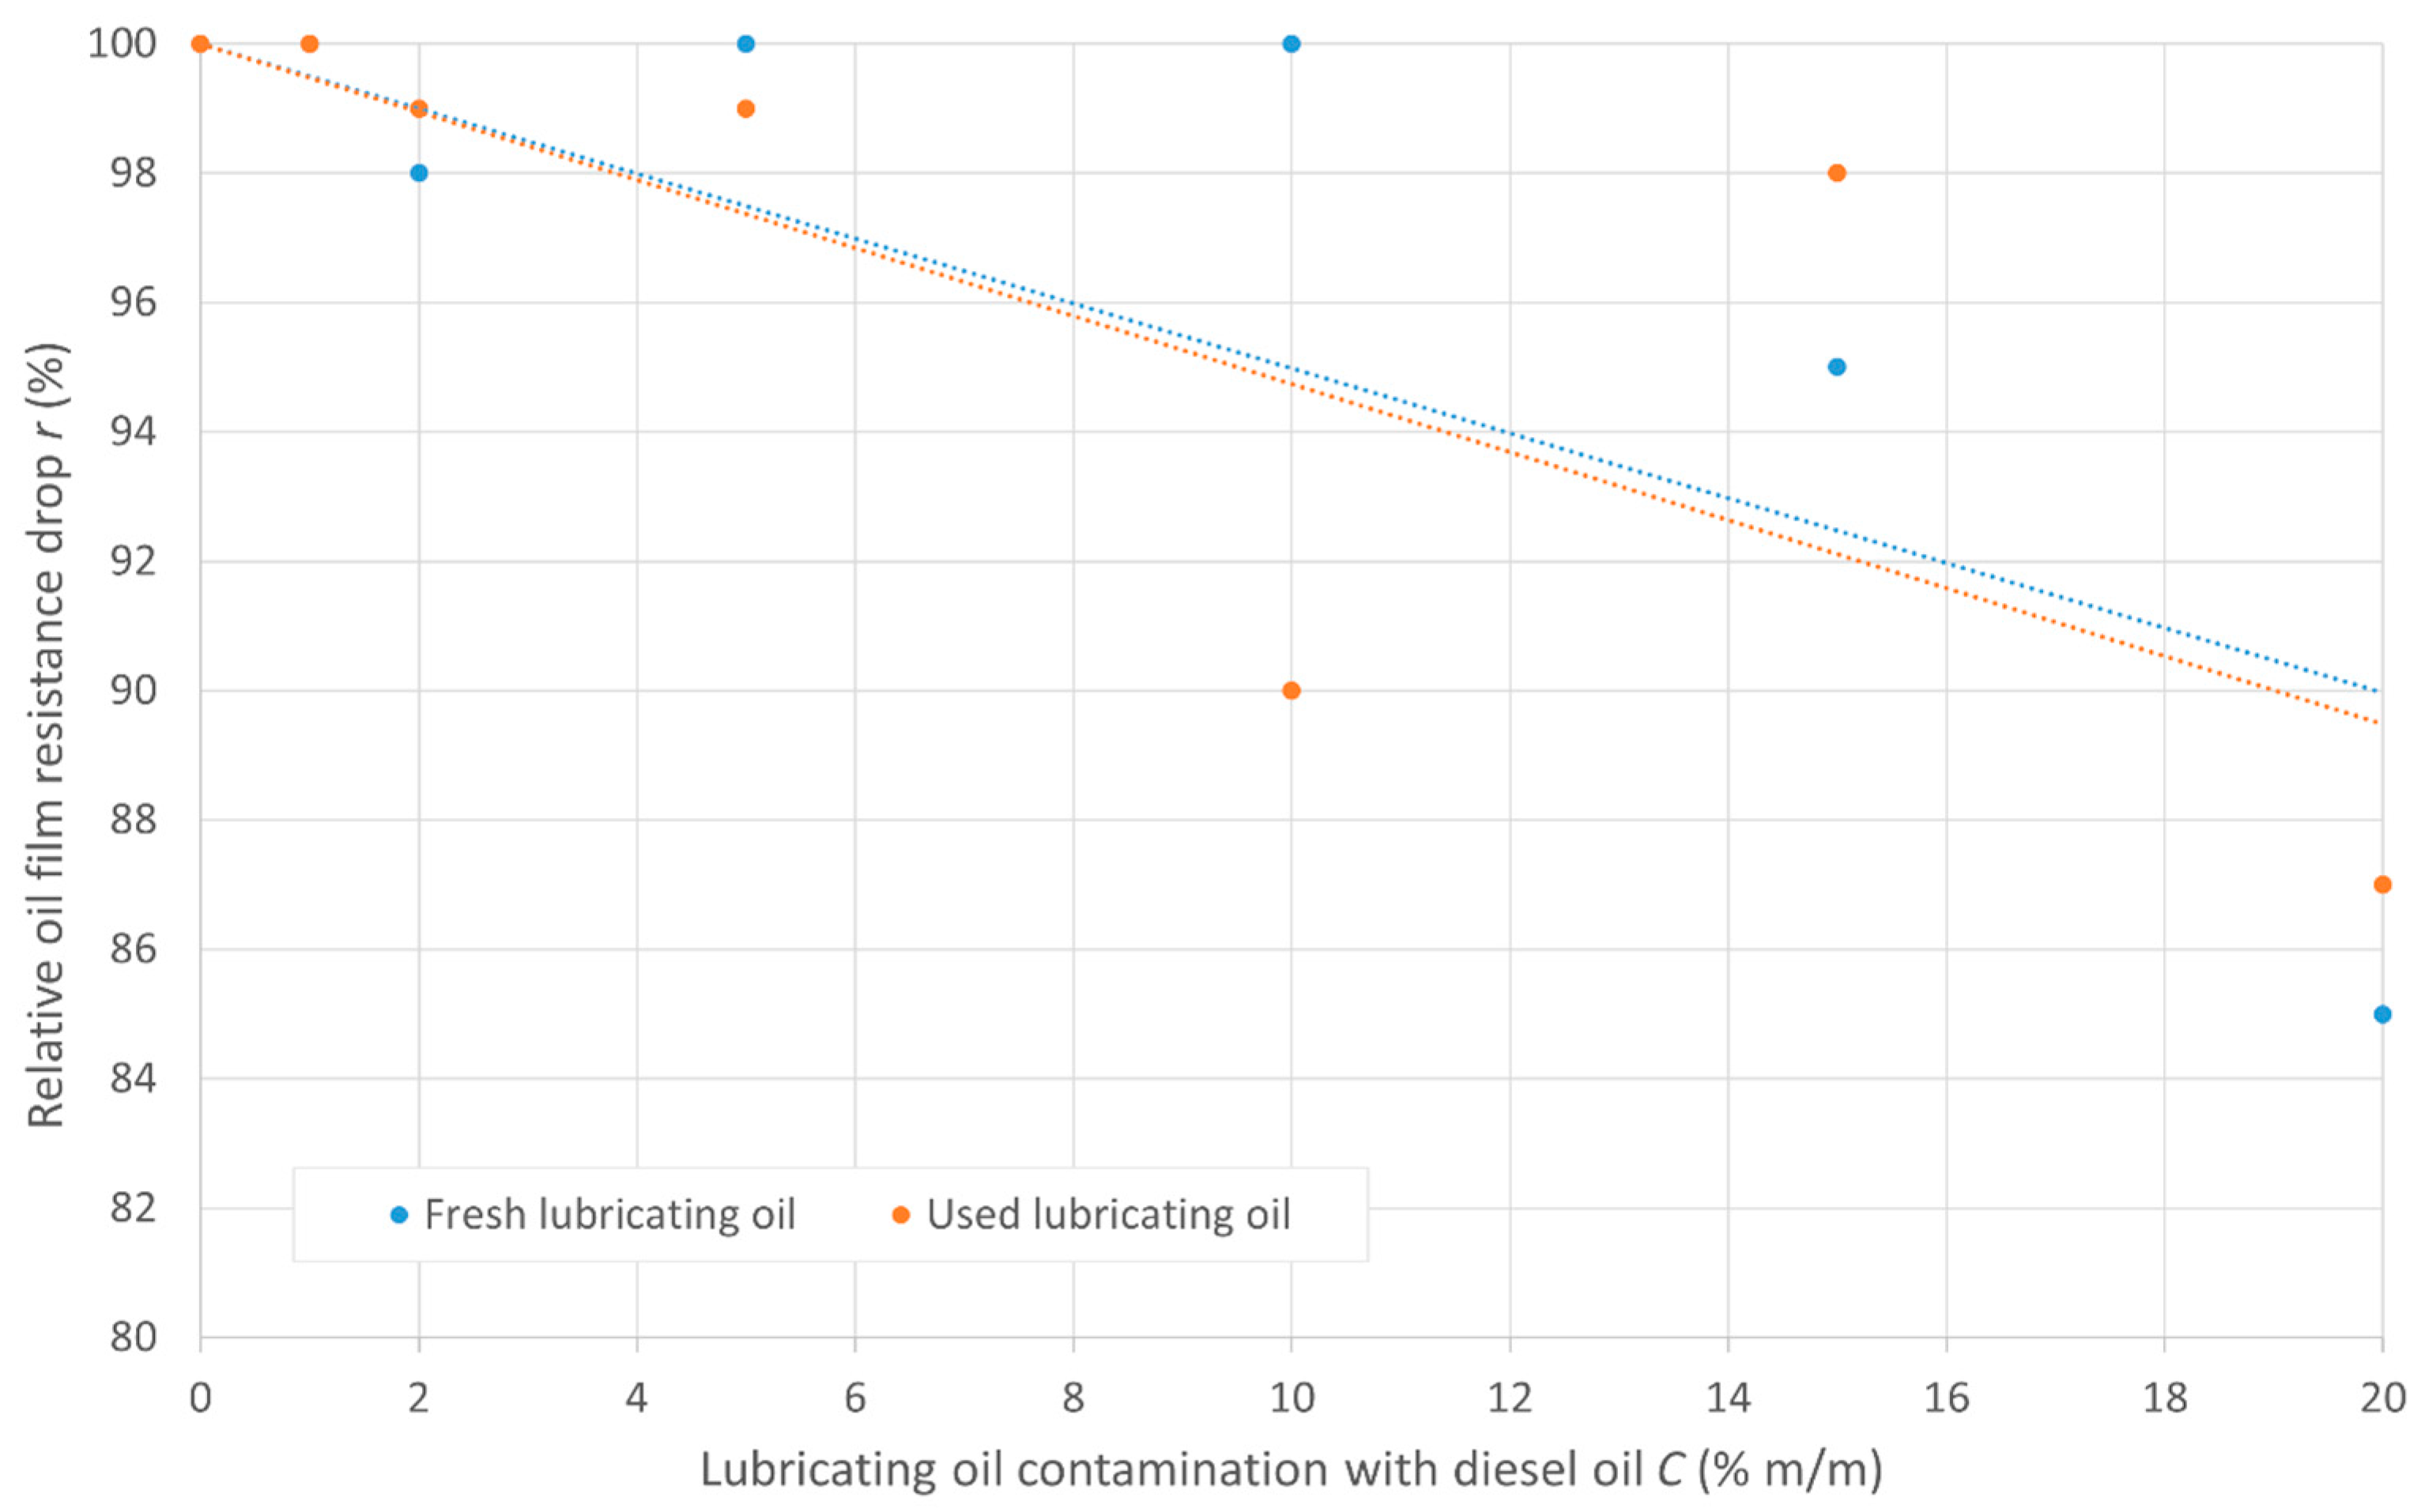
3.1. Quantitative Assessment of Lubricity
3.2. Qualitative Assessment of Lubricity

| DO Concentration C (% m/m) | LO Diluted with DO | |
|---|---|---|
| FLO | ULO | |
| 0 |  | 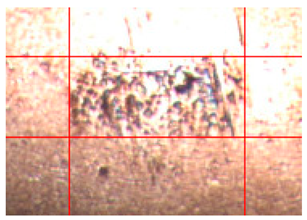 |
| 1 | 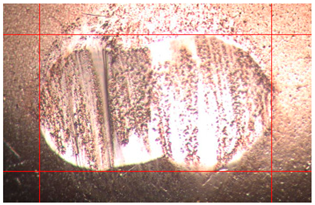 | 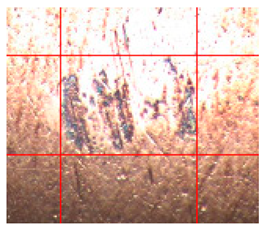 |
| 2 |  | 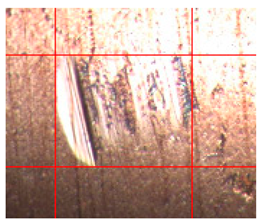 |
| 5 | 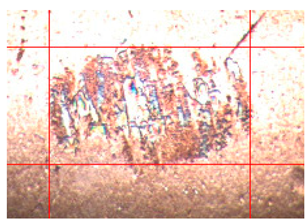 |  |
| 10 | 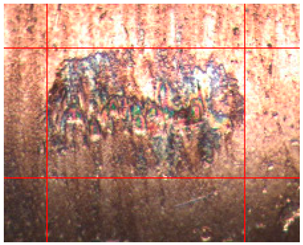 | 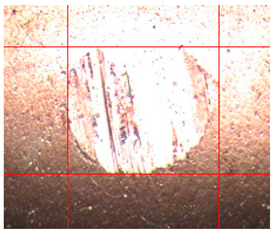 |
| 15 | 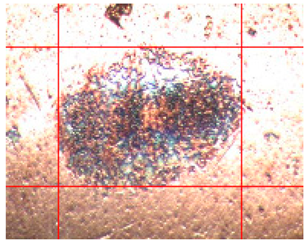 | 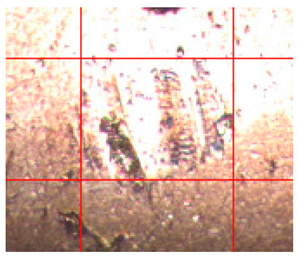 |
| 20 | 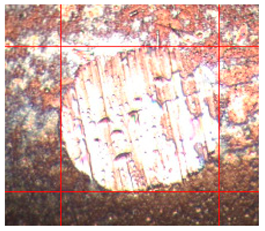 | 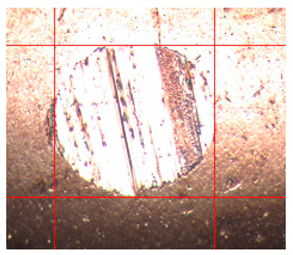 |
| 100 |  | 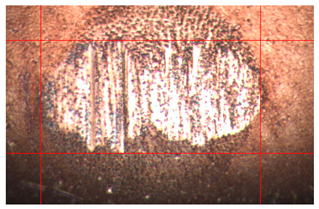 |
4. Conclusions
Author Contributions
Funding
Institutional Review Board Statement
Informed Consent Statement
Data Availability Statement
Acknowledgments
Conflicts of Interest
Abbreviations
| ASTM | American Society for Testing and Materials |
| AVP | average absolute oil vapor pressure during the HFFR test |
| BOCLE | ball-on-cylinder lubricity evaluator |
| C | exact (expected) mass concentration of DO in the lubricating oil |
| CIMAC | The International Council on Combustion Engines e.V. (Fr. Conseil International des Machines à Combustion) |
| Cw | concentration of solid impurities in the lubricating oil |
| DIN | German Institute for Standardization (Ger. Deutsches Institut für Normung e.V.) |
| DO | diesel oil |
| EP | extreme pressure lubricating oil additives |
| f(C) | function with dependent parameter C |
| FAME | fatty acid methyl esters |
| F | frictional force |
| FLO | fresh lubricating oil |
| h1 | air humidity in the laboratory room at the beginning of the HFFR test |
| h2 | air humidity in the laboratory room at the end of the HFFR test |
| HFFR | high-frequency reciprocating rig |
| ISO | International Organization for Standardization |
| LO | lubricating oil |
| Mw | wear of engine components |
| N | normal contact force |
| r | relative oil film resistance drop |
| ΔR | absolute oil film resistance drop |
| R1 | oil film resistance at the beginning of the HFFR test |
| R2 | oil film resistance at the end of the HFFR test |
| R2 | coefficient of determination |
| RMSE | root-mean-square error |
| SAE | Society of Automotive Engineers |
| SAE 30 | viscosity grade of lubricating oils according to the SAE J300-2021 standard |
| SLBOCLE | scuffing load ball-on-cylinder lubricity evaluator |
| t1 | air temperature in the laboratory room at the beginning of the HFFR test |
| t2 | air temperature in the laboratory room at the end of the HFFR test |
| uB | type-B standard uncertainty |
| ULO | used lubricating oil |
| WD1.4 | normalized HFFR wear scar diameter |
| WSD | mean wear scar diameter |
| x | average size of the wear scar in the direction perpendicular to the axis of oscillation of the HFFR tribometer |
| y | average size of the wear scar parallel to the axis of oscillation of the HFFR tribometer |
| μ | friction coefficient |
References
- Krupowies, J. Badania Zmian Właściwości Oleju Obiegowego Okrętowych Silników Pomocniczych; Wyższa Szkoła Morska w Szczecinie: Szczecin, Poland, 2002. [Google Scholar]
- Piotrowski, I.; Witkowski, K. Okrętowe Silniki Spalinowe, 3rd ed.; Trademar: Gdynia, Poland, 2013; ISBN 978-83-62227-48-8. [Google Scholar]
- Baczewski, K.; Hebda, M.; Jaroszczyk, T. Filtracja Oleju, Paliwa i Powietrza w Tłokowych Silnikach Spalinowych; Wydawnictwa Komunikacji i Łączności, Ed.: Warszawa, Poland, 1977. [Google Scholar]
- Krupowies, J. Badania Pierwiastków Śladowych w Oleju Obiegowym Jako Element Diagnostyki Silnika; Wyższa Szkoła Morska w Szczecinie: Szczecin, Poland, 2001. [Google Scholar]
- TotalEnergies Fuel Dilution of Engine Oil: Causes and Effects. Available online: https://lubricants.totalenergies.com/fuel-dilution-engine-oil-causes-and-effects (accessed on 14 June 2022).
- Technomics International Case Study—Fuel Dilution of Engine Oil in Locomotives. Available online: https://www.techenomics.net/case-studies/fuel-dilution-engine-oil/ (accessed on 8 June 2022).
- Valigi, M.C.; Braccesi, C.; Logozzo, S.; Conti, L.; Borasso, M. A new telemetry system for measuring the rotating ring’s temperature in a tribological test rig for mechanical face seals. Tribol. Int. 2017, 106, 71–77. [Google Scholar] [CrossRef]
- Dieselhub Fuel Dilution in Diesel Engines. Fuel Dilution Causes, How to Protect your Engine. Available online: https://www.dieselhub.com/maintenance/fuel-dilution.html (accessed on 14 June 2022).
- Critchley, L. Fuel Dilution in Engine Oil—How It Happens and What It Leads to. Available online: https://www.azom.com/article.aspx?ArticleID=16891 (accessed on 16 June 2022).
- Taylor, R.I. Fuel-Lubricant Interactions: Critical Review of Recent Work. Lubricants 2021, 9, 92. [Google Scholar] [CrossRef]
- Baczewski, K.; Kałdoński, T. Paliwa do Silników o Zapłonie Samoczynnym; WKiŁ: Warszawa, Poland, 2018. [Google Scholar]
- Baczewski, K.; Szczawiński, P. Badanie właściwości reologicznych estrów metylowych oleju rzepakowego i ich mieszanin z olejami napędowymi. J. Kones Powertrain Transp. 2007, 14, 29–38. [Google Scholar]
- Abdullah, M.; Abdollach, M.; Mat-Nuri, N.; Amiruddin, H.; Tamaldin, N. Comparison of the frictional properties of nano-oil and SAE 15W40 oil diluted with biodiesel fuel. In Proceedings of the Malaysian International Tribology Conference 2015, Penang, Malaysia, 16–17 November 2015; pp. 190–191. [Google Scholar]
- Mori, K.; Sugimoto, N.; Yamane, K.; Kawasaki, K. Influence of Biodiesel Fuel on Lubricant Oil Oxidative Degradation. SAE Tech. Pap. Ser. 2015, 9, 1–7. [Google Scholar] [CrossRef]
- Urzędowska, W.; Stępień, Z. Olej Silnikowy a Biopaliwa—Współdziałanie w Eksploatacji. Nafta-Gaz 2010, 66, 914–921. [Google Scholar]
- Watson, S.A.G.; Wong, V.W. The Effects of Fuel Dilution with Biodiesel on Lubricant Acidity, Oxidation and Corrosion—A Study with CJ-4 and CI-4 PLUS Lubricants. In Proceedings of the 2008 Diesel Engine-Efficiency and Emissions Research (DEER) Conference, Cambridge, MA, USA, 27 August 2008. [Google Scholar]
- Zaharia, C.; Niculescu, R.; Clenci, A.; Iorga, V. Analyse of used oil in order to emit diagnosis interpretations of the diesel engine operation. Rom. J. Automot. Eng. 2019, 25, 5–11. [Google Scholar]
- Oilmanager Oil Viscosity and Its Importance. Available online: https://www.techenomics.net/2014/02/oil-viscosity-and-its-importance/ (accessed on 20 June 2023).
- CIMAC. Working Group ‘Marine Lubricants’ Guidelines for the Lubrication of Medium Speed Siesel Engines, 2nd ed.; The International Council on Combustion Engines: Frankfurt, Germany, 2008. [Google Scholar]
- CIMAC. Working Group ‘Marine Lubricants’ CIMAC Recommendation 31. In The Lubrication of Two-Stroke Crosshead Diesel Engines; CIMAC: Frankfurt, Germany, 2017. [Google Scholar]
- Chybowski, L. Rozcieńczenie Oleju Paliwem Jako Czynnik Ryzyka Eksplozji w Skrzyniach Korbowych Okrętowych Bezwodzikowych Silników Spalinowych; Maritime University of Szczecin Press: Szczecin, Poland, 2023; ISBN 978-83-64434-56-3. [Google Scholar]
- Malinowska, M.; Zera, D. Analiza zmian smarności oleju silnikowego stosowanego w silniku Cegielski-Sulzer 3AL25/30. Zesz. Nauk. Akad. Morskiej w Gdyni 2016, 96, 93–104. [Google Scholar]
- ISO 8217:2017; Petroleum Products—Fuels (Class F)—Specifications of Marine Fuels. 6th ed. ISO: Geneva, Switzerland, 2017.
- PN-EN ISO 590+A1:2017-06; Polska Norma. Paliwa do Pojazdów Samochodowych—Oleje Napędowe—Wymagania i Metody Badań. PKN: Warszawa, Poland, 2017.
- Minister Gospodarki RP. Rozporządzenie Ministra Gospodarki z dnia 9 października 2015 r. w Sprawie Wymagań Jakościowych Dla Paliw Ciekłych; Ministerstwo Gospodarki RP: Warszawa, Poland, 2015. [Google Scholar]
- PKN Orlen S.A. ZN-ORLEN-5—Przetwory naftowe. In Olej Napędowy Efecta Diesel; PKN Orlen S.A.: Płock, Poland, 2019. [Google Scholar]
- EN ISO 12156-1:2018; Diesel Fuel—Assesment of Lubricity Using the High-Frequency Reciporating Rig (HFFR)—Part 1: Test Method. ISO: Geneva, Switzerland, 2018.
- ASTM D975-21; Standard Specification for Diesel Fuel. ASTM: West Conshohocken, PA, USA, 2022.
- ASTM D975-19b; Standard Specification for Diesel Fuel. ASTM: West Conshohocken, PA, USA, 2013.
- Wojtyniak, M. Fuel Lubricity and Its Laboratory Evaluation. J. Civ. Eng. Transp. 2022, 4, 47–59. [Google Scholar] [CrossRef]
- Chybowski, L.; Kowalak, P.; Dąbrowski, P. Assessment of the Impact of Lubricating Oil Contamination by Biodiesel on Trunk Piston Engine Reliability. Energies 2023, 16, 5056. [Google Scholar] [CrossRef]
- Blau, P.J. Lessons learned from the test-to-test variability of different types of wear data. Wear 2017, 376–377, 1830–1840. [Google Scholar] [CrossRef] [PubMed]
- Delgado, J.; Gadea, M.; Esarte, C.; Peláez, A. HFRR and SL-BOCLE Lubricity of Paraffinic Diesel Fuels Considering Different Origins and Final Formulations with Biodiesels and Additives. Energy Fuels 2020, 34, 2654–2664. [Google Scholar] [CrossRef]
- PCS. Instruments Aparat do Badania Paliw i Środków Smarnych. Instrukcja Obsługi Systemu HFFR V1.0.3; Inkom Instruments Co.: Warszawa, Poland, 2018. [Google Scholar]
- Lotos Marinol RG Seria 12—Specyfikacja Tchniczna. Available online: https://marinol.lotosoil.pl/3416/o,159,p,3317,c,46/oferta_dla_zeglugi/marinol_oleje_silnikowe_oleje_tpeo/marinol_rg_seria_12#specification (accessed on 22 June 2023).
- Lotos Karta Charakterystyki LO/15/07; Lotos: Gdańsk, Poland, 2022.
- PKN Orlen S.A. Olej Napędowy; Ecodiesel Ultra B,D,F, Olej napędowy arktyczny klasy 2, Efecta Diesel B,D,F, Verva ON B,D,F; PKN Orlen S.A.: Płock, Poland, 2021. [Google Scholar]
- ASTM D 6595-17; Standard Test Method for Determination of Wear Metals and Contaminants in Used Lubricating Oils or Used Hydraulic Fluids by Rotating Disc Electrode Atomic Emission Spectrometry. ASTM: West Conshohocken, PA, USA, 2022.
- PN-EN ISO 12185:2002; Ropa Naftowa i Przetwory Naftowe—Oznaczanie Gęstości—Metoda Oscylacyjna z U-rurką. PKN: Warszawa, Poland, 2002.
- PN-EN ISO 3104:2021-03; Petroleum Products—Transparent and Opaque Liquids—Determination of Kinematic Viscosity and Calculation of Dynamic Viscosity. PKN: Warszawa, Poland, 2021.
- ASTM D 2270-10(2016); Standard Practice for Calculating Viscosity Index from Kinematic Viscosity at 40 °C and 100 °C. ASTM: West Conshohocken, PA, USA, 2016.
- Anton Paar ASTM D 2270. Viscosity Index (VI) from 40 °C and 100 °C. Available online: https://wiki.anton-paar.com/pl-pl/wskaznik-lepkosci-vi-od-40c-i-100c-astm-d2270/ (accessed on 7 September 2022).
- Chybowski, L. The Initial Boiling Point of Lubricating Oil as an Indicator for the Assessment of the Possible Contamination of Lubricating Oil with Diesel Oil. Energies 2022, 15, 7927. [Google Scholar] [CrossRef]
- ISO 2719:2016; Determination of Flash Point—Pensky-Martens Closed Cup Method. 4th ed. ISO: Geneva, Switzerland, 2016.
- ASTM D 7668-17; Standard Test Method for Determination of Derived Cetane Number (DCN) of Diesel Fuel OilsIgnition Delay and Combustion Delay Using a Constant Volume Combustion Chamber Method. ASTM: West Conshohocken, PA, USA, 2017.
- ASTM D8004-15; Standard Test Method for Fuel Dilution of In-Service Lubricants Using Surface Acoustic Wave Sensing. ASTM: West Conshohocken, PA, USA, 2023.
- PN-EN 12937:2005; Przetwory Naftowe—Oznaczanie Wody—Miareczkowanie Kulometryczne Metodą Karla Fischera. PKN: Warszawa, Poland, 2005.
- ISO 10307-1:2009; Petroleum Products—Total Sediment in Residual Fuel Oils—Part 1: Determination by hot filtration. ISO: Geneva, Switzerland, 2009.
- PN-ISO 4405:1994; Zawartość Zanieczyszczeń Nierozpuszczalnych. PKN: Warszawa, Poland, 1994.
- Chybowski, L.; Kowalak, P.; Szczepanek, M.; Jóźwiak, P.; Danisiewicz, P. The assessment of surface acoustic wave sensing for testing fuel dilution of lubricating oils. Measurement 2024, 231, 114589. [Google Scholar] [CrossRef]
- ASTM D 6079-22; Standard Test Method for Evaluating Lubricity of Diesel Fuels by the High-Frequency Reciprocating Rig (HFRR). ASTM: West Conshohocken, PA, USA, 2023.
- PCS Instruments Instrukcja Obsługi, Mikroskop do Pomiaru Skazy Zużycia na Aparacie HFR2, Inkom Instruments Co.: Warszawa, Poland, 1999.
- Chybowski, L. Study of the Relationship between the Level of Lubricating Oil Contamination with Distillation Fuel and the Risk of Explosion in the Crankcase of a Marine Trunk Type Engine. Energies 2023, 16, 683. [Google Scholar] [CrossRef]
- Kolm, R.; Gebeshuber, I.C.; Kenesey, E.; Ecker, A.; Pauschitz, A.; Werner, W.S.M.; Störi, H. Tribochemistry of mono molecular additive films on metal surfaces, investigated by XPS and HFRR. Tribol. Interface Eng. Ser. 2005, 48, 269–282. [Google Scholar] [CrossRef]
- PN-EN ISO 12156-1:2008; Oleje Napędowe—Ocena Smarności z Zastosowaniem Aparatu o Ruchu Posuwisto-Zwrotnym Wysokiej Częstotliwości (HFFR)—Część 1: Metoda badania. PKN: Warszawa, Poland, 2006.
- Aczel, A.; Sounderpandian, J. Complete Business Statistics, 5th ed.; Irwin/McGraw-Hill: New York, NY, USA, 2001; ISBN 978-0072524857. [Google Scholar]
- Krupowies, J. Badania i Ocena Zmian Właściwości Użytkowych Olejów Urządzeń Okrętowych; Maritime University of Szczecin: Szczecin, Poland, 2009. [Google Scholar]
- Ljubas, D.; Krpan, H.; Matanović, I. Influence of engine oils dilution by fuels on their viscosity, flash point and fire point. Nafta 2010, 61, 73–79. [Google Scholar]
- Wolak, A.; Zając, G.; Żółty, M. Changes of properties of engine oils diluted with diesel oil under real operating conditions. Combust. Engines 2018, 173, 34–40. [Google Scholar] [CrossRef]
- Kaminski, P. Experimental Investigation into the Effects of Fuel Dilution on the Change in Chemical Properties of Lubricating Oil Used in Fuel Injection Pump of Pielstick PA4 V185 Marine Diesel Engine. Lubricants 2022, 10, 162. [Google Scholar] [CrossRef]


| Parameter (Measurement Method Used in This Experiment) | Unit | Value | ||
|---|---|---|---|---|
| FLO | ULO | DO | ||
| Density at 15 °C (PN-EN ISO 12185:2002 [39]) | kg/m3 | 890.6 | 889.6 | 828.3 |
| Kinematic viscosity at 40 °C (PN-EN ISO 3104:2021-3 [40]) | mm2/s | 110.310 | 102.740 | 2.480 |
| Kinematic viscosity at 100 °C (PN-EN ISO 3104:2021-3 [40]) | mm2/s | 11.770 | 11.420 | 1.067 |
| Viscosity index (ASTM D2270-10(2016) [41], Anton Paar calculator [42]) | – | 94.13 | 94.13 | 274.35 |
| Initial boiling point (Flashpoint Pensky–Martens apparatus [43]) | °C | 276.0 | 240.5 | 175 |
| Flashpoint in closed cup (PN-EN ISO 2719:2016 [44]) | °C | 216.0 | 190.0 | 56.0 |
| Derivated Cetane Number (ASTM D7668(2017) [45]) | – | N/A | N/A | 52 |
| Lubricity—HFFR wear scar diameter (PN-EN ISO 12156-1:2018 [27]) | μm | 212 | 149 | 331 |
| HFFR friction coefficient (HFFR V.1.0.3 procedure [34]) | – | 0.123 | 0.121 | 0.191 |
| Relative oil film resistance drop (HFFR V.1.0.3 procedure [34]) | % | 100 | 100 | 76 |
| Chemical Element | Content (ppm) | ||
|---|---|---|---|
| FLO | ULO | DO | |
| Fe | 0.0 | 3.2 | 0.0 |
| Cr | 1.0 | 2.6 | 0.0 |
| Pb | 7.4 | 14.7 | 3.7 |
| Cu | 0.0 | 0.0 | 0.0 |
| Sn | 7.1 | 8.0 | 18.0 |
| Al | 5.8 | 6.0 | 5.3 |
| Ni | 7.5 | 15.2 | 4.6 |
| Ag | 0.7 | 0.6 | 0.3 |
| Si | 4.1 | 11.5 | 2.1 |
| B | 0.8 | 2.1 | 0.1 |
| Na | 4.9 | 7.4 | 4.6 |
| Mg | 0.1 | 0.8 | 0.2 |
| Ca | 4.8 | 7.3 | 3.1 |
| Ba | 0.0 | 0.0 | 0.0 |
| P | 0.0 | 0.0 | 0.0 |
| Zn | 1.1 | 4.1 | 0.0 |
| Mo | 2.1 | 2.3 | 1.0 |
| Ti | 0.0 | 0.0 | 0.0 |
| V | 0.0 | 0.0 | 0.0 |
| Parameter (Measurement Method Used in This Experiment) | Unit | Value |
|---|---|---|
| Content of DO (ASTM D8004-15 (2023) [46]) | % m/m | 0.01 |
| Content of water (PN-EN ISO 12937:2005+AP1:2021-11P [47]) | % m/m | 0.05 |
| Determination of total sediment (PN-ISO 10307-1:2001 [48]) | mg/g | 0.35 |
| Determination of the content of the contaminant particulates (PN-ISO 4405:1994 [49]) | mg/100 mL | 77.1 |
| Content of chemical elements (ASTM D6595-17 (2022) [38]) | ppm | See Table 4 |
Disclaimer/Publisher’s Note: The statements, opinions and data contained in all publications are solely those of the individual author(s) and contributor(s) and not of MDPI and/or the editor(s). MDPI and/or the editor(s) disclaim responsibility for any injury to people or property resulting from any ideas, methods, instructions or products referred to in the content. |
© 2024 by the authors. Licensee MDPI, Basel, Switzerland. This article is an open access article distributed under the terms and conditions of the Creative Commons Attribution (CC BY) license (https://creativecommons.org/licenses/by/4.0/).
Share and Cite
Chybowski, L.; Szczepanek, M.; Sztangierski, R.; Brożek, P. A Quantitative and Qualitative Analysis of the Lubricity of Used Lubricating Oil Diluted with Diesel Oil. Appl. Sci. 2024, 14, 4567. https://doi.org/10.3390/app14114567
Chybowski L, Szczepanek M, Sztangierski R, Brożek P. A Quantitative and Qualitative Analysis of the Lubricity of Used Lubricating Oil Diluted with Diesel Oil. Applied Sciences. 2024; 14(11):4567. https://doi.org/10.3390/app14114567
Chicago/Turabian StyleChybowski, Leszek, Marcin Szczepanek, Robert Sztangierski, and Piotr Brożek. 2024. "A Quantitative and Qualitative Analysis of the Lubricity of Used Lubricating Oil Diluted with Diesel Oil" Applied Sciences 14, no. 11: 4567. https://doi.org/10.3390/app14114567