
Lower Limb Muscle Co-Activation Maps in Single and Team Lifting at Different Risk Levels


Abstract
1. Introduction
2. Materials and Methods
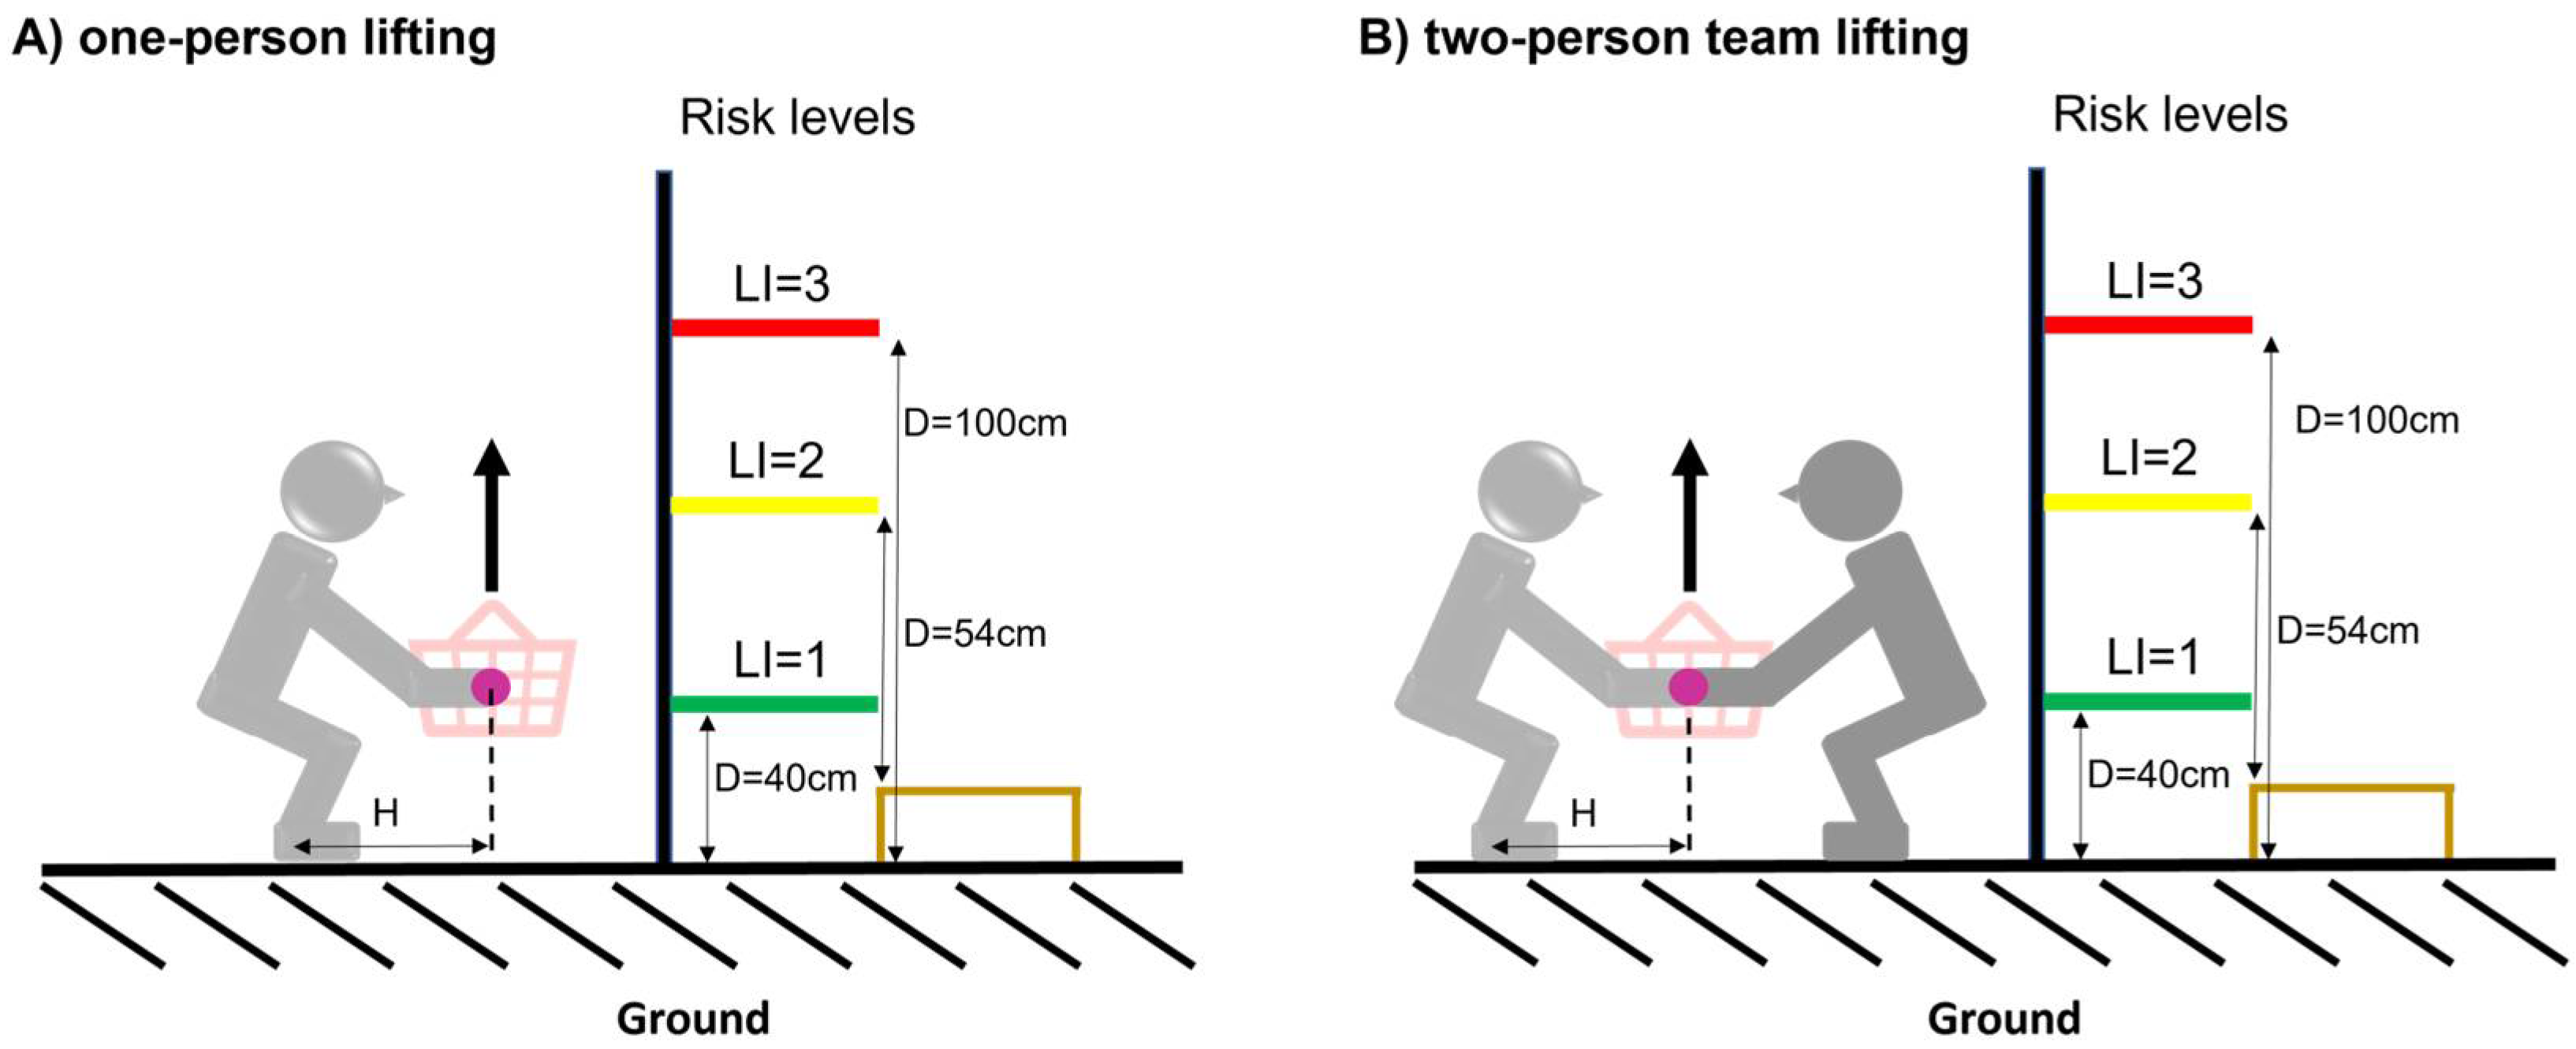
2.1. Experimental Procedures
2.2. Data Analysis
2.3. Cycle Definition and Time Normalization
2.4. Global, Full Leg, Flexor, Extensor, and Rostro-Caudal Co-Activation
2.5. Co-Activation Parameters
2.6. Statistical Analysis
3. Results
3.1. Subjects
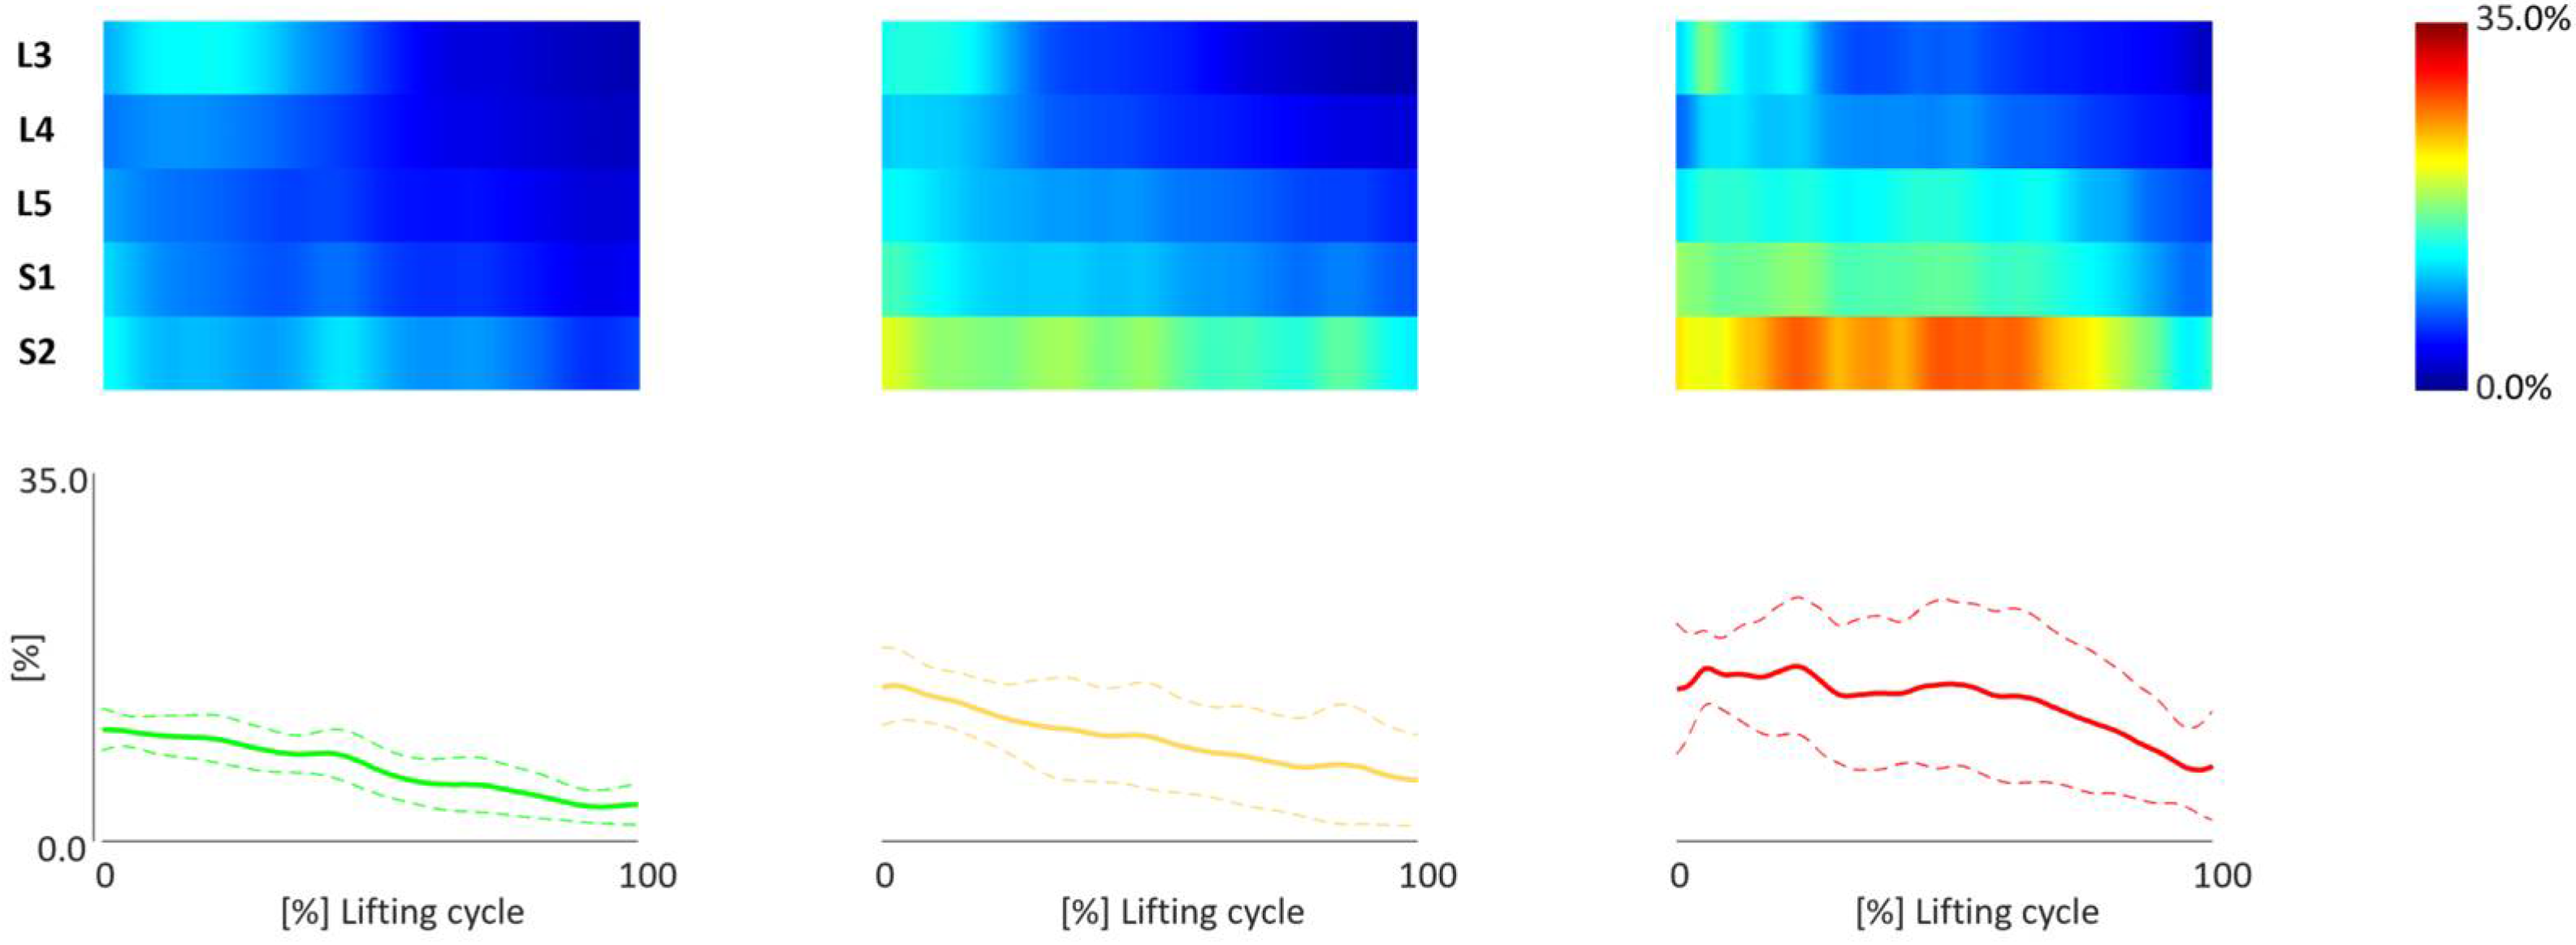
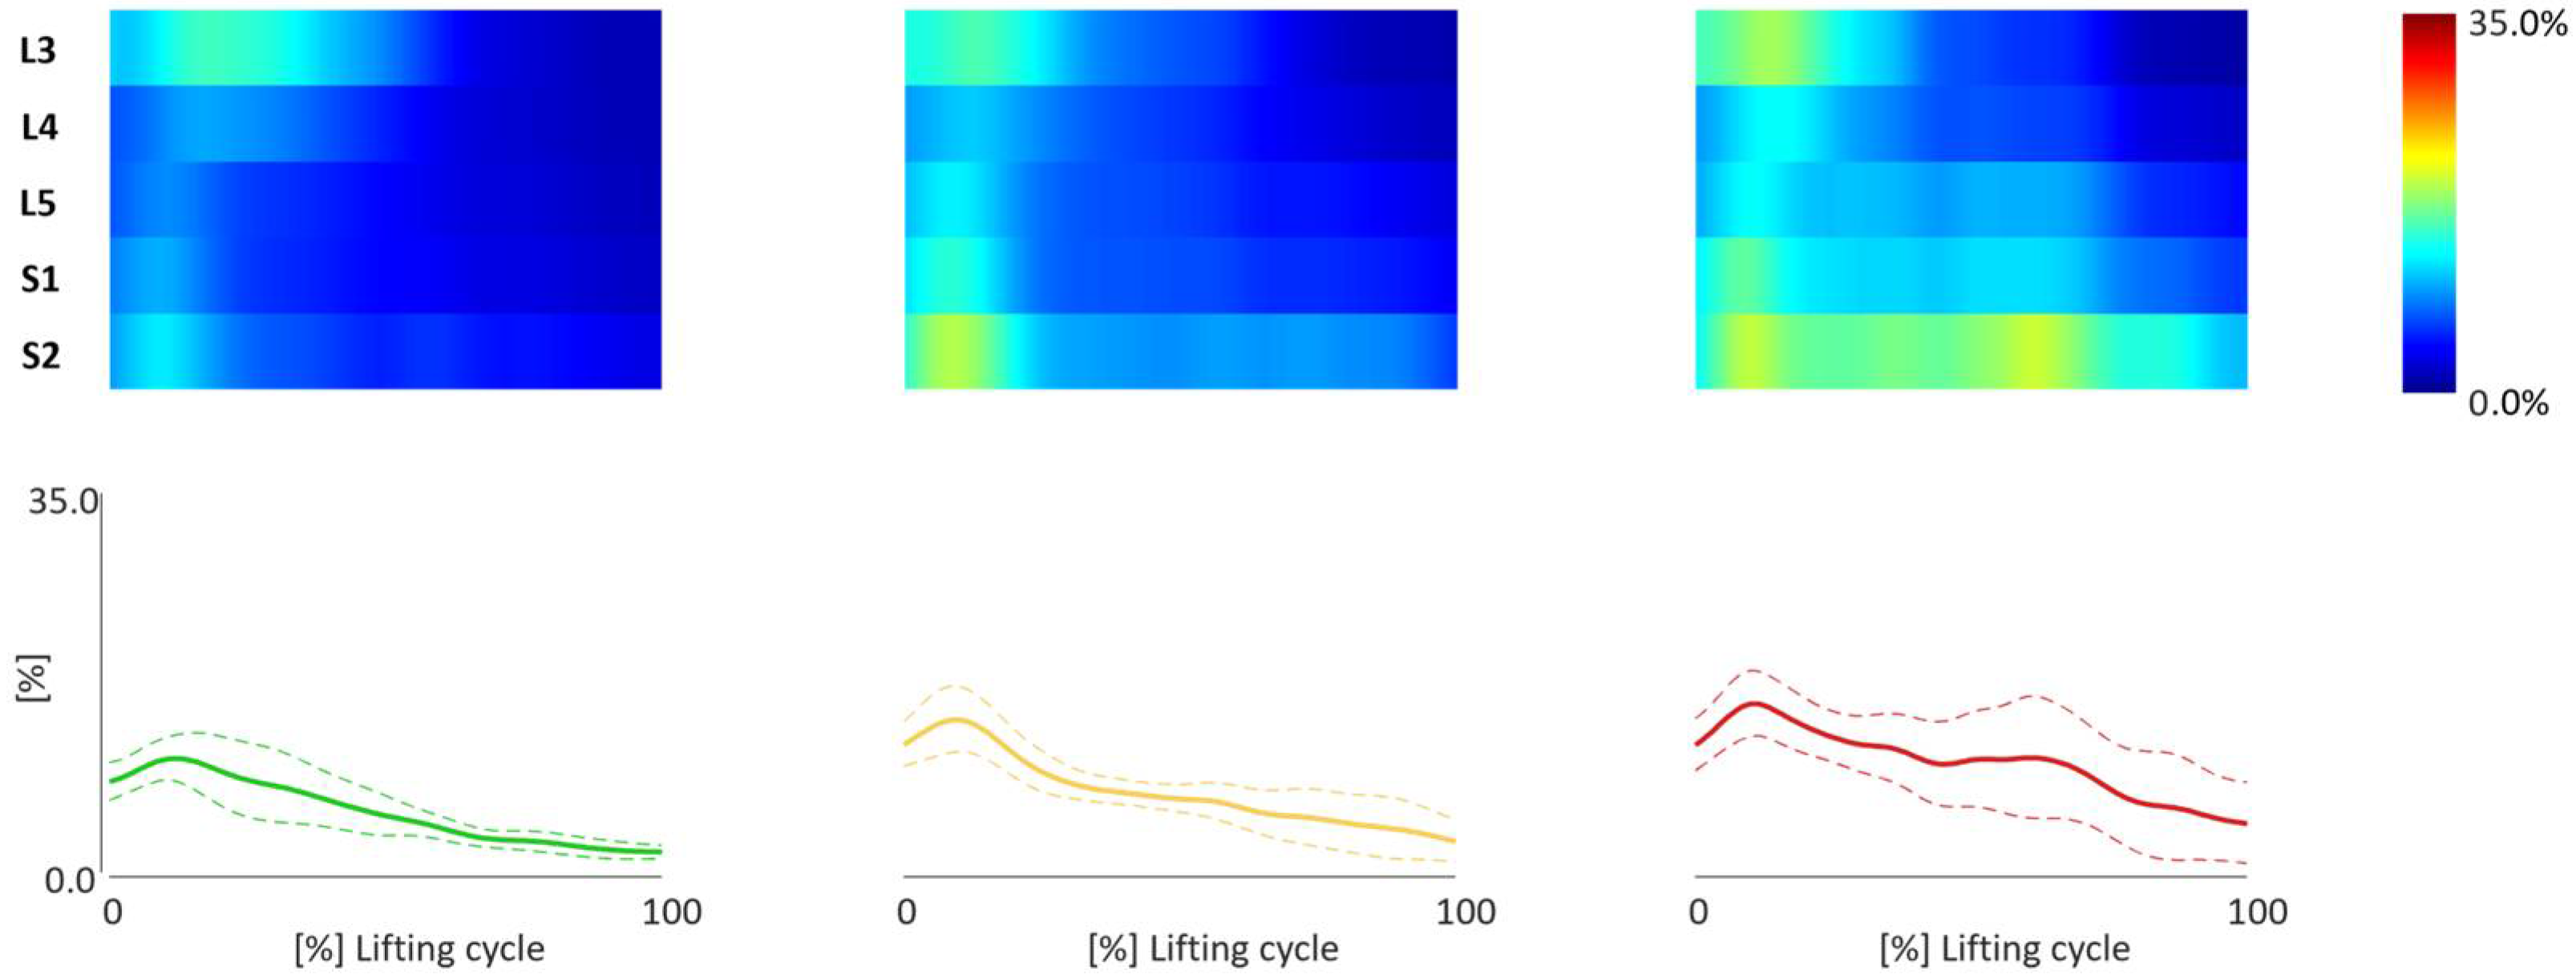
3.2. TMCf Maps
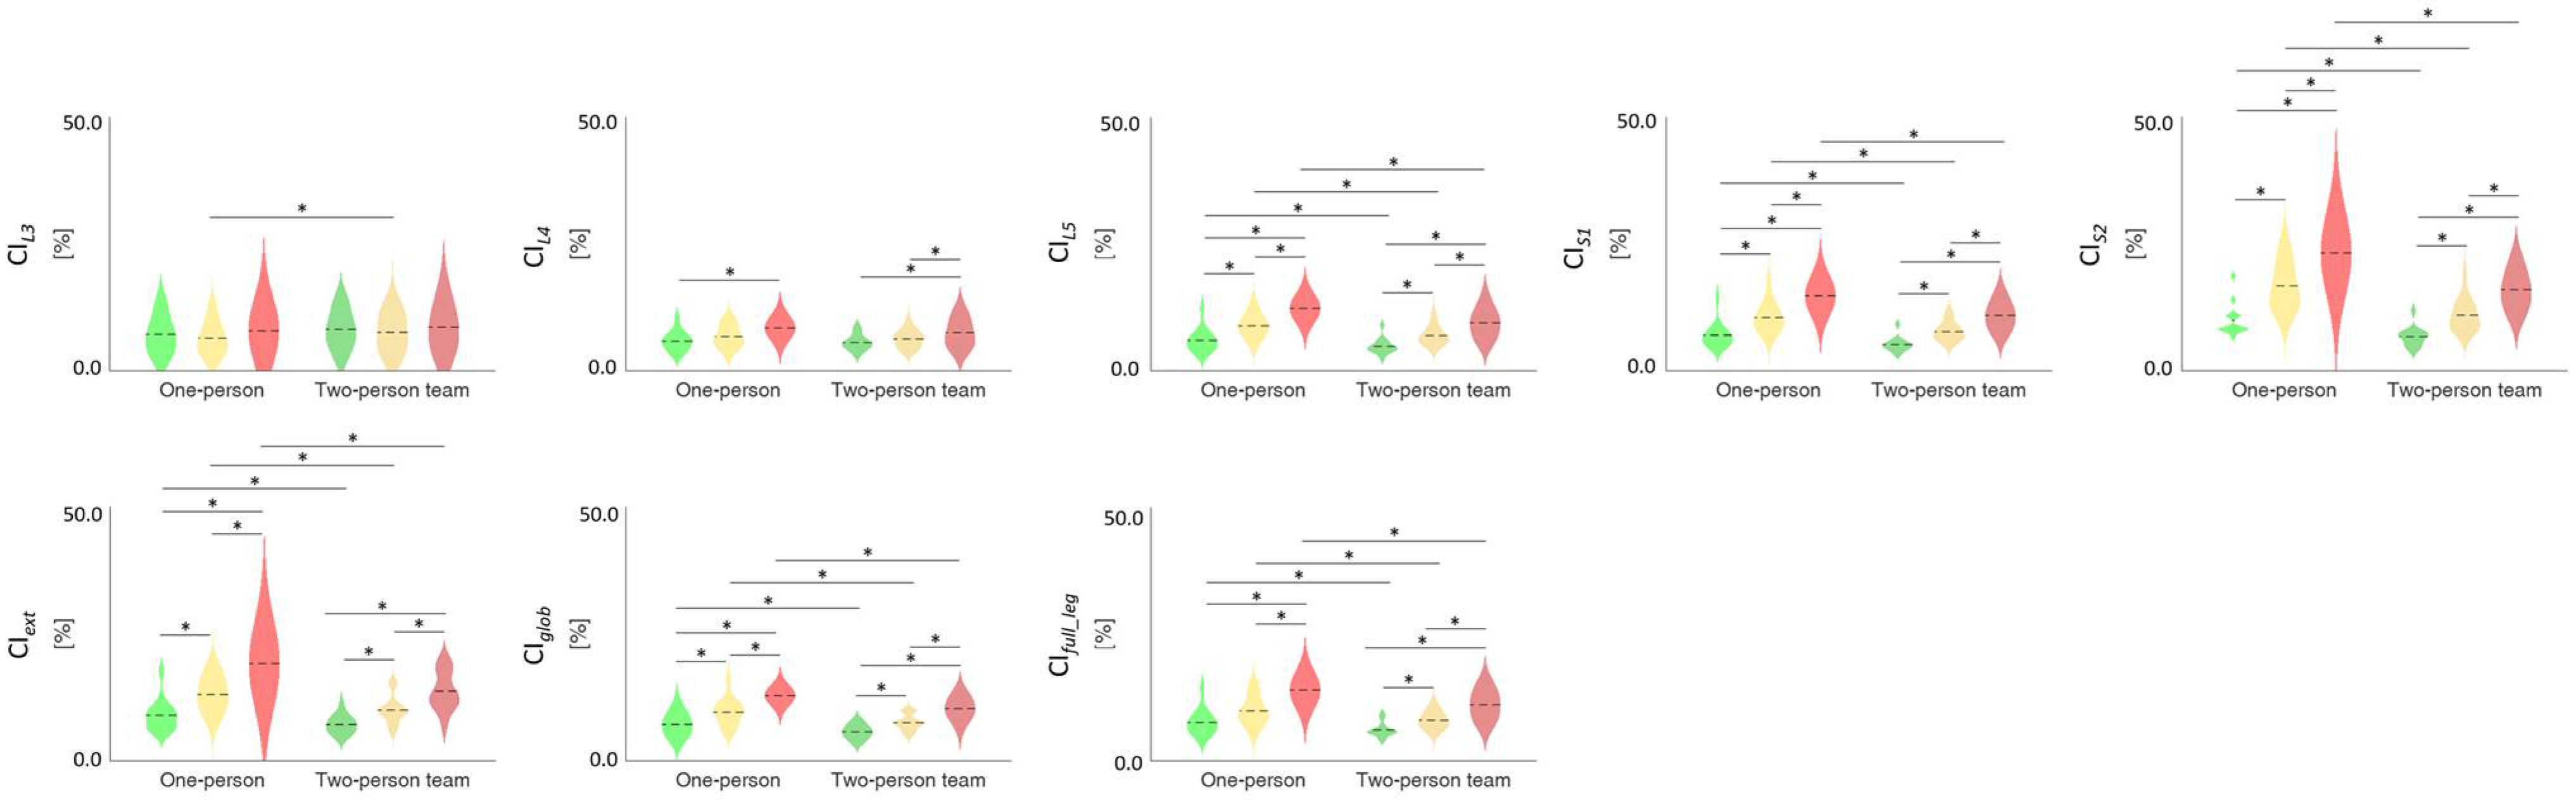
3.3. TMCf Indices
4. Discussion
5. Conclusions
Author Contributions
Funding
Institutional Review Board Statement
Informed Consent Statement
Data Availability Statement
Conflicts of Interest
References
- de Kok, J.; Vroonhof, P.; Snijders, J.; Roullis, G.; Clarke, M.; Peereboom, K.; Dorst, P.; van Isusi, I. Work-Related Musculoskeletal Disorders: Prevalence, Costs and Demographics in the EU; European Agency for Safety and Health at Work: Maastricht, The Netherlands, 2019. [Google Scholar] [CrossRef]
- Govaerts, R.; Tassignon, B.; Ghillebert, J.; Serrien, B.; De Bock, S.; Ampe, T.; El Makrini, I.; Vanderborght, B.; Meeusen, R.; De Pauw, K. Prevalence and incidence of work-related musculoskeletal disorders in secondary industries of 21st century Europe: A systematic review and meta-analysis. BMC Musculoskelet. Disord. 2021, 22, 751. [Google Scholar] [CrossRef] [PubMed]
- Violante, F.S. Criteria for diagnosis and attribution of an occupational musculoskeletal disease. Med. Lav. 2020, 111, 249. [Google Scholar]
- Bao, S.; Howard, N.; Lin, J.-H. Are work-related musculoskeletal disorders claims related to risk factors in workplaces of the manufacturing industry? Ann. Work Expo. Health 2019, 64, 152–164. [Google Scholar] [CrossRef] [PubMed]
- CWA 17938:2023; Guideline for Introducing and Implementing Real-Time Instrumental-Based Tools for Biomechanical Risk Assessment. European Committee for Standardization: Brussels, Belgium, 2023. Available online: https://researchportal.vub.be/en/publications/cwa-17938-guideline-for-introducing-and-implementing-real-time-in (accessed on 29 April 2024).
- Chini, G.; Varrecchia, T.; Tatarelli, A.; Silvetti, A.; Fiori, L.; Draicchio, F.; Ranavolo, A. Trunk muscle co-activation and activity in one-and two-person lifting. Int. J. Ind. Ergon. 2022, 89, 103297. [Google Scholar] [CrossRef]
- Waters, T.R.; Putz-Anderson, V.; Garg, A. Applications Manual for the Revised NIOSH Lifting Equation; Department of Health and Human Services: Cincinnati, OH, USA, 1994. [Google Scholar]
- ISO/TR 12295; Ergonomics—Application Document for ISO Standards on Manual Handling (ISO 11228-1, ISO 11228-2 and ISO 11228-3) and Static Working Postures (ISO 11226). ISO: Geneva, Switzerland, 2014.
- Visser, S.; van der Molen, H.F.; Kuijer, P.P.; Hoozemans, M.J.; Frings-Dresen, M.H. Evaluation of team lifting on work demands, workload and workers’ evaluation: An observational field study. Appl. Ergon. 2014, 45, 1597–1602. [Google Scholar] [CrossRef] [PubMed]
- Ajoudani, A.; Albrecht, P.; Bianchi, M.; Cherubini, A.; Del Ferraro, S.; Fraisse, P.; Fritzsche, L.; Garabini, M.; Ranavolo, A.; Rosen, P.H.; et al. Smart collaborative systems for enabling flexible and ergonomic work practices [industry activities]. IEEE Robot. Autom. Mag. 2020, 27, 169–176. [Google Scholar] [CrossRef]
- Ranavolo, A.; Ajoudani, A.; Cherubini, A.; Bianchi, M.; Fritzsche, L.; Iavicoli, S.; Sartori, M.; Silvetti, A.; Vanderborght, B.; Varrecchia, T.; et al. The sensor-based biomechanical risk assessment at the base of the need for revising of standards for human ergonomics. Sensors 2020, 20, 5750. [Google Scholar] [CrossRef] [PubMed]
- ISO 11228-1; Ergonomics—Manual Handling—Part 1: Lifting and Carrying. ISO: Geneva, Switzerland, 2021.
- Kotowski, S.E.; Davis, K.G.; Shockley, K. Impact of order and load knowledge on trunk kinematics during repeated lifting tasks. Hum. Factors 2007, 49, 808–819. [Google Scholar] [CrossRef] [PubMed]
- Graham, R.B.; Costigan, P.A.; Sadler, E.M.; Stevenson, J.M. Local dynamic stability of the lifting kinematic chain. Gait Posture 2011, 34, 561–563. [Google Scholar] [CrossRef] [PubMed]
- Graham, R.B.; Sadler, E.M.; Stevenson, J.M. Local dynamic stability of trunk movements during the repetitive lifting of loads. Hum. Mov. Sci. 2012, 31, 592–603. [Google Scholar] [CrossRef]
- Kazemi, Z.; Mazloumi, A.; Arjmand, N.; Keihani, A.; Karimi, Z.; Ghasemi, M.S.; Kordi, R. A Comprehensive Evaluation of Spine Kinematics, Kinetics, and Trunk Muscle Activities During Fatigue-Induced Repetitive Lifting. Hum. Factors 2022, 64, 997–1012. [Google Scholar] [CrossRef]
- Varrecchia, T.; Conforto, S.; De Nunzio, A.M.; Draicchio, F.; Falla, D.; Ranavolo, A. Trunk Muscle Coactivation in People with and without Low Back Pain during Fatiguing Frequency-Dependent Lifting Activities. Sensors 2022, 22, 1417. [Google Scholar] [CrossRef] [PubMed]
- Ranavolo, A.; Draicchio, F.; Varrecchia, T.; Silvetti, A.; Iavicoli, S. Wearable monitoring devices for biomechanical risk assessment at work: Current status and future challenges—A systematic review. Int. J. Environ. Res. Public Health 2018, 15, 2001, Erratum in Int. J. Environ. Res. Public Health 2018, 15, 2569. [Google Scholar] [CrossRef] [PubMed]
- Weston, E.B.; Dufour, J.S.; Lu, M.L.; Marras, W.S. Spinal loading and lift style in confined vertical space. Appl. Ergon. 2020, 84, 103021. [Google Scholar] [CrossRef] [PubMed]
- Marras, W.S.; Mirka, G.A. Electromyographic Studies of the Lumbar Trunk Musculature during the Generation of Low level Trunk Acceleration. J. Orthop. Res. 1993, 11, 811–817. [Google Scholar] [CrossRef] [PubMed]
- Granata, K.P.; Marras, W.S. The influence of trunk muscle coactivity on dynamic spinal loads. Spine 1995, 20, 913–919. [Google Scholar] [CrossRef] [PubMed]
- Ranavolo, A.; Varrecchia, T.; Iavicoli, S.; Marchesi, A.; Rinaldi, M.; Serrao, M.; Conforto, S.; Cesarelli, M.; Draicchio, F. Surface electromyography for risk assessment in work activities designed using the “revised NIOSH lifting equation”. Int. J. Ind. Ergon. 2018, 68, 34–45. [Google Scholar] [CrossRef]
- Hwang, S.; Kim, Y.; Kim, Y. Lower extremity joint kinetics and lumbar curvature during squat and stoop lifting. BMC Musculoskelet. Disord. 2009, 10, 15. [Google Scholar] [CrossRef] [PubMed]
- Alemi, M.M.; Geissinger, J.; Simon, A.A.; Chang, S.E.; Asbeck, A.T. A passive exoskeleton reduces peak and mean EMG during symmetric and asymmetric lifting. Electromyogr. Kinesiol. 2019, 47, 25–34. [Google Scholar] [CrossRef]
- Boocock, M.G.; Taylor, S.; Mawston, G.A. The influence of age on spinal and lower limb muscle activity during repetitive lifting. J. Electromyogr. Kinesiol. 2020, 55, 102482. [Google Scholar] [CrossRef]
- Brinkmann, A.; Fifelski-von Böhlen, C.; Hellmers, S.; Meyer, O.; Diekmann, R.; Hein, A. Physical Burden in Manual Patient Handling: Quantification of Lower Limb EMG Muscle Activation Patterns of Healthy Individuals Lifting Different Loads Ergonomically. HEALTHINF 2021, 5, 451–458. [Google Scholar] [CrossRef]
- Larivière, C.; Gagnon, D.; Loisel, P. A biomechanical comparison of lifting techniques between subjects with and without chronic low back pain during freestyle lifting and lowering tasks. Clin. Biomech. 2002, 17, 89–98. [Google Scholar] [CrossRef] [PubMed]
- Sakata, K.; Kogure, A.; Hosoda, M.; Isozaki, K.; Masuda, T.; Morita, S. Evaluation of the age-related changes in movement smoothness in the lower extremity joints during lifting. Gait Posture 2010, 31, 27–31. [Google Scholar] [CrossRef] [PubMed]
- INAIL. Italian Worker’s Compensation Authority Annual Report. Part IV. Statistics, Accidents and Occupational Diseases. 2022. Available online: https://bancadaticsa.inail.it (accessed on 8 April 2024).
- Varrecchia, T.; De Marchis, C.; Draicchio, F.; Schmid, M.; Conforto, S.; Ranavolo, A. Lifting activity assessment using kinematic features and neural networks. Appl. Sci. 2020, 10, 1989. [Google Scholar] [CrossRef]
- Varrecchia, T.; De Marchis, C.; Rinaldi, M.; Draicchio, F.; Serrao, M.; Schmid, M.; Conforto, S.; Ranavolo, A. Lifting activity assessment using surface electromyographic features and neural networks. Int. J. Ind. Ergon. 2018, 66, 1–9. [Google Scholar] [CrossRef]
- Latash, M.L. Muscle coactivation: Definitions, mechanisms, and functions. J. Neurophysiol. 2018, 120, 88–104. [Google Scholar] [CrossRef]
- Le, P.; Best, T.M.; Khan, S.N.; Mendel, E.; Marras, W.S. A review of methods to assess coactivation in the spine. J. Electromyogr. Kinesiol. 2017, 32, 51–60. [Google Scholar] [CrossRef] [PubMed]
- Rosa, M.C.N.; Marques, A.; Demain, S.; Metcalf, C.D.; Rodrigues, J. Methodologies to assess muscle co-contraction during gait in people with neurological impairment–a systematic literature review. J. Electromyogr. Kinesiol. 2014, 24, 179–191. [Google Scholar] [CrossRef]
- Waters, T.R.; Putz-Anderson, V.; Garg, A.; Fine, L.J. Revised NIOSH equation for the design and evaluation of manual lifting tasks. Ergonomics 1993, 36, 749–776. [Google Scholar] [CrossRef]
- Marras, W.S. Occupational low back disorder causation and control. Ergonomics 2000, 43, 880–902. [Google Scholar] [CrossRef]
- Plamondon, A.; Gagnon, M.; Desjardins, P. Validation of two 3-D segment models to calculate the net reaction forces and moments at the L5/S1 joint in lifting. Clin. BioMech. 1996, 11, 101–110. [Google Scholar] [CrossRef] [PubMed]
- Lacquaniti, F.; Ivanenko, Y.P.; Zago, M. Patterned control of human locomotion. J. Physiol. 2012, 590, 2189–2199. [Google Scholar] [CrossRef] [PubMed]
- Yakovenko, S.; Mushahwar, V.; VanderHorst, V.; Holstege, G.; Prochazka, A. Spatiotemporal activation of lumbosacral motoneurons in the locomotor step cycle. J. Neurophysiol. 2002, 87, 1542–1553. [Google Scholar] [CrossRef] [PubMed]
- Ivanenko, Y.P.; Poppele, R.E.; Lacquaniti, F. Spinal cord maps of spatiotemporal alpha-motoneuron activation in humans walking at different speeds. J. Neurophysiol. 2006, 95, 602–618. [Google Scholar] [PubMed]
- Monaco, V.; Ghionzoli, A.; Micera, S. Age-related modifications of muscle synergies and spinal cord activity during locomotion. J. Neurophysiol. 2010, 104, 2092–2102. [Google Scholar] [CrossRef] [PubMed]
- Ivanenko, Y.P.; Dominici, N.; Cappellini, G.; Di Paolo, A.; Giannini, C.; Poppele, R.E.; Lacquaniti, F. Changes in the spinal segmental motor output for stepping during development from infant to adult. J. Neurosci. 2013, 33, 3025–3036. [Google Scholar] [CrossRef] [PubMed]
- Fiori, L.; Castiglia, S.F.; Chini, G.; Draicchio, F.; Sacco, F.; Serrao, M.; Tatarelli, A.; Varrecchia, T.; Ranavolo, A. The Lower Limb Muscle Co-Activation Map during Human Locomotion: From Slow Walking to Running. Bioengineering 2024, 11, 288. [Google Scholar] [CrossRef] [PubMed]
- von Arx, M.; Liechti, M.; Connolly, L.; Bangerter, C.; Meier, M.L.; Schmid, S. From Stoop to Squat: A Comprehensive Analysis of Lumbar Loading among Different Lifting Styles. Front. Bioeng. Biotechnol. 2021, 9, 769117. [Google Scholar] [CrossRef]
- Bazrgari, B.; Shirazi-Adl, A.; Arjmand, N. Analysis of squat and stoop dynamic liftings: Muscle forces and internal spinal loads. Eur. Spine J. 2007, 16, 687–699. [Google Scholar] [CrossRef] [PubMed] [PubMed Central]
- Van Dieën, J.H.; Van Hoozemans MJ, M.; Van Toussaint, H.M. A Review of Biomechanical Studies on Stoop and Squat Lifting. Proc. Hum. Factors Ergon. Soc. Annu. Meet. 2000, 44, 643–646. [Google Scholar] [CrossRef]
- Ivanenko, Y.P.; Cappellini, G.; Dominici, N.; Poppele, R.E.; Lacquaniti, F. Modular control of limb movements during human locomotion. J. Neurosci. 2007, 27, 11149–11161. [Google Scholar] [CrossRef] [PubMed]
- Wu, G.; Van der Helm, F.C.; Veeger, H.D.; Makhsous, M.; Van Roy, P.; Anglin, C.; Nagels, J.; Karduna, A.R.; McQuade, K.; Wang, X.; et al. ISB recommendation on definitions of joint coordinate systems of various joints for the reporting of human joint motion—Part II: Shoulder, elbow, wrist and hand. J. Biomech. 2005, 38, 981–992. [Google Scholar] [CrossRef] [PubMed]
- Barbero, M.; Merletti, R.; Rainoldi, A. Atlas of Muscle Innervation Zones: Understanding Surface Electromyography and Its Applications; Springer Science & Business Media: Berlin/Heidelberg, Germany, 2012. [Google Scholar]
- Hermens, H.J.; Freriks, B.; Disselhorst-Klug, C.; Rau, G. Development of Recommendations for SEMG Sensors and Sensor Placement Procedures. J. Electromyogr. Kinesiol. 2000, 10, 361–374. [Google Scholar] [CrossRef] [PubMed]
- Merletti, R.; Cerone, G.L. Tutorial. Surface EMG Detection, Conditioning and Pre-Processing: Best Practices. J. Electromyogr. Kinesiol. 2020, 54, 102440. [Google Scholar] [CrossRef]
- Merletti, R.; Muceli, S. Tutorial. Surface EMG Detection in Space and Time: Best Practices. J. Electromyogr. Kinesiol. 2019, 49, 102363. [Google Scholar] [CrossRef] [PubMed]
- Marras, W.S.; Davis, K.G. A non-MVC EMG normalization technique for the trunk musculature: Part 1. Method development. J. Electromyogr. Kinesiol. 2001, 11, 1–9. [Google Scholar] [CrossRef] [PubMed]
- Burden, A. How should we normalize electromyograms obtained from healthy participants? What we have learned from over 25 years of research. J. Electromyogr. Kinesiol. 2001, 20, 1023–1035. [Google Scholar] [CrossRef] [PubMed]
- Kendall, F.P.; McCreary, E.K.; Provance, P.G.; Rodgers, M.M.; Romani, W.A. Muscles: Testing and Function with Posture and Pain; Lippincott Williams & Wilkins: Baltimore, MD, USA, 2005; Volume 5, pp. 1–100. [Google Scholar]
- Dewolf, A.H.; Sylos-Labini, F.; Cappellini, G.; Zhvansky, D.; Willems, P.A.; Ivanenko, Y.; Lacquaniti, F. Neuromuscular age-related adjustment of gait when moving upwards and downwards. Front. Hum. Neurosci. 2021, 15, 749366. [Google Scholar] [PubMed]
- Prilutsky, B.L. Coordination of two-and one-joint muscles: Functional consequences and implications for motor control. Mot. Control. 2000, 4, 1–44. [Google Scholar] [CrossRef]
- Sharrard, W.J.W. The segmental innervation of the lower limb muscles in man: Arris and Gale lecture delivered at the Royal College of Surgeons of England on 2nd January 1964. Ann. R. Coll. Surg. Engl. 1964, 35, 106. [Google Scholar]
- Adams, M.A.; Dolan, P. Spine biomechanics. J. Biomech. 2005, 38, 1972–1983. [Google Scholar] [CrossRef]
- Granata, K.P.; Orishimo, K.F. Response of trunk muscle coactivation to changes in spinal stability. J. Biomech. 2001, 34, 1117–1123. [Google Scholar] [CrossRef]
- Granata, K.P.; Wilson, S.E. Trunk posture and spinal stability. Clin. Biomech. 2001, 16, 650–659. [Google Scholar] [CrossRef]
- Granata, K.P.; Slota, G.P.; Wilson, S.E. Influence of fatigue in neuromuscular control of spinal stability. Hum. Factors 2004, 46, 81–91. [Google Scholar] [CrossRef]


| Task | LC (kg) | H (cm) | HM | V (cm) | VM | D (cm) | DM | A (°) | AM | F (lift/min) | FM | C | CM | L (kg) | RWL | RWLT | LI | LIT |
|---|---|---|---|---|---|---|---|---|---|---|---|---|---|---|---|---|---|---|
| A | 23 | 63 | ~0.40 | 10 | ~0.81 | 40 | ~0.93 | 0 | 1 | ≤2 | 1 | good | 1 | 7 | 6.85 | 4.59 | 1.02 | 0.51 |
| B | 23 | 60 | ~0.42 | 31 | ~0.868 | 54 | ~0.90 | 0 | 1 | ≤2 | 1 | good | 1 | 15 | 7.51 | 5.03 | 2.00 | 0.99 |
| C | 23 | 60 | ~0.42 | 10 | ~0.805 | 100 | ~0.87 | 0 | 1 | ≤2 | 1 | good | 1 | 20 | 6.67 | 4.47 | 3.00 | 1.49 |
| Muscles | Global | Full Leg | Extensor | Flexor | L3 | L4 | L5 | S1 | S2 |
|---|---|---|---|---|---|---|---|---|---|
| Rectus Abdominis Superior | ● | ||||||||
| Erector Spinae Longissimus | ● | ||||||||
| Glutes Medius | ● | ● | ● | ● | ● | ● | |||
| Rectus Femoris | ● | ● | ● | ● | ● | ||||
| Vastus Lateralis | ● | ● | ● | ● | |||||
| Vastus Medialis | ● | ● | ● | ● | ● | ||||
| Tensor Fasciae Late | ● | ● | ● | ● | ● | ● | ● | ||
| Semitendinosus | ● | ● | ● | ● | ● | ● | ● | ||
| Biceps Femoris | ● | ● | ● | ● | ● | ● | |||
| Tibialis Anterior | ● | ● | ● | ● | ● | ● | |||
| Gastrocnemio Medialis | ● | ● | ● | ● | ● | ||||
| Gastrocnemio Lateralis | ● | ● | ● | ● | ● | ||||
| Soleus | ● | ● | ● | ● | ● | ||||
| Peroneus | ● | ● | ● | ● | ● |
| Lifting Type | Risk Level | Lifting Type Risk Level | ||||
|---|---|---|---|---|---|---|
| F | p | F | p | F | p | |
| CIglob | F(1,12) = 60.402 | <0.001 | F(2,24) = 71.477 | <0.001 | F(2,24) = 0.752 | 0.482 |
| CIfull_leg | F(1,12) = 58.307 | <0.001 | F(2,24) = 72.454 | <0.001 | F(2,24) = 1.138 | 0.337 |
| CIext | F(1,12) = 82.544 | <0.001 | F(2,24) = 75.031 | <0.001 | F(2,24) = 3.975 | 0.032 |
| CIflex | F(1,12) = 2.491 | 0.141 | F(2,24) = 0.847 | 0.441 | F(2,24) = 0.328 | 0.723 |
| CIL3 | F(1,12) = 5.310 | 0.040 | F(2,24) = 2.404 | 0.112 | F(2,24) = 0.082 | 0.921 |
| CIL4 | F(1,12) = 7.219 | 0.020 | F(2,24) = 24.425 | <0.001 | F(2,24) = 0.311 | 0.735 |
| CIL5 | F(1,12) = 58.770 | <0.001 | F(2,24) = 109.746 | <0.001 | F(2,24) = 1.938 | 0.166 |
| CIS1 | F(1,12) = 83.003 | <0.001 | F(2,24) = 112.766 | <0.001 | F(2,24) = 2.105 | 0.144 |
| CIS2 | F(1,12) = 106.360 | <0.001 | F(1.322,15.861) = 103.238 | <0.001 | F(2,24) = 3.558 | 0.044 |
| Lifting Type | Risk Level | Lifting Type Risk Level | ||||
|---|---|---|---|---|---|---|
| F | p | F | p | F | p | |
| Maxglob | F(1,12) = 14.974 | 0.002 | F(2,24) = 22.637 | <0.001 | F(2,24) = 0.456 | 0.639 |
| Maxfull_leg | F(1,12) = 6.737 | 0.023 | F(2,24) = 30.956 | <0.001 | F(1.253,15.034) = 0.781 | 0.469 |
| Maxext | F(1,12) = 17.749 | 0.001 | F(2,24) = 63.992 | <0.001 | F(2,24) = 2.906 | 0.074 |
| Maxflex | F(1,12) = 0.643 | 0.438 | F(2,24) = 1.925 | 0.168 | F(1.316,15.794) = 1.344 | 0.276 |
| MaxL3 | F(1,12) = 9.122 | 0.011 | F(2,24) = 4.840 | 0.017 | F(1.302,15.624) = 1.719 | 0.212 |
| MaxL4 | F(1,12) = 24.425 | <0.001 | F(2,24) = 10.115 | 0.001 | F(1.324,15.890) = 0.536 | 0.523 |
| MaxL5 | F(1,12) = 8.044 | 0.015 | F(2,24) = 30.870 | <0.001 | F(1.232,14.780) = 0.032 | 0.903 |
| MaxS1 | F(1,12) = 40.144 | <0.001 | F(2,24) = 44.657 | <0.001 | F(1.347,16.164) = 2.340 | 0.140 |
| MaxS2 | F(1,12) = 39.398 | <0.001 | F(2,24) = 54.751 | <0.001 | F(2,24) = 1.621 | 0.219 |
Disclaimer/Publisher’s Note: The statements, opinions and data contained in all publications are solely those of the individual author(s) and contributor(s) and not of MDPI and/or the editor(s). MDPI and/or the editor(s) disclaim responsibility for any injury to people or property resulting from any ideas, methods, instructions or products referred to in the content. |
© 2024 by the authors. Licensee MDPI, Basel, Switzerland. This article is an open access article distributed under the terms and conditions of the Creative Commons Attribution (CC BY) license (https://creativecommons.org/licenses/by/4.0/).
Share and Cite
Chini, G.; Varrecchia, T.; Serrao, M.; Ranavolo, A. Lower Limb Muscle Co-Activation Maps in Single and Team Lifting at Different Risk Levels. Appl. Sci. 2024, 14, 4635. https://doi.org/10.3390/app14114635
Chini G, Varrecchia T, Serrao M, Ranavolo A. Lower Limb Muscle Co-Activation Maps in Single and Team Lifting at Different Risk Levels. Applied Sciences. 2024; 14(11):4635. https://doi.org/10.3390/app14114635
Chicago/Turabian StyleChini, Giorgia, Tiwana Varrecchia, Mariano Serrao, and Alberto Ranavolo. 2024. "Lower Limb Muscle Co-Activation Maps in Single and Team Lifting at Different Risk Levels" Applied Sciences 14, no. 11: 4635. https://doi.org/10.3390/app14114635
APA StyleChini, G., Varrecchia, T., Serrao, M., & Ranavolo, A. (2024). Lower Limb Muscle Co-Activation Maps in Single and Team Lifting at Different Risk Levels. Applied Sciences, 14(11), 4635. https://doi.org/10.3390/app14114635