
Improvements in the Wavelet Transform and Its Variations: Concepts and Applications in Diagnosing Gearbox in Non-Stationary Conditions


Abstract
1. Introduction
- A thorough overview of the analysis of Wavelet and its variations: Update the publication on Wavelet analysis, focusing on the development of improving time-frequency resolution. Particularly, the application of Wavelet analysis in fault diagnostics in industrial gearboxes is noteworthy.
- Construct a multi-component signal’s mathematical model to identify gear faults’ symptoms in a gearbox operating in non-stationary conditions: Propose a solution to identify fault symptoms via the time-frequency representation by integrating multiple wavelet analysis methods.
- Construct a proposal method combining the latest wavelet transforms and other methods.
- The proposed method provides the generation of input data sets for the neural network to autonomously classify faults, matching with the developments of the 4.0 industrial era.
2. An Overview of Wavelet Analysis
3. Wavelet Analysis for Gearbox Diagnostics
4. Methodology
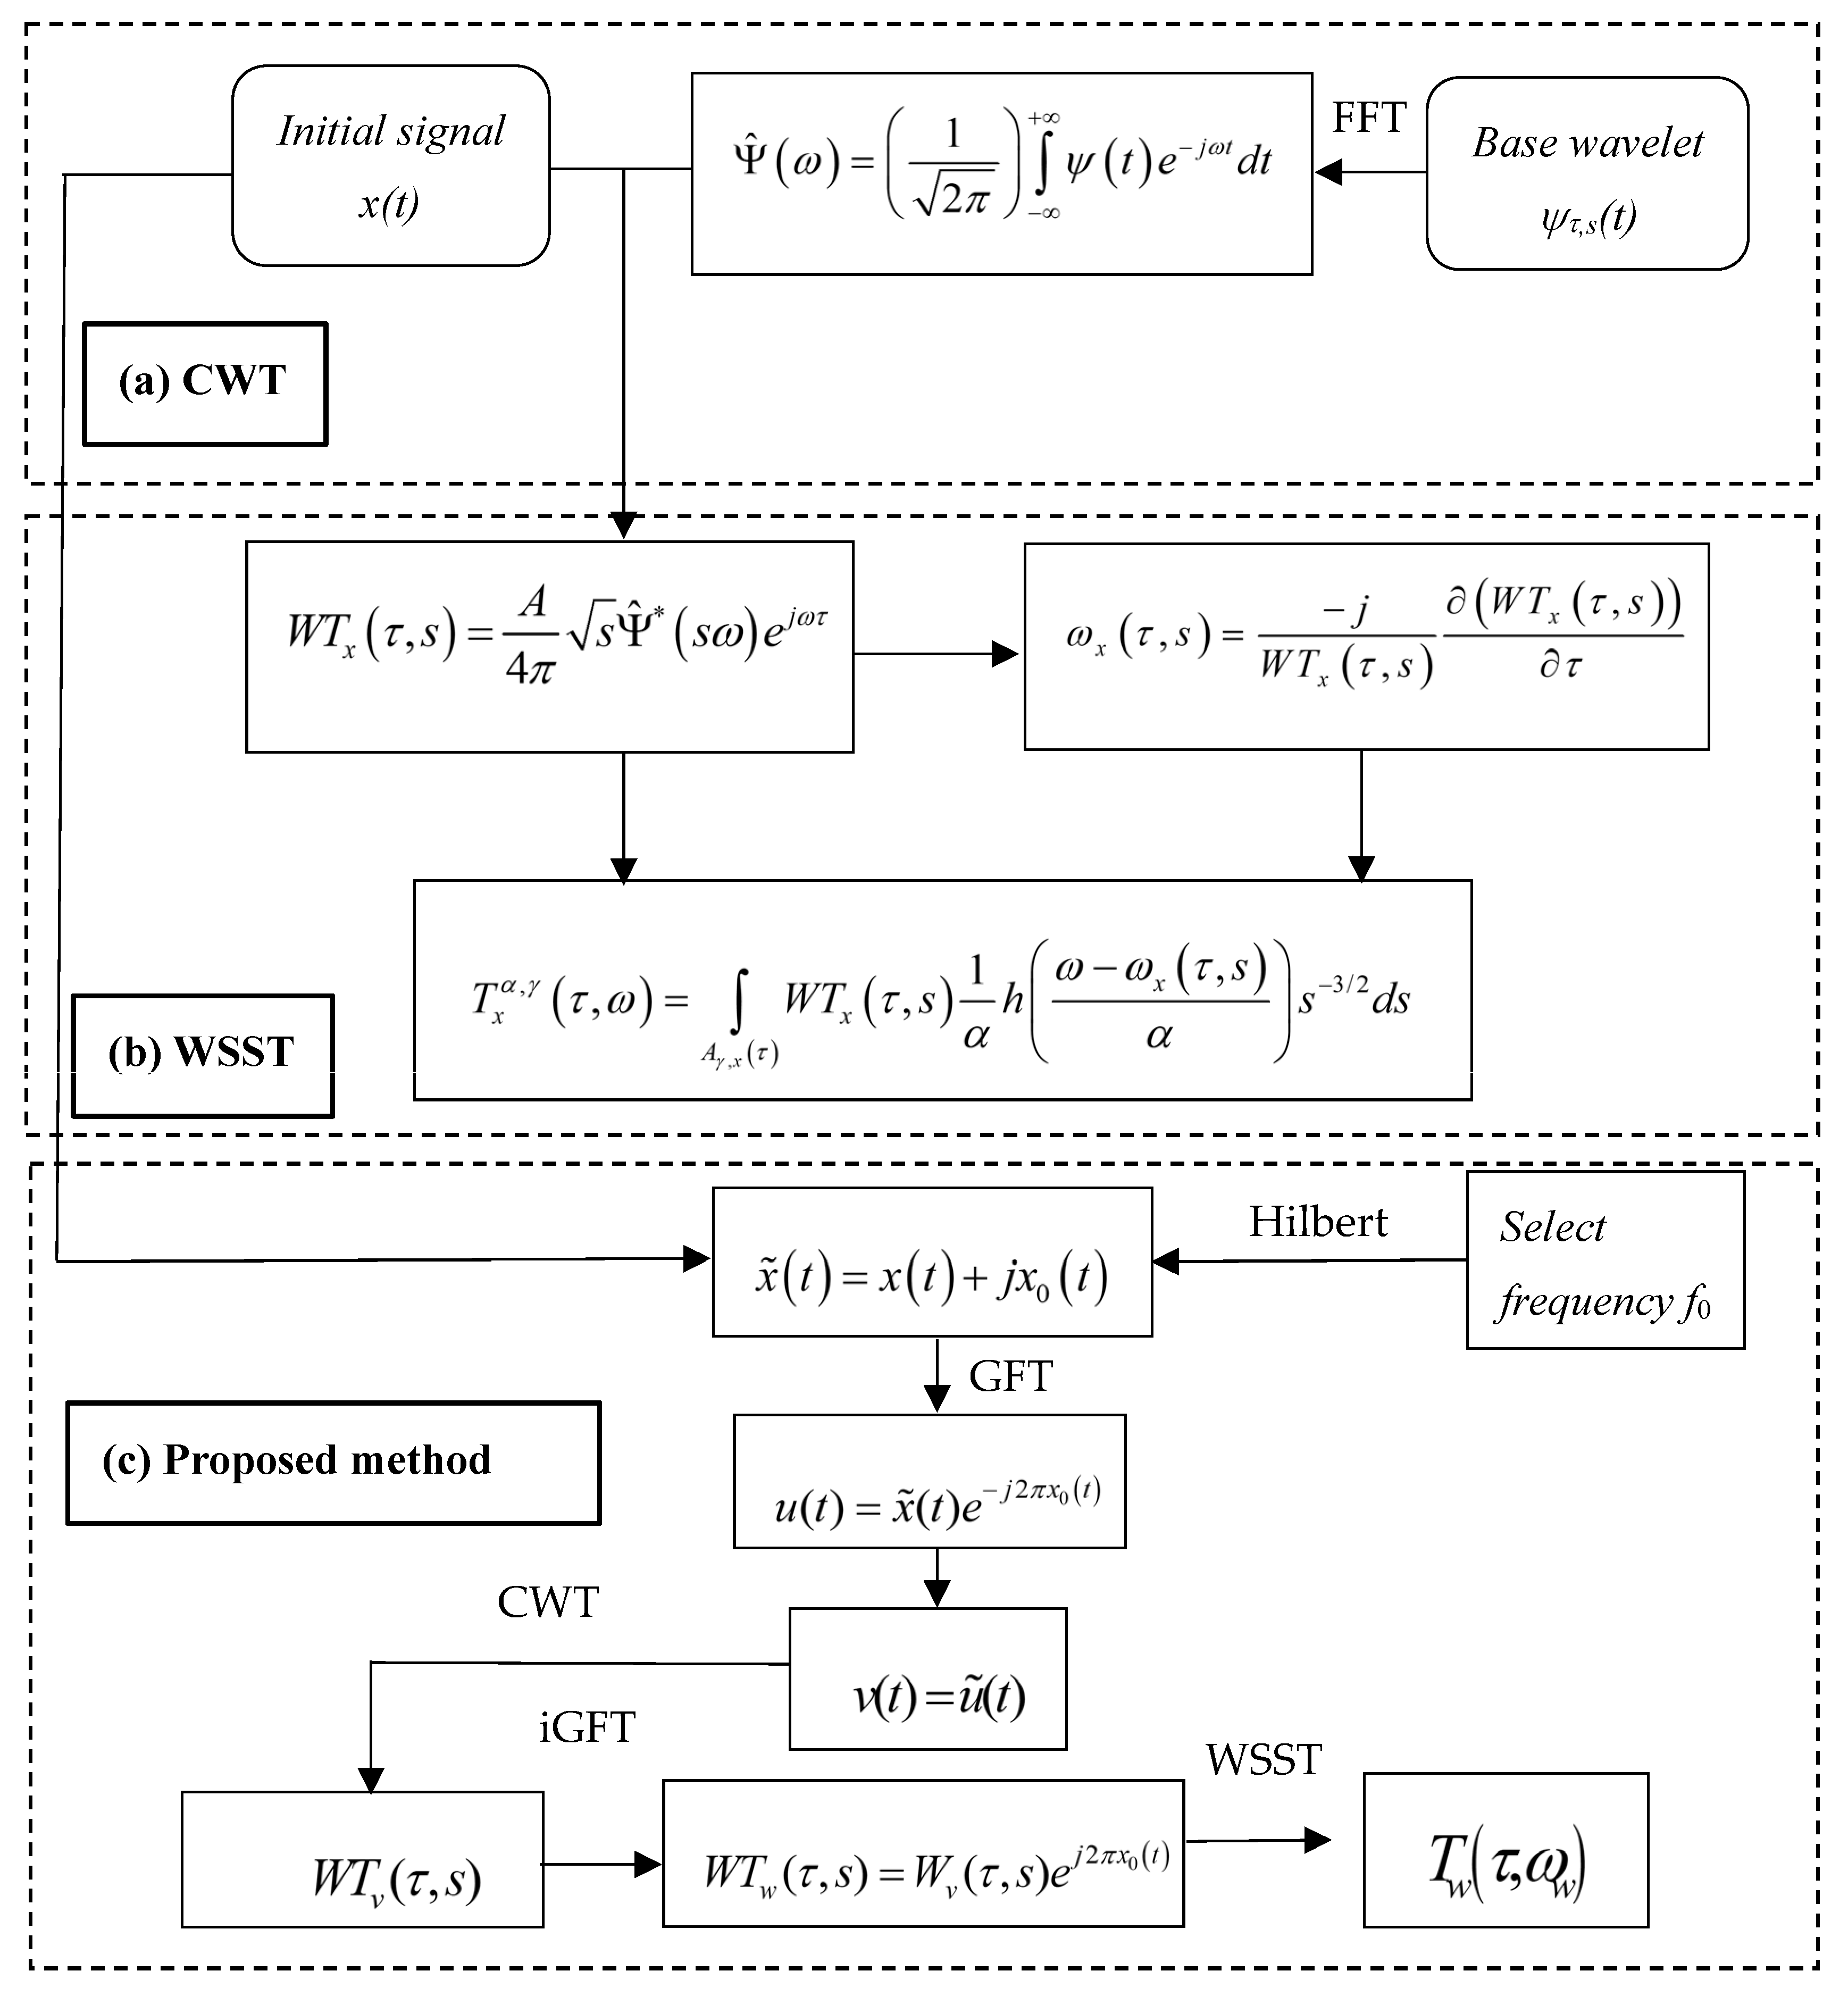
- (a)
- Execute CWT:
- Step 1 (CWT): Apply FFT to the mother wavelet function to obtain the base wavelet in the frequency domain. Then, the time-frequency representations from the raw signal and the base wavelet function in the frequency domain are calculated.
- (b)
- Execute WSST:
- Step 2 (Estimate frequency): Apply derivative to the TFR to obtain the instantaneous rotation frequency.
- Step 3 (Execute WSST): with the instantaneous rotation frequency, it is possible to squeeze the CWT’s TFR. As a result, the resolution is much better.
- (c)
- Execute the proposed method:
- Step 4 (analytic signal): select const frequency f0 to calculate phase x0(t). Then, the Hilbert transform is applied to obtain an analytic signal.
- Step 5 (execute GFT): apply GFT by multiplying the analytic signal with a reference phase e−j2πx0(t). Apply the Hilbert transform again to obtain a new analytic signal.
- Step 6 (execute CWT): convert the new signal to TFR.
- Step 7 (execute iGFT): apply inverse GFT to reconstruct the signal with separated frequency component f0.
- Step 8 (execute WSST): apply WSST to obtain the high-resolution GMF and its sidebands. Then, conclude the gear condition based on the obtained.
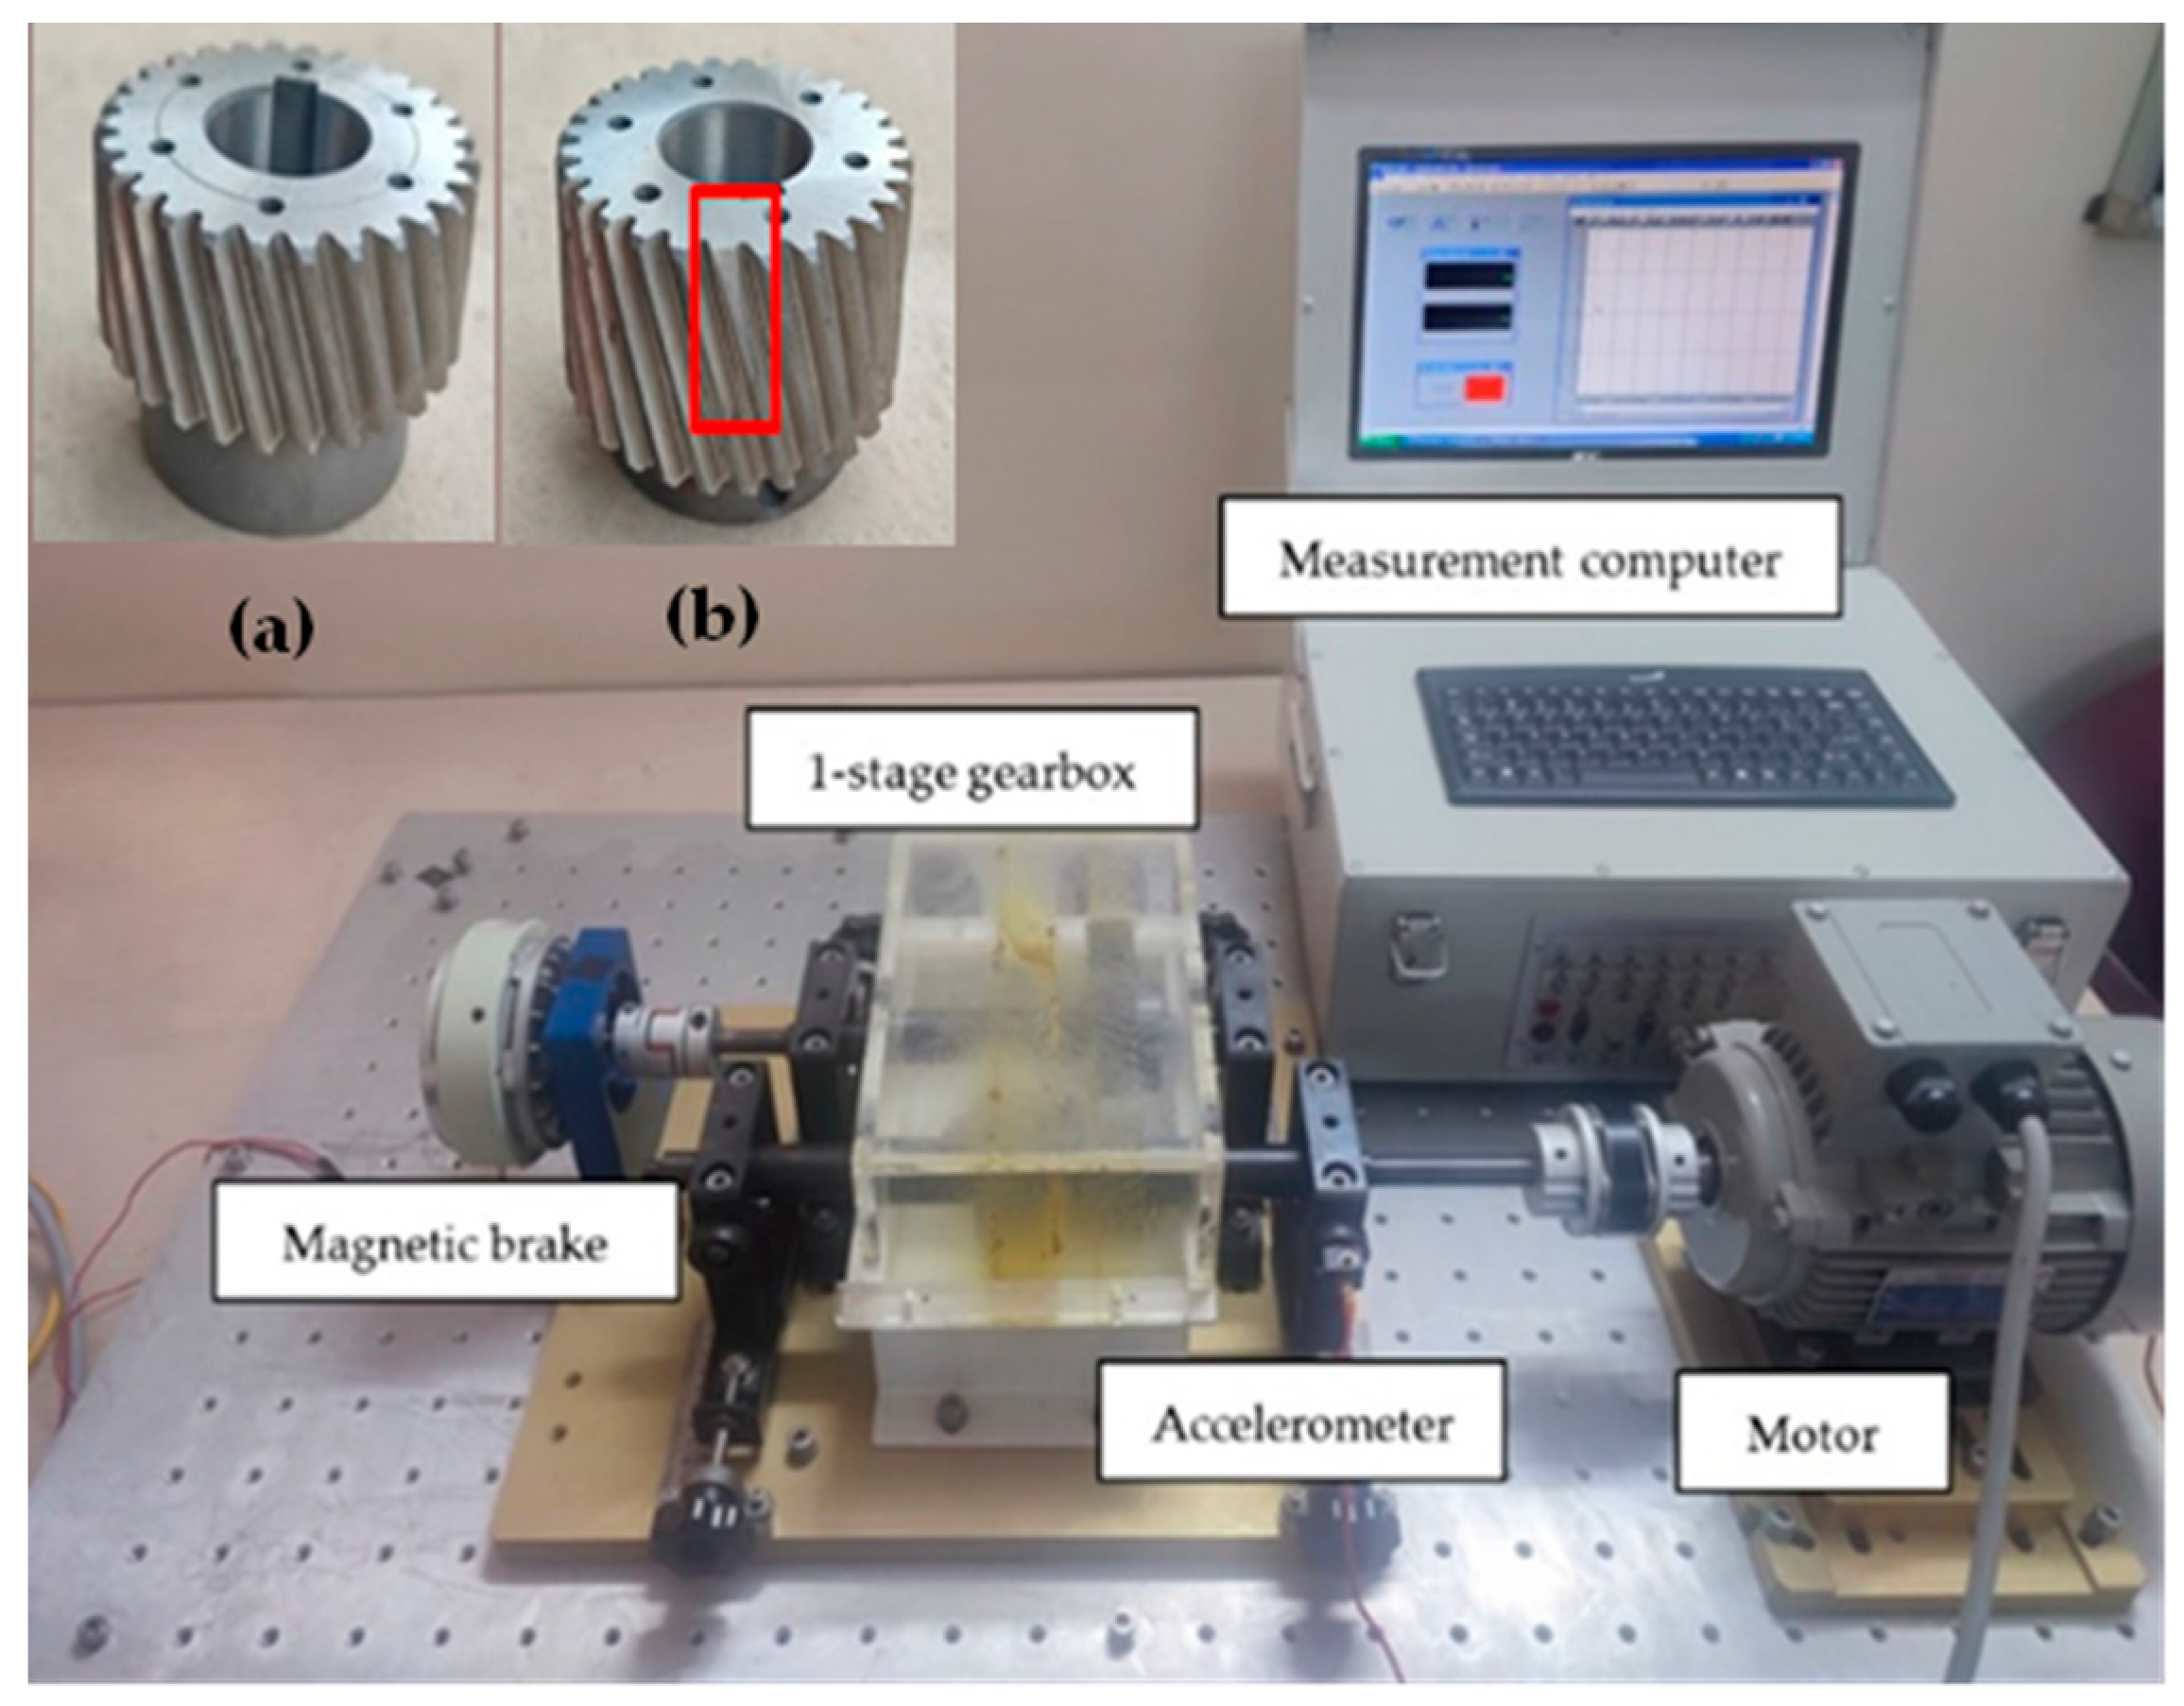
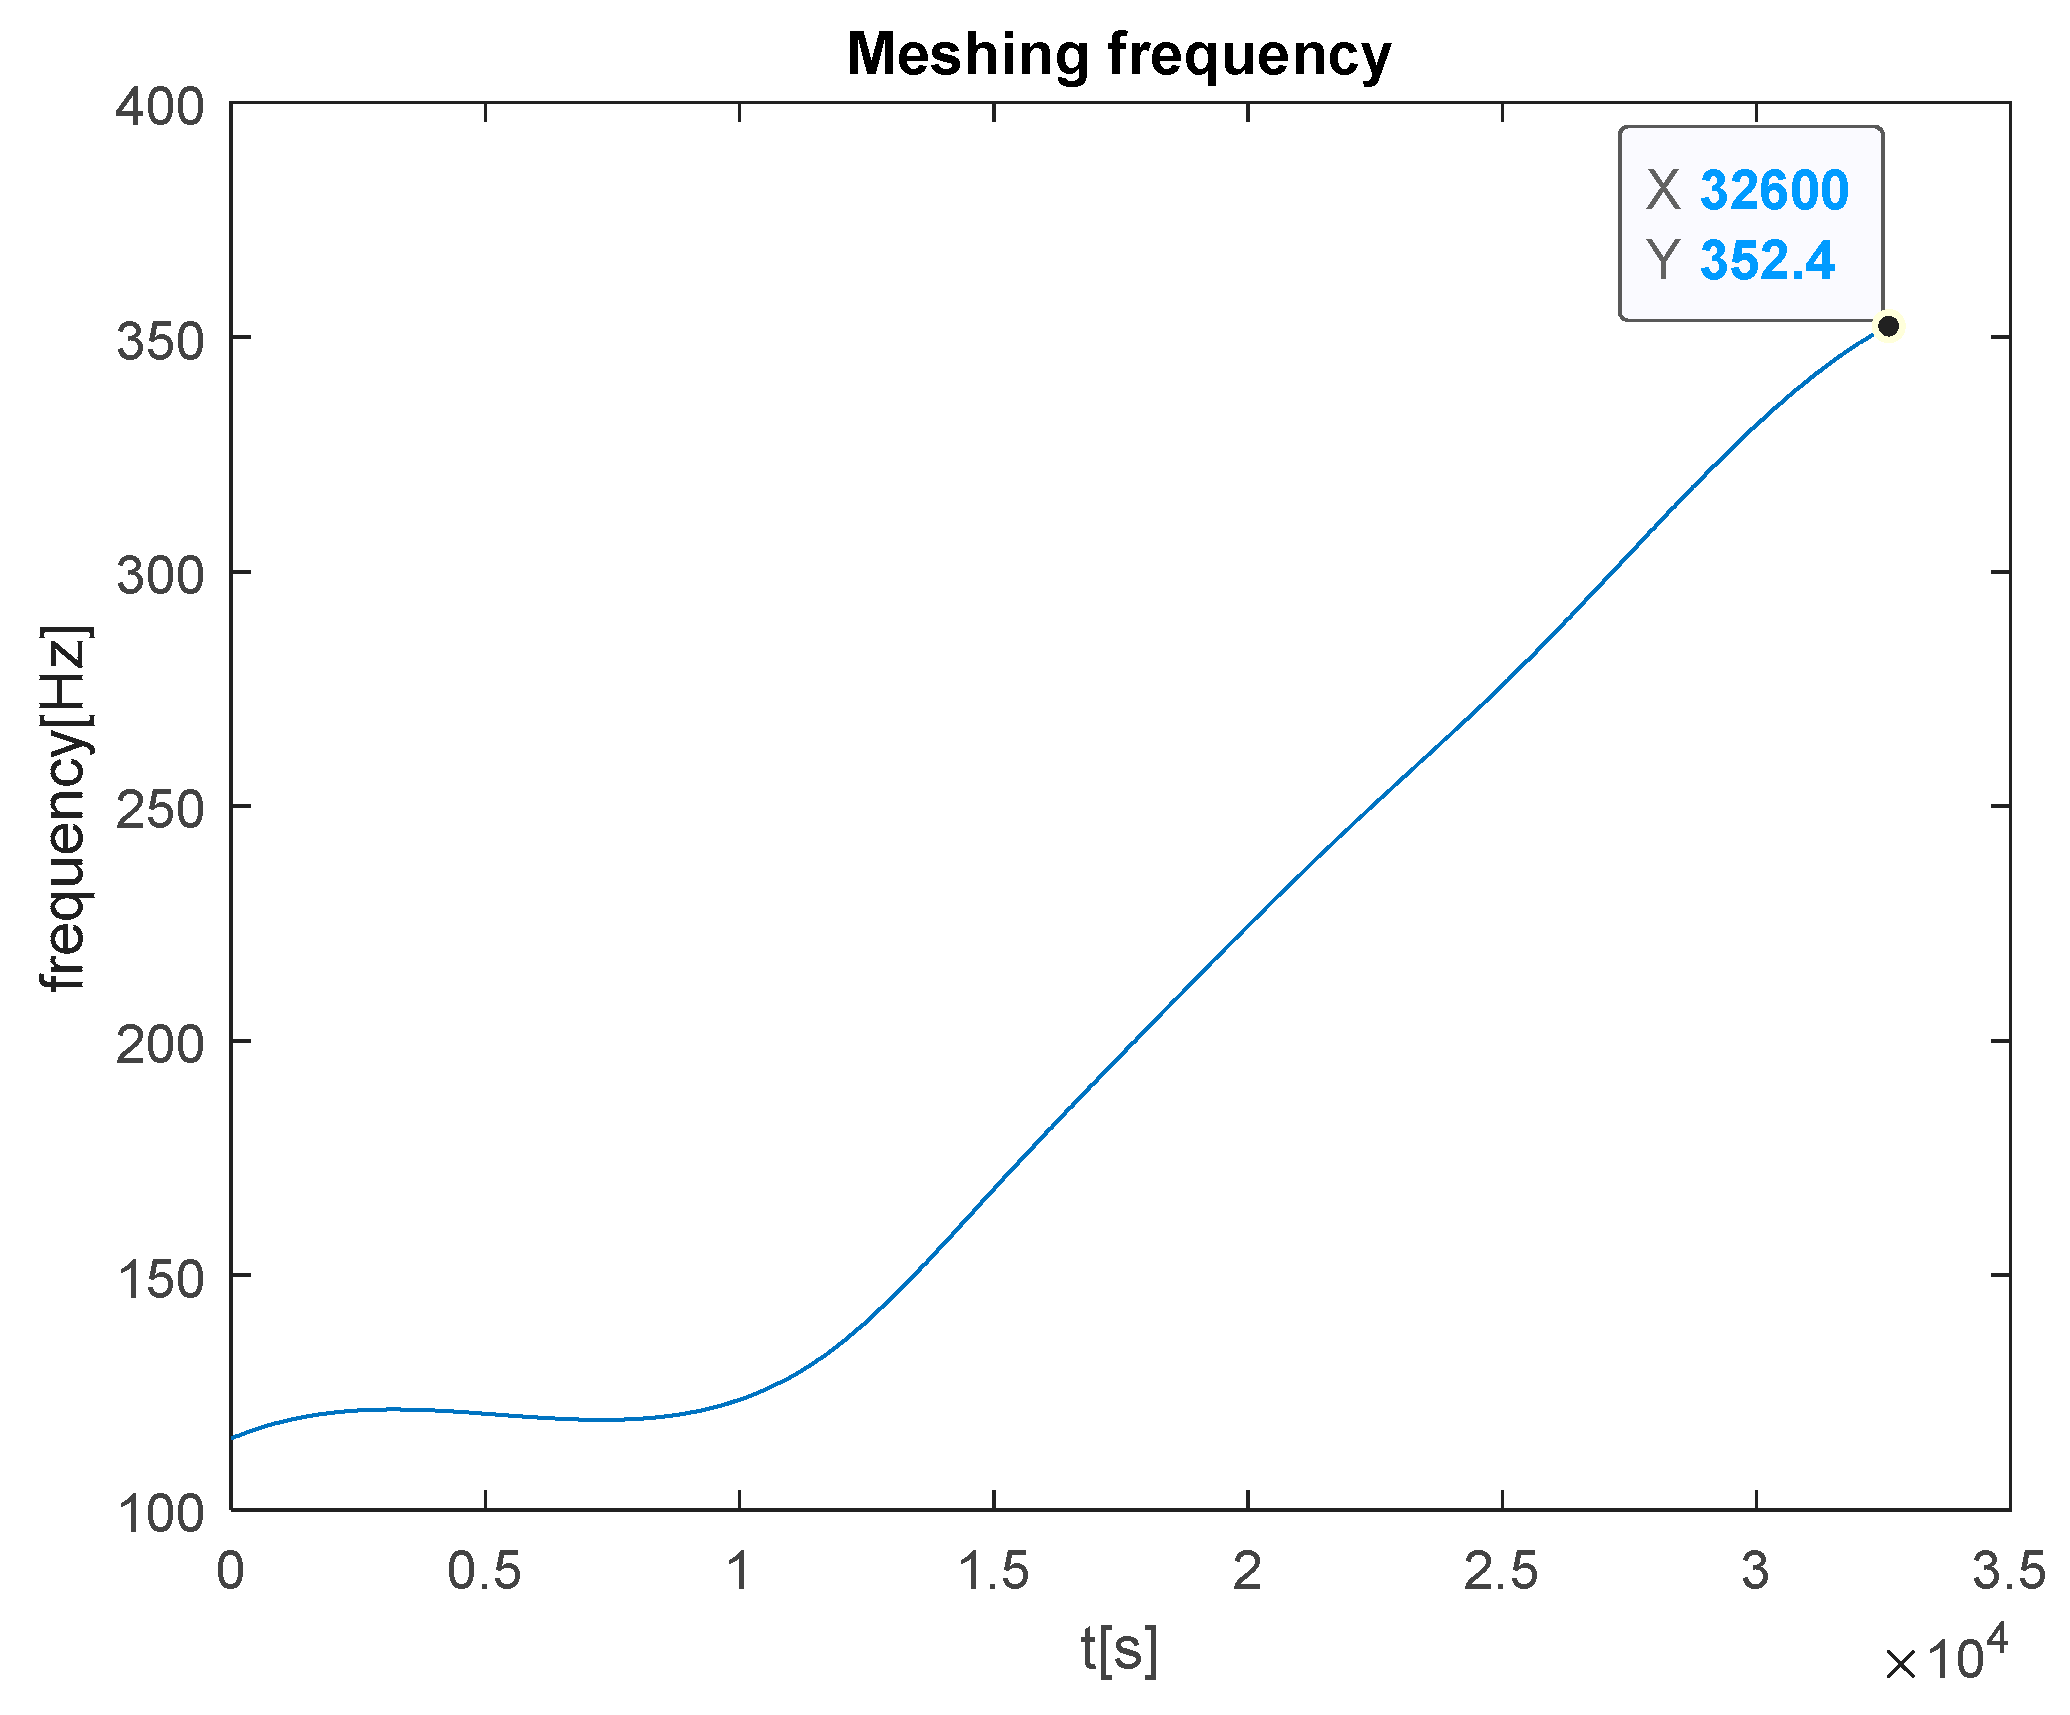
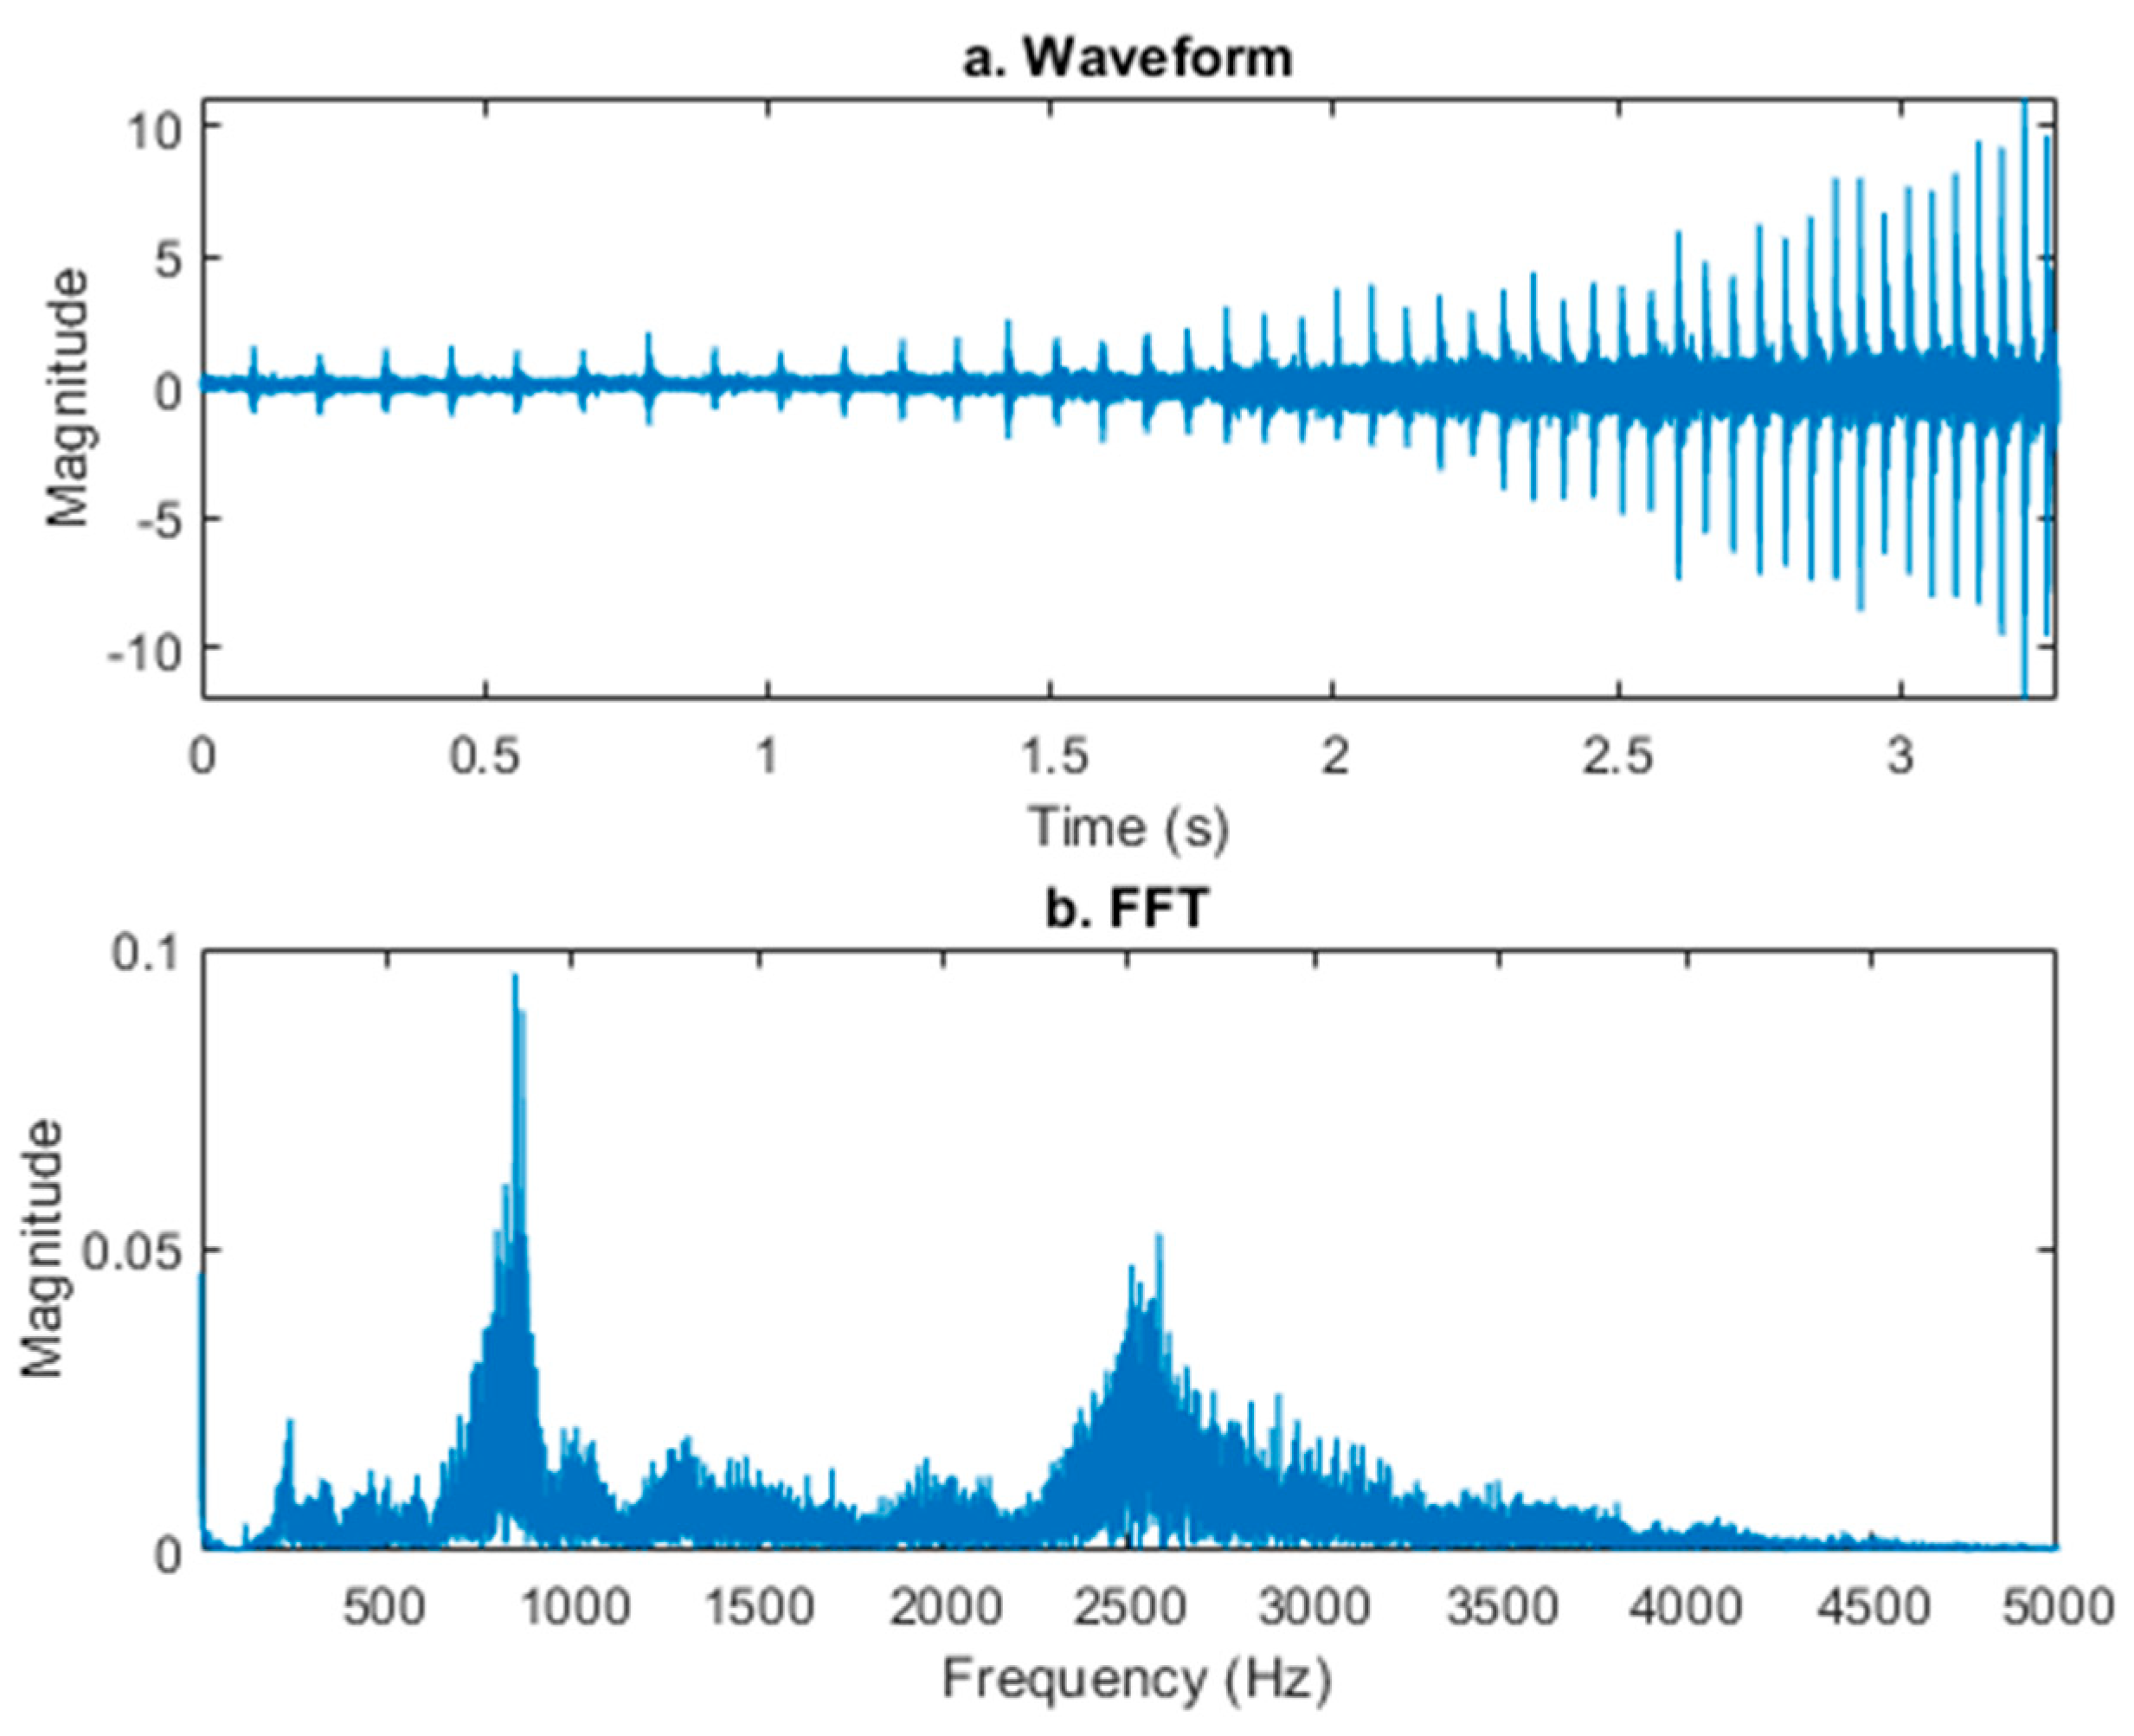
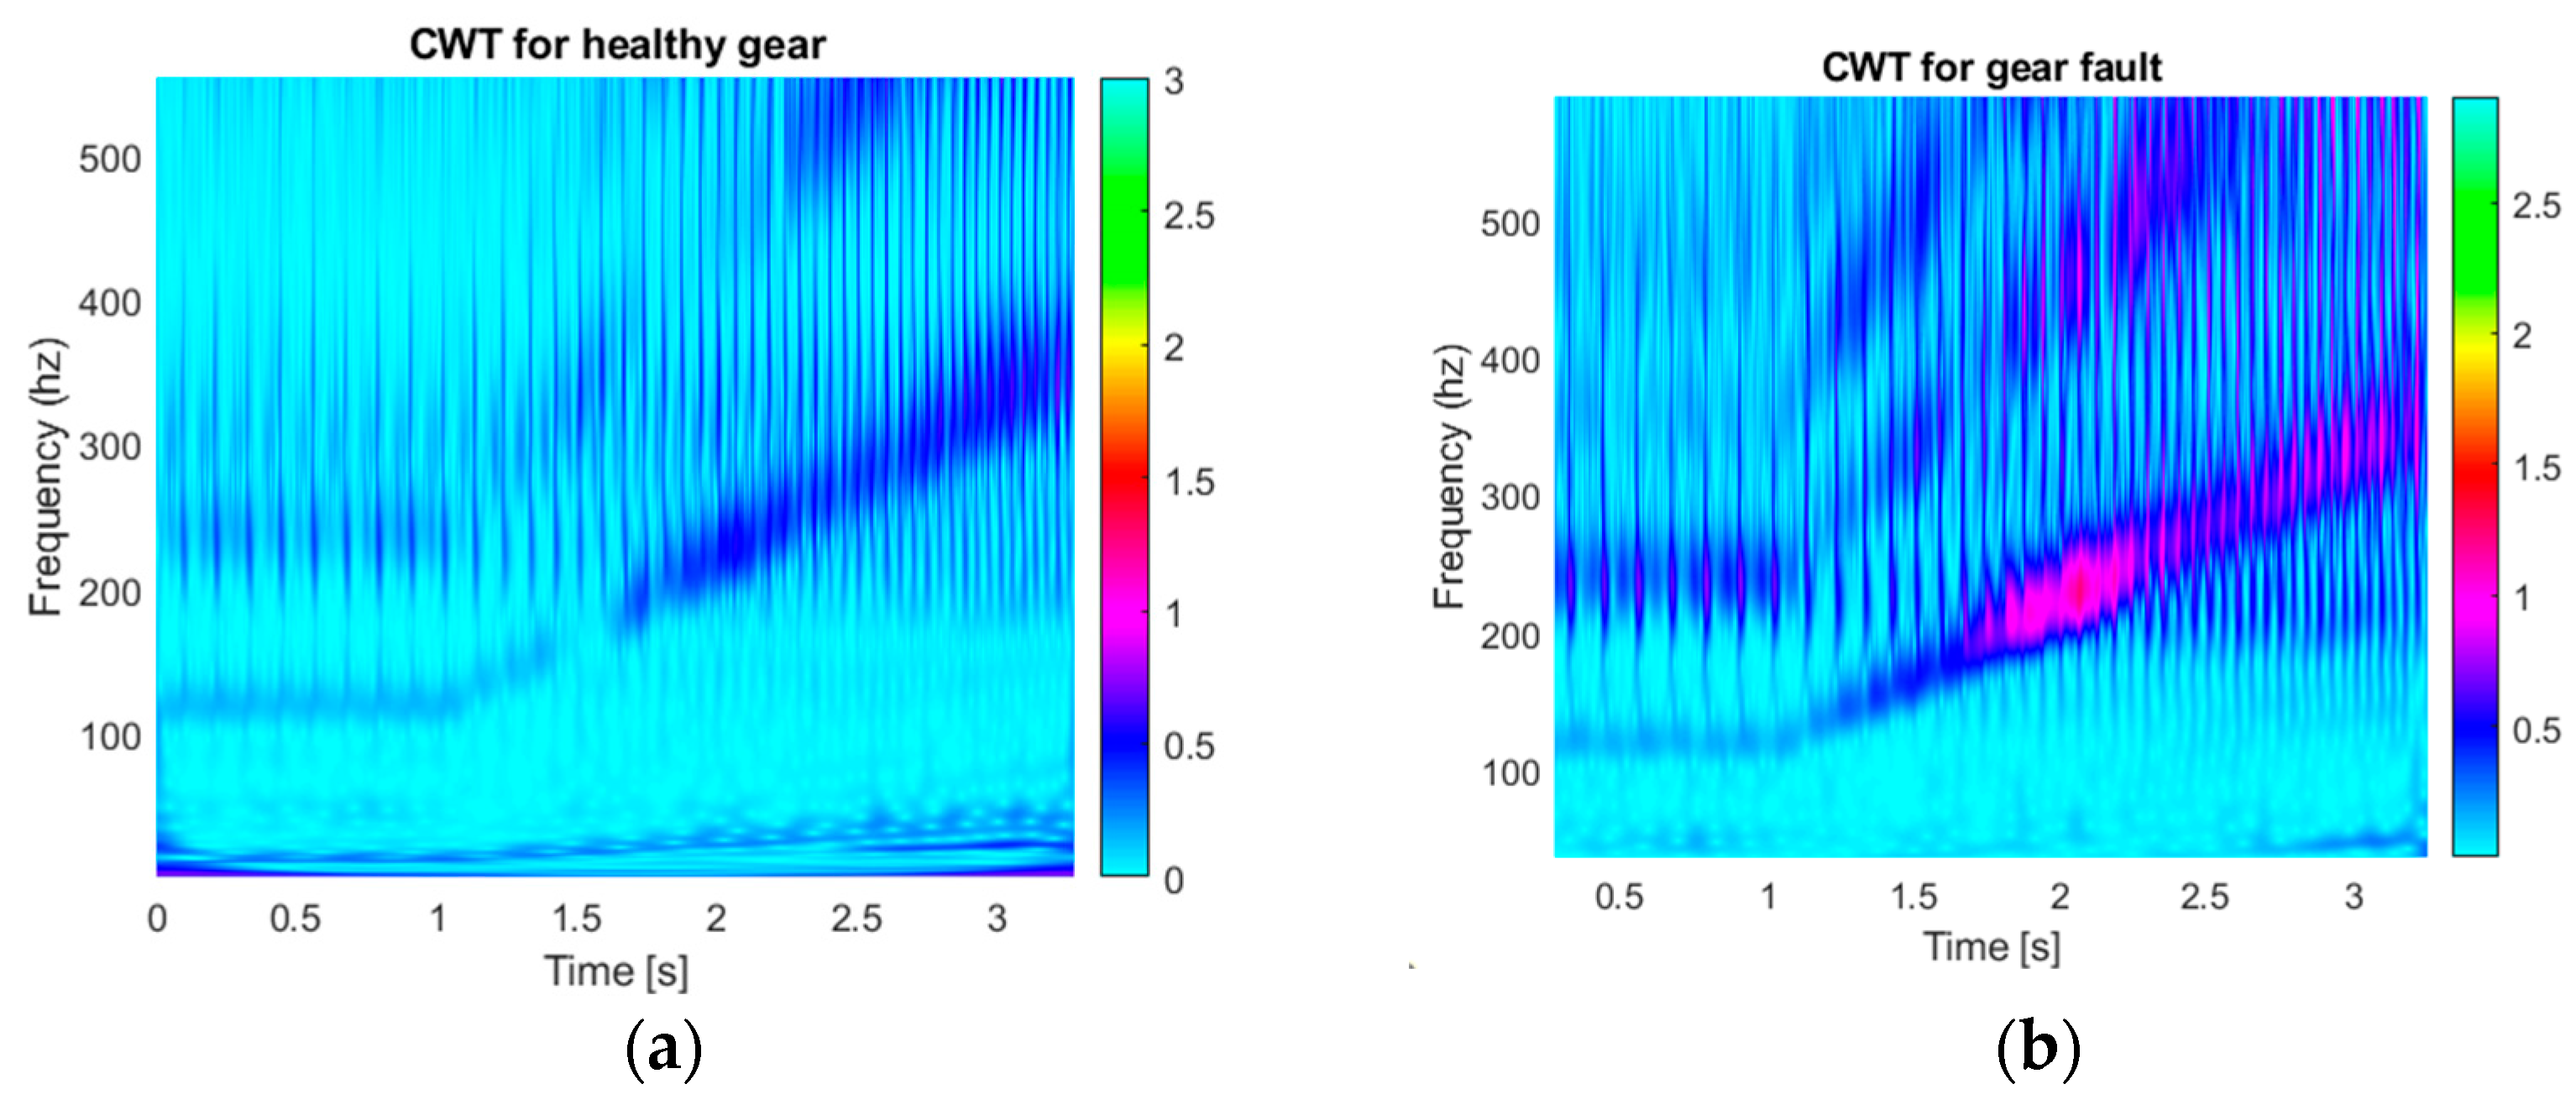
5. Experimental Test
6. Conclusions
Author Contributions
Funding
Institutional Review Board Statement
Informed Consent Statement
Data Availability Statement
Acknowledgments
Conflicts of Interest
Abbreviations
| Abbreviation | Full Name |
| CWT | Continuous Wavelet Transform |
| DWT | Discrete Wavelet Transform |
| GFT | Generalized Fourier Transform |
| iGFT | Inverse generalized Fourier Transform |
| GMF | Gear meshing frequency |
| GST | Generalized Wavelet-Based Synchrosqueezing Transform |
| ICA | Independent Component Analysis |
| multi-wavelet | Multiple Wavelet Functions |
| PCA | Principal Component Analysis |
| SVM | Support Vector Machine |
| TSA | Time Synchronous Averaging |
| TFR | Time-Frequency Represented |
| WPT | Wavelet Packet Transform |
| WSST | Wavelet-Based Synchrosqueezing Transform |
References
- Dworakowski, Z.; Jablonski, A.; Kijanka, P.; Dziedziech, K.; Uhl, T. Diagnostic approaches for epicyclic gearboxes condition monitoring. In Proceedings of the 8th European Workshop on Structural Health Monitoring, EWSHM 2016, Bilbao, Spain, 5–8 July 2016. [Google Scholar]
- Bengtsson, J. Gearbox Diagnosis; Diva: Laval, QC, USA, 2011. [Google Scholar]
- Meisingseth, A. Demodulation Techniques in Gearbox Diagnostics; Diva: Laval, QC, USA, 2012. [Google Scholar]
- Salameh, J.P.; Cauet, S.; Etien, E.; Sakout, A.; Rambault, L. Gearbox condition monitoring in wind turbines: A review. Mech. Syst. Signal Process. 2018, 111, 251–264. [Google Scholar] [CrossRef]
- Hiroaki, E.; Nader, S. Gearbox Simulation Models with Gear and Bearing Faults. In Mechanical Engineering; IntechOpen: Rijeka, Croatia, 2012. [Google Scholar]
- Frolov, K.V.; Kosarev, O.I. Vibro-excitation in the meshing of imprecise deformable vibro-excitation teeth in a spur gear: A review. Int. Appl. Mech. 1999, 35, 1081–1094. [Google Scholar] [CrossRef]
- Aherwar, A.; Khalid, M.d.S. Vibration analysis techniques for gearbox diagnostics: A review. Int. J. Adv. Eng. Technol. 2012, 3, 4–12. [Google Scholar]
- Lebold, M.; McClintic, K.; Campbell, R.; Byington, C.; Maynard, K. Review of Vibration Analysis Method for Gearbox Diagnostics and Prognostics. In Proceedings of the 54th Meeting of the Society for Machinery Failure Prevention Technology, Virginia Beach, VA, USA, 1–4 May 2000; pp. 623–634. [Google Scholar]
- Sharma, V.; Parey, A. A Review of Gear Fault Diagnosis Using Various Condition Indicators. Procedia Eng. 2016, 144, 253–263. [Google Scholar] [CrossRef]
- Munro, R.G. A review of the theory and measurement of gear transmission error. In Proceedings of the 1st IMechE International Conference on Gearbox Noise and Vibration, Cambridge, UK, 9–11 April 1991; pp. 3–10. [Google Scholar]
- Du, N.T.; Dien, N.P. Advanced Signal Decomposition Methods for Vibration Diagnosis of Rotating Machines: A Case Study at Variable Speed. In Modern Mechanics and Applications; Tien Khiem, N., Van Lien, T., Xuan Hung, N., Eds.; Lecture Notes in Mechanical, Engineering; Springer: Singapore, 2022. [Google Scholar] [CrossRef]
- Endo, H.; Randall, R.B. Enhancement of autoregressive model based gear tooth fault detection technique by the use of minimum entropy deconvolution filter. Mech. Syst. Signal Process. 2007, 21, 906–919. [Google Scholar] [CrossRef]
- Antoni, J. Fast computation of the kurtogram for the detection of transient faults. Mech. Syst. Signal Process. 2007, 21, 108–124. [Google Scholar] [CrossRef]
- Combet, F.; Gelman, L. Optimal filtering of gear signals for early damage detection based on the spectral kurtosis. Mech. Syst. Signal Process. 2009, 23, 652–668. [Google Scholar] [CrossRef]
- Barszcz, T.; Randall, R.B. Application of spectral kurtosis for detection of a tooth crack in the planetary gear of a wind turbine. Mech. Syst. Signal Process. 2009, 23, 1352–1365. [Google Scholar] [CrossRef]
- Loutas, T.H.; Sotiriades, G.; Kalaitzoglou, I.; Kostopoulos, V. Condition monitoring of a single-stage gearbox with artificially induced gear cracks utilizing on-line vibration and acoustic emission measurements. Appl. Acoust. 2009, 70, 1148–1159. [Google Scholar] [CrossRef]
- Liu, H.; Huang, W.; Wang, S.; Zhu, Z. Adaptive spectral kurtosis filtering based on Morlet wavelet and its application for signal transients detection. Signal Process. 2014, 96, 118–124. [Google Scholar] [CrossRef]
- Al-Bedoor, B.O.; Aedwesi, S.; Al-Nassar, Y. Blades condition monitoring using shaft torsional vibration signals. J. Qual. Maint. Eng. 2006, 12, 275–293. [Google Scholar] [CrossRef]
- Zhou, C.; Luo, Y.; Wei, J.; Cao, H.; Lan, H.; Zhang, W. Extraction Method of Instantaneous Frequency Feature of Torsional Vibration Signals of Tracked Vehicle Brake. Binggong Xuebao Acta Armamentarii 2023, 44, 316. [Google Scholar] [CrossRef]
- Zhang, Q.; Lu, G.; Zhang, C.; Xu, Y. Time–frequency analysis of torsional vibration signals based on the improved complete ensemble empirical mode decomposition with adaptive noise, Robust independent component analysis, and Prony’s methods. JVC J. Vib. Control. 2022, 28, 3728–3739. [Google Scholar] [CrossRef]
- Mallat, S. A Wavelet Tour of Signal Processing; Academic Press: New York, NY, USA, 1999. [Google Scholar]
- Gao, R.X.; Yan, R. Wavelets, Theory and Applications for Manufacturing; Springer: New York, NY, USA; Dordrecht, The Netherlands; Berlin/Heidelberg, Germany, 2011. [Google Scholar]
- Yan, R.; Gao, R.X.; Chen, X. Wavelets for fault diagnosis of rotary machines: A review with applications. Signal Process. 2014, 96, 1–15. [Google Scholar] [CrossRef]
- Ngui, W.K.; Leong, M.S.; Hee, L.M. Wavelet Analysis: Mother Wavelet selection methods. Appl. Mech. Mater. 2013, 939, 953–958. [Google Scholar] [CrossRef]
- Seshadrinath, J.; Singh, B.; Panigrahi, B.K. Investigation of vibration signatures for multiple fault diagnosis in variable frequency drives using complex wavelets. IEEE Trans. Power Electron. 2014, 29, 936–945. [Google Scholar] [CrossRef]
- Habbouche, H.; Benkedjouh, T.; Amirat, Y.; Benbouzid, M. Gearbox failure diagnosis using a multisensor data-fusion machine-learning-based approach. Entropy 2021, 23, 697. [Google Scholar] [CrossRef]
- Saucedo-Dorantes, J.J.; Delgado-Prieto, M.; Osornio-Rios, R.A.; Romero-Troncoso, R.D.J. Diagnosis methodology for identifying gearbox wear based on statistical time feature reduction. Proc. Inst. Mech. Eng. C J. Mech. Eng. Sci. 2018, 232, 2711–2722. [Google Scholar] [CrossRef]
- Azamfar, M.; Singh, J.; Bravo-Imaz, I.; Lee, J. Multisensor data fusion for gearbox fault diagnosis using 2-D convolutional neural network and motor current signature analysis. Mech. Syst. Signal Process. 2020, 144, 106861. [Google Scholar] [CrossRef]
- Cohen, L. Time-Frequency Analysis; Englewood Cliffs: Prentice Hall, NJ, USA, 1995. [Google Scholar]
- Boashash, B. Time-Frequency Signal Analysis; Longman Cheshire: London, UK, 1992. [Google Scholar]
- Du, N.T.; Dien, N.P.; Nga, N.T.T. Gear fault detection in gearboxes operated in non-stationary conditions based on variable sideband analysis without a tachometer. Front. Mech. Eng. 2022, 8, 1021222. [Google Scholar] [CrossRef]
- Daubechies, I.; Lu, J.; Wu, H.-T. Synchrosqueezed wavelet transform: An empirical mode decomposition-liked tool. Appl. Comput. Harmon. Anal. 2010, 30, 243–261. [Google Scholar] [CrossRef]
- Iatsenko, D.; McClintock, P.; Stefanovska, A. Linear and synchrosqueezed time–frequency representations revisited: Overview, standards of use, resolution, reconstruction, concentration, and algorithms. Digit. Signal Process. 2015, 42, 1–26. [Google Scholar] [CrossRef]
- Li, C.; Liang, M. Time-Frequency signal analysis for gearbox fault diagnosis using a generalized synchrosqueezing transform. Mech. Syst. Signal Process. 2012, 26, 205–217. [Google Scholar] [CrossRef]
- Li, C.; Liang, M. A generalized synchrosqueezing transform for enhancing signal time–frequency representation. Mech. Syst. Signal Process. 2012, 92, 2264–2274. [Google Scholar] [CrossRef]
- Zuo, M.J.; Lin, J.; Fan, X. Feature separation using ICA for a one-dimensional time series and its application in fault detection. J. Sound Vib. 2005, 287, 614–624. [Google Scholar] [CrossRef]
- Rafiee, J.; Tse, P.W. Use of autocorrelation of wavelet coefficients for fault diagnosis. Mech. Syst. Signal Process. 2009, 23, 1554–1572. [Google Scholar] [CrossRef]
- Öztürk, H.; Sabuncu, M.; Yesilyurt, I. Early detection of pitting damage in gears using mean frequency of scalogram. J. Vib. Control 2008, 14, 469–484. [Google Scholar] [CrossRef]
- Wang, X.Y.; Makis, V.; Yang, M. A wavelet approach to fault diagnosis of a gearbox under varying load conditions. J. Sound Vib. 2010, 329, 1570–1585. [Google Scholar] [CrossRef]
- Rafiee, J.; Rafiee, M.A.; Tse, P.W. Application of mother wavelet functions for automatic gear and bearing fault diagnosis. Expert Syst. Appl. 2010, 37, 4568–4579. [Google Scholar] [CrossRef]
- Sayilgan, E.; Yuce, Y.K.; Isler, Y. Investigating the Effect of Flickering Frequency Pair and Mother Wavelet Selection in Steady-State Visually-Evoked Potentials on Two-Command Brain-Computer Interfaces. IRBM 2022, 43, 594–603. [Google Scholar] [CrossRef]
- Zeinolabedini, M.; Najafzadeh, M. Comparative study of different wavelet-based neural network models to predict sewage sludge quantity in wastewater treatment plant. Environ. Monit. Assess. 2019, 191, 163. [Google Scholar] [CrossRef] [PubMed]
- Li, H.; Zhang, Y.; Zheng, H. Application of Hermitian wavelet to crack fault detection in gearbox. Mech. Syst. Signal Process. 2011, 25, 1353–1363. [Google Scholar] [CrossRef]
- Li, H.; Fu, L.; Zheng, H. Bearing fault diagnosis based on amplitude and phase map of Hermitian wavelet transform. J. Mech. Sci. Technol. 2011, 25, 2731–2740. [Google Scholar] [CrossRef]
- Chen, M.; Yu, D.; Gao, Y. Fault diagnosis of rolling bearings based on graph spectrum amplitude entropy of visibility graph. Zhendong Yu Chongji J. Vib. Shock. 2021, 40, 23–29. [Google Scholar] [CrossRef]
- Grądzki, R.; Bartoszewicz, B.; Martínez, J.E. Bearing Fault Diagnostics Based on the Square of the Amplitude Gains Method. Appl. Sci. 2023, 13, 2160. [Google Scholar] [CrossRef]
- Combet, F.; Gelman, L. An automated methodology for performing time synchronous averaging of a gearbox signal without speed sensor. Mech. Syst. Signal Process. 2007, 21, 2590–2606. [Google Scholar] [CrossRef]
- Combet, F.; Gelman, L.; Lapayne, G. Novel detection of local tooth damage in gears by the wavelet bicoherence. Mech. Syst. Signal Process. 2012, 26, 218–228. [Google Scholar] [CrossRef]
- Peng, D.; Smith, W.A.; Borghesani, P.; Randall, R.B.; Peng, Z. Comprehensive planet gear diagnostics: Use of transmission error and mesh phasing to distinguish localised fault types and identify faulty gears. Mech. Syst. Signal Process. 2019, 127, 531–550. [Google Scholar] [CrossRef]
- Kumar, V.; Kumar, S.; Sarangi, S.; Singh, O.P. Fault identification on bevel gearbox based on higher order moments. AIP Conf. Proc. 2023, 2786, 020004. [Google Scholar] [CrossRef]
- Ohue, Y.; Yoshida, A.; Seki, M. Application of the wavelet transform to health monitoring and evaluation of dynamic characteristics in gear sets. Proc. Inst. Mech. Eng. Part J J. Eng. Tribol. 2004, 218, 1–11. [Google Scholar] [CrossRef]
- Ayad, M.; Rezki, M.; Saoudi, K.; Benziane, M.; Arabi, A.; Chikouche, D. Gear Fault Diagnosis Across Autocorrelatio of Optimal Wavelet Transforms. In Proceedings of the International Conference on Control, Engineering & Information Technology Proceedings 2014, Sousse, Tunisia, 22–25 March 2014; pp. 17–21. [Google Scholar]
- Al-Raheem, K.F.; Roy, A.; Ramachandran, K.P.; Harrison, D.K.; Grainger, S. Rolling element bearing faults diagnosis based on autocorrelation of optimized: Wavelet de-noising technique. Int. J. Adv. Manuf. Technol. 2009, 40, 393–402. [Google Scholar] [CrossRef]
- Ayad, M.; Saoudi, K.; Rezki, M.; Benziane, M.; Arabi, A. Early Detection of Defects in Gear Systems Using Autocorrelation of Morlet Wavelet Transforms. Stroj. Vestn. J. Mech. Eng. 2022, 68, 56–65. [Google Scholar] [CrossRef]
- Jafarizadeh, M.A.; Hassannejad, R.; Ettefagh, M.M.; Chitsaz, S. Asynchronous input gear damage diagnosis using time averaging and wavelet filtering. Mech. Syst. Signal Process. 2008, 22, 172–201. [Google Scholar] [CrossRef]
- Li, Z.; Yan, X.; Yuan, C.; Peng, Z.; Li, L. Virtual prototype and experimental research on gear multi-fault diagnosis using wavelet-autoregressive model and principal component analysis method. Mech. Syst. Signal Process. 2011, 25, 2589–2607. [Google Scholar] [CrossRef]
- Chen, Z.; Xu, J.; Yang, D. New method of extracting weak failure information in gearbox by complex wavelet denoising. Chin. J. Mech. Eng. (Engl. Ed.) 2008, 21, 1. [Google Scholar] [CrossRef]
- Wang, Y.; He, Z.; Zi, Y. Enhancement of signal denoising and multiple fault signatures detecting in rotating machinery using dual-tree complex wavelet transform. Mech. Syst. Signal Process. 2010, 24, 119–137. [Google Scholar] [CrossRef]
- Qiang, Z.; Jieying, G.; Junming, L.; Ying, T.; Shilei, Z. Gearbox fault diagnosis using data fusion based on self-organizing map neural network. Int. J. Distrib. Sens. Netw. 2020, 16, 1550147720923476. [Google Scholar] [CrossRef]
- Chen, F.; Tang, B.; Chen, R. A novel fault diagnosis model for gearbox based on wavelet support vector machine with immune genetic algorithm. Measurement 2013, 46, 220–232. [Google Scholar] [CrossRef]
- Han, X.; Xu, J.; Song, S.; Zhou, J. Crack fault diagnosis of vibration exciter rolling bearing based on genetic algorithm–optimized Morlet wavelet filter and empirical mode decomposition. Int. J. Distrib. Sens. Netw. 2022, 18, 15501329221114566. [Google Scholar] [CrossRef]
- Su, W.; Wang, F.; Zhu, H.; Zhang, Z.; Guo, Z. Rolling element bearing faults diagnosis based on optimal Morlet wavelet filter and autocorrelation enhancement. Mech. Syst. Signal Process. 2010, 24, 1458–1472. [Google Scholar] [CrossRef]
- Kankar, P.K.; Sharma, S.C.; Harsha, S.P. Rolling element bearing fault diagnosis using wavelet transform. Neurocomputing 2011, 74, 1638–1645. [Google Scholar] [CrossRef]
- Rafiee, J.; Arvani, F.; Harifi, A.; Sadeghi, M.H. Intelligent condition monitoring of a gearbox using artificial neural network. Mech. Syst. Signal Process. 2007, 21, 1746–1754. [Google Scholar] [CrossRef]
- Rafiee, J.; Tse, P.W.; Harifi, A.; Sadeghi, M.H. A novel technique for selecting mother wavelet function using an intelligent fault diagnosis system. Expert Syst. Appl. 2009, 36, 4862–4875. [Google Scholar] [CrossRef]
- Gao, L.; Ren, Z.; Tang, W.; Wang, H.; Chen, P. Intelligent gearbox diagnosis methods based on SVM, wavelet lifting and RBR. Sensors 2010, 10, 4602. [Google Scholar] [CrossRef] [PubMed]
- Rajeswari, C.; Sathiyabhama, B.; Devendiran, S.; Manivannan, K. A Gear Fault Identification using Wavelet Transform, Rough set Based GA, ANN and C4.5 Algorithm. Procedia Eng. 2014, 97, 1831–1841. [Google Scholar] [CrossRef]
- Du, N.T.; Dien, N.P. Gear Fault Classification Using the Vibration Signal Decomposition and Neural Networks. In Advances in Engineering Research and Application; Lecture Notes in Networks and Systems; Springer: Berlin/Heidelberg, Germany, 2021. [Google Scholar] [CrossRef]
- Jedlinski, Ł.; Jonak, J. Early fault detection in gearboxes based on support vector machines and multilayer perceptron with a continuous wavelet transform. Appl. Soft Comput. 2015, 30, 636–641. [Google Scholar] [CrossRef]
- Halim, E.B.; Shoukat Choudhury, M.A.A.; Shah, S.L.; Zuo, M.J. Time domain averaging across all scales: A novel method for detection of gearbox faults. Mech. Syst. Signal Process. 2008, 22, 261–278. [Google Scholar] [CrossRef]
- Bravo-Imaz, I.; Davari Ardakani, H.; Liu, Z.; García-Arribas, A.; Arnaiz, A.; Lee, J. Motor current signature analysis for gearbox condition monitoring under transient speeds using wavelet analysis and dual-level time synchronous averaging. Mech. Syst. Signal Process. 2017, 94, 71–84. [Google Scholar] [CrossRef]
- Zhu, Z.K.; He, Z.; Wang, A.; Wang, S. Synchronous enhancement of periodic transients on polar diagram for machine fault diagnosis. Int. J. Wavelets Multiresolut. Inf. Process. 2009, 7, 427–442. [Google Scholar] [CrossRef]
- Meltzer, G.; Dien, N.P. Fault diagnosis in gears operating under non-stationary rotational speed using polar wavelet amplitude maps. Mech. Syst. Signal Process. 2004, 18, 985–992. [Google Scholar] [CrossRef]
- Feng, Z.; Chen, X.; Liang, M. Iterative generalized synchrosqueezing transform for fault diagnosis of wind turbine planetary gearbox under nonstationary conditions. Mech. Syst. Signal Process. 2015, 52, 360–375. [Google Scholar] [CrossRef]
- Yu, J.; Makis, V.; Yang, M. Wavelet Analysis based Gear Shaft Fault Detection. Int. J. Perform. Eng. 2012, 8, 233–247. [Google Scholar]
- Yang, Q.; An, D. EMD and Wavelet Transform Based Fault Diagnosis for Wind Turbine Gear Box. Adv. Mech. Eng. 2013, 9, 212836. [Google Scholar] [CrossRef]
- Vernekar, K.; Kumar, H.; Gangadharan, K.V. Gear Fault Detection Using Vibration Analysis and Continuous Wavelet Transform. Procedia Mater. Sci. 2014, 5, 1846–1852. [Google Scholar] [CrossRef]
- Wu, W.; Jing, S.; Leng, J.; Luo, C.; Hua, W. Gearbox Fault Feature Extraction Method Based on SWT and Fast Kurtogram. In Proceedings of the 2022 16th Symposium on Piezoelectricity, Acoustic Waves, and Device Applications, SPAWDA 2022, Nanjing, China, 11–14 October 2022. [Google Scholar] [CrossRef]
- Nissilä, J. Local Regularity Analysis with Wavelet Transform in Gear Tooth Failure Detection. Manag. Syst. Prod. Eng. 2017, 25, 176–182. [Google Scholar] [CrossRef]
- Elbarghathi, F.; Tran, V.T.; Gu, F.; Ball, A. Multi-stages helical gearbox fault detection using vibration signal and Morlet wavelet transform adapted by information. In Proceedings of the COMADEM 2013, Helsinki, Finland, 11–13 June 2013. [Google Scholar]
- Jiang, D.; Liu, C. Machine condition classification using deterioration feature extraction and anomaly determination. IEEE Trans. Reliab. 2011, 60, 41–48. [Google Scholar] [CrossRef]
- Li, Z.; He, Z.; Zi, Y.; Jiang, H. Rotating machinery fault diagnosis using signal-adapted lifting scheme. Mech. Syst. Signal Process. 2008, 22, 542–556. [Google Scholar] [CrossRef]
- Belsak, A.; Flasker, J. Determining cracks in gears using adaptive wavelet transform approach. Eng. Fail. Anal. 2010, 17, 664–671. [Google Scholar] [CrossRef]
- Wang, X.; Zi, Y.; He, Z. Multiwavelet construction via an adaptive symmetric lifting scheme and its applications for rotating machinery fault diagnosis. Meas. Sci. Technol. 2009, 20, 045103. [Google Scholar] [CrossRef]
- Lu, N.; Zhang, G.; Xiao, Z.; Malik, O.P. Feature Extraction Based on Adaptive Multiwavelets and LTSA for Rotating Machinery Fault Diagnosis. Shock. Vib. 2019, 2019, 1201084. [Google Scholar] [CrossRef]
- Lu, N.; Xiao, Z.; Malik, O.P. Feature extraction using adaptive multiwavelets and synthetic detection index for rotor fault diagnosis of rotating machinery. Mech. Syst. Signal Process. 2015, 52–53, 393–415. [Google Scholar] [CrossRef]
- Yuan, J.; He, Z.; Zi, Y.; Lei, Y.; Li, Z. Adaptive multiwavelets via two-scale similarity transforms for rotating machinery fault diagnosis. Mech. Syst. Signal Process. 2009, 23, 1490–1508. [Google Scholar] [CrossRef]
- Yuan, J.; Wei, Y.; Zi, Y.; Wang, Z.; Ni, X. Adaptive multiwavelet hybrid construction method and applications in fault diagnosis. Zhendong yu Chongji J. Vib. Shock. 2016, 35, 6–13. [Google Scholar] [CrossRef]
- He, S.; Zi, Y.; Wan, Z.; Chang, Y.; He, Z.; Wang, X. Application of adaptive multiwavelets via lifting scheme in bevel gear fault diagnosis. Yi Qi Yi Biao Xue Bao Chin. J. Sci. Instrum. 2014, 35, 148–153. [Google Scholar]
- Peng, F.Q.; Yu, D.J.; Luo, J.S. Sparse signal decomposition method based on multi-scale chirplet and its application to the fault diagnosis of gearboxes. Mech. Syst. Signal Process. 2011, 25, 549–557. [Google Scholar] [CrossRef]
- Olhede, S.; Walden, A.T. A generalized demodulation approach to time-frequency projections for multicomponent signals. Proc. R. Soc. A Math. Phys. Eng. Sci. 2005, 461, 2159–2179. [Google Scholar] [CrossRef]
- Dien, N.P.; Du, N.T. Gear crack detection under variable rotating speed conditions using a single channel accelerometer. Int. J. Mech. Prod. Eng. Res. Dev. 2020, 10, 127–136. [Google Scholar]
- Wang, P.; Lee, C.M. Fault diagnosis of a helical gearbox based on an adaptive empirical wavelet transform in combination with a spectral subtraction method. Appl. Sci. 2019, 9, 1696. [Google Scholar] [CrossRef]
- Li, B.; Zhang, P.L.; Wang, Z.J.; Mi, S.S.; Liu, D.S. Application of S transform and morphological pattern spectrum for gear fault diagnosis. Proc. Inst. Mech. Eng. Part C J. Mech. Eng. Sci. 2011, 225, 2963–2972. [Google Scholar] [CrossRef]
- Hazra, B.; Narasimhan, S. Gearbox Fault Detection Using Synchro-squeezing Transform. Procedia Eng. 2016, 144, 187–194. [Google Scholar] [CrossRef]
- Wu, J.; Hu, J.; Xu, Y. Fault diagnosis method of rolling bearing based on threshold denoising synchrosqueezing transform and CNN. J. Southeast Univ. (Engl. Ed.) 2020, 36, 32. [Google Scholar] [CrossRef]
- He, D.; Cao, H. Downsampling-based synchrosqueezing transform and its applications on large-scale vibration data. J. Sound Vib. 2021, 496, 115938. [Google Scholar] [CrossRef]


Disclaimer/Publisher’s Note: The statements, opinions and data contained in all publications are solely those of the individual author(s) and contributor(s) and not of MDPI and/or the editor(s). MDPI and/or the editor(s) disclaim responsibility for any injury to people or property resulting from any ideas, methods, instructions or products referred to in the content. |
© 2024 by the authors. Licensee MDPI, Basel, Switzerland. This article is an open access article distributed under the terms and conditions of the Creative Commons Attribution (CC BY) license (https://creativecommons.org/licenses/by/4.0/).
Share and Cite
Nguyen, T.-D.; Nguyen, P.-D. Improvements in the Wavelet Transform and Its Variations: Concepts and Applications in Diagnosing Gearbox in Non-Stationary Conditions. Appl. Sci. 2024, 14, 4642. https://doi.org/10.3390/app14114642
Nguyen T-D, Nguyen P-D. Improvements in the Wavelet Transform and Its Variations: Concepts and Applications in Diagnosing Gearbox in Non-Stationary Conditions. Applied Sciences. 2024; 14(11):4642. https://doi.org/10.3390/app14114642
Chicago/Turabian StyleNguyen, Trong-Du, and Phong-Dien Nguyen. 2024. "Improvements in the Wavelet Transform and Its Variations: Concepts and Applications in Diagnosing Gearbox in Non-Stationary Conditions" Applied Sciences 14, no. 11: 4642. https://doi.org/10.3390/app14114642
APA StyleNguyen, T.-D., & Nguyen, P.-D. (2024). Improvements in the Wavelet Transform and Its Variations: Concepts and Applications in Diagnosing Gearbox in Non-Stationary Conditions. Applied Sciences, 14(11), 4642. https://doi.org/10.3390/app14114642