
Experimental Parametric Study on Flow Separation Control Mechanisms around NACA0015 Airfoil Using a Plasma Actuator with Burst Actuation over Reynolds Numbers of 105–106


Abstract
:1. Introduction
2. Experimental Method
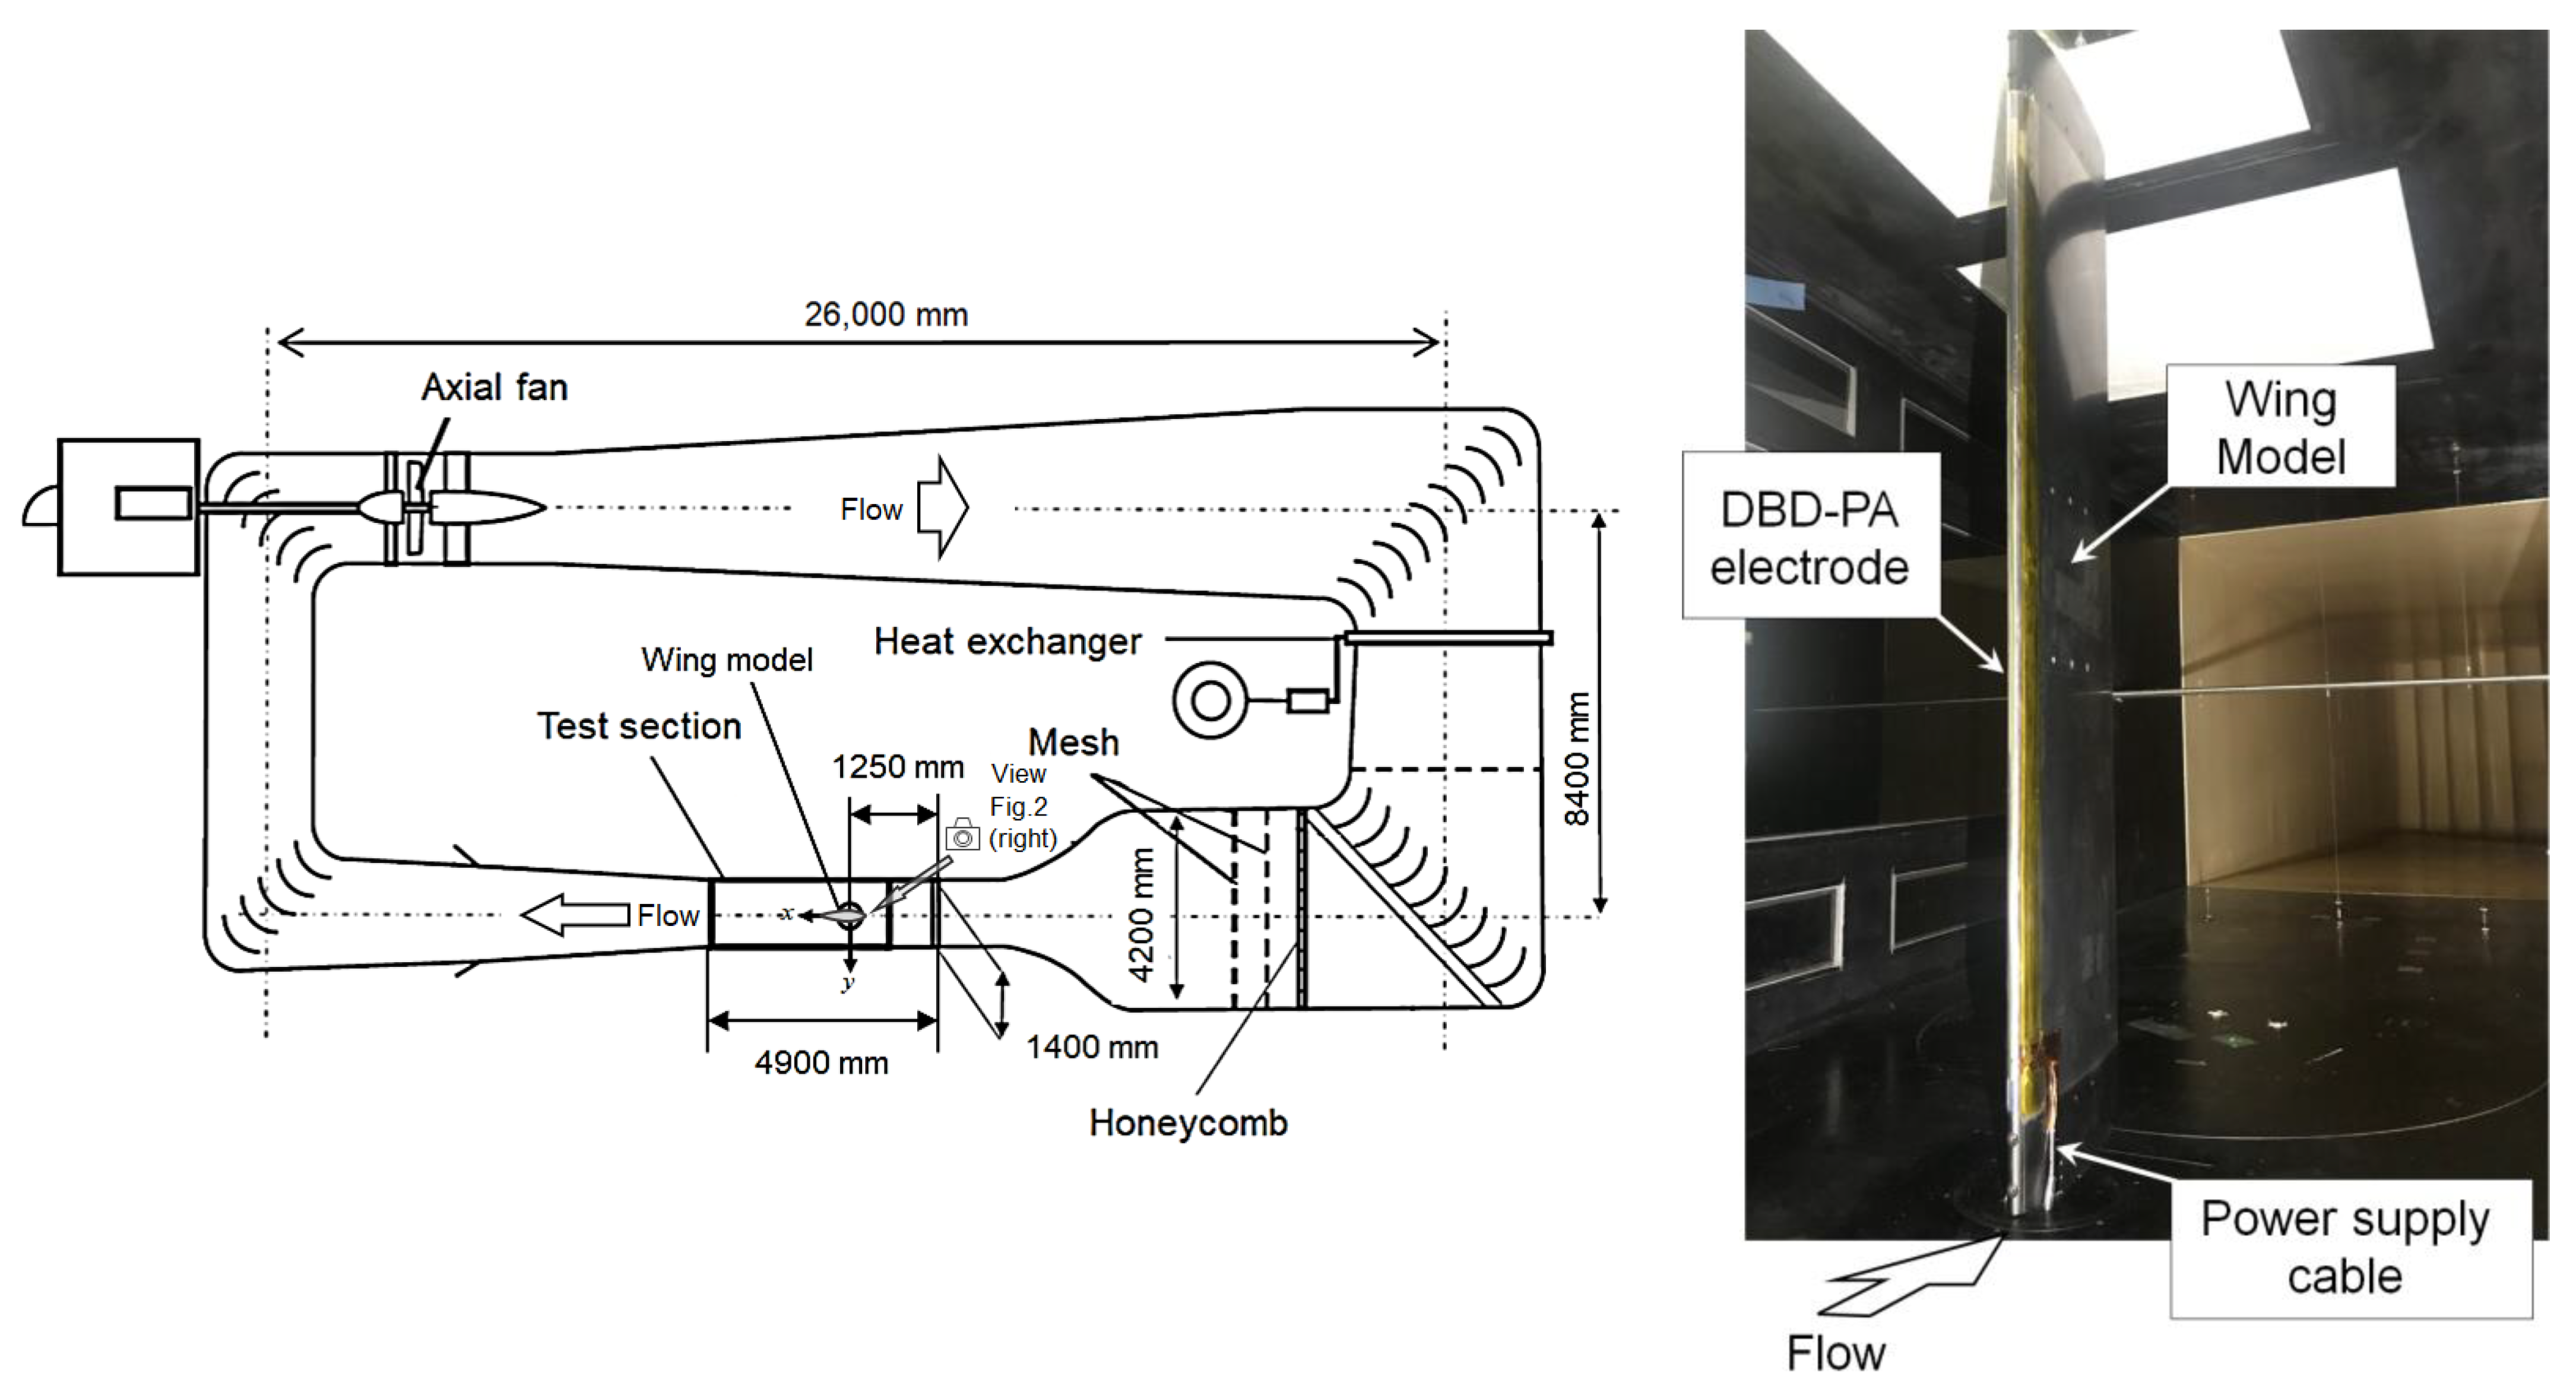
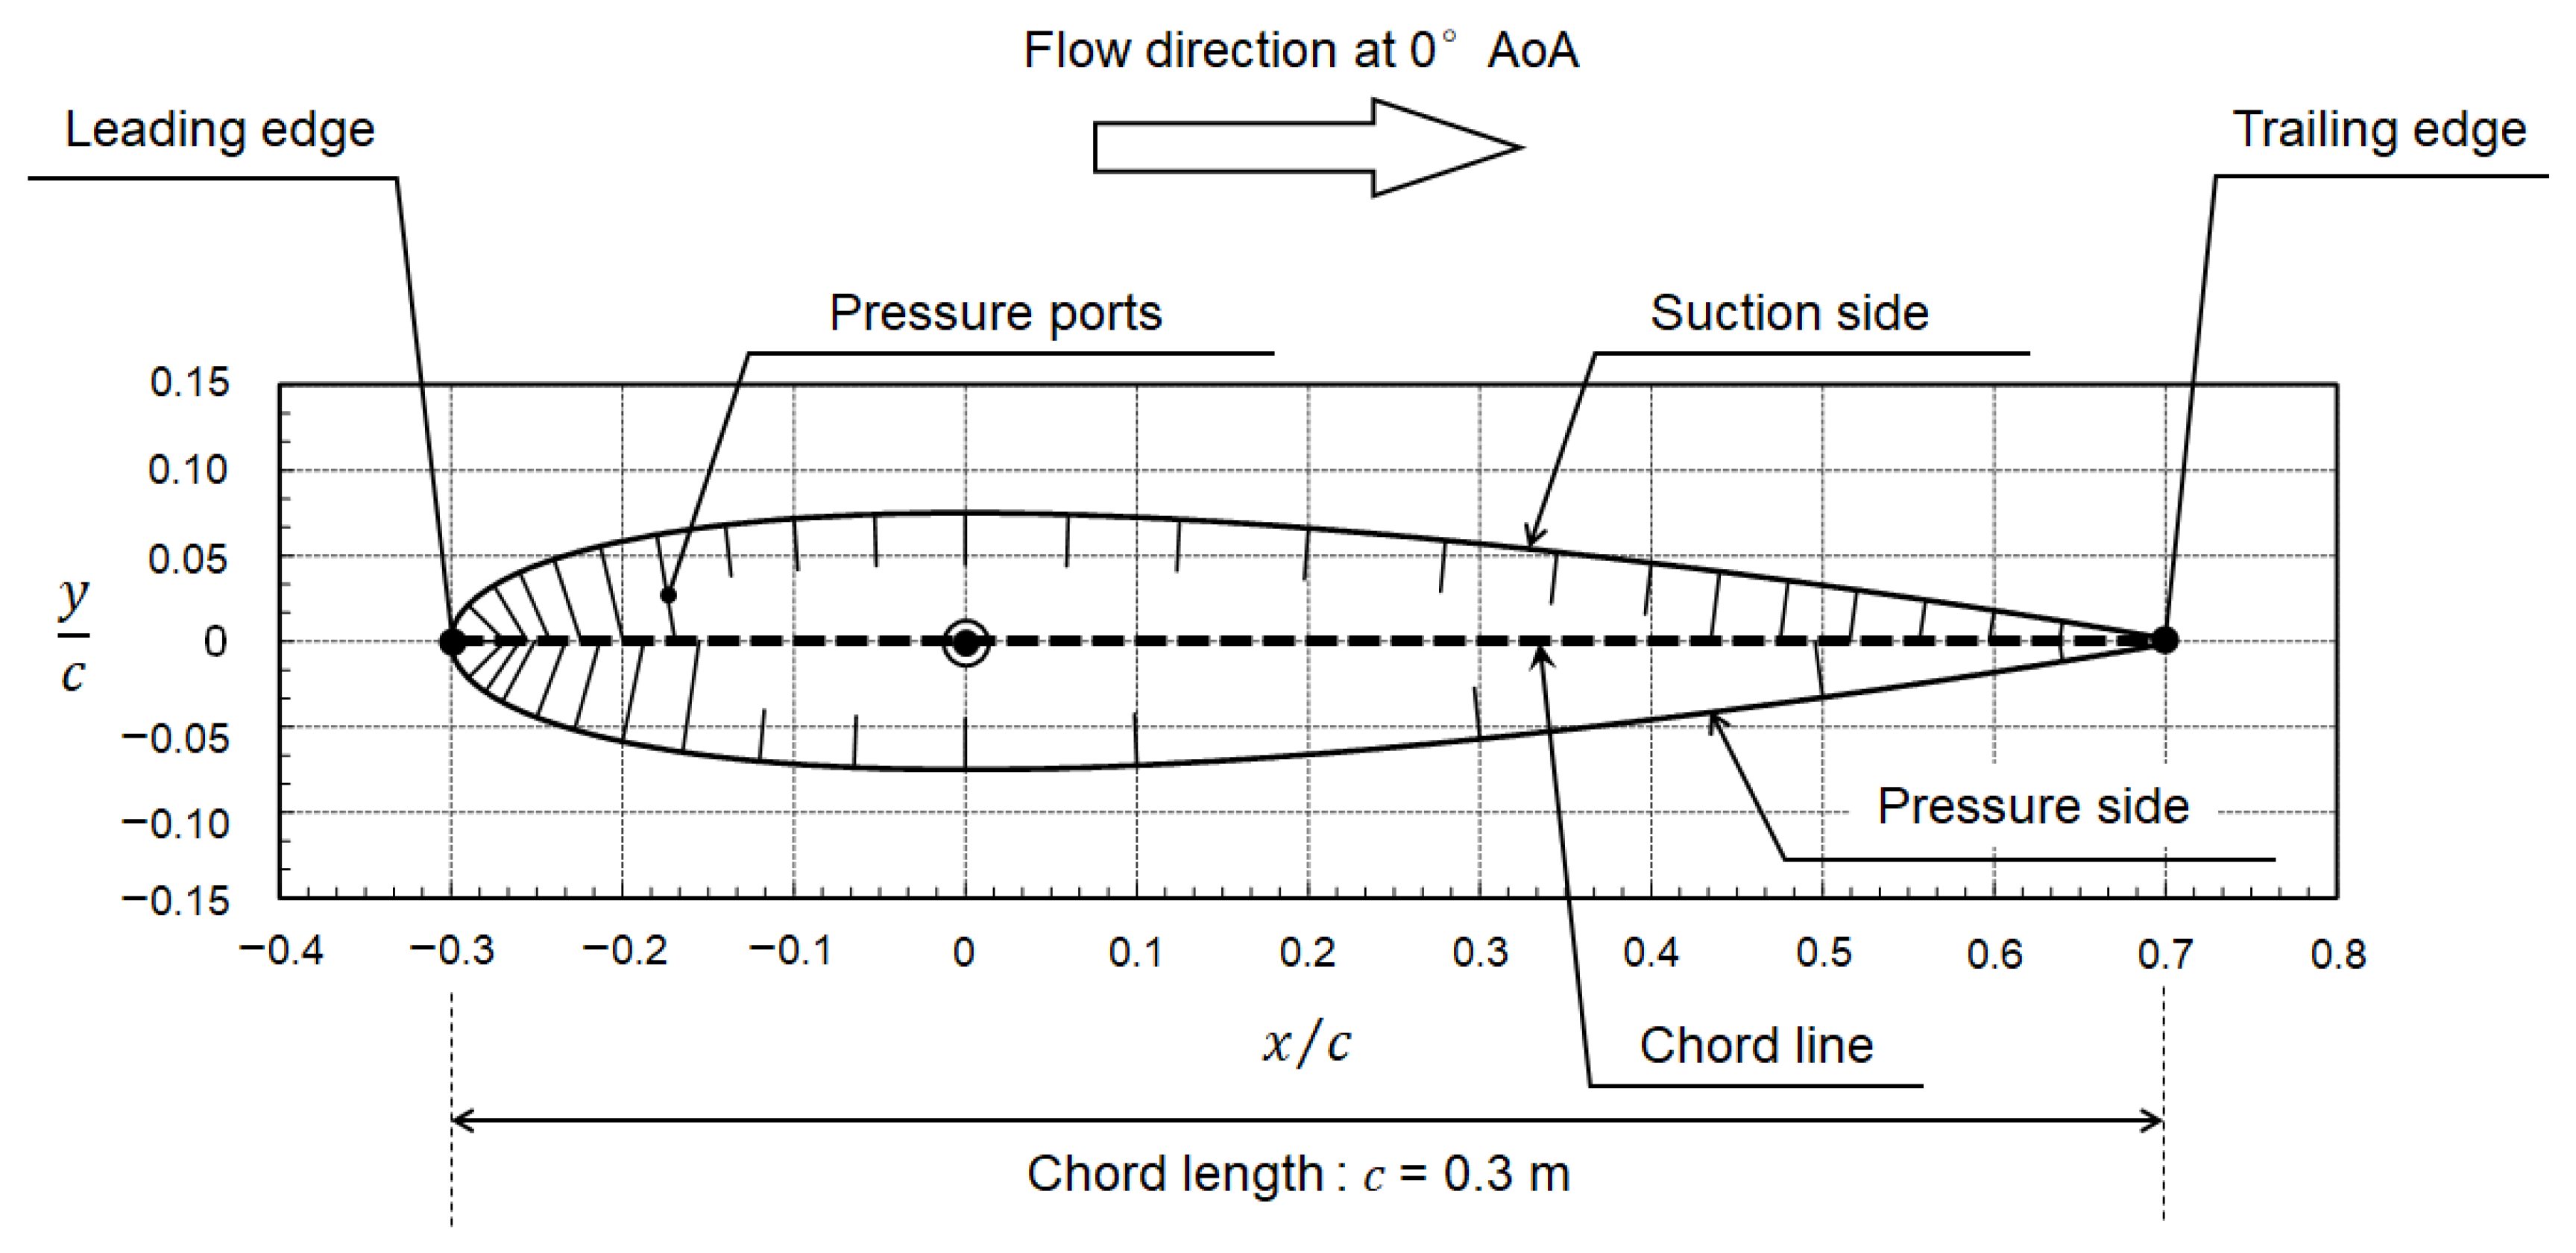
2.1. Wind Tunnel Facility and Wing Model
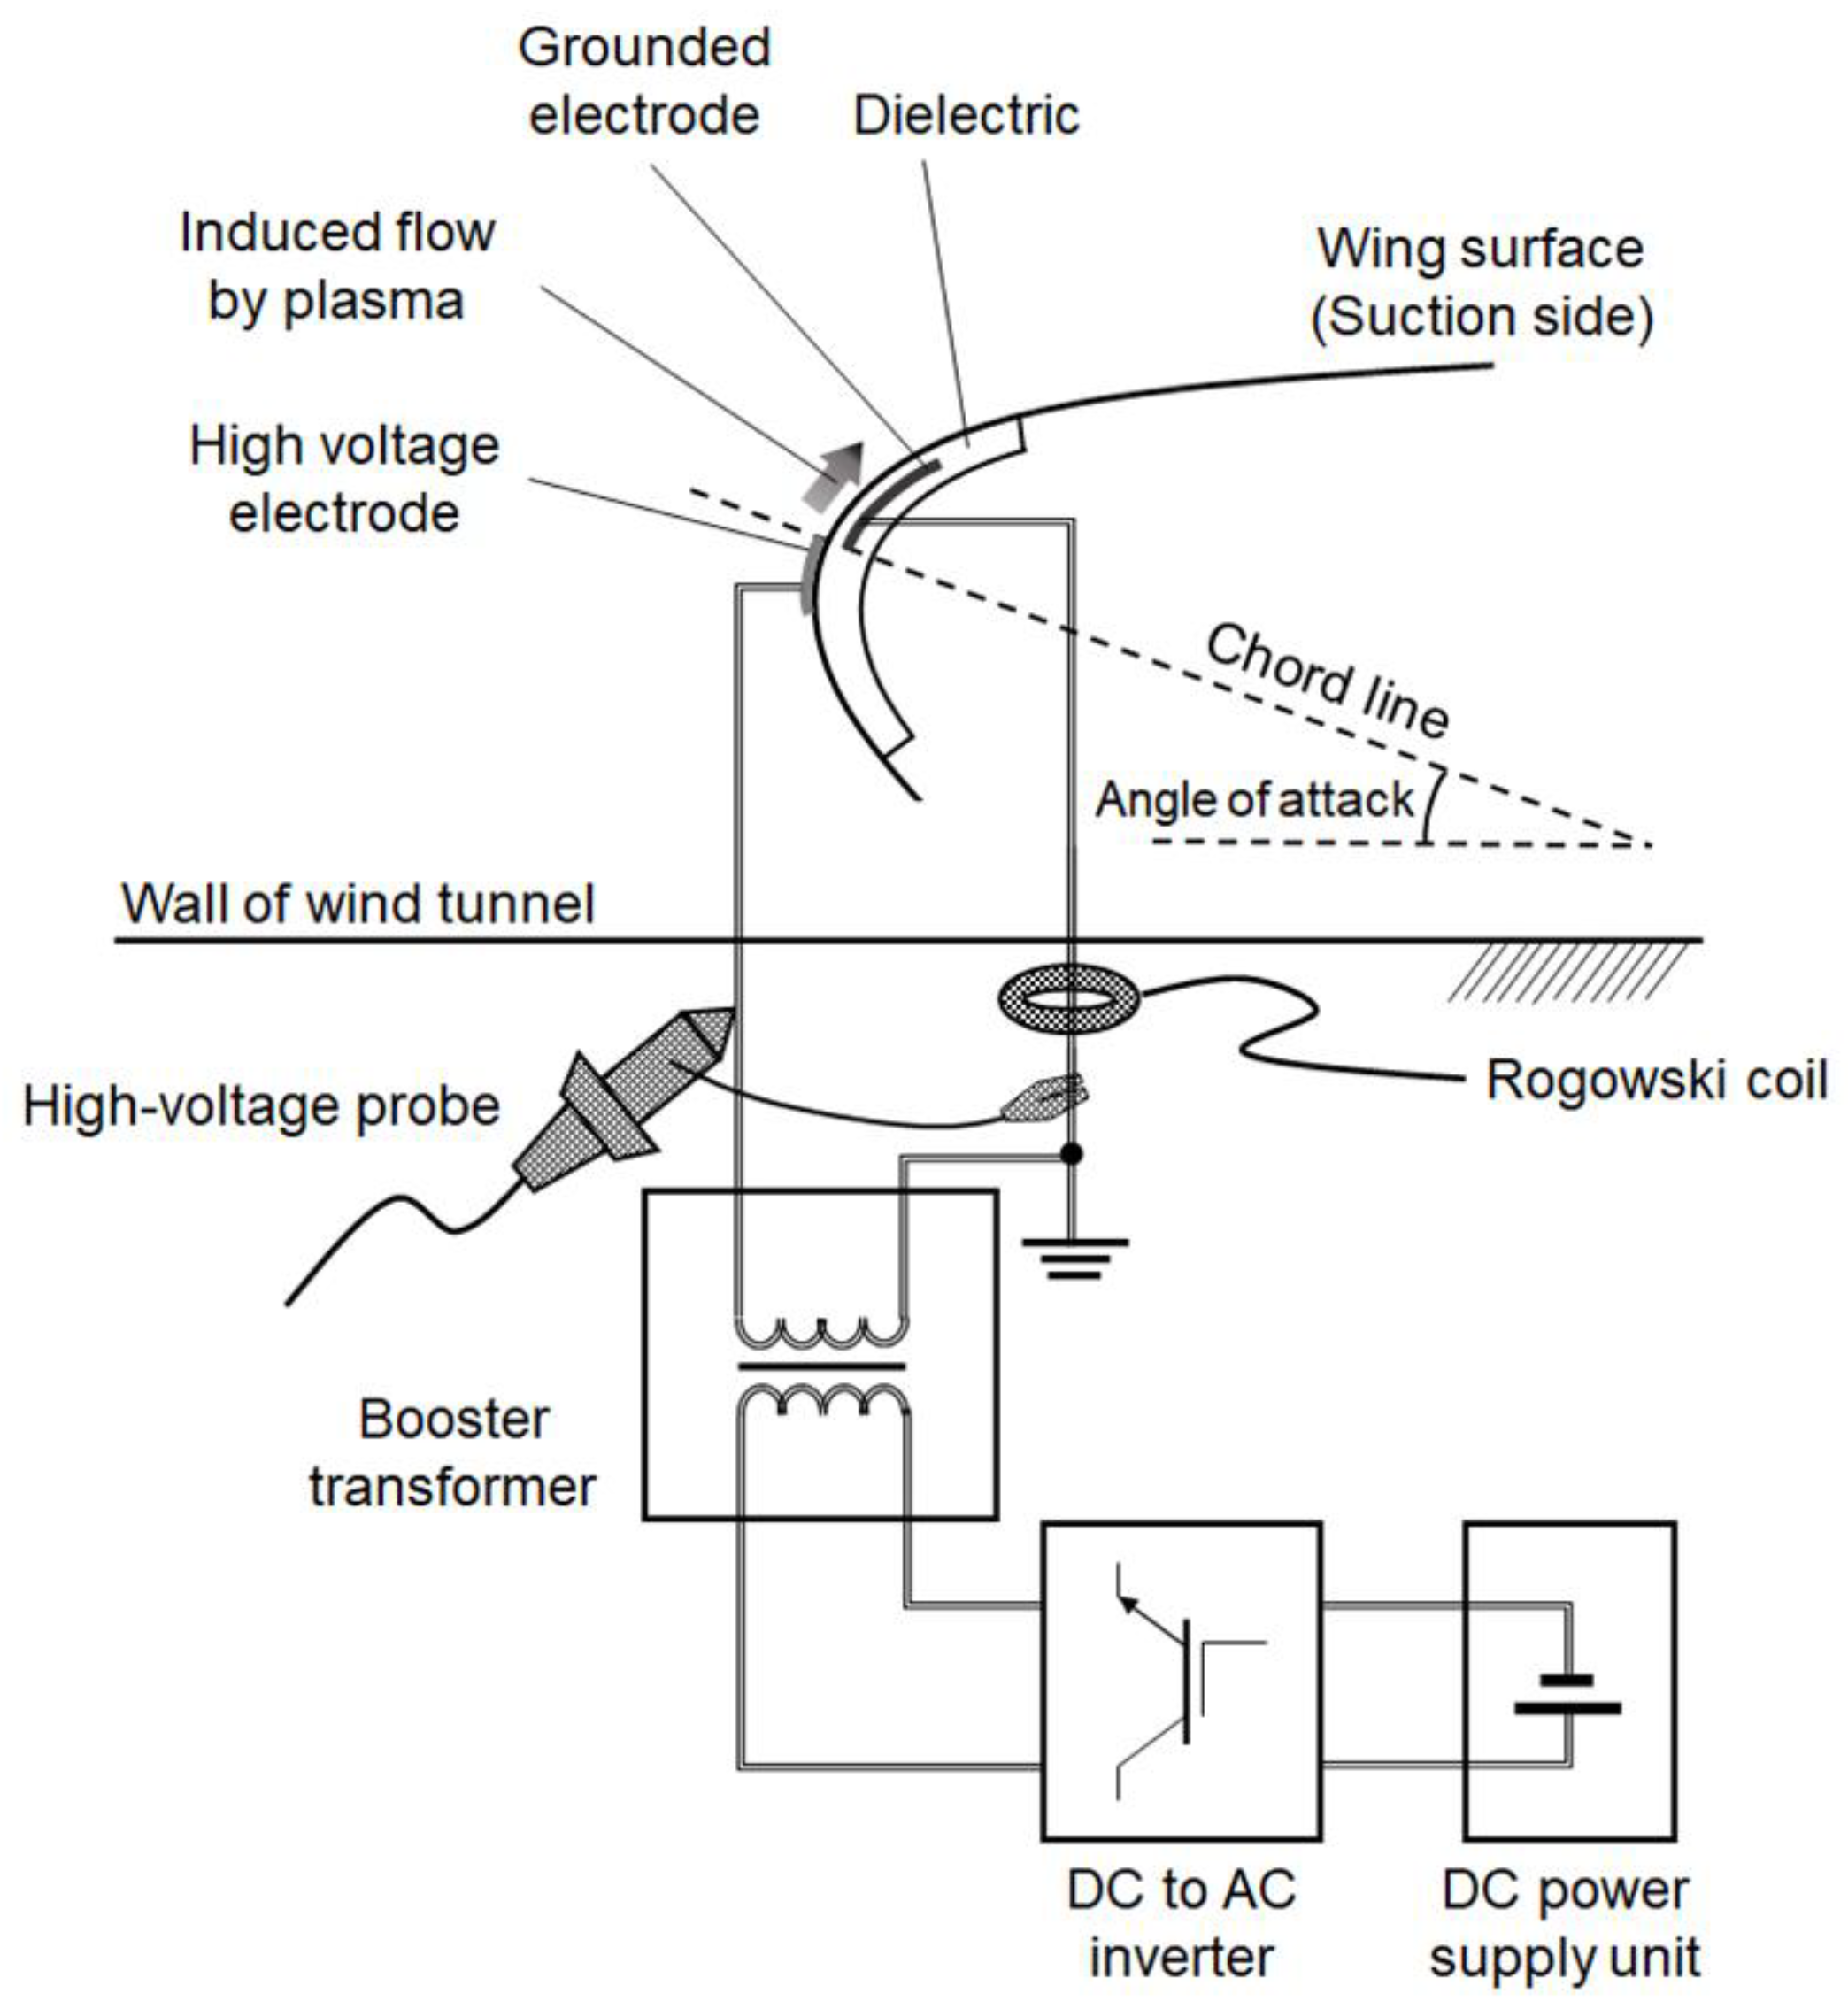
2.2. DBD-PA System
3. Experimental Results and Discussion
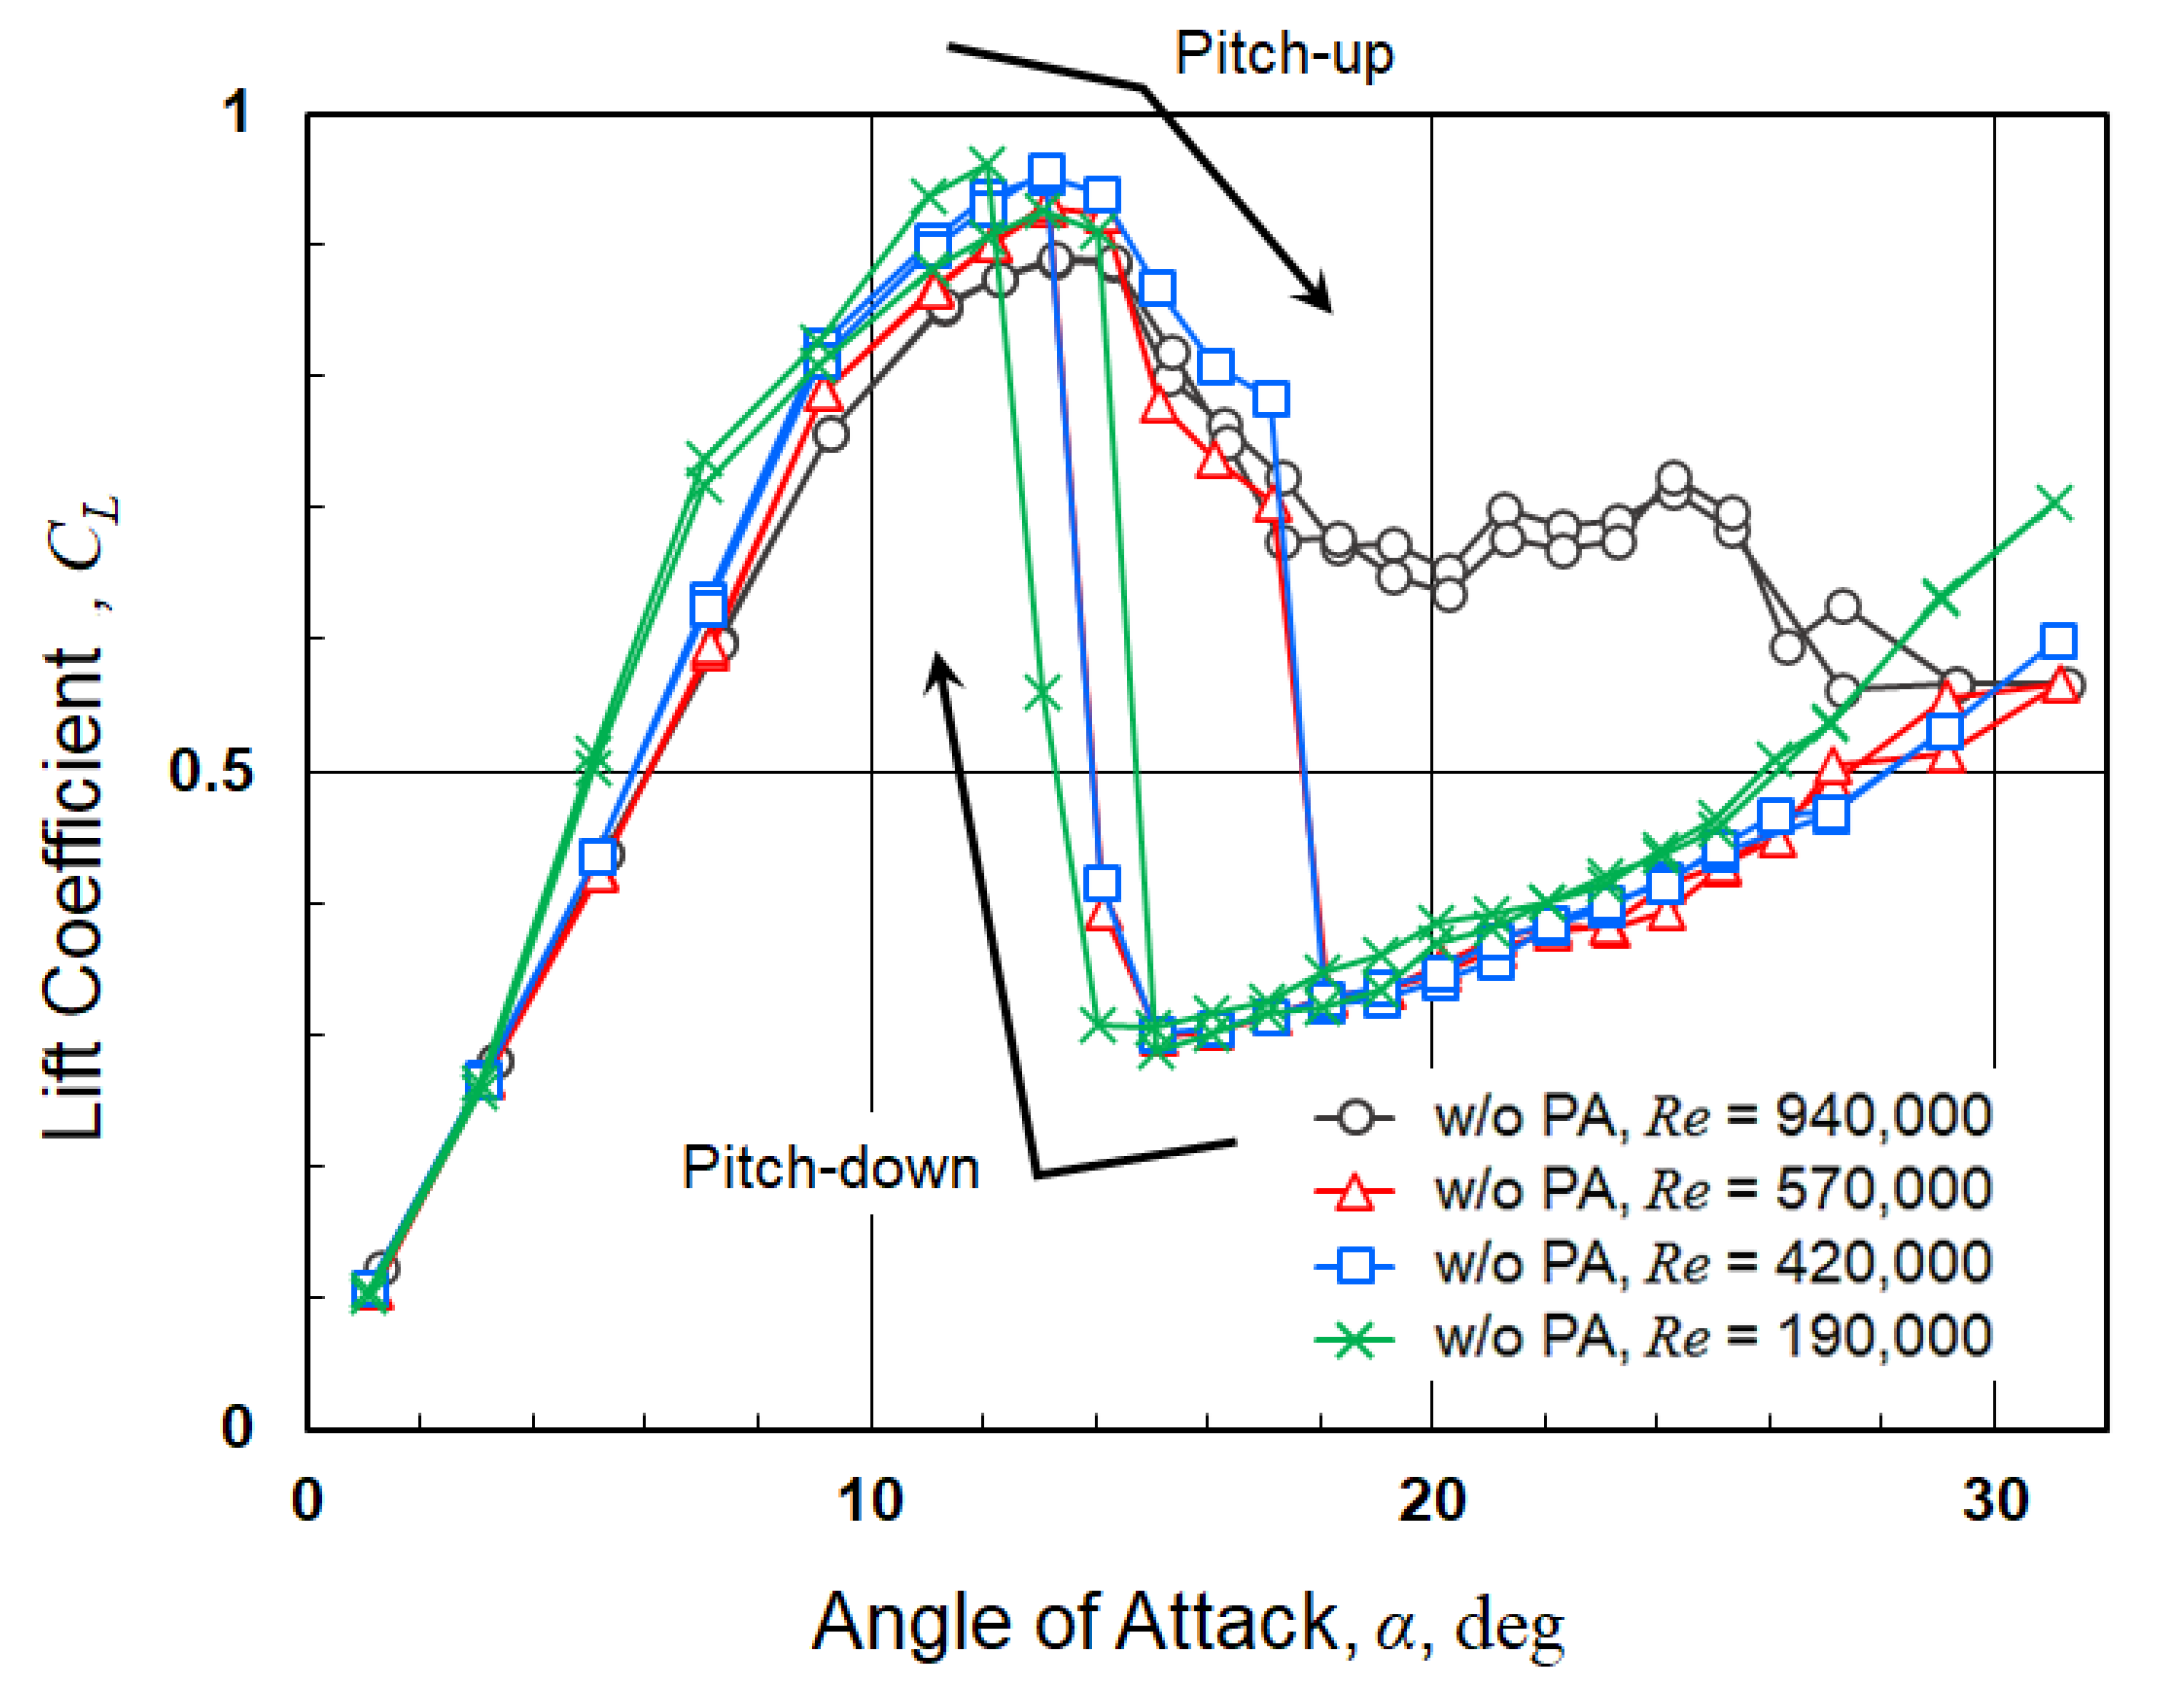
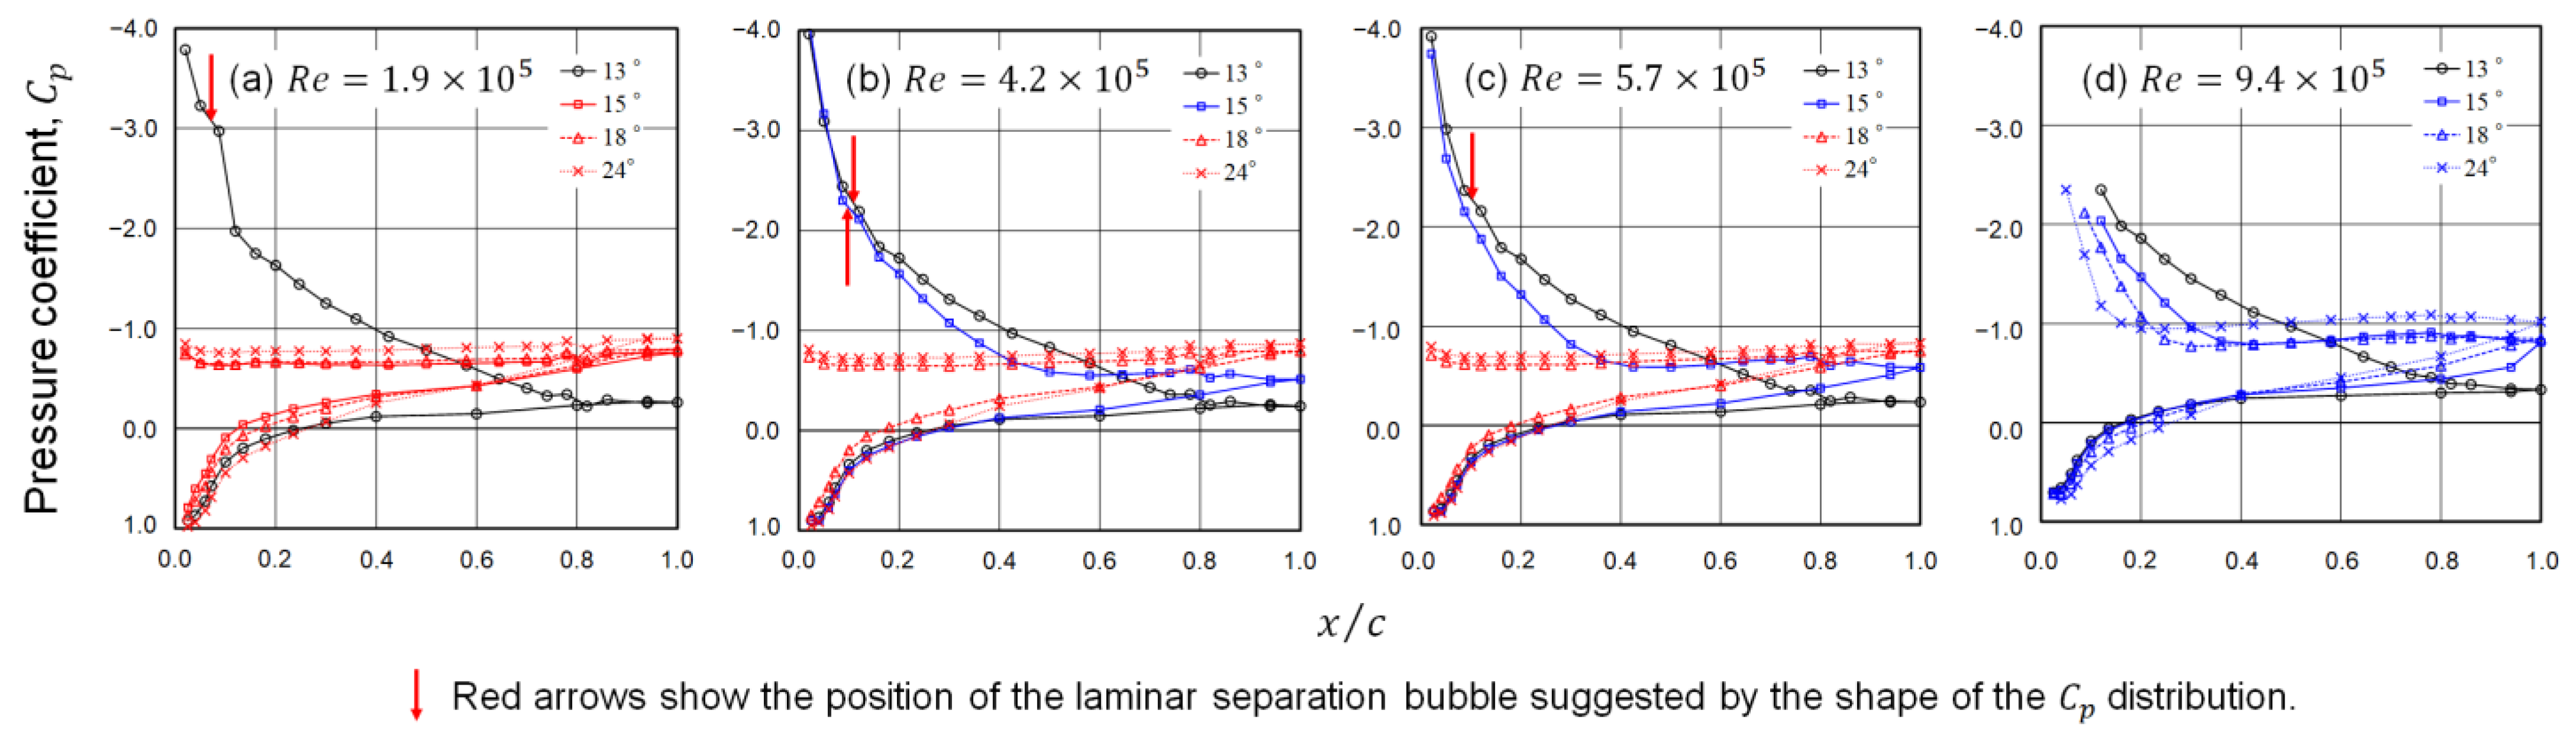
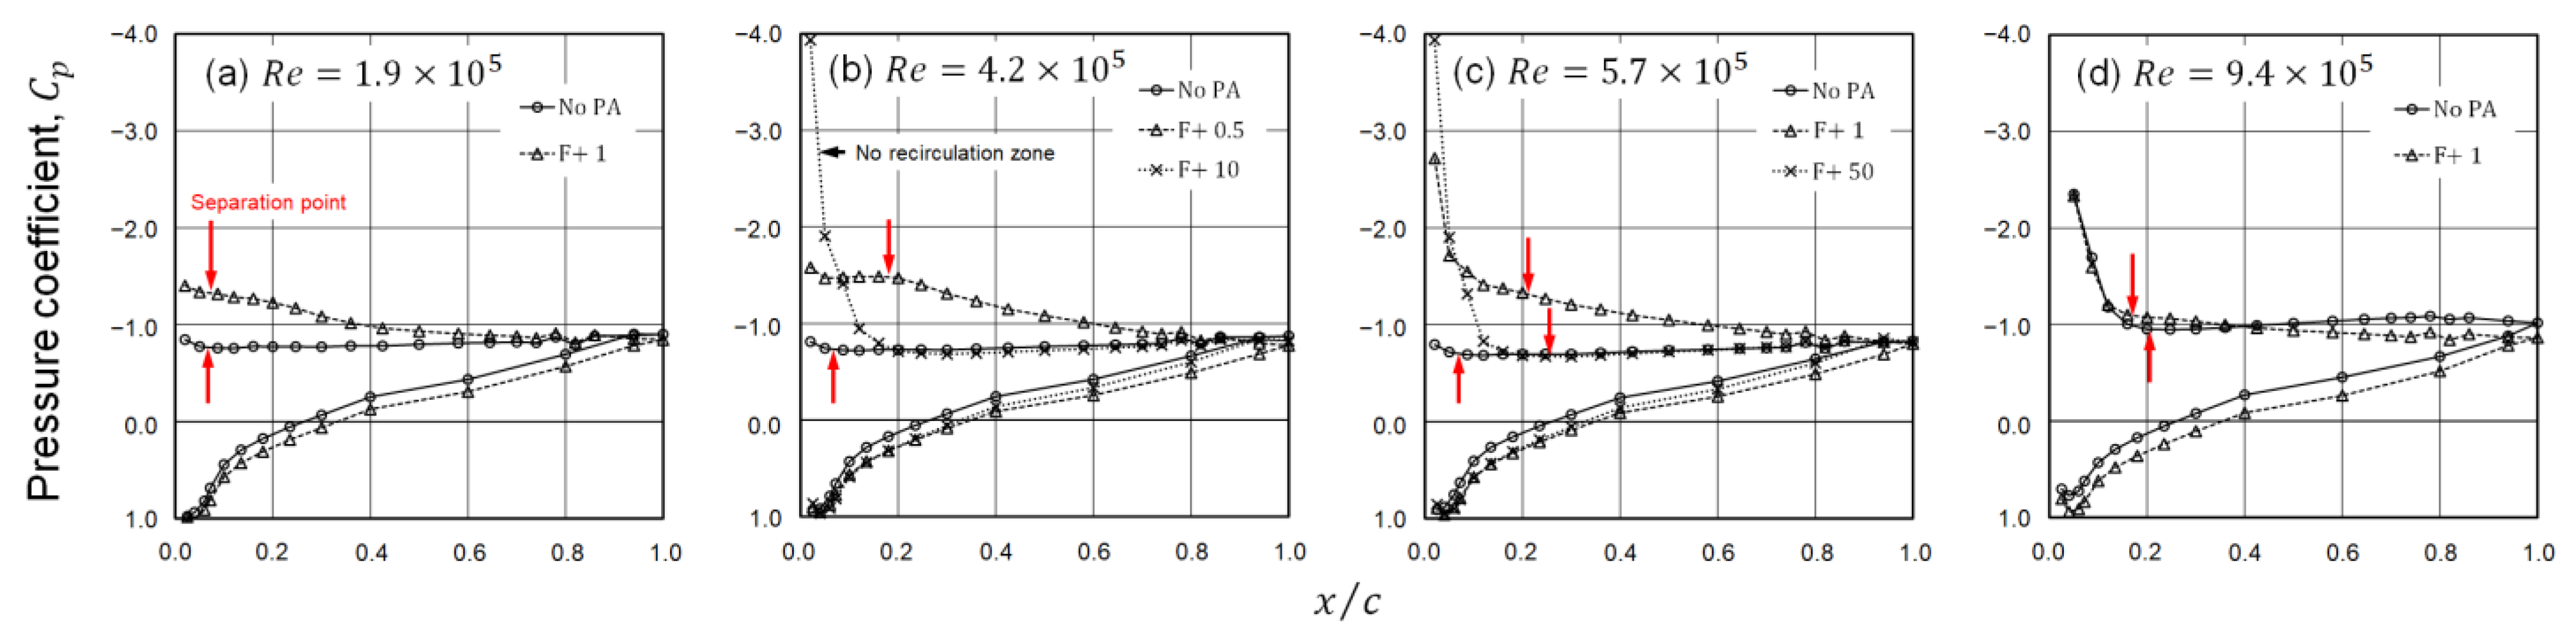
3.1. Flow Characteristics without DBD-PA Actuation Classified by and Distributions
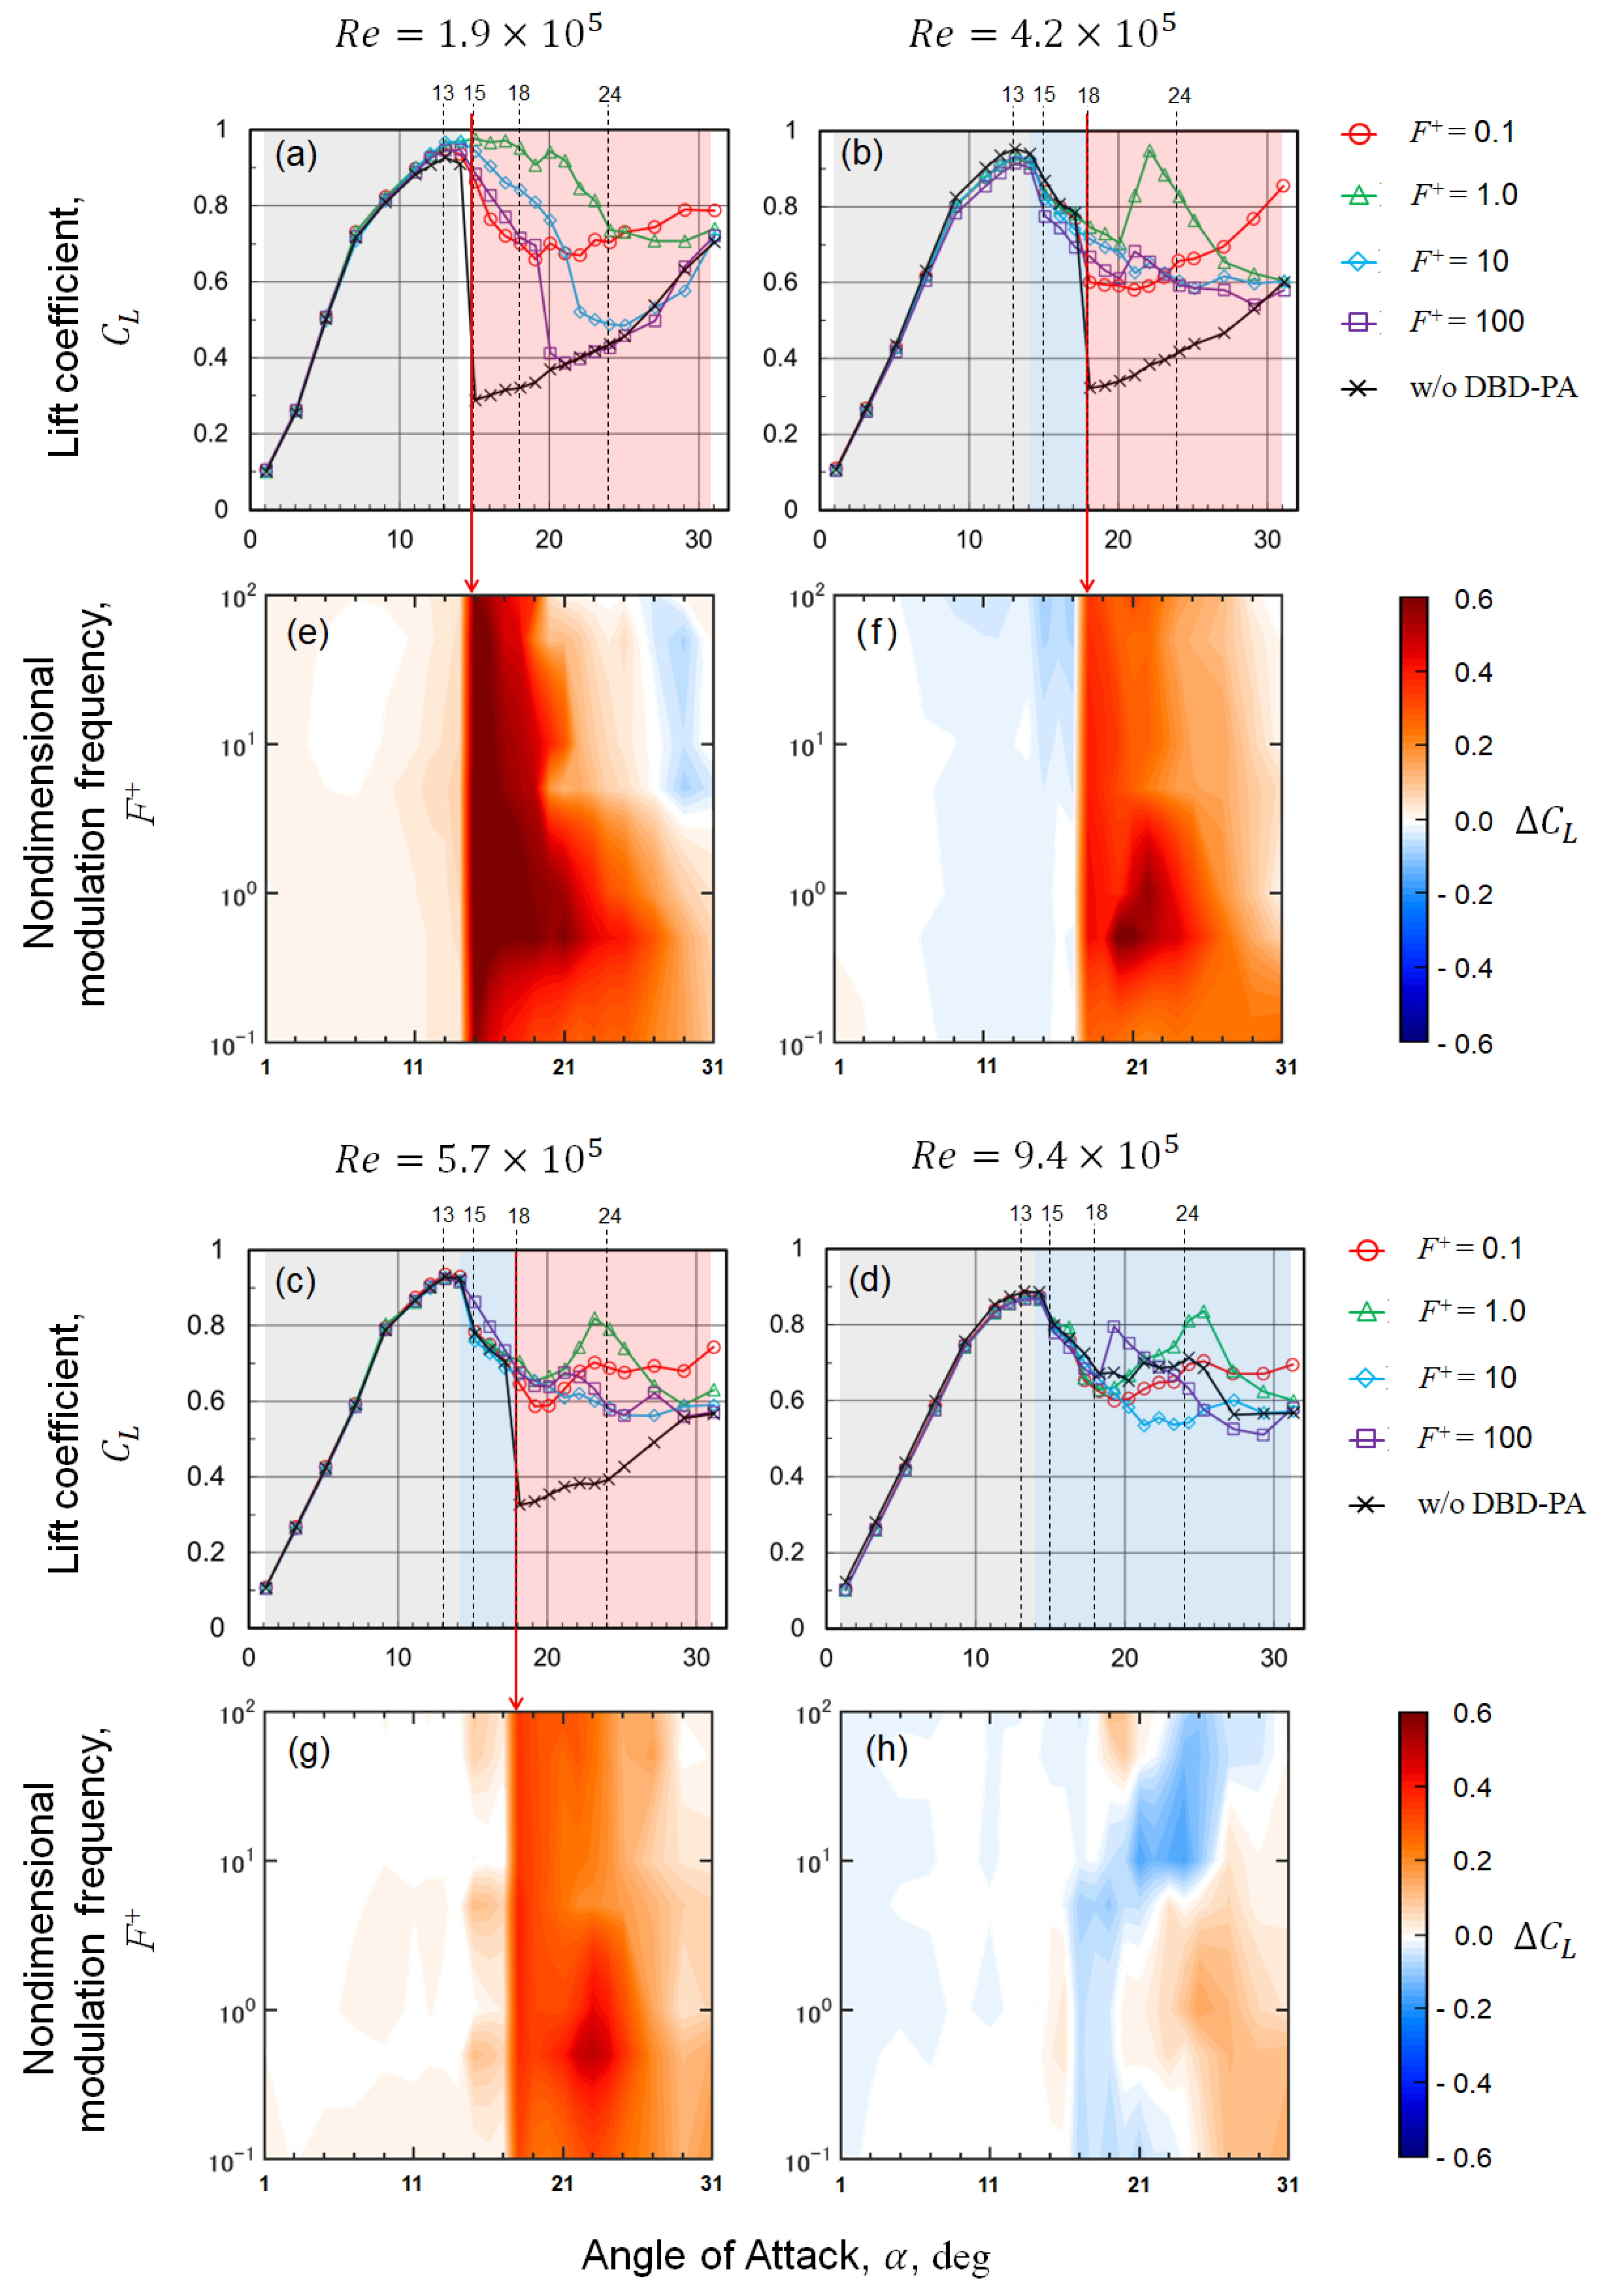
3.2. Dependence of the Increase in by DBD-PA Actuation on Flow Characteristics
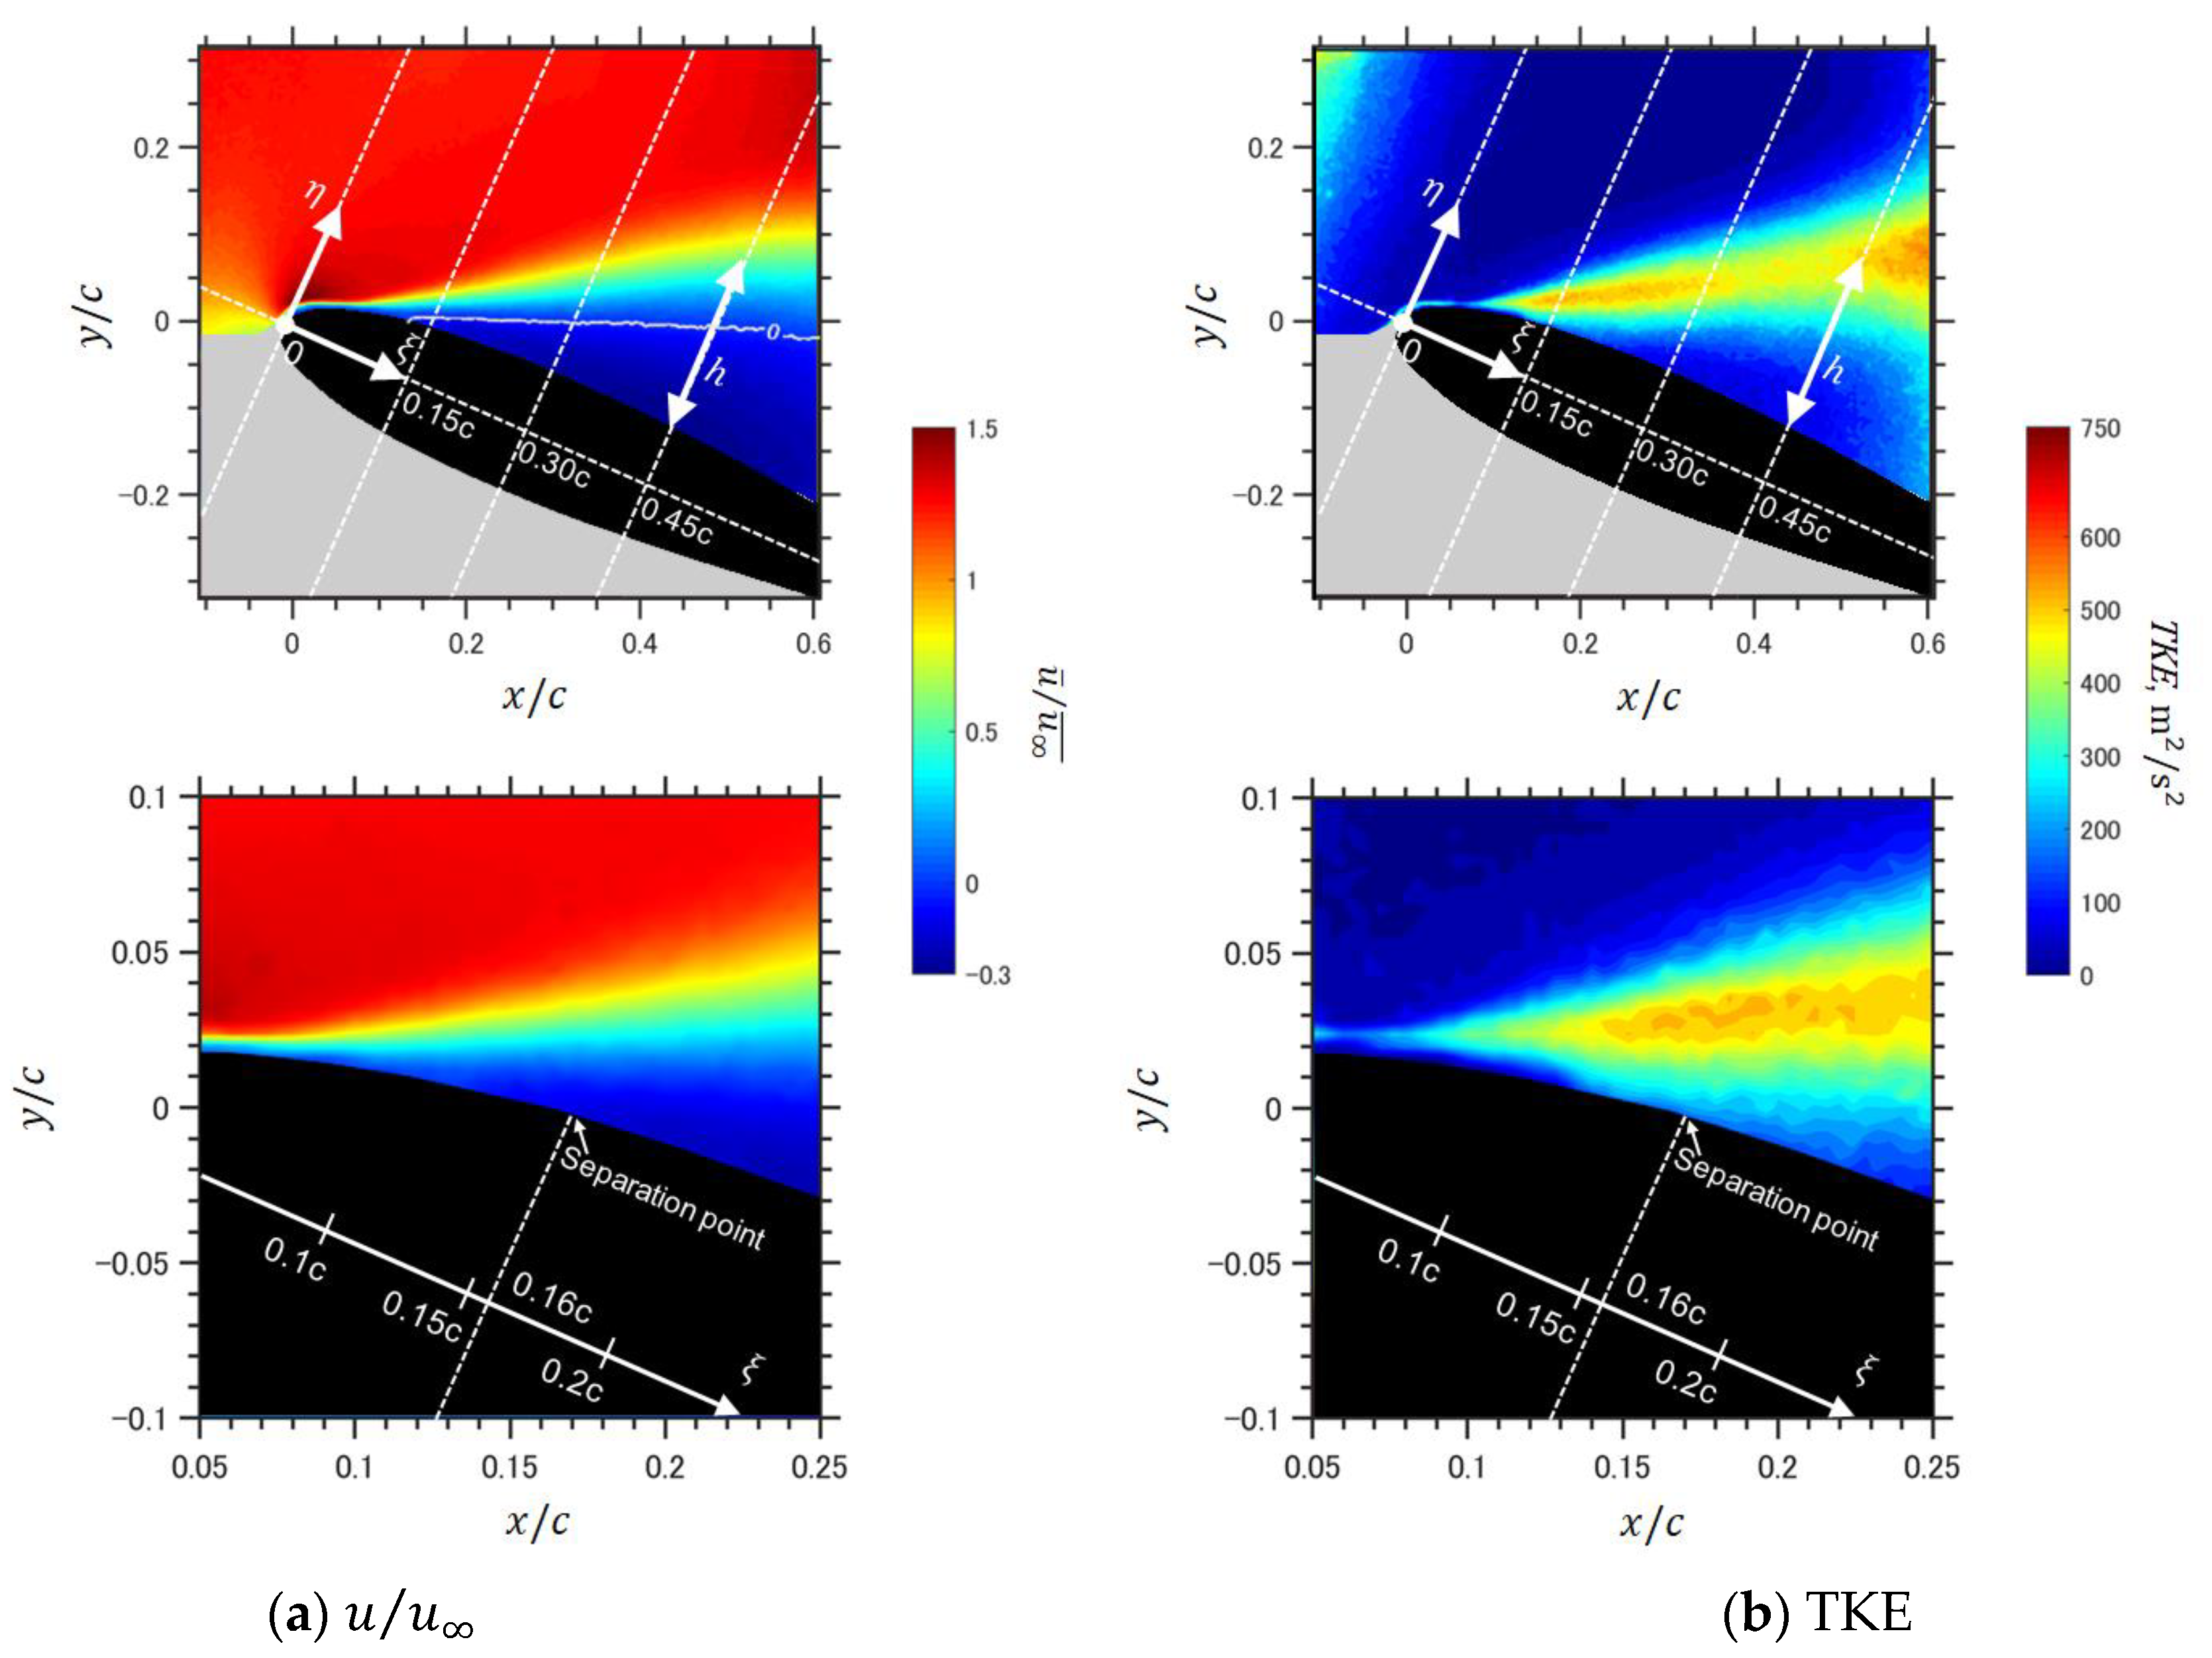
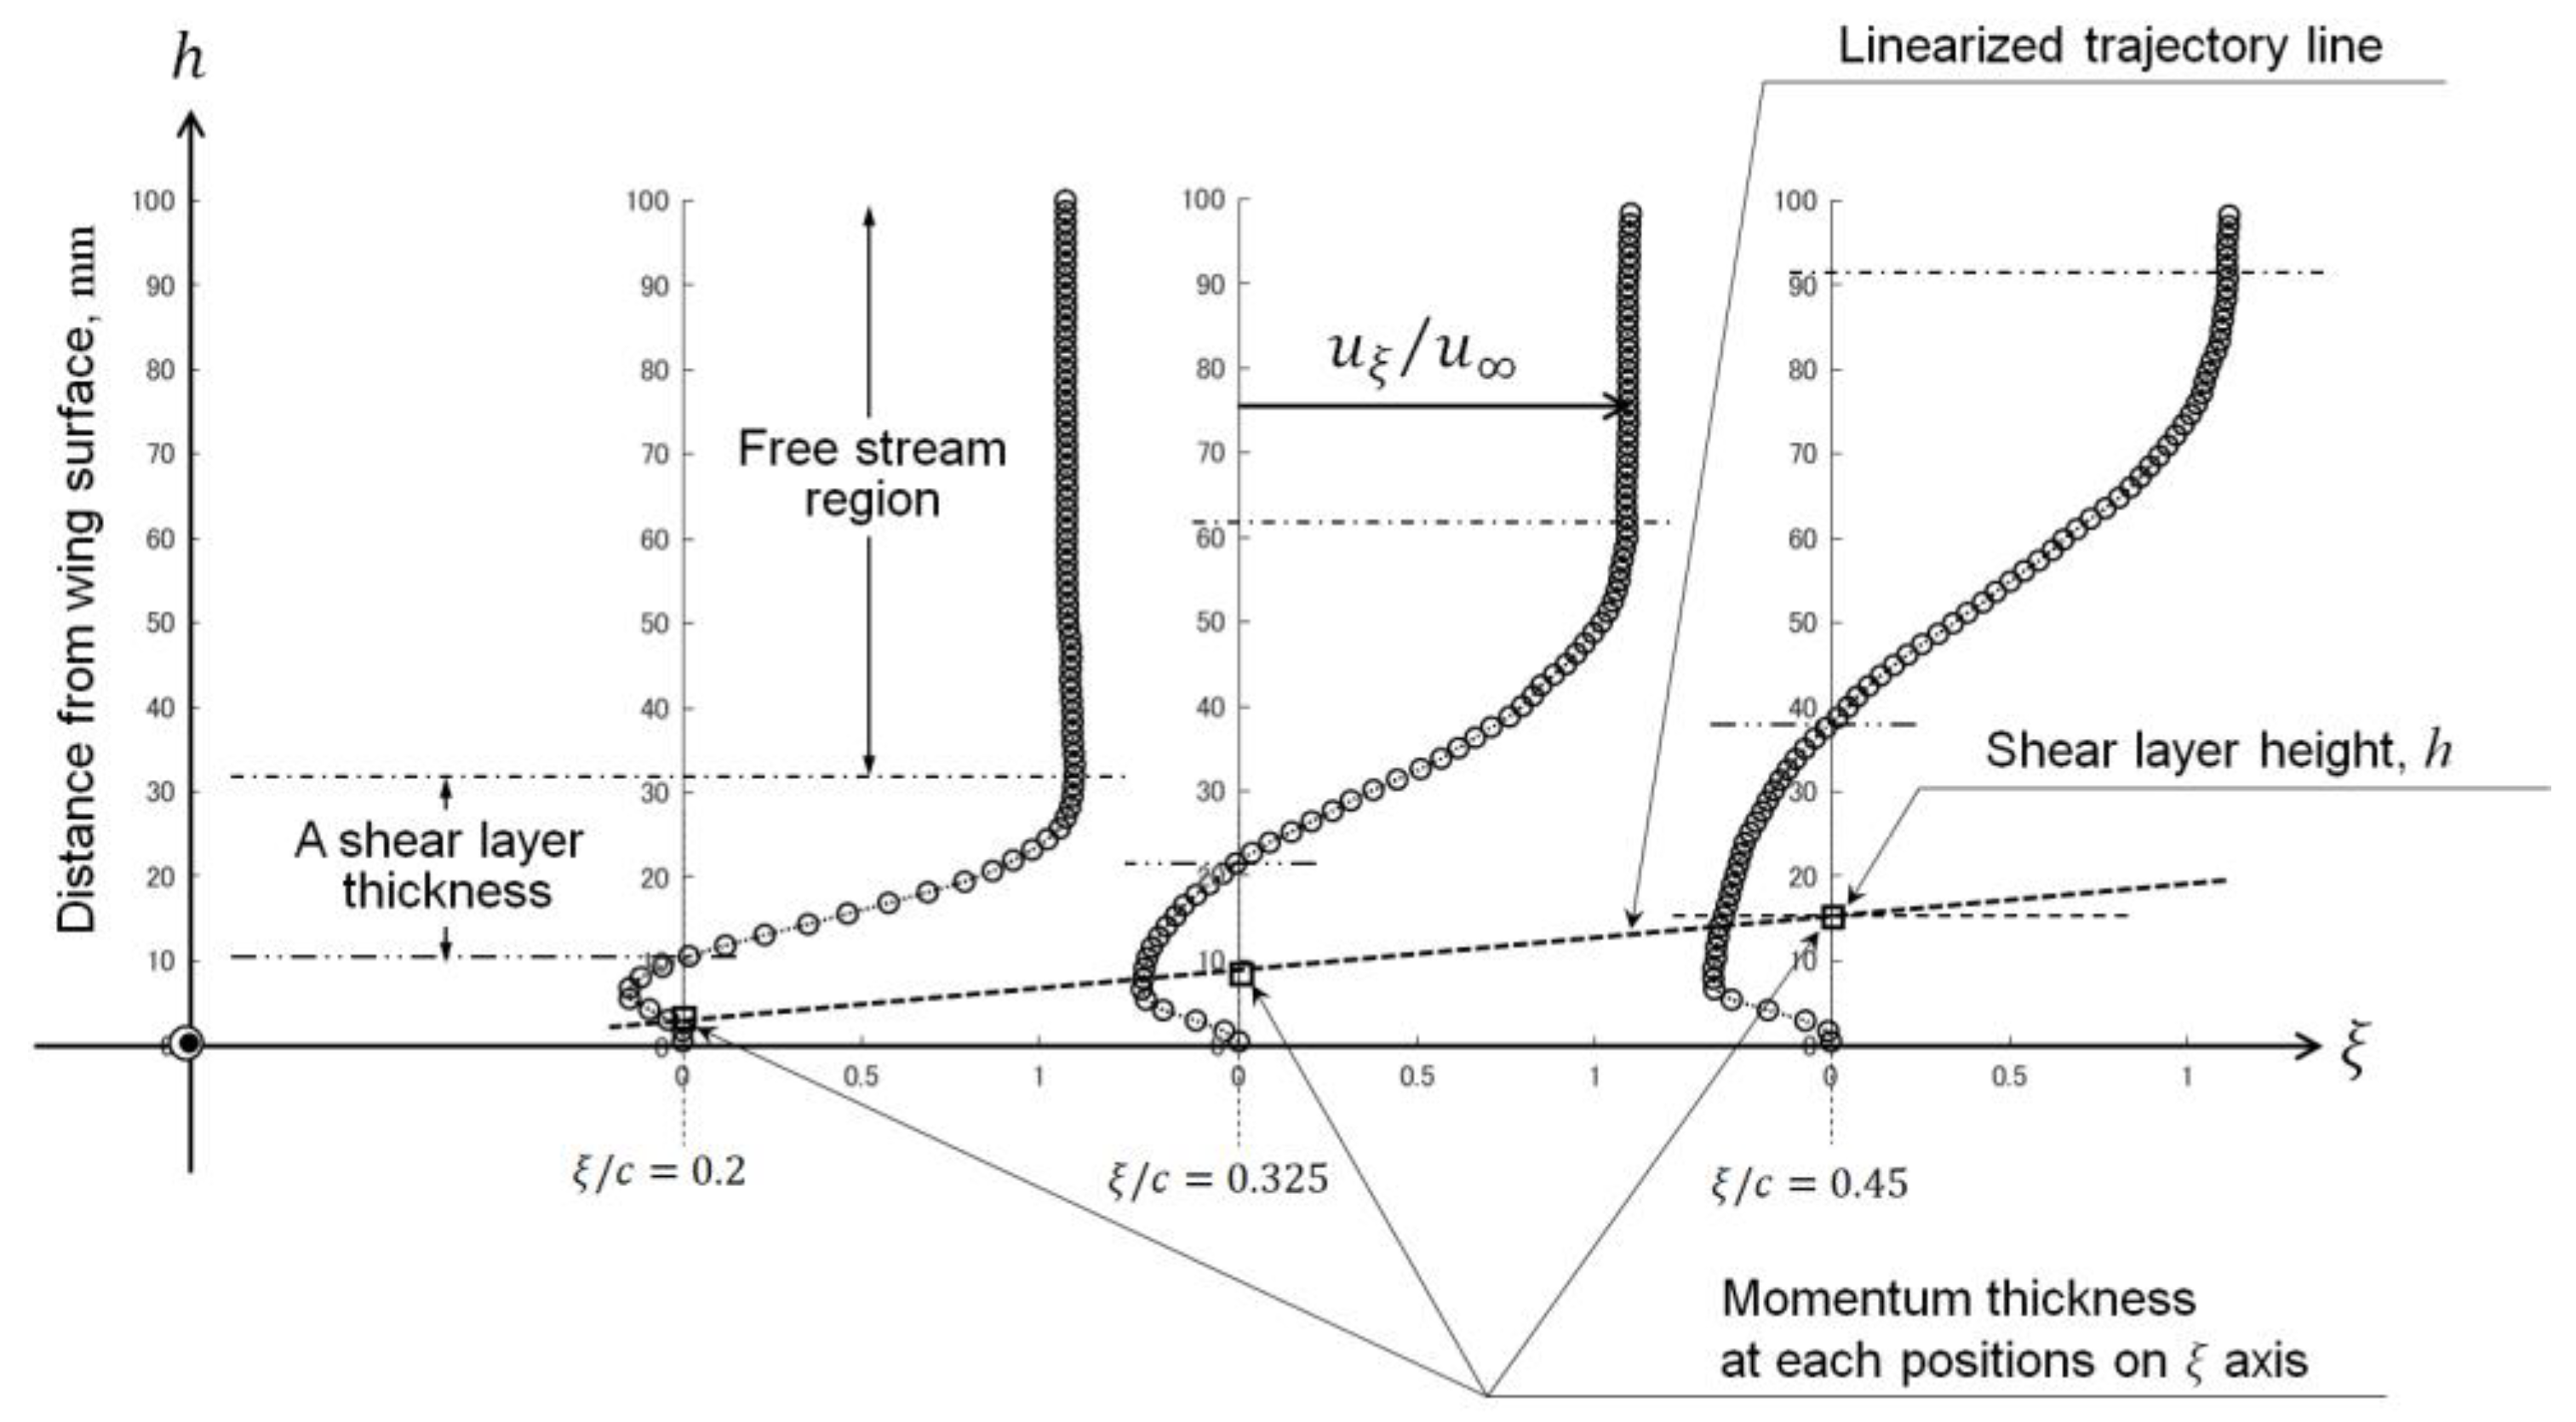
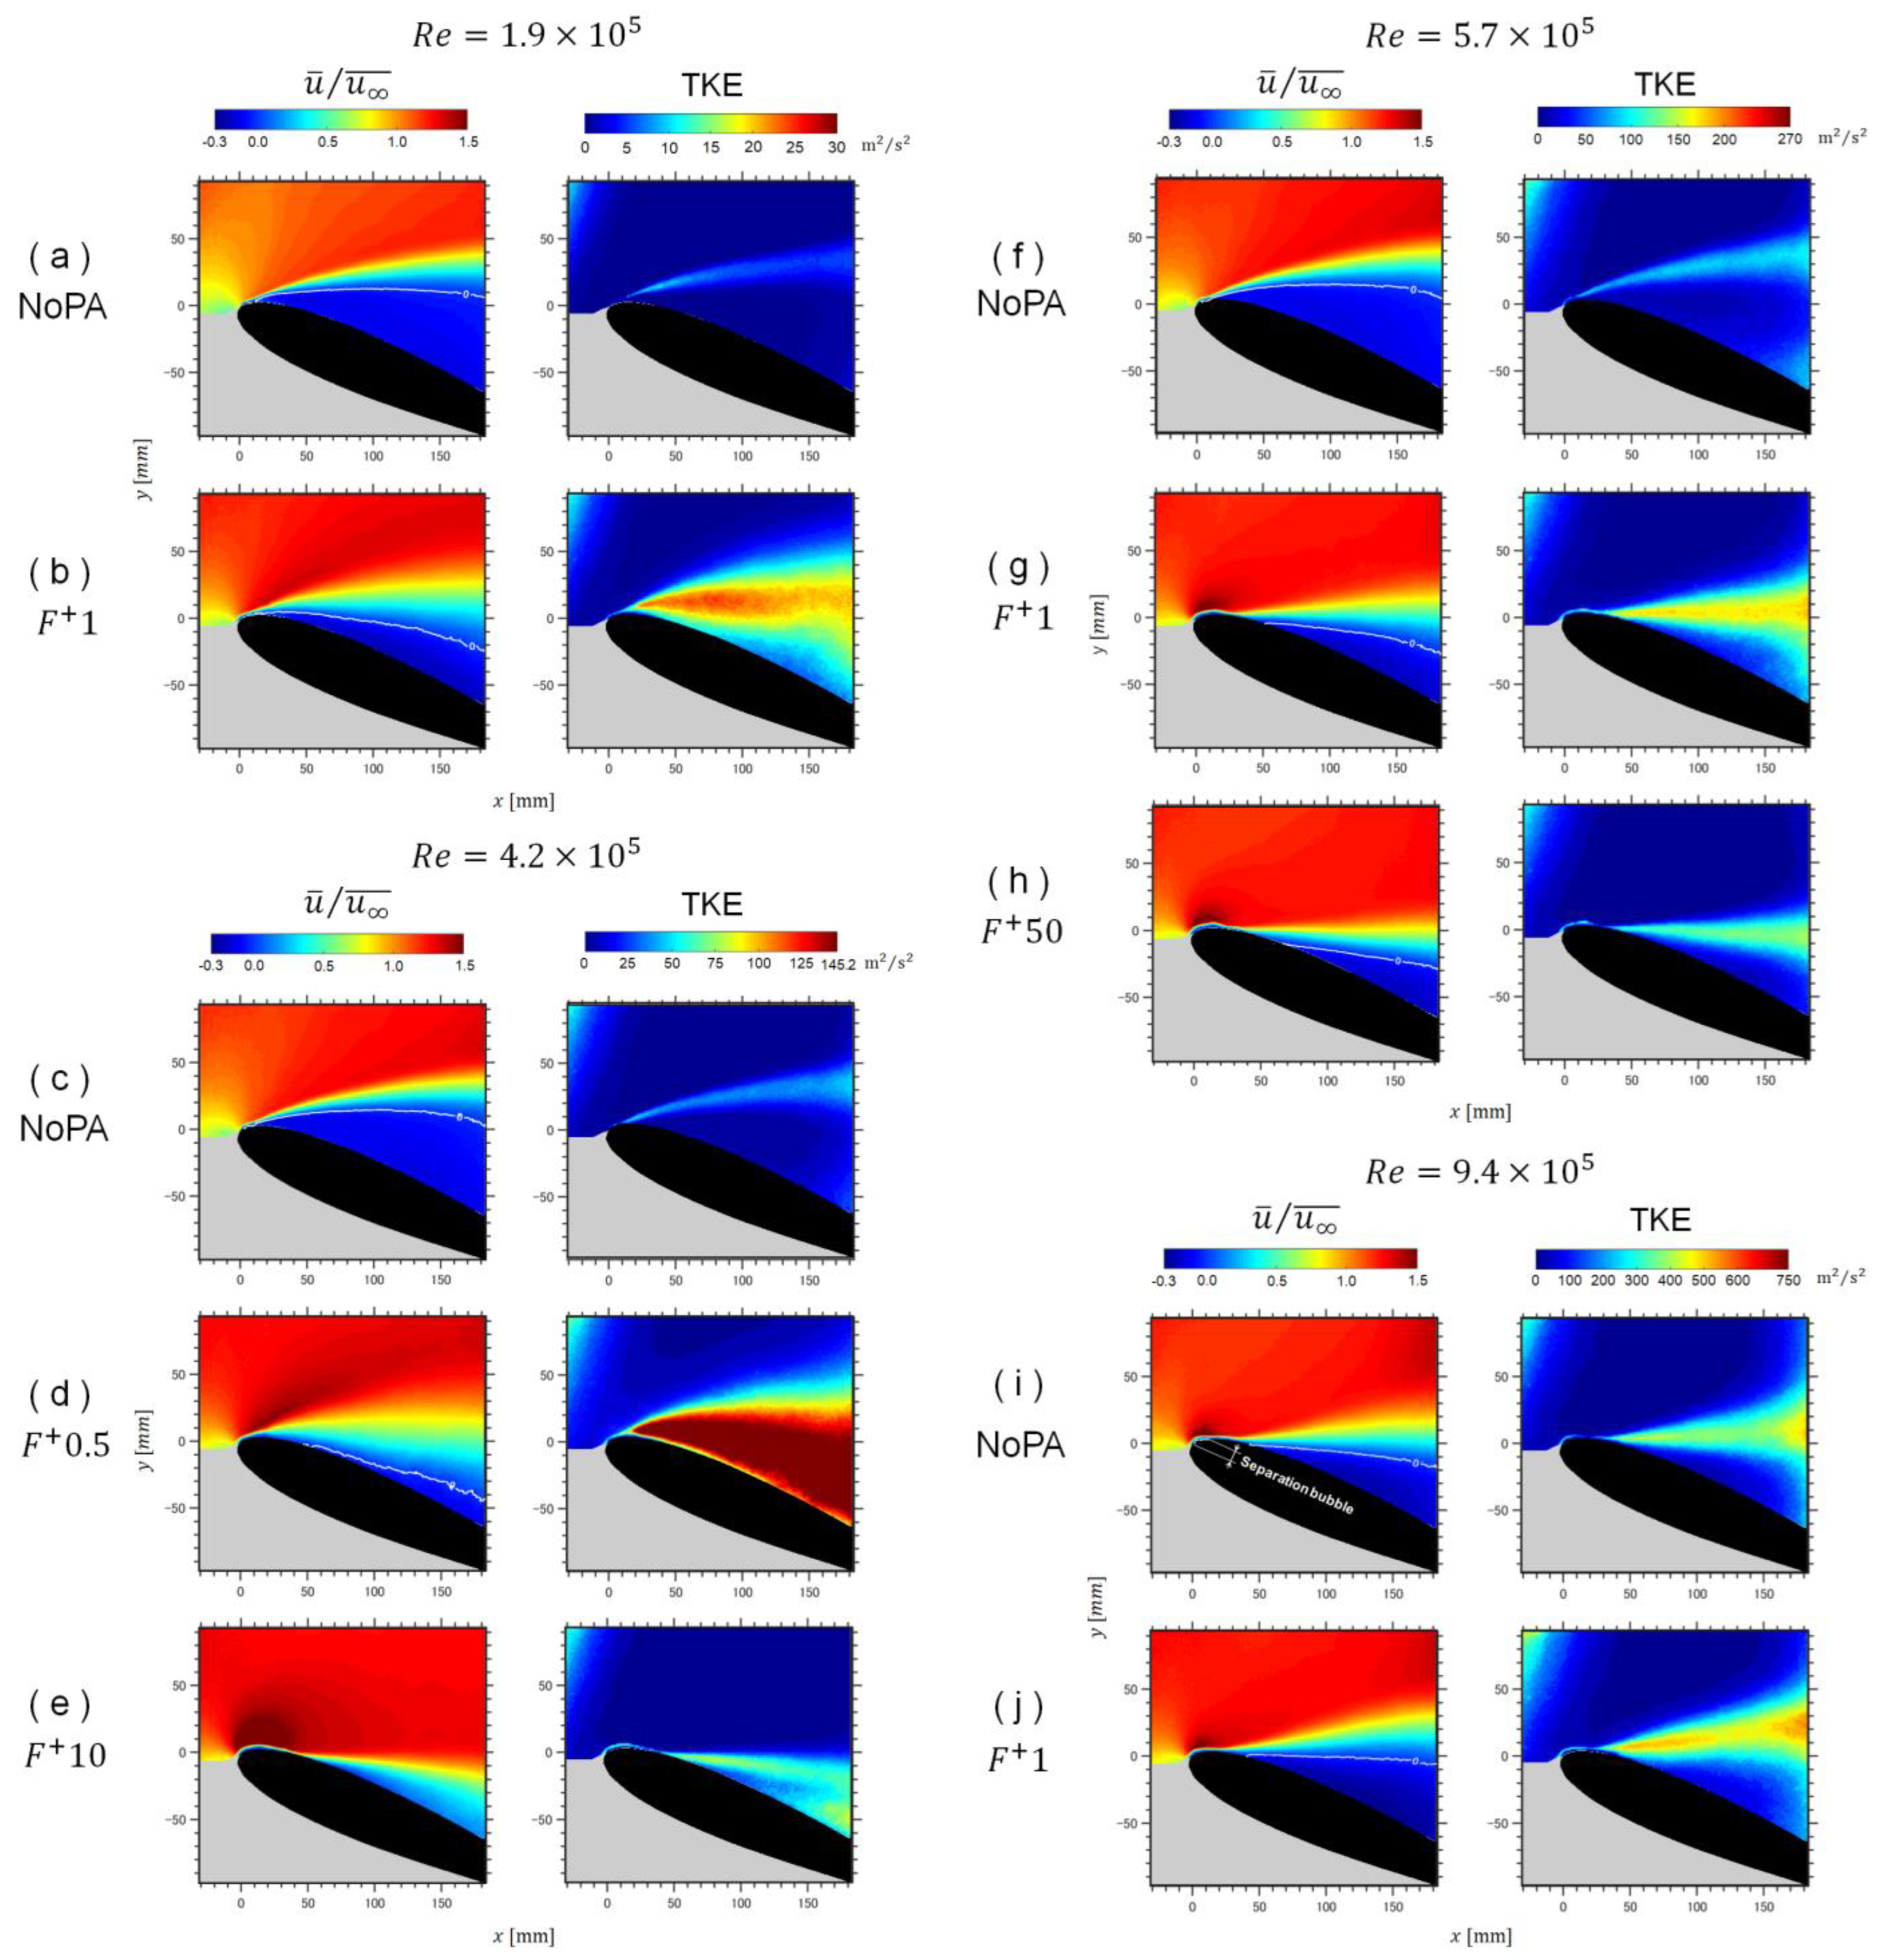
3.3. Particle Image Velocimetry for Characterizing the Flow Field
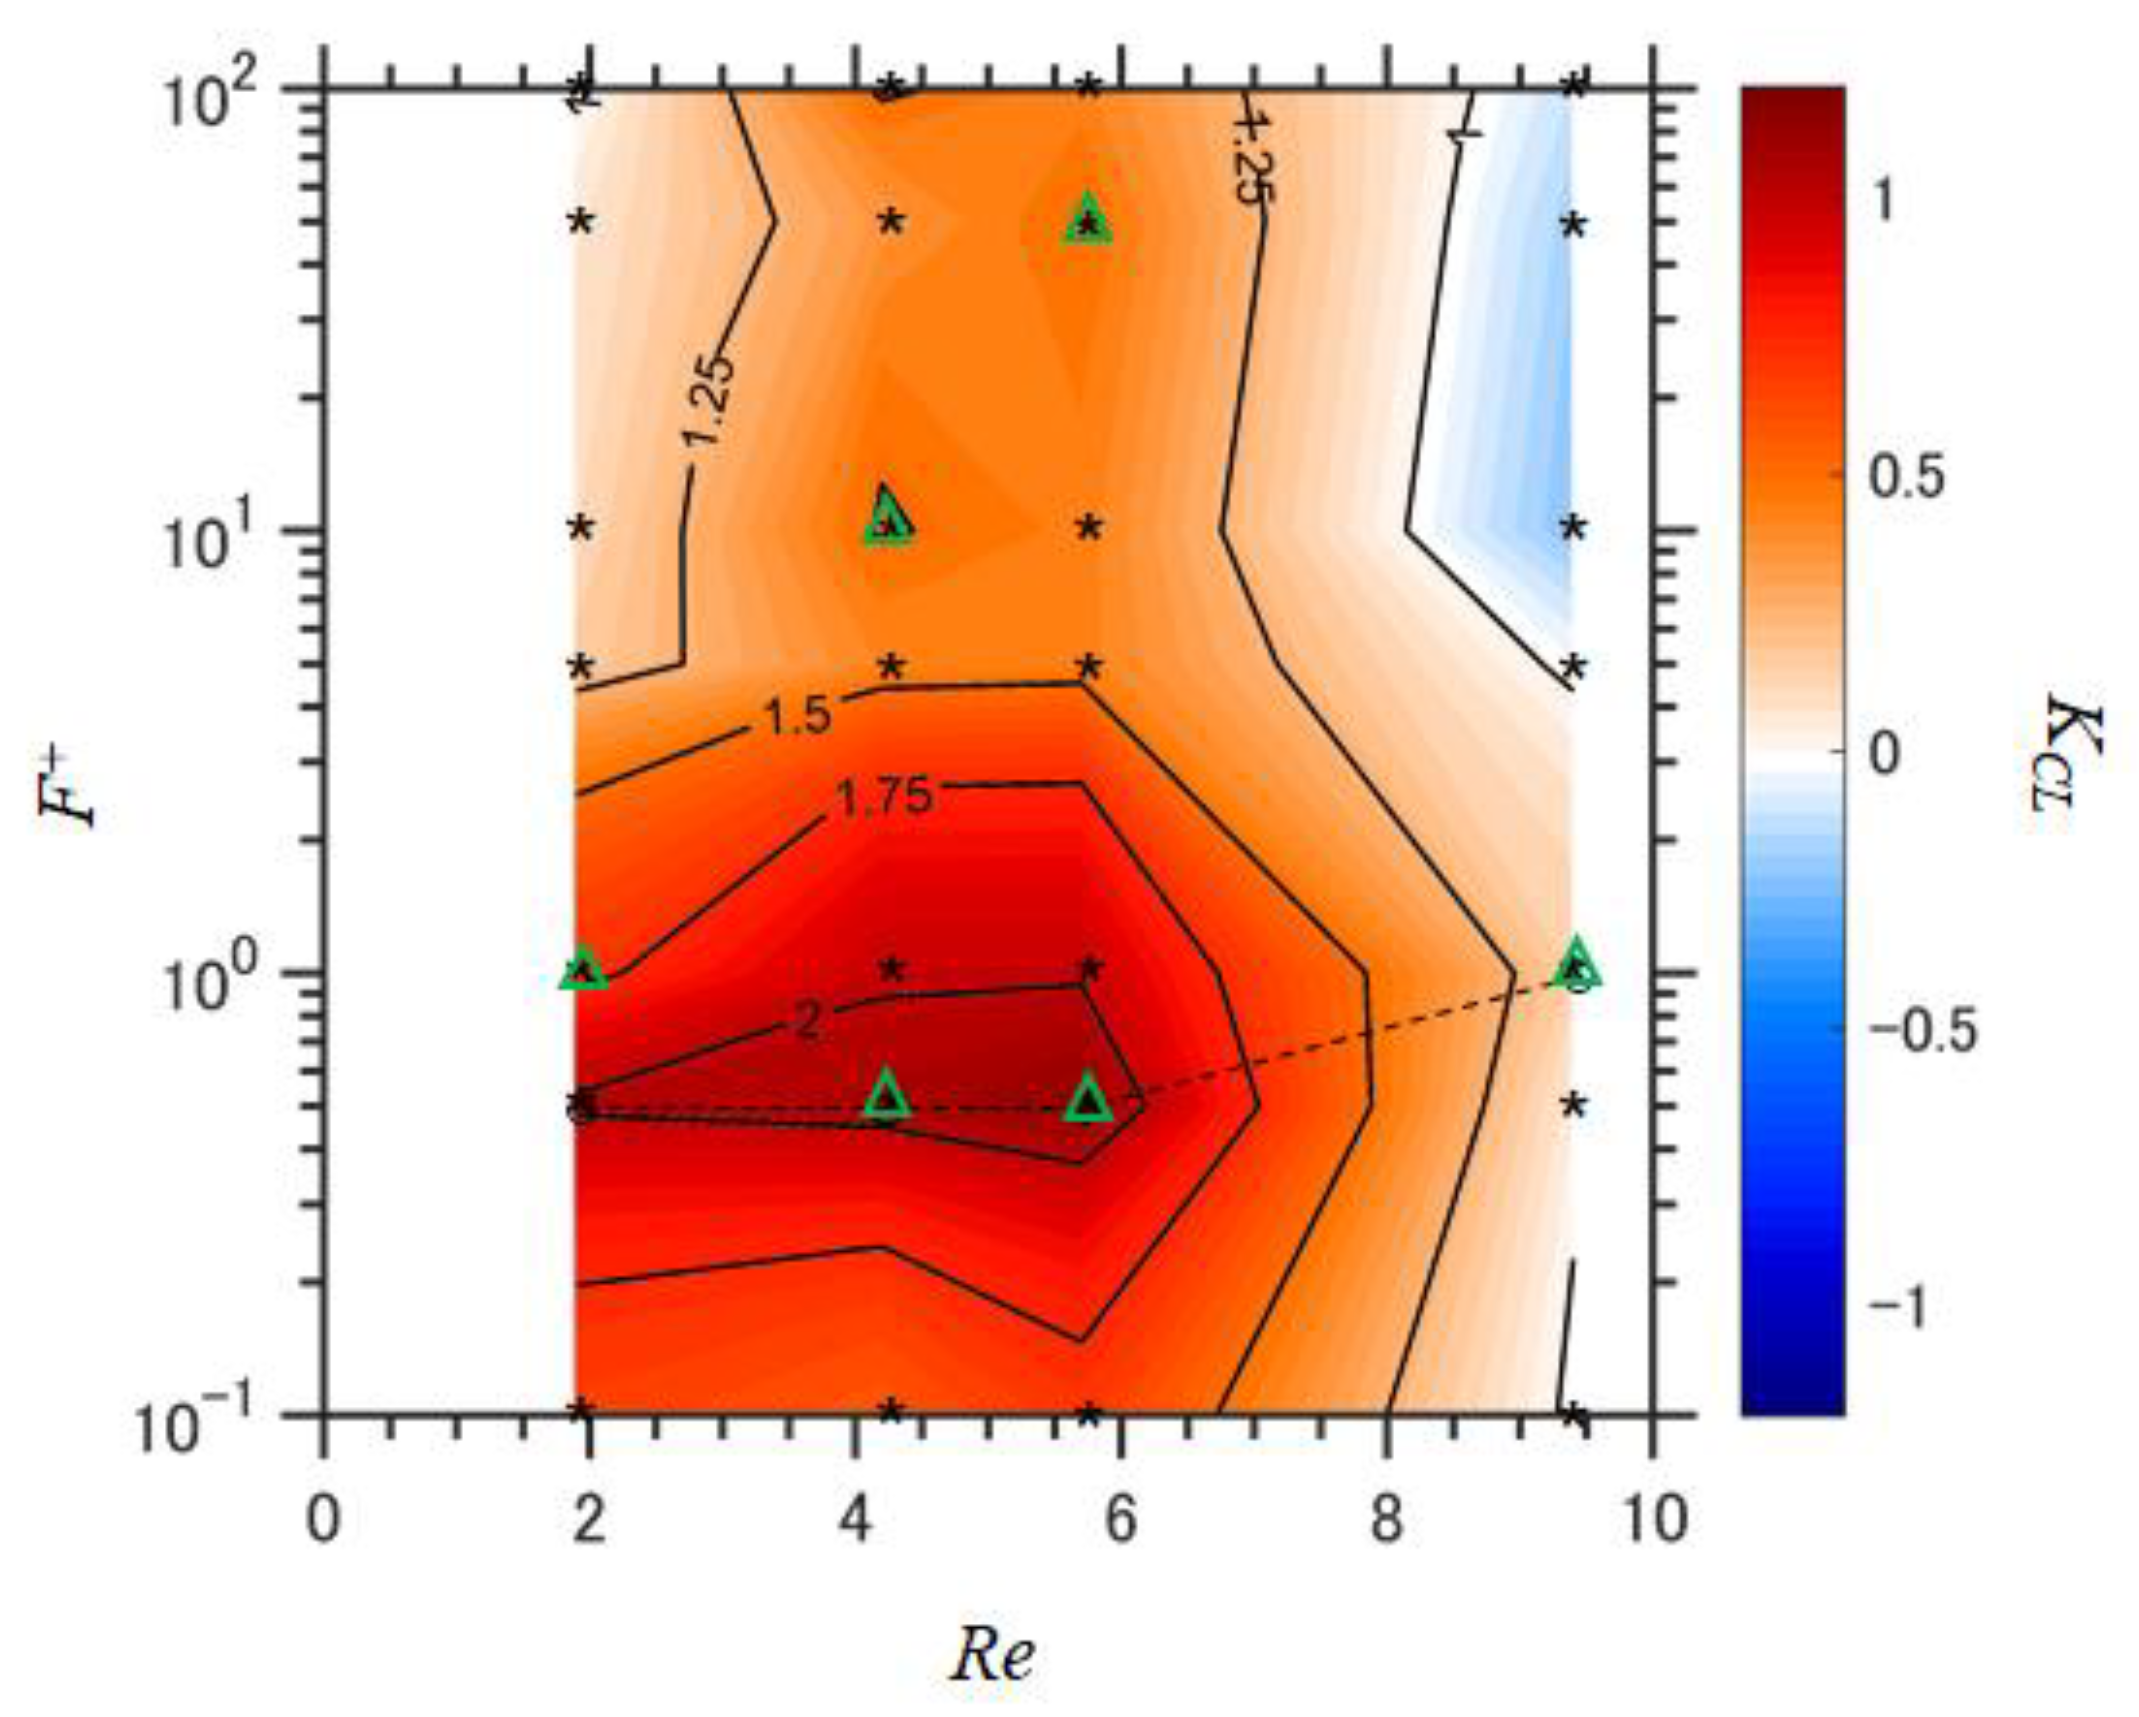
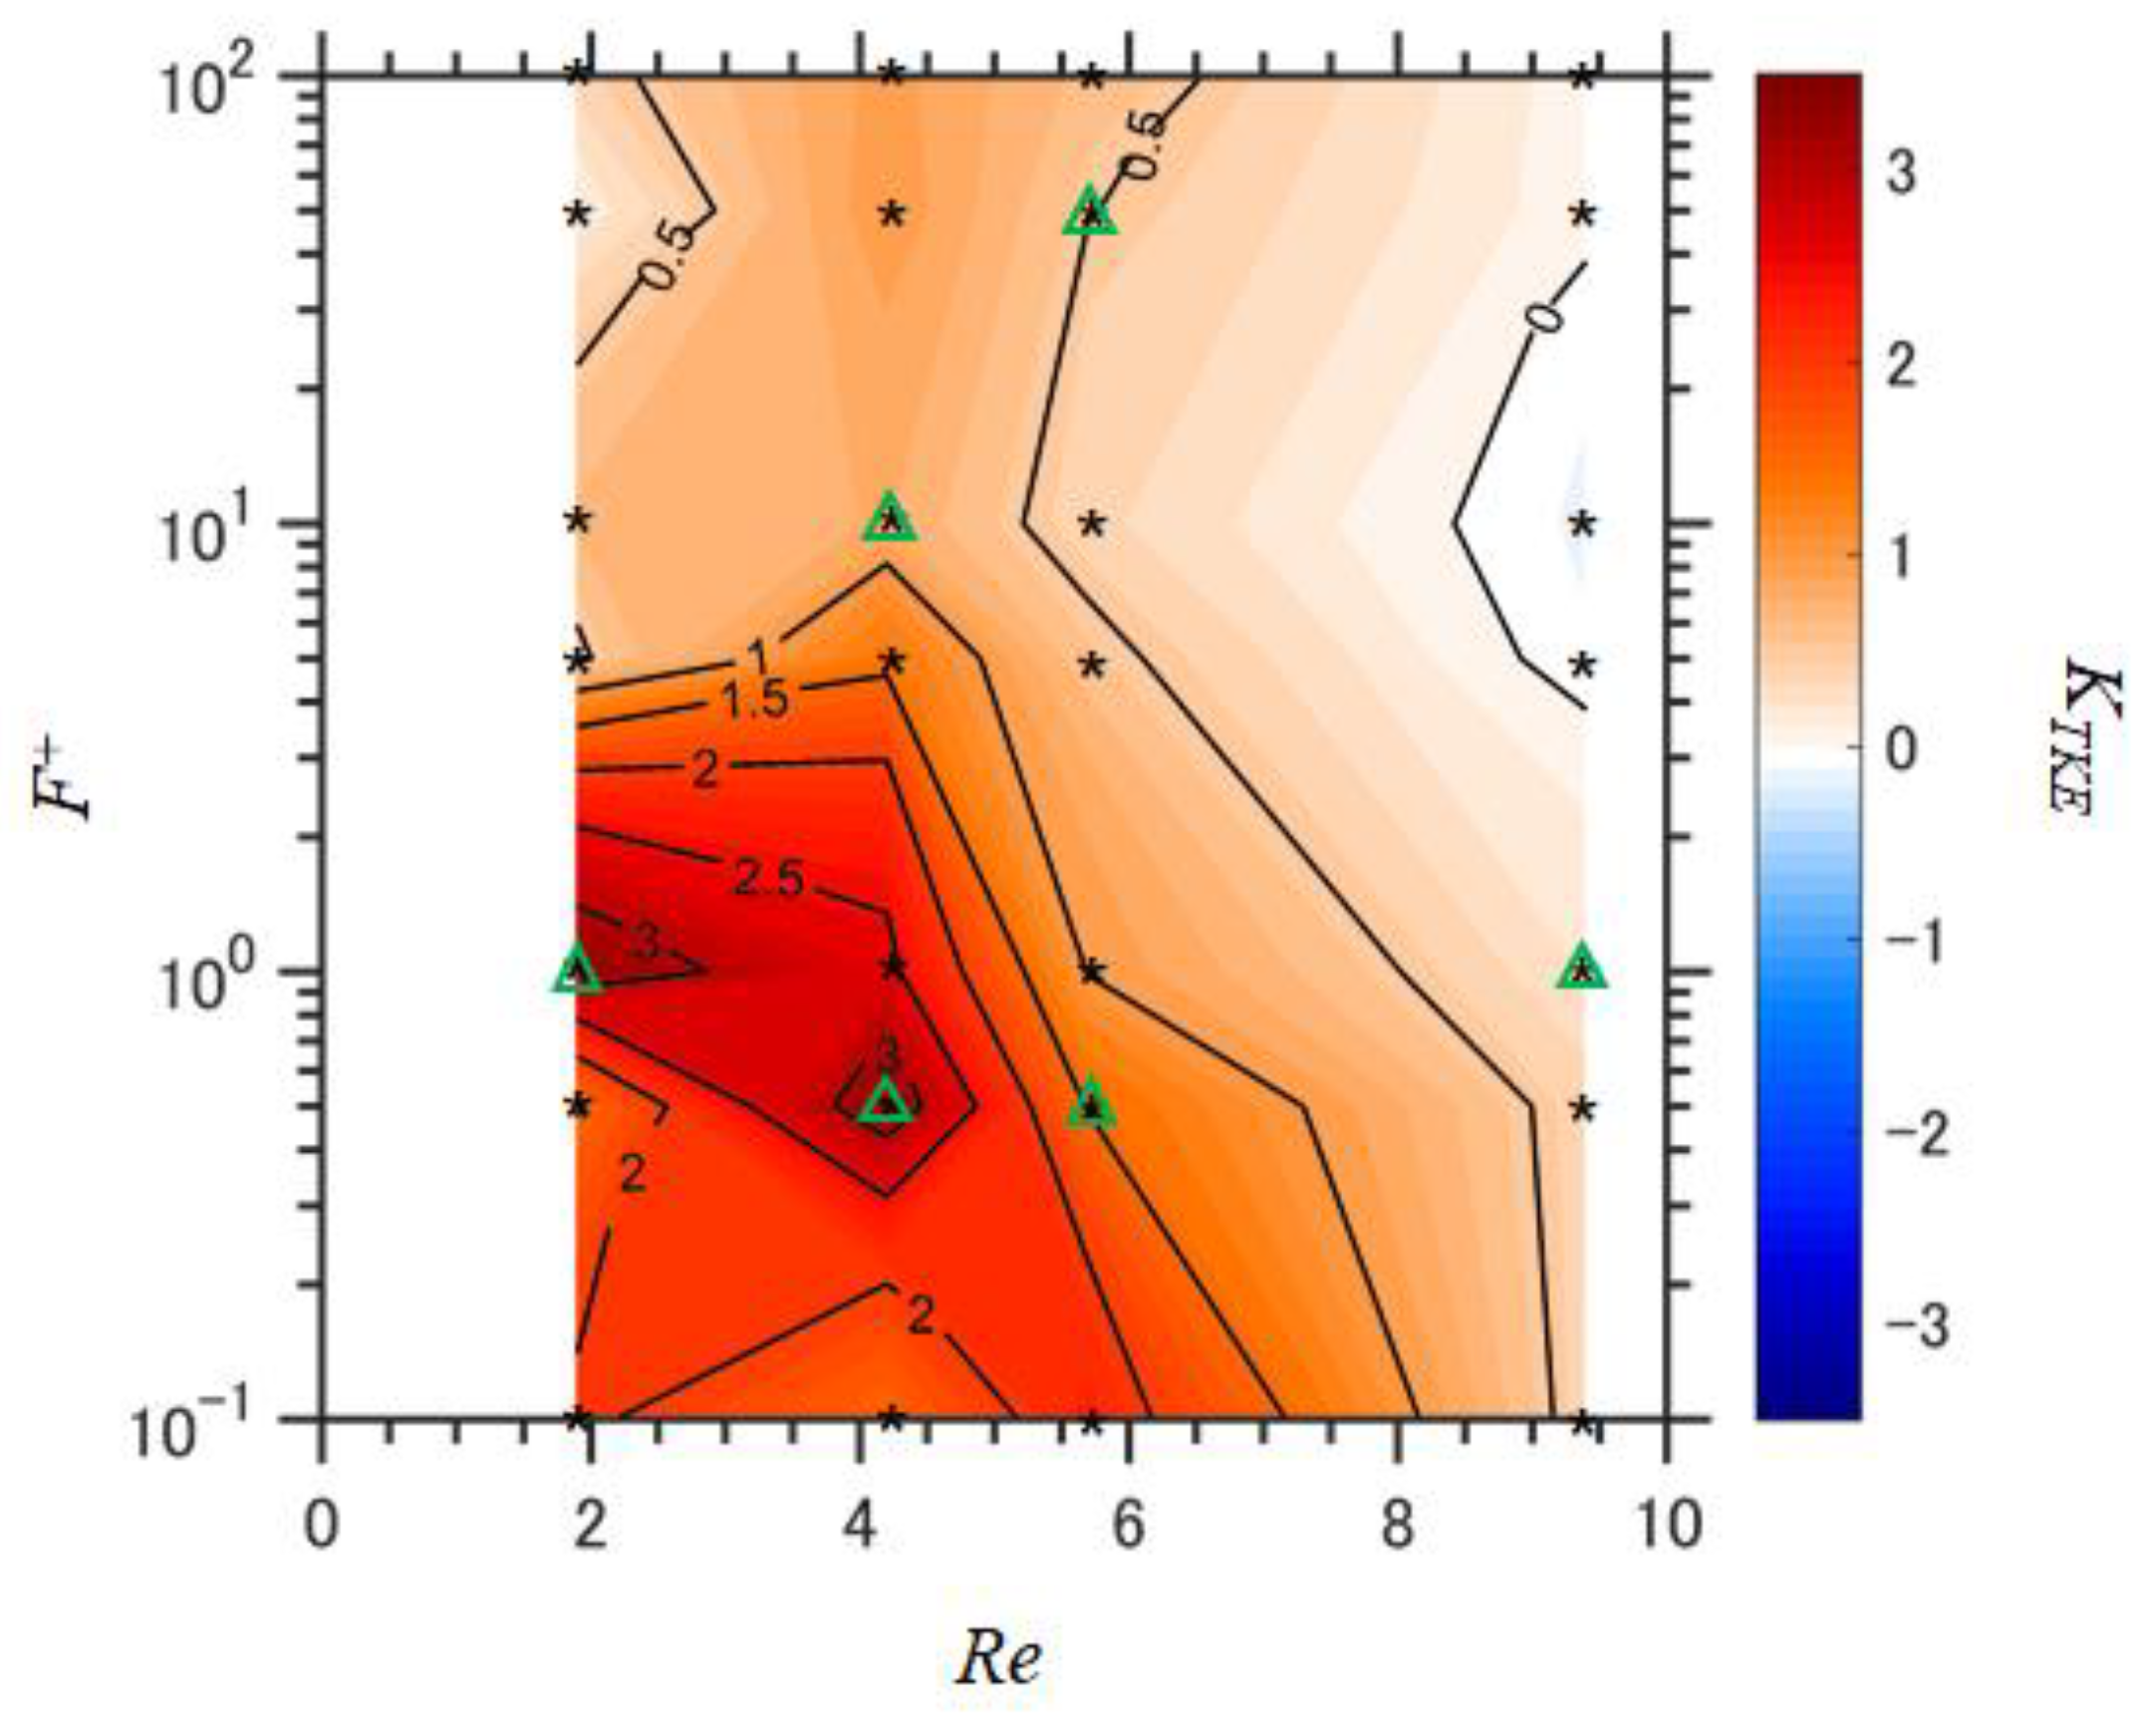
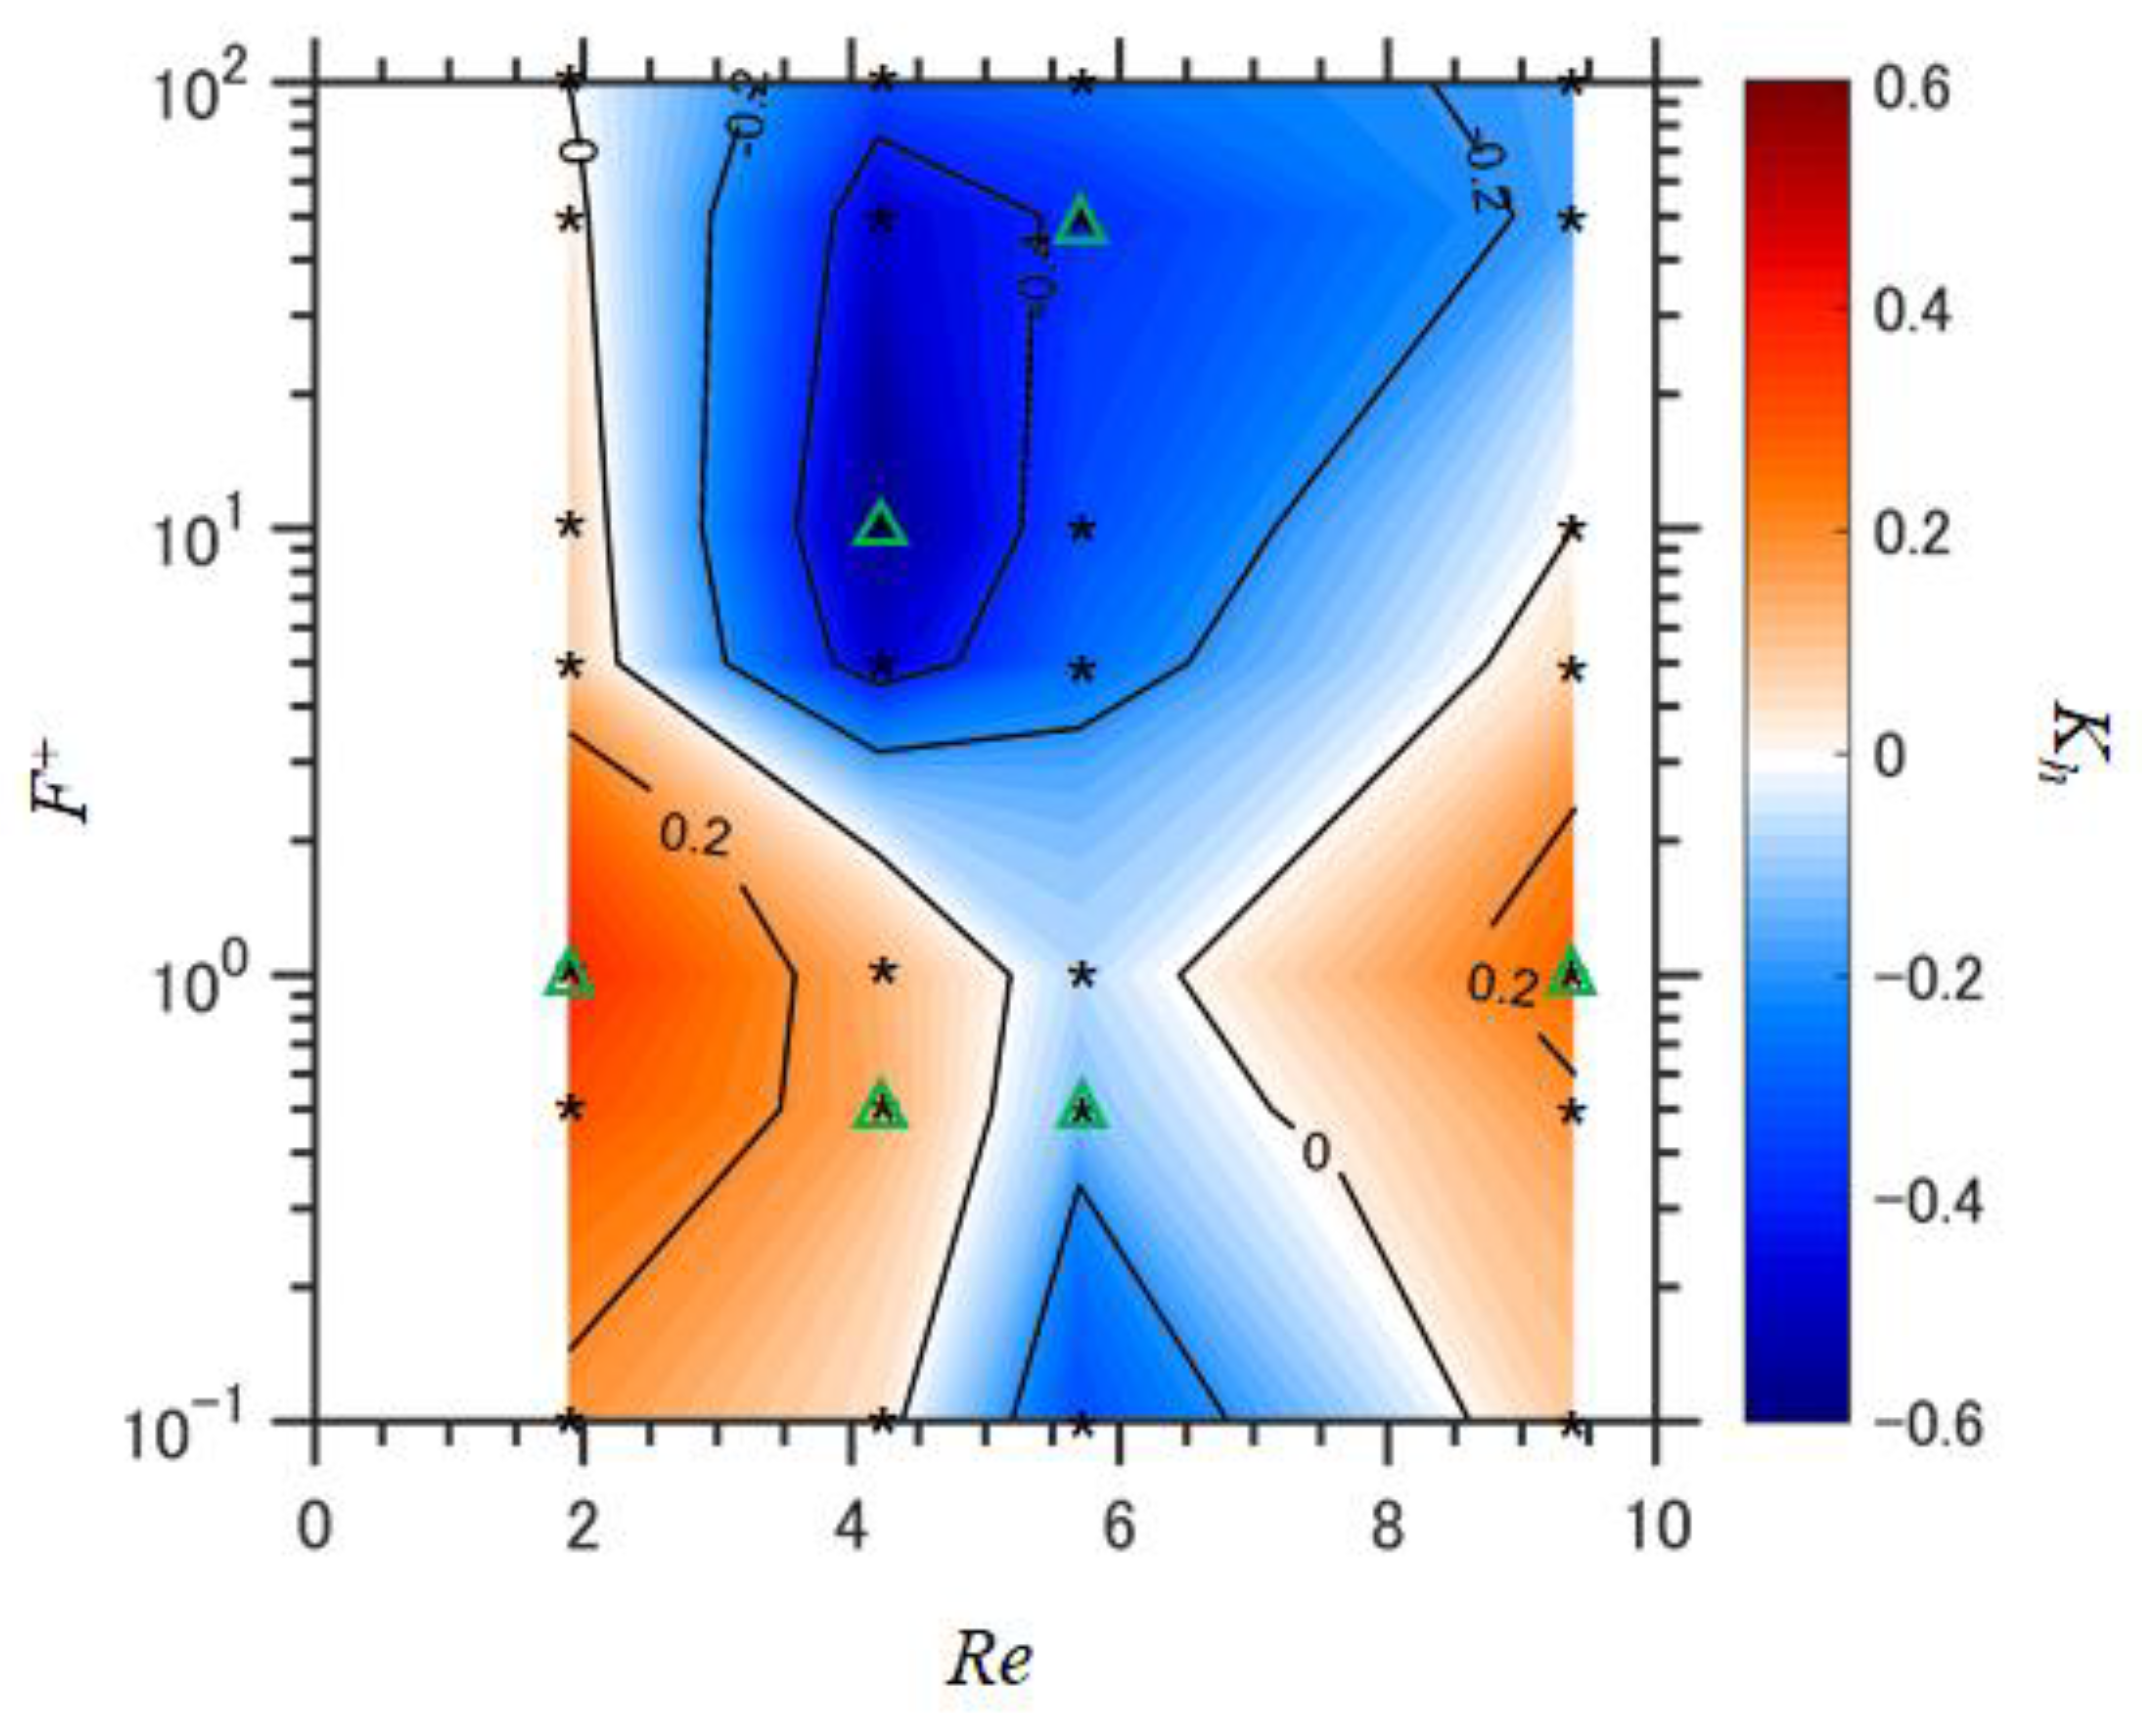
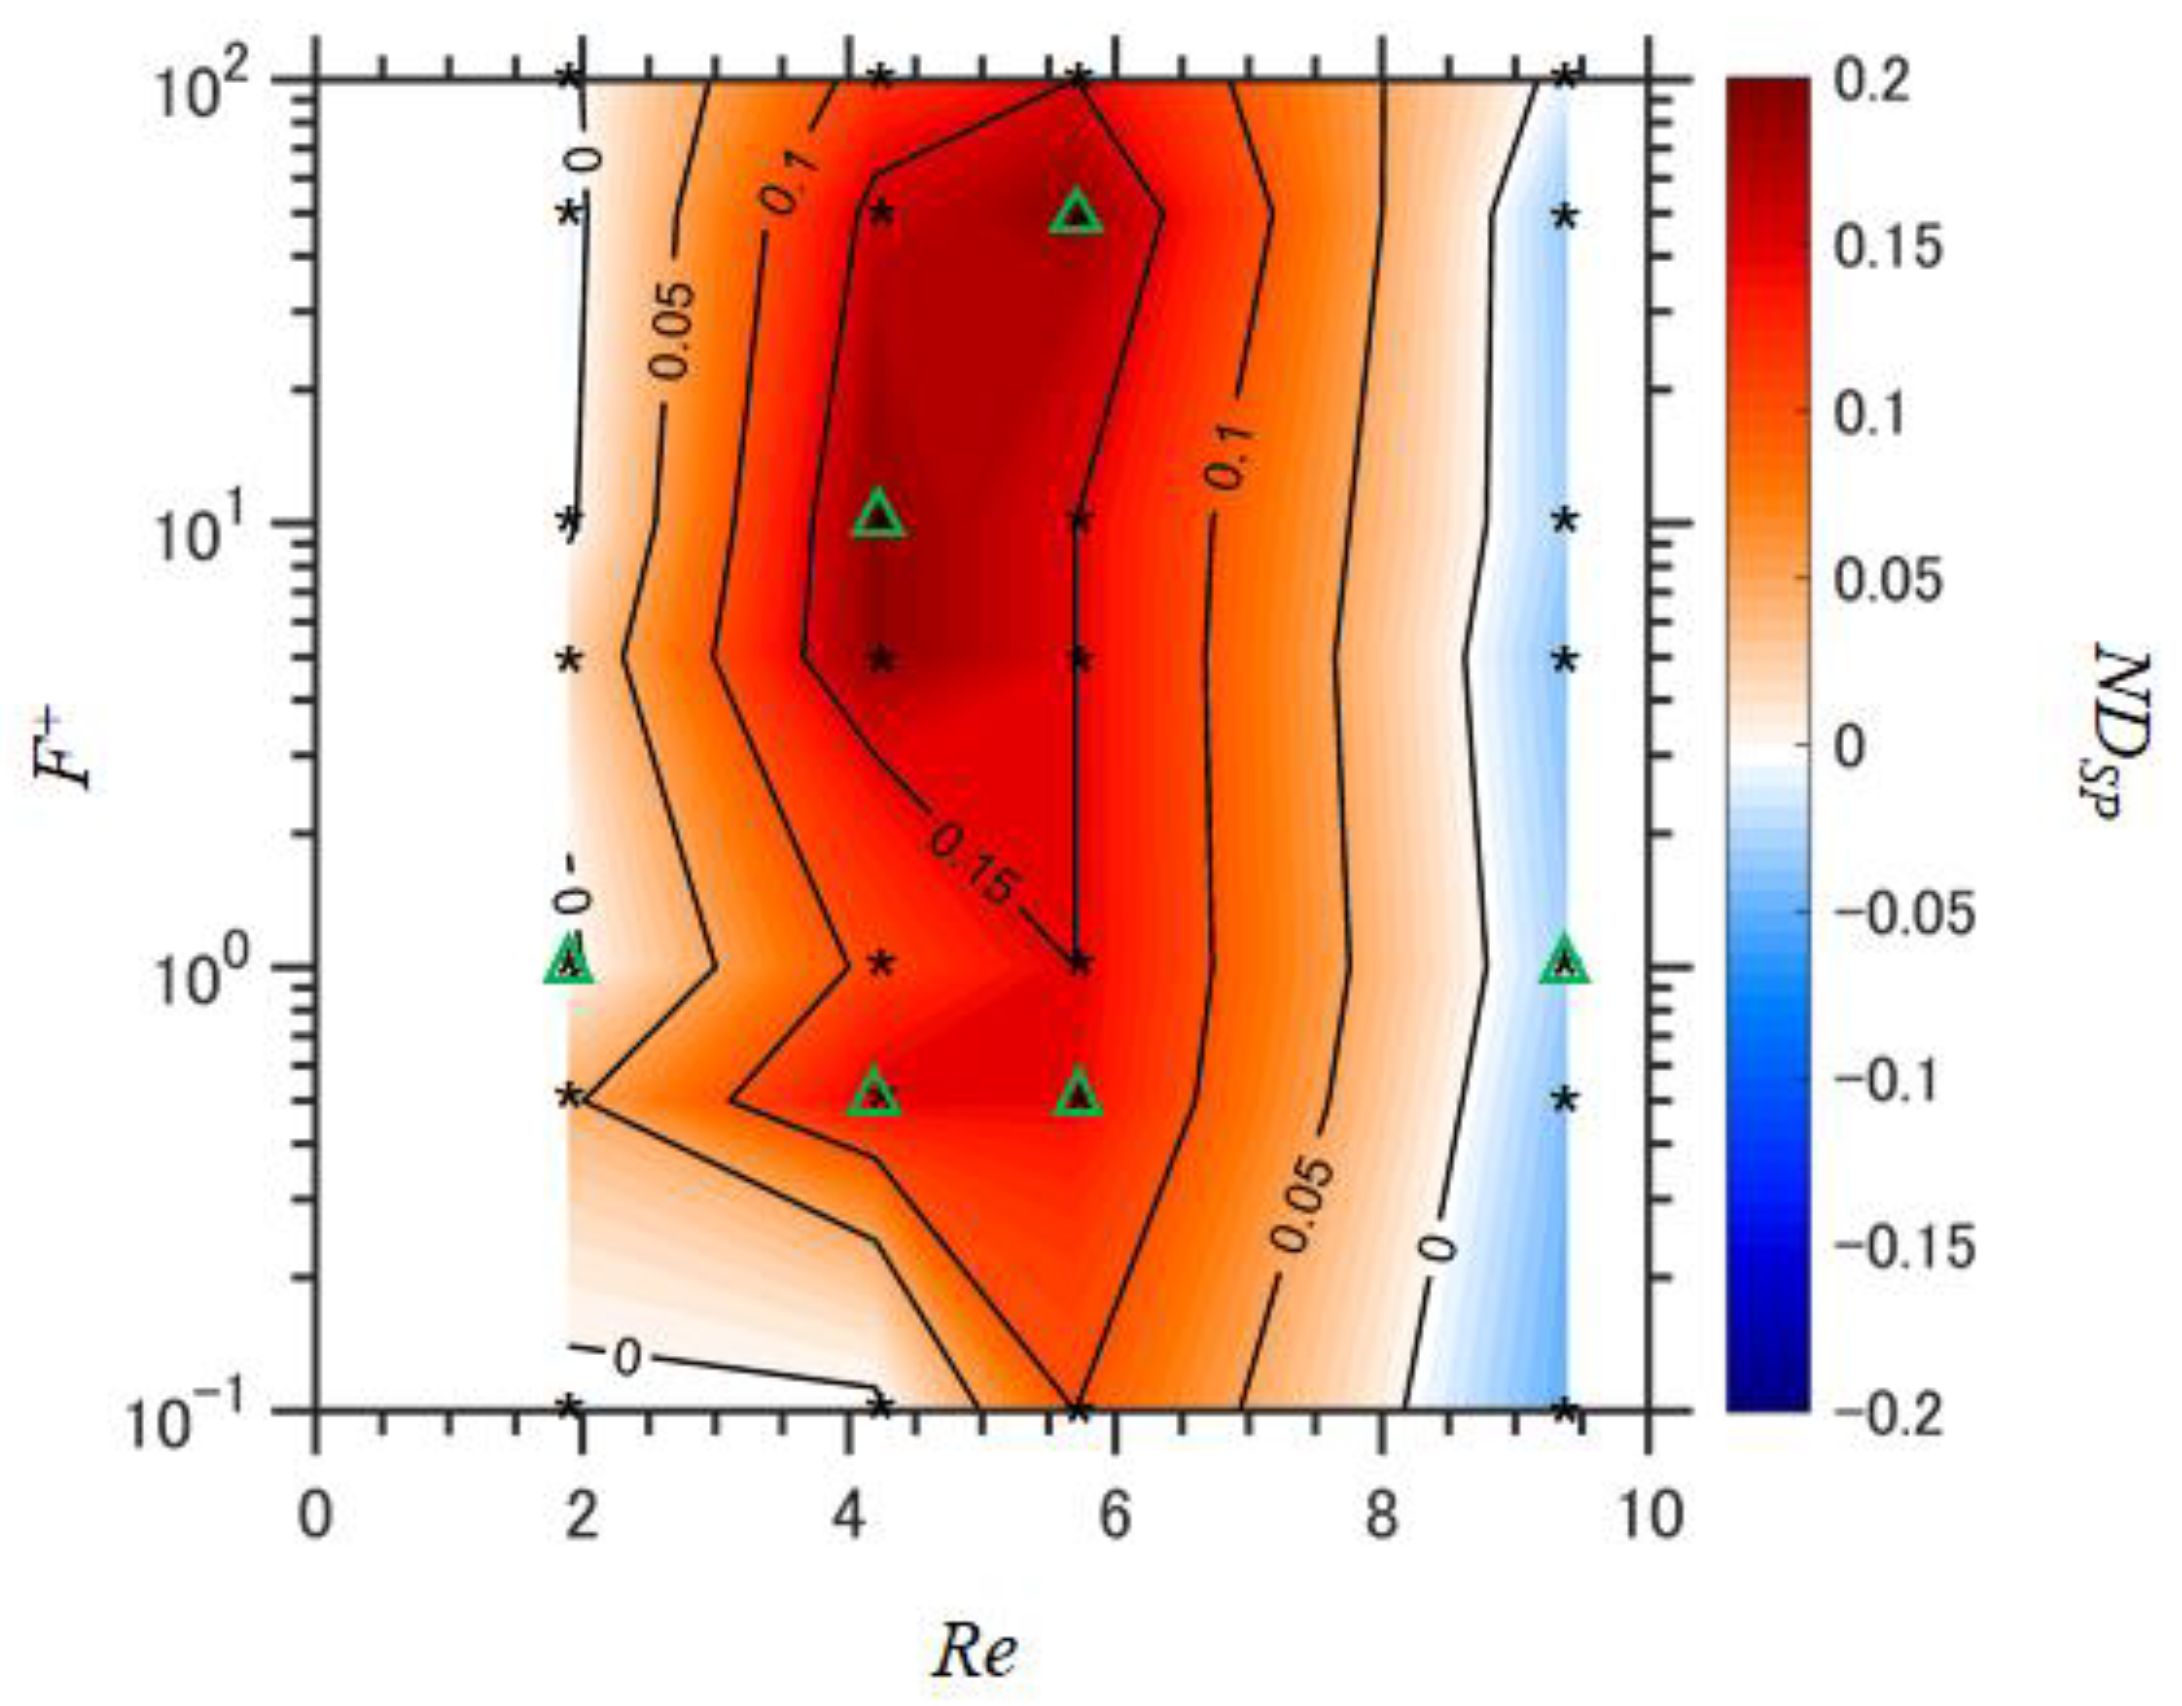
3.4. Dependence of the Four Indices on Re and under a Deep Stall Condition with DBD-PA Actuation
- Increases in TKE in the shear flow on the suction side of the wing.
- Momentum recovery in the flow field on the wing caused by the shear layer being attracted to the wing surface.
- Acceleration of the flow around the leading edge.
3.5. Change in the Velocity Field Caused by DBD-PA Actuation
3.6. Mechanisms for Increasing Lift Using DBD-PA Actuation
4. Conclusions
Author Contributions
Funding
Institutional Review Board Statement
Informed Consent Statement
Data Availability Statement
Conflicts of Interest
References
- Choi, H.; Jeon, W.-P.; Kim, J. Control of flow over a bluff body. Ann. Rev. Fluid Mech. 2008, 40, 113–139. [Google Scholar] [CrossRef]
- Kasagi, N.; Suzuki, Y.; Fukagata, K. Microelectromechanical systems-based feedback control of turbulence for skin friction reduction. Ann. Rev. Fluid Mech. 2009, 41, 231–251. [Google Scholar] [CrossRef]
- Roth, J.; Sherman, D.; Wilkinson, S. Boundary layer flow control with a one atmosphere uniform glow discharge surface plasma. In Proceedings of the 36th AIAA Aerospace Sciences Meeting and Exhibit, Reno, NV, USA, 12–15 January 1998; p. 328. [Google Scholar]
- Post, M.L.; Corke, T.C. Separation control on high angle of attack airfoil using plasma actuators. AIAA J. 2004, 42, 2177–2184. [Google Scholar] [CrossRef]
- Corke, T.C.; Post, M.L.; Orlov, D.M. SDBD plasma enhanced aerodynamics: Concepts, optimization and applications. Prog. Aerosp. Sci. 2007, 43, 193–217. [Google Scholar] [CrossRef]
- Corke, T.C.; Enloe, C.L.; Wilkinson, S.P. Dielectric barrier discharge plasma actuators for flow control. Ann. Rev. Fluid Mech. 2010, 42, 505–529. [Google Scholar] [CrossRef]
- Opaits, D.F. Dielectric Barrier Discharge Plasma Actuator for Flow Control; Princeton University: Princeton, NJ, USA, 2010. [Google Scholar]
- Font, G.I.; Morgan, W.L. Recent progress in dielectric barrier discharges for aerodynamic flow control. Plasma. Phys. 2010, 47, 103–110. [Google Scholar] [CrossRef]
- Roth, J.R.; Dai, X. Optimization of the aerodynamic plasma actuator as an electro-hydrodynamic (EHD) electrical device. In Proceedings of the 44th AIAA Aerospace Science Meeting and Exhibit, Reno, NV, USA, 9–12 January 2006; p. 28. [Google Scholar]
- Thomas, F.O.; Corke, T.C.; Iqbal, M.; Kozlov, A.; Schatzman, D. Optimization of dielectric barrier discharge plasma actuators for active aerodynamic flow control. AIAA J. 2009, 47, 2169–2178. [Google Scholar] [CrossRef]
- Hanson, R.E.; Houser, N.M.; Lavoie, P. Dielectric material degradation monitoring of dielectric barrier discharge plasma actuators. J. Appl. Phys. 2014, 115, 043301. [Google Scholar] [CrossRef]
- Niebsch, J. Determination of Rotor Imbalances; INTECH Open Access Publisher: Rijeka, Croatia, 2011. [Google Scholar]
- Shohag, M.A.S.; Hammel, E.C.; Olawale, D.O.; Okoli, O.I. Damage mitigation techniques in wind turbine blades: A review. Wind Eng. 2017, 41, 185–210. [Google Scholar] [CrossRef]
- McKenna, R.; Ostman, V.D.; Leye, P.; Fichtner, W. Key challenges and prospects for large wind turbines. Renew. Sustain. Energy Rev. 2016, 53, 1212–1221. [Google Scholar] [CrossRef]
- Barlas, T.K.; van Kuik, G.A.M. Review of state of the art in smart rotor control research for wind turbines. Prog. Aerosp. Sci. 2010, 46, 1–27. [Google Scholar] [CrossRef]
- Van Dam, C.P.; Berg, D.E.; Johnson, S.J. Active Load Control Techniques for Wind Turbines (No. SAND2008-4809); Sandia National Laboratories (SNL): Albuquerque, NM, USA; Livermore, CA, USA, 2008.
- Berg, D.; Berg, J.; White, J.; Resor, B.; Rumsey, M. Design, Fabrication, Assembly and Initial Testing of a SMART rotor. In Proceedings of the 49th AIAA Aerospace Sciences Meeting including the New Horizons Forum and Aerospace Exposition, Orlando, FL, USA, 4–7 January 2011; p. 636. [Google Scholar]
- Pechlivanoglou, G.; Nayeri, C.N.; Paschereit, C.O. Performance Optimization of Wind Turbine Rotors with Active Flow Control. In Proceedings of the ASME 2011 Turbo Expo; Turbine Technical Conference and Exposition, Vancouver, BC, Canada, 6–10 June 2011; Volume 54617, pp. 763–775. [Google Scholar]
- Mayank, C.; Sakib, S.M.; Griffith, T.D.; Abhineet, G.; Rotea, A.M. Design of a 3.4-MW wind turbine with integrated plasma actuator-based load control. Wind Energy 2022, 25, 517–536. [Google Scholar]
- Mohammad, A.D.; Sarallah, A. A novel approach to performance improvement of a VAWT using plasma actuators. J. Clean Prod. 2023, 424, 138876. [Google Scholar]
- Tanaka, M.; Kubo, N.; Kawabata, H.; Suzuki, K.; Bhandari, S.; Watanabe, N.; Sato, H.; Takeyama, M.; Minegishi, K.; Oryu, Y. The First Trial Operation of Plasma Assisted 300 kw Wind Turbine with Durable, Retrofitted DBD Electrodes. In Proceedings of the Wind Energy Science Conference 2019, Cork, Paper No. 609, Cork, Ireland, 17–20 June 2019. [Google Scholar]
- Tanaka, M.; Kubo, N.; Kawabata, H. Plasma actuation for leading edge separation control on 300-kW rotor blades with chord lengths around 1 m at a Reynolds number around 1.6 × 10⁶. J. Phys. Conf. Ser. 2020, 1618, 052013. [Google Scholar] [CrossRef]
- Suzuki, R.; Kamada, Y.; Maeda, T.; Iwahashi, K.; Tanaka, M.; Kubo, N.; Watanabe, N. Effect of Plasma Actuation Control on a Field Rotor of HAWT. Proc. ICFD 2023, 20, 492–495. [Google Scholar]
- Roth, J.R.; Sherman, D.M.; Wilkinson, S.P. Electrohydrodynamic flow control with a glow-discharge surface plasma. AIAA J. 2000, 38, 1166–1172. [Google Scholar] [CrossRef]
- Corke, T.; Jumper, E.; Post, M.; Orlov, D.; McLaughlin, T. Application of Weakly-Ionized Plasmas as Wing Flow-Control Devices. In Proceedings of the 40th AIAA Aerospace WSciences Meeting & Exhibit, Reno, NV, USA, 14–17 January 2002; p. 350. [Google Scholar]
- Vorobiev, A.N.; Rennie, R.M.; Jumper, E.J. Experimental investigation of lift enhancement and roll control using plasma actuators. J. Aircr. 2008, 35, 1315–1321. [Google Scholar] [CrossRef]
- Mabe, J.H.; Calkins, F.T.; Wesley, B.; Woszidlo, R.; Taubert, L.; Wygnanski, I. Single dielectric barrier discharge plasma actuators for improved airfoil performance. J. Aircr. 2009, 46, 847–855. [Google Scholar] [CrossRef]
- Vorobiev, A.; Rennie, R.M.; Jumper, E.J. Lift enhancement by plasma actuators at low Reynolds numbers. J. Aircr. 2013, 50, 12–19. [Google Scholar] [CrossRef]
- Daud, N.M.; Kozato, Y.; Kikuchi, S.; Imao, S. Control of leading edge separation on airfoil using DBD plasma actuator. J. Fluid Sci. Tech. 2014, 9, JFST0049. [Google Scholar] [CrossRef]
- Sekimoto, S.; Nonomura, T.; Fujii, K. Burst-mode frequency effects of dielectric barrier discharge plasma actuator for separation control. AIAA J. 2017, 55, 1385–1392. [Google Scholar] [CrossRef]
- Mahdavi, H.; Daliri, A.; Sohbatzadeh, F.; Shirzadi, M.; Rezanejad, M. A single unsteady DBD plasma actuator excited by applying two high voltages simultaneously for flow control. Phys. Plasmas. 2020, 27, 083514. [Google Scholar] [CrossRef]
- Little, J.; Nishihara, M.; Adamovich, I.; Samimy, M. High-lift airfoil trailing edge separation control using a single dielectric barrier discharge plasma actuator. Exp. Fluids 2009, 48, 521–537. [Google Scholar] [CrossRef]
- Pescini, E.; Marra, F.; De Giorgi, M.G.; Francioso, L.; Ficarella, A. Investigation of the boundary layer characteristics for assessing the DBD plasma actuator control of the separated flow at low Reynolds numbers. Exp. Therm. Fluid Sci. 2017, 81, 482–498. [Google Scholar] [CrossRef]
- Skourides, C.; Nyfantis, D.; Leyland, P.; Bosse, H. Mechanisms of control authority by nanosecond pulsed dielectric barrier discharge actuators on flow separation. Appl. Sci. 2019, 9, 2989. [Google Scholar] [CrossRef]
- Sato, M.; Aono, H.; Yakeno, A.; Nonomura, T.; Fujii, K.; Okada, K.; Asada, K. Multifactorial effects of operating conditions of dielectric-barrier-discharge plasma actuator on laminar-separated-flow control. AIAA J. 2015, 53, 2544–2559. [Google Scholar]
- Aono, H.; Kawai, S.; Nonomura, T.; Sato, M.; Fujii, K.; Okada, K. Plasma-actuator burst-mode frequency effects on leading-edge flow-separation control at Reynolds number 2.6 × 10⁵. AIAA J. 2017, 55, 3789–3806. [Google Scholar] [CrossRef]
- Wu, B.; Gao, C.; Liu, F.; Xue, M.; Zheng, B. Simulation of NACA0015 flow separation control by burst-mode plasma actuation. Phys. Plasmas. 2019, 26, 063507. [Google Scholar]
- Tanaka, M.; Amemori, K.; Matsuda, H.; Shimura, N.; Yasui, H.; Osako, T.; Kamada, Y.; Maeda, T. Field Test of Plasma Aerodynamic Controlled Wind Turbine; In Proceedings of the EWEA 2013 Annual Event, Vienna, Austria, 4–7 February 2013.
- Sato, M.; Okada, K. LES of Separated-Flow Controlled by DBD Plasma Actuator Around NACA 0015 over Reynolds Number Range of 104–106. In Proceedings of the 53rd AIAA Aerospace Sciences Meeting, Kissimmee, FL, USA, 5–9 January 2015. [Google Scholar]
- Sato, M.; Asada, K.; Nonomura, T.; Aono, H.; Yakeno, A.; Fujii, K. Effective Mechanisms for Turbulent-Separation Control by DBD Plasma Actuator Around NACA0015 at Reynolds Number 1,600,000. In Proceedings of the 7th AIAA Flow Control Conference, Atlanta, GA, USA, 16–20 June 2014; p. 2663. [Google Scholar]
- Suzen, Y.B.; Huang, P.G. Simulations of Flow Separation Control using Plasma Actuators. In Proceedings of the 44th AIAA Aerospace Science Meeting and Exhibit, Reno, NV, USA, 9–12 January 2006. [Google Scholar]
- Patel, M.P.; Vasudevan, T.T.; Ng, S.; Corke, T.C.; Post, M.L.; McLaughlin, T.E.; Suchomel, C.F. Scaling effects of an aerodynamic plasma actuator. J. Aircr. 2008, 45, 223–236. [Google Scholar] [CrossRef]
- Little, J.; Takashima, K.; Nishihara, M.; Adamovich, I.; Samimy, M. Separation control with nanosecond-pulse-driven dielectric barrier discharge plasma actuators. AIAA J. 2012, 50, 350–365. [Google Scholar] [CrossRef]
- Zhang, X.; Huang, Y.; Wang, X.; Wang, W.; Tang, K.; Li, H. Turbulent boundary layer separation control using plasma actuator at Reynolds number 2000000. Chin. J. Aeronaut. 2016, 29, 1237–1246. [Google Scholar] [CrossRef]
- Keisar, D.; Hasin, D.; Greenblatt, D. Plasma actuator application on a full-scale aircraft tail. AIAA J. 2019, 57, 616–627. [Google Scholar] [CrossRef]
- Moreau, E.; Debien, A.; Breux, J.M.; Benard, N. Control of a turbulent flow separated at mid-chord along an airfoil with DBD plasma actuators. J. Electrostat. 2016, 83, 78–87. [Google Scholar] [CrossRef]
- Omidi, J.; Mazaheri, K. Aerodynamic enhancement and improving the performance of a six-megawatt DOWEC wind turbine by micro-plasma actuator. Int. J. Mech. Sci. 2021, 195, 106228. [Google Scholar] [CrossRef]
- Samimy, M.; Kim, J.-H.; Kastner, J.; Adamovich, I.; Utkin, Y. Active control of high-speed and high-Reynolds-number jets using plasma actuators. J. Fluid Mech. 2007, 578, 305–330. [Google Scholar] [CrossRef]
- Little, J.; Samimy, M. Control of Separation from the Flap of a High-Lift Airfoil with DBD Plasma Actuation. In Proceedings of the 48th AIAA Aerospace Sciences Meeting Including the New Horizons Forum and Aerospace Exposition, Orlando, FL, USA, 4–7 January 2010; p. 1088. [Google Scholar]
- Goeksel, B.; Greenblatt, D.; Rechenberg, I.; Nayeri, C.; Paschereit, C. Steady and Unsteady Plasma Wall Jets for Separation and Circulation Control. In Proceedings of the 3rd AIAA Flow Control Conference, San Francisco, CA, USA, 5–8 June 2006; p. 3686. [Google Scholar]
- Sidorenko, A.A.; Zanin, B.Y.; Postnikov, B.V.; Budovsky, A.D.; Starikovskii, A.Y.; Roupassov, D.V.; Zavialov, I.N.; Malmuth, N.D.; Smereczniak, P.; Silkey, J.S. Pulsed Discharge Actuators for Rectangular Wings Separation Control. In Proceedings of the 45th AIAA Aerospace Sciences Meeting and Exhibit, Reno, NV, USA, 8–11 January 2007; p. 941. [Google Scholar]
- Wong, C.W.; Wang, L.; Ma, W.; Zhou, Y. New sawtooth plasma actuator configuration and mechanism behind improved control performance. AIAA J. 2020, 58, 1–6. [Google Scholar] [CrossRef]
- Asada, K.; Ninomiya, Y.; Fujii, K.; Oyama, A. Airfoil Flow Experiment on the Duty Cycle of DBD Plasma Actuator. In Proceedings of the 47th AIAA Aerospace Sciences Meeting including The New Horizons Forum and Aerospace Exposition, Orlando, FL, USA, 8–11 January 2009; p. 531. [Google Scholar]
- Esfahani, A.; Webb, N.; Samimy, M. Stall cell formation over a post-stall airfoil: Effects of active perturbations using plasma actuators. Exp. Fluids 2018, 59, 132. [Google Scholar] [CrossRef]
- Esfahani, A.; Webb, N.; Samimy, M. Flow separation control over a thin post-stall airfoil: Effects of excitation frequency. AIAA J. 2019, 57, 1826–1838. [Google Scholar] [CrossRef]
- Ogawa, T.; Asada, K.; Yakeno, A.; Fujii, K. Revisiting Burst Drive Conditions of DBD Plasma Actuator for Airfoil Flow Control. In Proceedings of the AIAA SCITECH 2024 Forum, Orlando, FL, USA, 8–12 January 2024. [Google Scholar] [CrossRef]
- Sato, M.; Nonomura, T.; Okada, K.; Asada, K.; Aono, H.; Yakeno, A.; Abe, Y.; Fujii, K. Mechanisms for laminar separated-flow control using dielectricbarrier-discharge plasma actuator at low Reynolds number. Phys. Fluids 2015, 27, 117101. [Google Scholar] [CrossRef]
- Asada, K.; Nonomura, T.; Aono, H.; Sato, M.; Okada, K.; Fujii, K. LES of transient flows controlled by DBD plasma actuator over a stalled airfoil. Int. J. Comput. Fluid Dyn. 2015, 29, 215–229. [Google Scholar] [CrossRef]
- Asada, K.; Fujii, K. Burst Frequency Effect of DBD Plasma Actuator on the Control of Separated Flow over an Airfoil. In Proceedings of the 6th AIAA Flow Control Conference, New Orleans, LA, USA, 25–28 June 2012; p. 3054. [Google Scholar]
- Aono, H.; Okada, K.; Nonomura, T.; Kawai, S.; Sato, M.; Yakeno, A.; Fujii, K. Effects of burst frequency and momentum coefficient of DBD actuator on control of deep-stall flow around NACA0015 at Rec = 2.6 × 5. In Proceedings of the 52nd Aerospace Sciences Meeting, National Harbo, ML, USA, 13–17 January 2014; p. 0766. [Google Scholar]
- Fujii, K. High-performance computing based exploration of flow control with micro devices. Phil. Trans. Roy. Soc. A. 2014, 372, 1471–2962. [Google Scholar] [CrossRef]
- Murphy, J.P.; Kriegseis, J.; Lavoie, P. Scaling of maximum velocity, body force, and power consumption of dielectric barrier discharge plasma actuators via paricle image velocimetry. J. Appl. Phys. 2013, 113, 243301. [Google Scholar] [CrossRef]
- Boeuf, J.; Pitchford, L. Electrohydrodynamic force and aerodynamic flow acceleration in surface dielectric barrier discharge. J. Appl. Phys. 2005, 97, 103307. [Google Scholar] [CrossRef]
- Yousefi, K.; Razeghi, A. Determination of the Critical Reynolds Number for Flow Over Symmetric NACA Airfoils. In Proceedings of the 2018 AIAA Aerospace Sciences Meeting, Kissimmee, FL, USA, 8–12 January 2018; p. 0818. [Google Scholar]
- Mitsuo, K.; Watanabe, S.; Atobe, T.; Kato, H. Lift enhancement of a pitching airfoil in dynamic stall by DBD plasma actuators. In Proceedings of the 51st AIAA Aerospace Sciences Meeting including the New Horizons Forum and Aerospace Exposition, Grapevine, TX, USA, 7–10 January 2013; p. 1119. [Google Scholar]
- Kurelek, W.J.; Kotsonis, M.; Yarusevych, S. Superposition of AC-DBD plasma actuator outputs for three-dimensional disturbance production in shear flows. Exp. Fluids 2023, 64, 84. [Google Scholar] [CrossRef]
- Fujii, K. Three flow features behind the flow control authority of DBD plasma actuator: Result of high-fidelity simulations and the related experiments. Appl. Sci. 2018, 8, 546. [Google Scholar] [CrossRef]


| Suction Side | Pressure Side | ||
|---|---|---|---|
| * −0.3 | 0.000 | ||
| * −0.29 | 0.009 | * −0.29 | −0.009 |
| −0.275 | 0.018 | −0.28 | −0.018 |
| −0.26 | 0.027 | −0.27 | −0.027 |
| −0.24 | 0.036 | −0.25 | −0.036 |
| −0.213 | 0.045 | −0.228 | −0.045 |
| −0.18 | 0.055 | −0.2 | −0.055 |
| −0.14 | 0.064 | −0.165 | −0.064 |
| −0.1 | 0.073 | −0.12 | −0.073 |
| −0.053 | 0.082 | −0.065 | −0.082 |
| 0 | 0.091 | 0 | −0.091 |
| 0.06 | 0.100 | 0.1 | −0.100 |
| 0.125 | 0.109 | 0.3 | −0.109 |
| 0.2 | 0.118 | 0.5 | −0.118 |
| 0.28 | 0.127 | 0.64 | −0.127 |
| 0.345 | 0.136 | 0.7 | −0.136 |
| 0.4 | 0.145 | ||
| 0.44 | 0.155 | ||
| 0.48 | 0.164 | ||
| 0.52 | 0.173 | ||
| 0.56 | 0.182 | ||
| 0.6 | 0.191 | ||
| 0.64 | 0.200 | ||
| Re (×105) | |||||
|---|---|---|---|---|---|
| 1.9 | 1.0 | 0.709 | 3.28 | 0.382 | −0.005 |
| 4.2 | 0.50 | 1.06 | 3.32 | 0.149 | 0.150 |
| 4.2 | 10 | 0.511 | 0.778 | −0.573 | 0.190 |
| 5.7 | 1.0 | 1.14 | 1.47 | −0.115 | 0.145 |
| 5.7 | 50 | 0.501 | 0.509 | −0.383 | 0.190 |
| 9.4 | 1.0 | 0.151 | 0.213 | 0.274 | −0.03 |
Disclaimer/Publisher’s Note: The statements, opinions and data contained in all publications are solely those of the individual author(s) and contributor(s) and not of MDPI and/or the editor(s). MDPI and/or the editor(s) disclaim responsibility for any injury to people or property resulting from any ideas, methods, instructions or products referred to in the content. |
© 2024 by the authors. Licensee MDPI, Basel, Switzerland. This article is an open access article distributed under the terms and conditions of the Creative Commons Attribution (CC BY) license (https://creativecommons.org/licenses/by/4.0/).
Share and Cite
Kubo, N.; Bhandari, S.; Tanaka, M.; Nonomura, T.; Kawabata, H. Experimental Parametric Study on Flow Separation Control Mechanisms around NACA0015 Airfoil Using a Plasma Actuator with Burst Actuation over Reynolds Numbers of 105–106. Appl. Sci. 2024, 14, 4652. https://doi.org/10.3390/app14114652
Kubo N, Bhandari S, Tanaka M, Nonomura T, Kawabata H. Experimental Parametric Study on Flow Separation Control Mechanisms around NACA0015 Airfoil Using a Plasma Actuator with Burst Actuation over Reynolds Numbers of 105–106. Applied Sciences. 2024; 14(11):4652. https://doi.org/10.3390/app14114652
Chicago/Turabian StyleKubo, Noritsugu, Sagar Bhandari, Motofumi Tanaka, Taku Nonomura, and Hirokazu Kawabata. 2024. "Experimental Parametric Study on Flow Separation Control Mechanisms around NACA0015 Airfoil Using a Plasma Actuator with Burst Actuation over Reynolds Numbers of 105–106" Applied Sciences 14, no. 11: 4652. https://doi.org/10.3390/app14114652
APA StyleKubo, N., Bhandari, S., Tanaka, M., Nonomura, T., & Kawabata, H. (2024). Experimental Parametric Study on Flow Separation Control Mechanisms around NACA0015 Airfoil Using a Plasma Actuator with Burst Actuation over Reynolds Numbers of 105–106. Applied Sciences, 14(11), 4652. https://doi.org/10.3390/app14114652