Article

Validation of Dynamic Natural Ventilation Protocols for Optimal Indoor Air Quality and Thermal Adaptive Comfort during the Winter Season in Subtropical-Climate School Buildings

by
Antonio Sánchez Cordero
1,
Sergio Gómez Melgar
2,* and
José Manuel Andújar Márquez
2
1
Programa de Doctorado Ciencia y Tecnología Industrial y Ambiental, ETS Ingeniería, University of Huelva, 21004 Huelva, Spain
2
TEP192 Control y Robótica, CITES, ETS Ingeniería, University of Huelva, 21004 Huelva, Spain
*
Author to whom correspondence should be addressed.
Appl. Sci. 2024, 14(11), 4651; https://doi.org/10.3390/app14114651
Submission received: 1 May 2024 / Revised: 23 May 2024 / Accepted: 24 May 2024 / Published: 28 May 2024

Abstract

:

Featured Application

The introduction of effective natural ventilation controls can provide acceptable indoor air quality and thermal comfort for school buildings in a subtropical climate.

Abstract

The need for energy-efficient buildings must be based on strong effective passive-design techniques, which coordinate indoor air quality and thermal comfort. This research describes the principles, simulation, implementation, and monitoring of two different natural cross-ventilation algorithm scenarios applied to a school-building case study affected by a subtropical climate during the winter season. These ventilation protocols, the steady and dynamic versions, can control the carbon dioxide concentration and actuate the window openings according to pre-defined window-to-wall ratios. The implementation of the monitoring process during three non-consecutive days in the winter of 2021 validates the opening strategy to maintain carbon dioxide below 800 ppm, described by the protocol Hygiene Measures Against COVID-19, and the temperature within the comfort ranges suggested by the adaptive UNE-EN 16798. The study shows that a steady opening of 2.16% window-to-wall equivalent ratio can be enough to maintain the requested comfort and carbon dioxide conditions. The use of the dynamic window ratios, from 0.23% to 2.16%, modified according to the measured carbon dioxide concentration, can partially maintain the carbon dioxide below the required limits for ASHRAE 62.1, Hygiene Measures Against COVID-19 and UNE-EN 16798 between 48.28% to 74.14% of the time. However, the carbon dioxide limit proposed by RITE, 500 ppm, is only achieved for 15.52% of the time, which demonstrates the inadequacy of the natural ventilation to fulfil the standard. Further improvements in the dynamic control of the openings in these buildings could lead to lower carbon dioxide concentrations while maintaining the thermal comfort in mild winter climates.

1. Introduction

1.1. Energy Efficiency, Thermal Comfort and Indoor Air Quality

The built environment is responsible for considerable impacts on our present and future lives, considering both construction and the in-use stage. For example, in the year 2009, the construction sector was responsible for 23% of the total CO2 emissions produced by the global economic activities [1], and so on, up to the present date.
Energy efficiency (EE), thermal comfort (TC) and indoor air quality (IAQ) are related key performance indicators to measure the sustainability assessment of buildings. This has been considered as the EE-TC-IAQ Dilemma [2]. The most recognized sustainability assessment tools, like Level(s), include them in their most relevant criteria [3]. Extensive research has been carried out lately to demonstrate the relationship and the proper balance between them [4,5].
A successful IAQ requires an adequate rate of air renovation, which necessarily implies a partial substitution of the indoor air [2]. Since it depends on the season and the local climatic conditions [6], this air substitution can strongly influence the TC of any building type [7]. Temperature, relative humidity, and air movement are the basic indicators that affect TC. The proper correction of these hygrothermal conditions provides, by definition, additional heating/cooling potential energy demand from mechanical systems. Recent research has focused on this issue by considering the use of setpoint temperatures based on adaptive TC models [8]. Furthermore, the expected climate change scenarios will provide a certain increase in the cooling loads, as well as an uncertain reduction in the heating loads [9].
In addition, the improvement of mechanical systems and the introduction of renewable energies play an important role in energy reduction with a proper energy production-demand management [10]. However, the introduction of passive-design principles is considered to be a more effective method to cut down energy demand [11,12].

1.2. Indoor Air Quality

Buildings are the places where humans spend almost 90% of our lives, including home, leisure and work [13]. If time at home is not considered, adults spent most of their time at work, whilst children and youngsters spent it in school buildings.
Recent trends in social sustainability assessment, such as Level(s), are boosting the development of better strategies to improve the IAQ of buildings [3]. However, the pace of implementing these improvements in buildings is slow, especially in existing ones, due to their age and lack of investment [14]. These buildings usually have deficiencies in TC, IAQ and EE. For a robust and transparent assessment, IAQ can be defined by the World Health Organization as the absence of air pollutants [15]. The most common pollutants in buildings are the following: biological, contaminants, off-gassing emissions, carcinogens, and particulate matter. Among these, CO2 is the most relevant for most authors [16].
Among all types of buildings, the study of IAQ in school buildings is particularly relevant because their occupants have specific needs. Children can be more affected by pollutants than adults [17]: their lungs are not fully developed, due their low weight they can suffer greater exposures than adults, and those exposures remain for longer in their lungs. Specifically, CO2, affects human cognition and concentration capacity when it exceeds established limits [18].
Considering that schools have regular occupancy and design typology, it is convenient to anticipate design strategies that can be applied to buildings with similar conditions [19,20]. Previous studies have described experimental approaches to identify the most suitable window opening configuration, and their application in schools worldwide to achieve a good IAQ, TC and EE. Furthermore, urban air-quality climatic conditions are extremely important in describing an effective natural ventilation strategy.
Schools located in polluted areas have restrictions in applying outdoor air renovations. In such locations, the forecast of air quality can be monitored through real-time meteorological stations, or though interpolation models [21].
Field measurement and building energy simulation can be used to suggest optimal strategies for balancing energy use and indoor environment quality, simultaneously. For those schools in hot climates with mild winters the strategies must be oriented to summer overheating risks [14]. Although the performance of the envelope is not as important as the ventilation rate, when natural ventilation is applied, it still needs to be included in a deep analysis of the IAQ-TC-EE Dilemma [2]. Then, thermal transmittance of the envelope is the most relevant indicator to be considered [6]. For schools in warm and moderate climates, the design strategies must be oriented both to the summer and winter season, based on improved ventilation schemes and well-designed energy-conscious building [2]. Empowering occupants as agents actively engaging in their own comfort can be an interesting solution when mechanical systems are not available [22]. Finally, studies in schools comparing both natural and mechanical ventilation have demonstrated a better performance for IAQ, but worst results for TC with natural ventilation for all the teaching hours [20].

1.3. Recent Evolution of the Indoor Air Quality Standards

Since the SARS-CoV-2 airborne transmission was demonstrated [23], IAQ indicators have occupied a major role in overcoming the disease. For those enclosed environments, the CO2 concentration became the only indicator for providing effective advice on the airborne transmission [24]. With the need to maintain school buildings open, after the declaration of the disease, the national government established a set of protocols to reduce the infection risk [25]. A maximum CO2 concentration of 800 ppm was established as a reference safety guide, which must be addressed by natural ventilation. Unfortunately, most of the school buildings did not have CO2 monitoring devices at the beginning, and those with them failed to address the TC criteria [7]. Since them, the monitoring of CO2 has become recently a very popular easy-to-use tool for IAQ evaluation [26].
Several ventilation standards, such as EN 16798-1 [27], ASHRAE 62.1 [28], RITE [29], and some others like WELL [30], have established limits for the most relevant IAQ indicators. These include CO2, particulate matter, and volatile organic compounds, but CO2 is the most relevant of them because of its usability as an airborne infection indicator. Their limits for CO2 concentrations (between 500 and 1000) are shown in Table 1.
In the case of RITE, buildings are classified into categories of buildings from 1 to 4. There, school buildings are included in category IDA 2, in which the CO2 limit is 500 ppm. Table 2 summarizes the IAQ levels with the corresponding CO2 concentrations applied in this research.

1.4. Minimum Natural Ventilation to Ensure Indoor Air Quality

There is a vast body of literature that recognizes how natural ventilation plays a vital role in IAQ, TC and EE [4,5,32,33,34]. On sites where urban pollution is not an issue, IAQ can be considered as a result of the balance between the indoor pollutants produced against the outdoor renovation rate introduced [32]. The first element of the balance is provided by the number, the type of activity and the age of the occupants, while the second element of the balance depends mostly on natural/mechanical ventilation. In most of the cases, the infiltration through the building’s envelope can be avoided due to its lack of relevance in comparison with the other elements [33]. Polluted sites are not considered adequate for air renovation without previous filtration.
Natural ventilation is driven by different thermodynamic airflow issues. That airflow is provided due to different air pressures and temperatures or by wind flows [34]. The basic classification describes two kinds of natural ventilation: single or cross [35]. Then, the effectiveness of the natural ventilation depends on the size, the proportions, the shape, and the position of the openings and the window-to-wall ratio (WWR) of each facade [36]. Traditionally, the WWR has been extensively used in research due to the fact that it is easy to use and understand, and influences the way of combining different building performance objectives: daylighting, thermal, and acoustic comfort, as well as cooling/heating energy demand [37]. Elements for defining a cross-ventilation system are graphically described in Figure 1 below: occupancy (O), window inlet (Wi), window outlet (Wo), and room size in depth (D), length (L), and height (H).
According to the literature, cross ventilation works when local winds pass through the Wi in the windward side, cross the room and are expelled out through the Wo in the leeward façade [36,38]. For most of the airflow studies, the Venturi effect cannot be fully presumed, and an additional computational fluid dynamic must be considered to obtain the assumptions. If the window is the most relevant factor to manage, then there are several options to consider, such as size, wide-to-height ratio, height position, and the number of single/multi windows per façade [39,40,41]. As described by these studies, different configurations in the Wi-to-Wo ratio provide an internal pressure rise when the Wi/Wo is bigger than 1. If it is smaller, then the internal pressure decreases, providing better airflow conditions. Therefore, it results in a more effective ventilation configuration for reducing the Wi-to-Wo ratio [36,39]. For those rooms with a different window size at the windward and leeward façades, an average combined-window area can be defined, as described in Equation 1 [36]. The equation includes a summation of areas at each of the opposite sides of the room. The result is expressed in Aeq as window-to-wall equivalent ratio (WWeqR), useful for rooms with a different opening size at each side of the room.
A e q = i W i i i W o i ( i W i i 2 + i W o i 2 ) A e q = Equivalent opening area W i i = Windward opening summation W o i = Leeward opening summation

1.5. Adaptive Thermal Comfort Model

The adaptive comfort model was firstly described by De Dear and Brager in 1998 [40]. The model describes the influence of local and behavioral factors on the perception of TC. The model is based on TC field studies in countries worldwide, and established the foundations of the thermal models for the ASHRAE 55 [41]. Since then, several authors have introduced variations in the original comfort algorithm to better approximate particular local conditions. The Smart Controls and Thermal Comfort project from the European Union has been considered for the development of the UNE-EN 16798-1 [27], with both passive and mechanical operations. The passive UNE-EN model equation described in the Standard, Section A.2.2 [27], is used in this research to validate the TC.

1.6. Aims and Novelty of This Research

Based on the results obtained in previous works [7], the aim of this research is to demonstrate the validity of a proper WWeqR schedule to better achieve both IAQ and TC, using different ventilation protocols. As described by other authors, there are interesting possibilities for achieving IAQ without mechanical ventilation in school buildings [6,14,20], but they may compromise TC and EE. This depends on the climatic conditions [6,14,20], the envelope performance [6], set-point temperatures [14], the consideration of adaptive thermal comfort [42] and the efficiency of the mechanical systems [20]. It is necessary to elaborate window-opening management protocols that are based on natural ventilation and low-cost sensors in schools where mechanical ventilation is not an option. Then, the validation of these protocols is necessary to understand how to solve the IAQ-TC-EE Dilemma within specific climatic conditions and building configurations.
The research aims to carry out the following:
  • Using Designbuilder simulations of this case study, obtain the WWeqR that provides enough air renovation to fulfill the CO2 levels under the required limits:
    For the steady natural ventilation protocols (SNVPs), it describes a WWeqR that allows the achievement of the required CO2 all the time.
    For the dynamic natural ventilation protocol (DNVP), it describes the functioning of the dynamic WWeqR according to the indoor CO2 sensors, to minimize the outdoor air infiltration.
  • Using the monitoring data from this case study, validate the proper functioning of the WWeqR in buildings with manual operation, providing enough air renovation to fulfill the CO2 levels requested.
  • Considering adaptive models, anticipate the TC outcomes that may arise due to the introduction of outdoor air without heat-recovery units.
  • Provide a summary of design-and-management rules of thumb for scholar buildings in a subtropical climate to achieve acceptable IAQ during the operational time as an alternative to installing mechanical ventilation systems.
The paper contains the following: Section 1 introduces the problem and the perspective of the research, with the objective and aims to be achieved. Section 2 describes the materials and methodology used in the research. It includes the simulation, the case study description and the proceedings and materials for the data monitoring. Section 3 shows the results for the different scenarios described in Section 2. Thus, Section 4 discusses the outcomes from the data of the preceding section. Finally, Section 5 provides the main conclusions obtained and suggests future works. Some relevant material is included in Appendix A and Appendix B.

2. Materials and Methods

This section contains the materials and methods used within this research to cover the different ventilation protocols proposed to improve the IAQ and TC of a case study in the city of Sevilla, Spain. The study includes two research stages: first, a software simulation, and second, an experimental installation and the measuring equipment for real-time monitoring devices.

2.1. Monitoring Materials

The real-time monitoring systems are shown in Figure 2, and their specifications in Table 3:
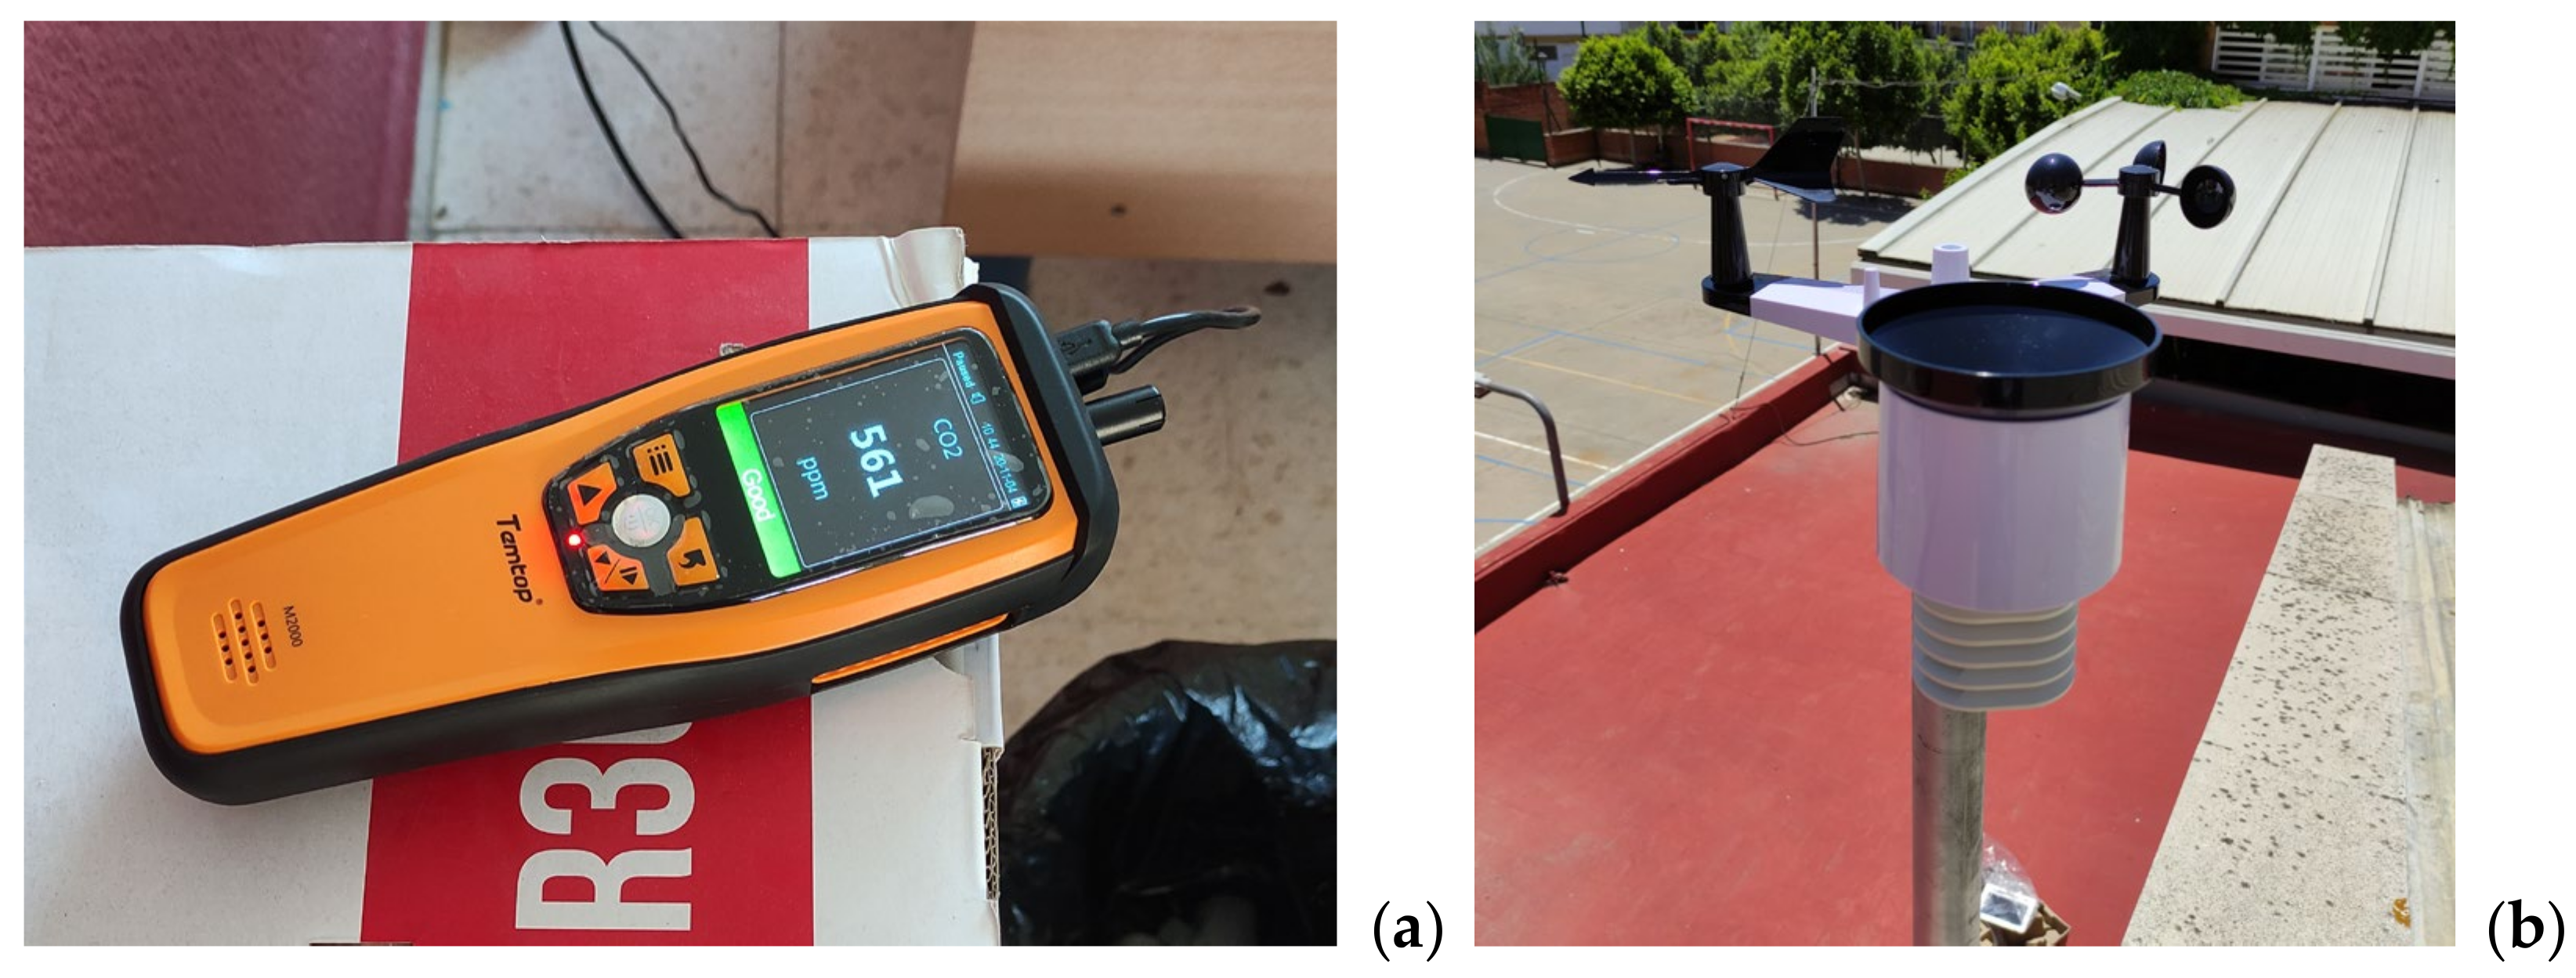
  • A TEMTOP M2000C 2nd CO2 Air Quality Monitor (orange). This includes a Sensair nondispersive infrared CO2 sensor, a sensirion SHT31-ARP sensor for temperature and relative humidity, and an NDIR CO2 sensor.
  • A meteorological station, Froggit HP 1000SE PRO (white), includes a set of sensors to provide a full description of weather data in real time, as well as an indoor hydrothermal sensor able to measure humidity and temperature, and a central console. All of them are connected via radio at 868 MHz.

2.2. Simulation Software

The software chosen for the building simulation is DesignBuilderTM V7.0.2.006 (DB) [43], which runs EnergyPlusTM as the data calculation engine. It can simulate current and improved conditions to compare different scenarios in terms of CO2 emissions, indoor hydrothermal conditions, and energy consumption, among others. The software is recognized by several of the most influent standards, like the ANSI/ASHRAE, and it is commonly used in academia [44,45].

2.3. Methodology

The methodology proposed in this paper is based on two different approaches: a CO2 concentration DesignBuilderTM simulation and onsite IAQ data monitoring to evaluate the validity of the ventilation protocols, the SNVP and DNVP. Both focus on a real case study in a school building in the city of Sevilla, Spain. All the windows have been scheduled with the same opening, whether they are windward or leeward.
The study considers WWeqR in measuring the average ratio, including all the windows, in all facades, instead of the traditional WWR. The DesignBuilderTM simulation is used to obtain the most appropriate WWeqR to be used in the opening protocol to be followed by the school staff during the on-site monitoring process.
The duration of the monitoring process was reduced to a few days, due to the restrictions imposed by the school principal and the COVID-19 protocols. The authors decided to choose a set of non-consecutive days to evaluate different weather conditions, covering different wind and temperature conditions.
Considering the monitoring devices described in Table 3, the following experimental error is expected: ±0.3 °C indoor temperature, ±3% indoor relative humidity, ±40 ppm indoor CO2, ±1.0 °C outdoor temperature, and ±5% outdoor relative humidity.

2.3.1. Case Study

The study focuses on a classroom in a school building in the city center of Sevilla (Spain). It is placed at 37.39 north latitude, and 5.98 east longitude, and influenced by a subtropical climate, Csa in the Köppen–Geiger classification [46]. The average temperatures are 11.3 °C in December, 25.7 °C in June, and 18.2 °C for the whole year. The average humidities are 75% in December and 42% in June. The prevailing winds are southwest in summer and northeast in winter.
This classroom has been selected because it is representative of the average school buildings in this region, but also because it has already been used in previous studies of IAQ and TC [7]. The distribution and position of the different elements within the classroom are presented in Figure 3.
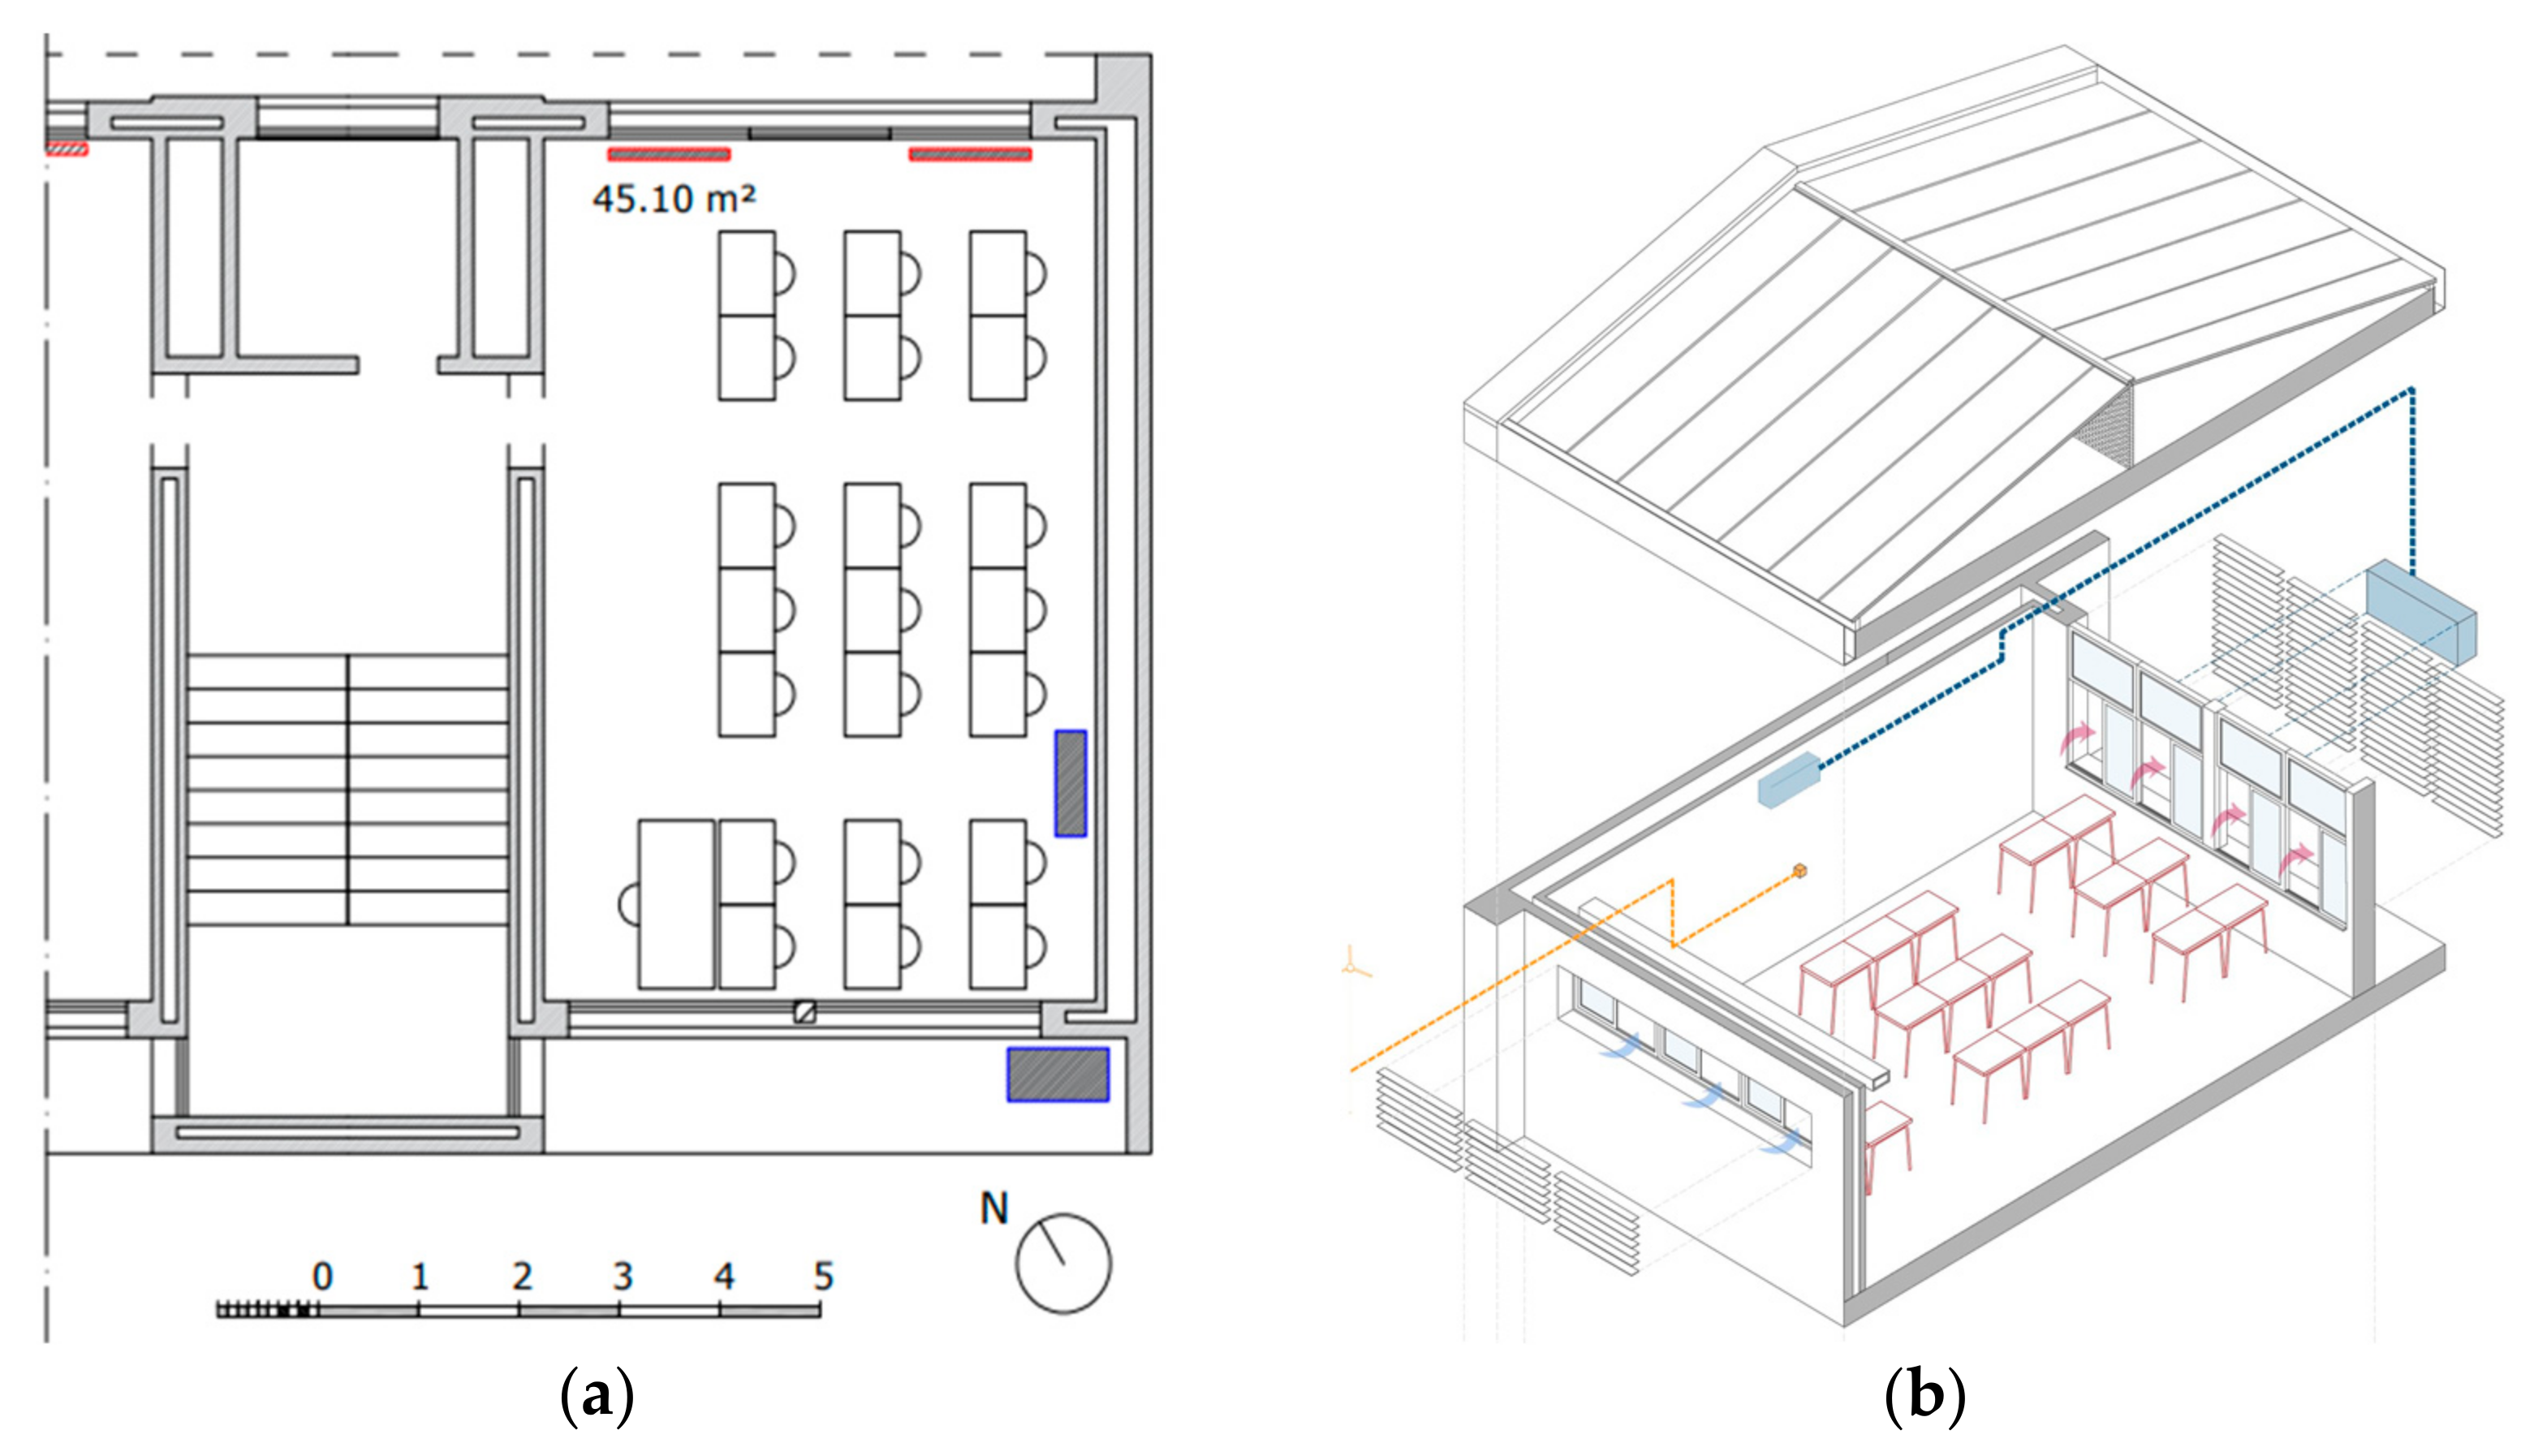
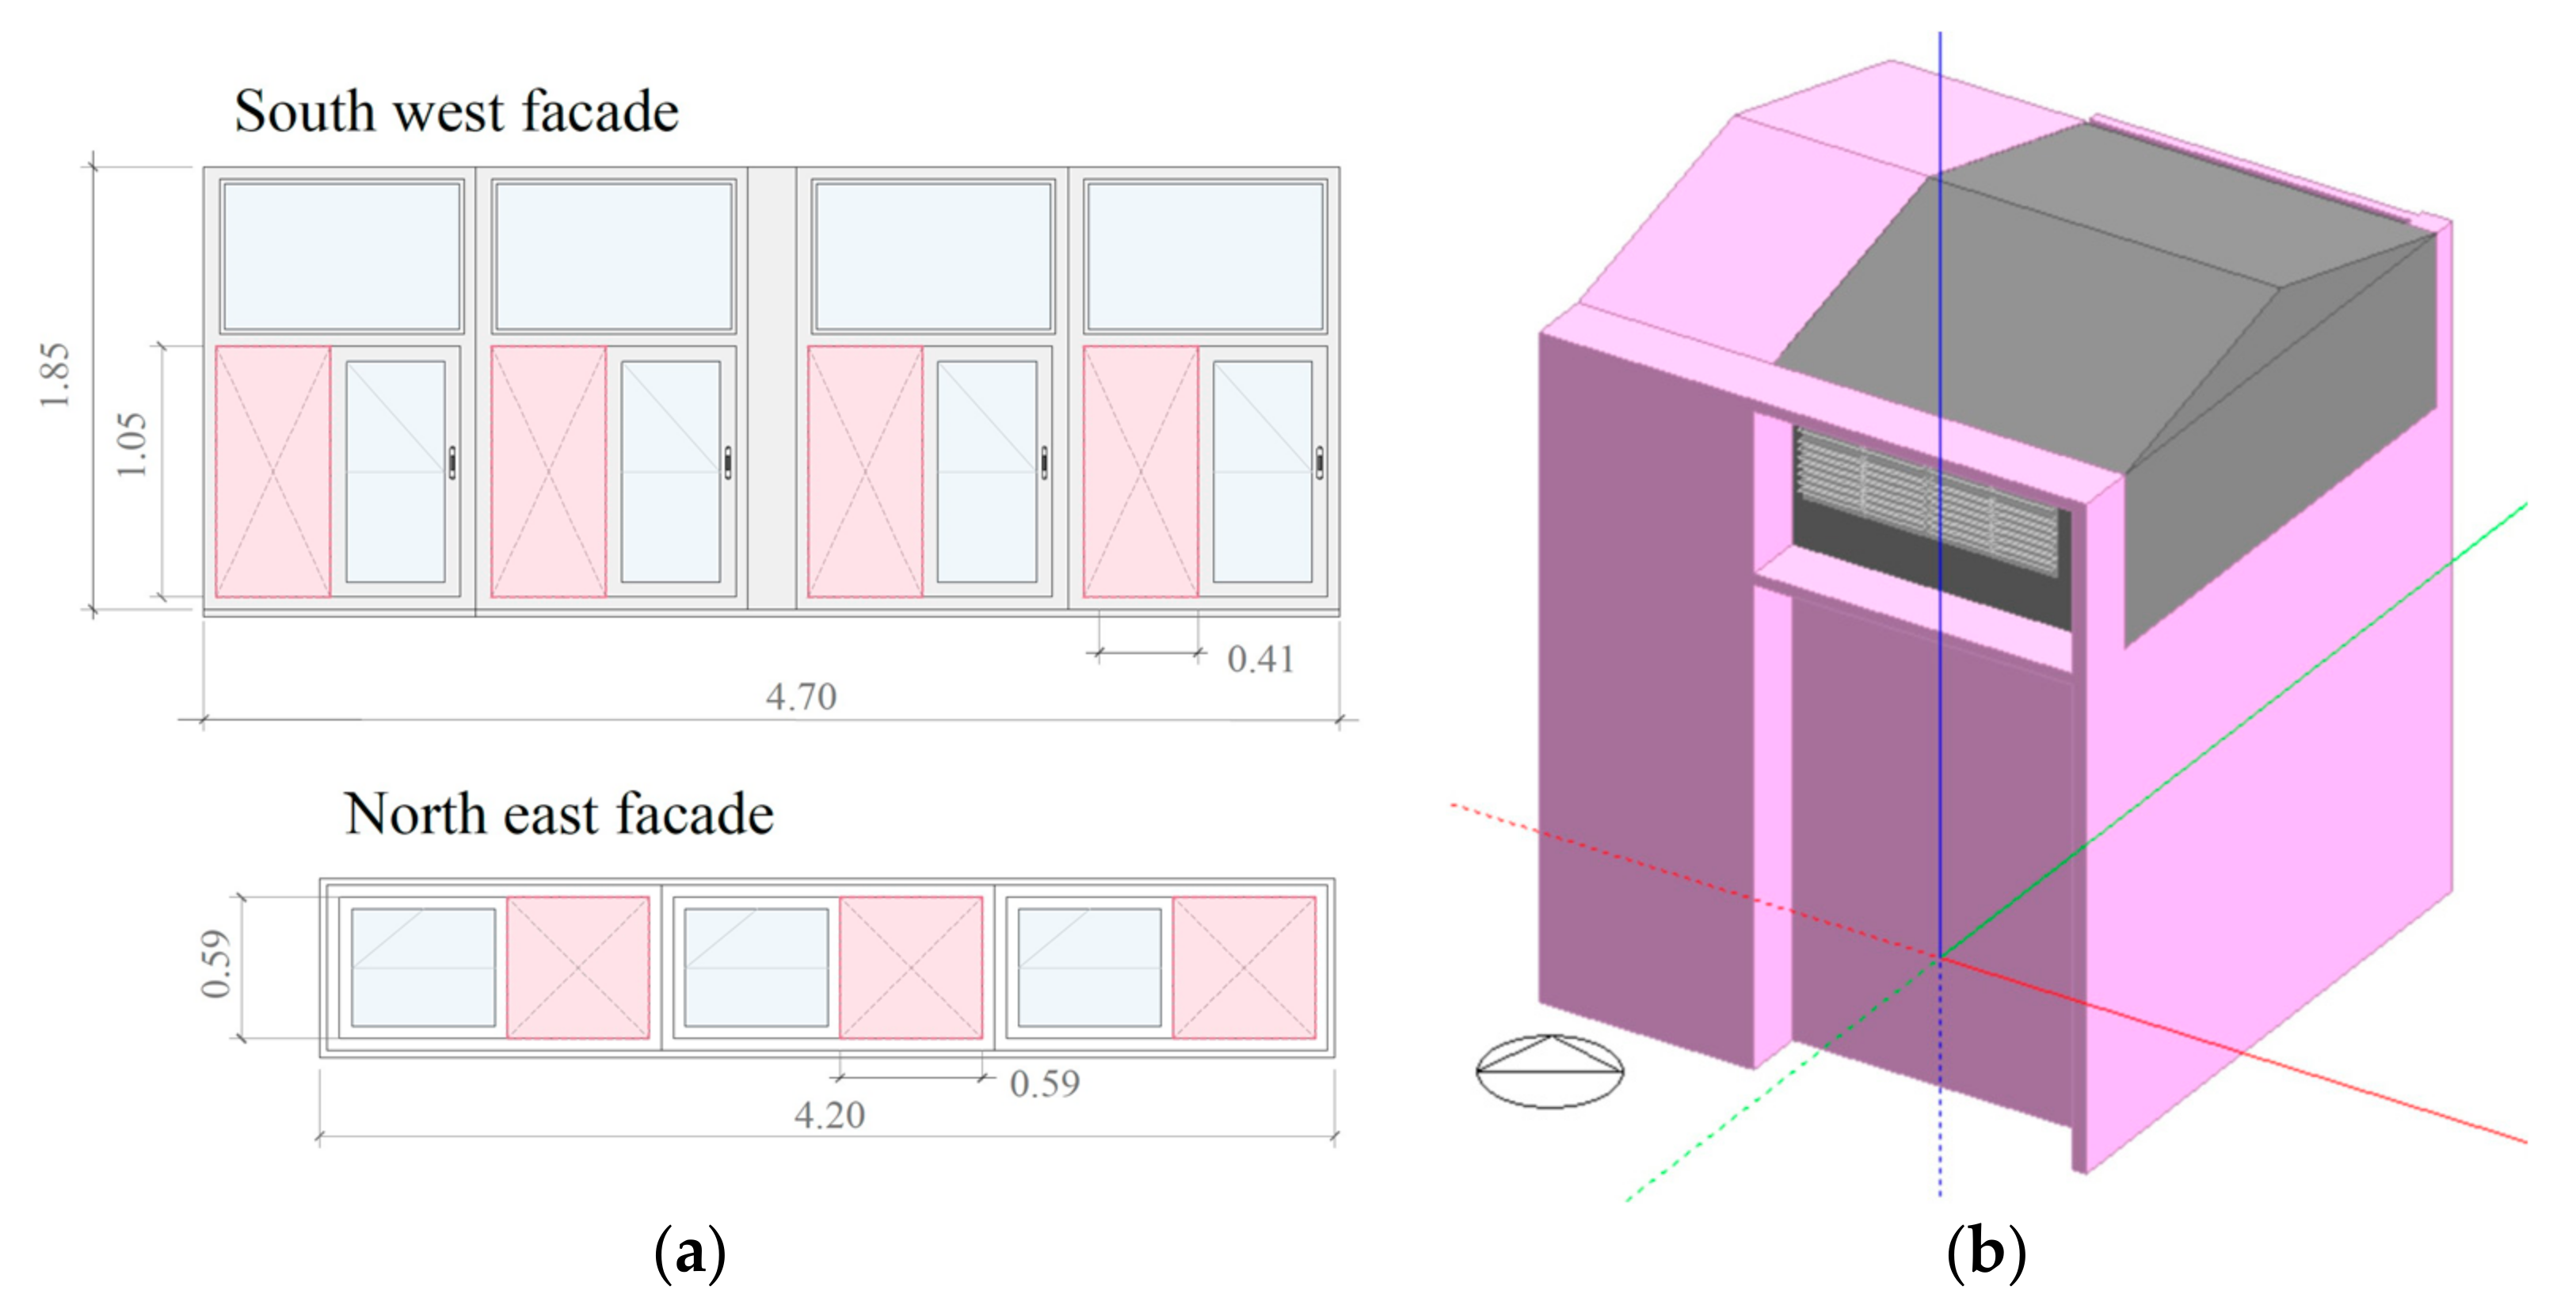
  • Figure 3a provides a layout with the position of the openings and the seats for the occupants. It also contains the position of the radiators (in red) and the heat pump (in blue). There is only 1 entrance to the classroom, which was always closed during the experimentations. The graphic scale and the north compass sign are included to classify the window openings as north/south. The north façade can be described as windward, while the south façade is considered leeward for the purposes of cross-ventilation analysis.
  • Figure 3b provides an axonometric 3D view of the room, which adds extra information. Both windward and leeward openings include a set of solar-protection louvres, but during winter they are always set at a horizontal position. Therefore, it is considered that they have no influence on the ventilation process. Blue boxes describe the split heat-pump system. The yellow dot describes the approximate position of the IAQ monitoring devices (Figure 4a), while the yellow line describes the wireless connection with the central console (Figure 4b).
The classroom volume is 141.36 m3. It is usually occupied by 25 pupils of about 11 years old and a teacher, which makes one person every 1.90 m2 (see Table 2), for the main parameters. The classroom activity schedule is organized from Monday to Friday. The attendance hours are from 9:10 to 12:05 and from 12:30 to 13:55. Students have a playtime out of the room between 12:05 and 12:30.
Construction elements were reviewed on-site and their thermal transmittance and other physical properties were calculated using DesignBuilderTM. No insulation materials were found during the visual inspection, as would be expected for a 1970s building. The roof is composed of two separate layers with a non-ventilated interior air cavity of 0.60 m average thickness. Ceiling and flooring both include a concrete slab. The external walls are composed of two bricks sheets with an interior variable-thickness air cavity (cavity thickness from 5 to 15 cm). The windows in the south and north façades include aluminum frames plus double-glazing panes with air-gap insulation, as described in Table 2 (thermal transmittance), which gives a thermal summary of these construction elements.
The classroom is cross-ventilated through the windows in both the windward and leeward facades, as shown in Figure 4a. Both show, in red, the maximum effective opening to be considered for natural ventilation following the definition of the WWeqR.

2.3.2. Natural-Ventilation Protocols

After an intense debate in academia, described in Section 1, the worldwide scientific community established natural ventilation as the most reliable source of improvement of the IAQ and the consequence reduction in the airborne transmission of several infections such as COVID-19. In the case of the Andalucía region (Spain), the regional Government prescribed the need to provide windows which open fully to guarantee natural ventilation. However, this was a temporary solution that causes additional heating/cooling demands, which must be addressed at some point. To solve this issue, in a second step, the authors prosed a natural ventilation protocol that seeks the minimum air renovation to guarantee a maximum CO2 concentration of 800 ppm. Ideally this will help to maximize the comfort periods while reducing the heating/cooling energy demand. This was called the COVID-19 natural ventilation protocol, as it mainly addressed the infection issue. The protocol described ideal periods to provide constant air renovation through manual window operation, but without any control of its effectivity.
As an improvement of these early natural ventilation protocols, this paper suggests different approaches, based on the following:
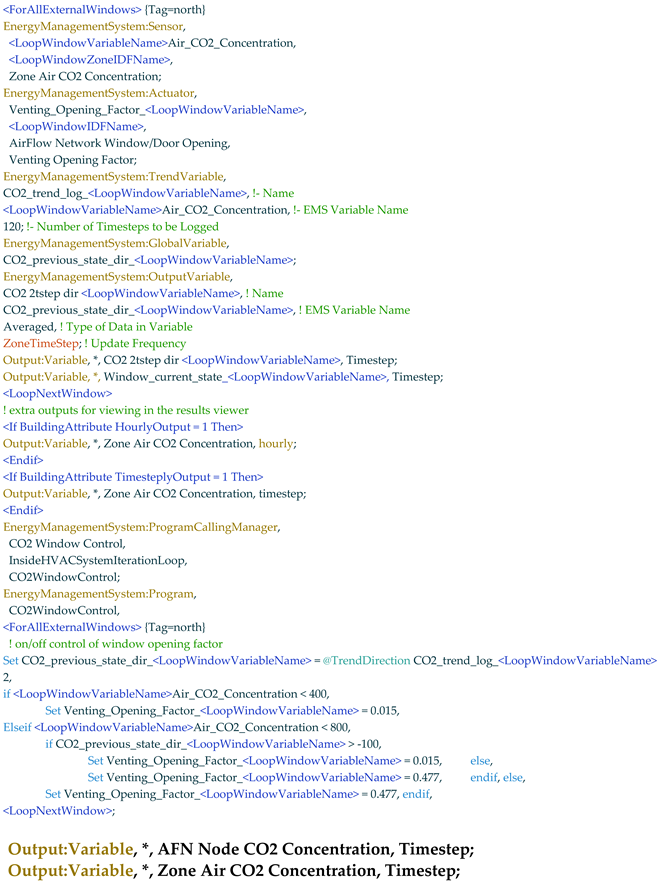
  • CO2 concentration that can be obtained through CO2 sensors. They are cheap and easy to find and allow any worker in an educational building to have a real-time IAQ assessment. Even more, they can be connected remotely to cloud control via an app, so anyone can access the IAQ data report. In DesignBuilderTM the CO2 is obtained through virtual sensors, as described in Section 3.1.
  • The opening factor described as a WWeqR, which can be manually or mechanically operated on site, following any of the suggested algorithm rules. It is also possible to model it in DesignBuilderTM through EMS scripting, as described in Section 3.1.

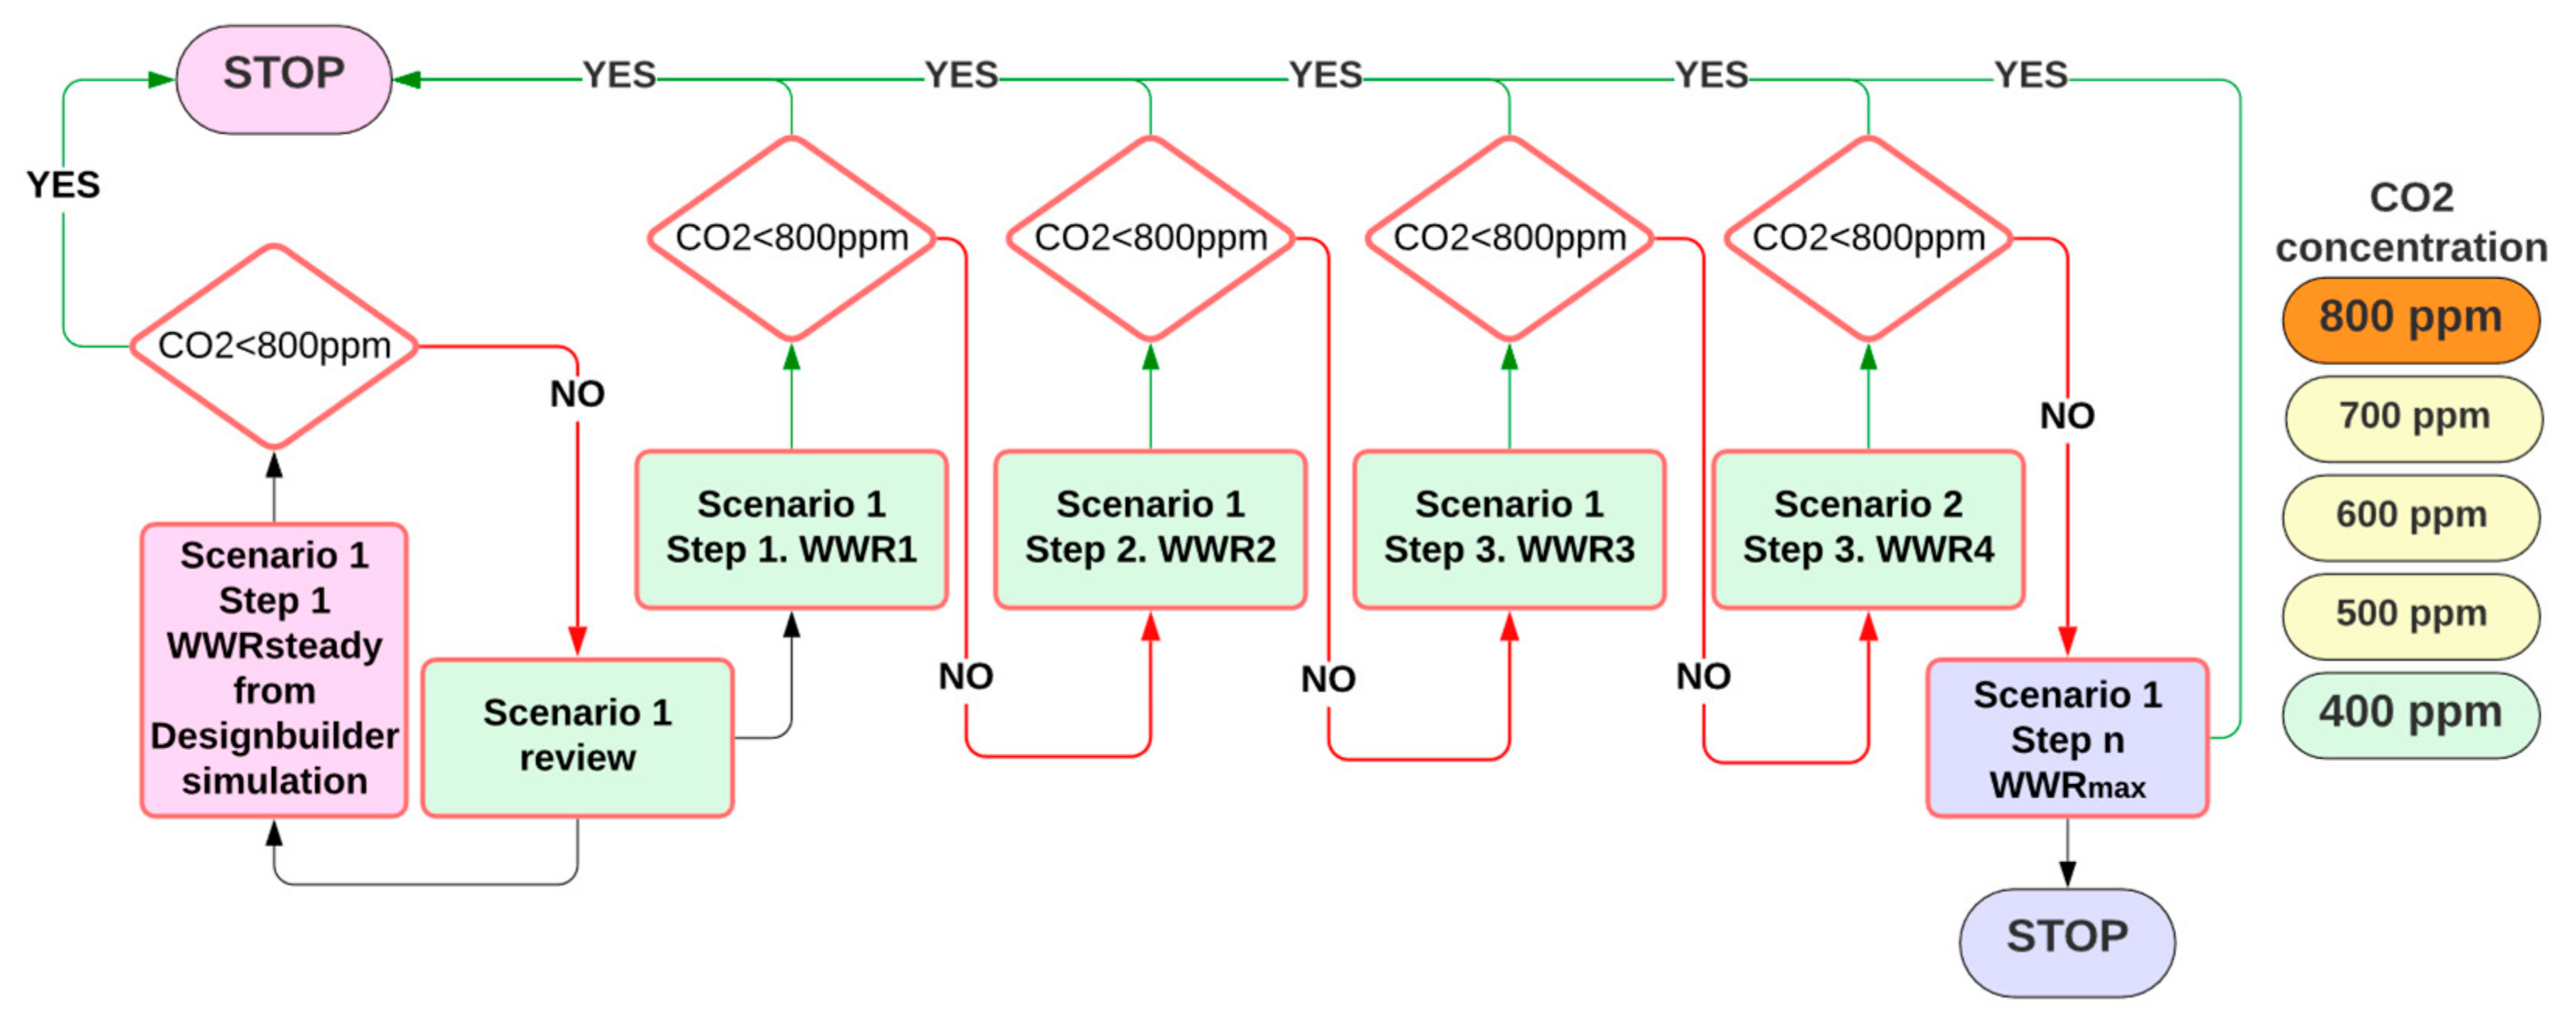
The Steady Natural-Ventilation Protocol

The SNVP can increase the natural ventilation while being easily implemented in the building. It describes an ideal steady-state opening WWR for all the operational time, according to the classroom configuration. See Figure 5 for details. For scenarios where the outdoor CO2 is circa 400 ppm, the SNVP can be described as follows:
  • The WWeqR is calculated via DesignbuilderTM simulations to maintain the CO2 concentration under 800 ppm.
  • The WWeqR obtained is then applied on-site to the case study in scenario 1. If the CO2 concentration is below 800 ppm during this time, then the objective is accomplished and the WWeqR can be maintained while the rest of the conditions remain the same.
  • On the contrary, if the CO2 concentration is not below 800 ppm, then the WWeqR must be revised in several steps, until it finally decreases to under 800 ppm.

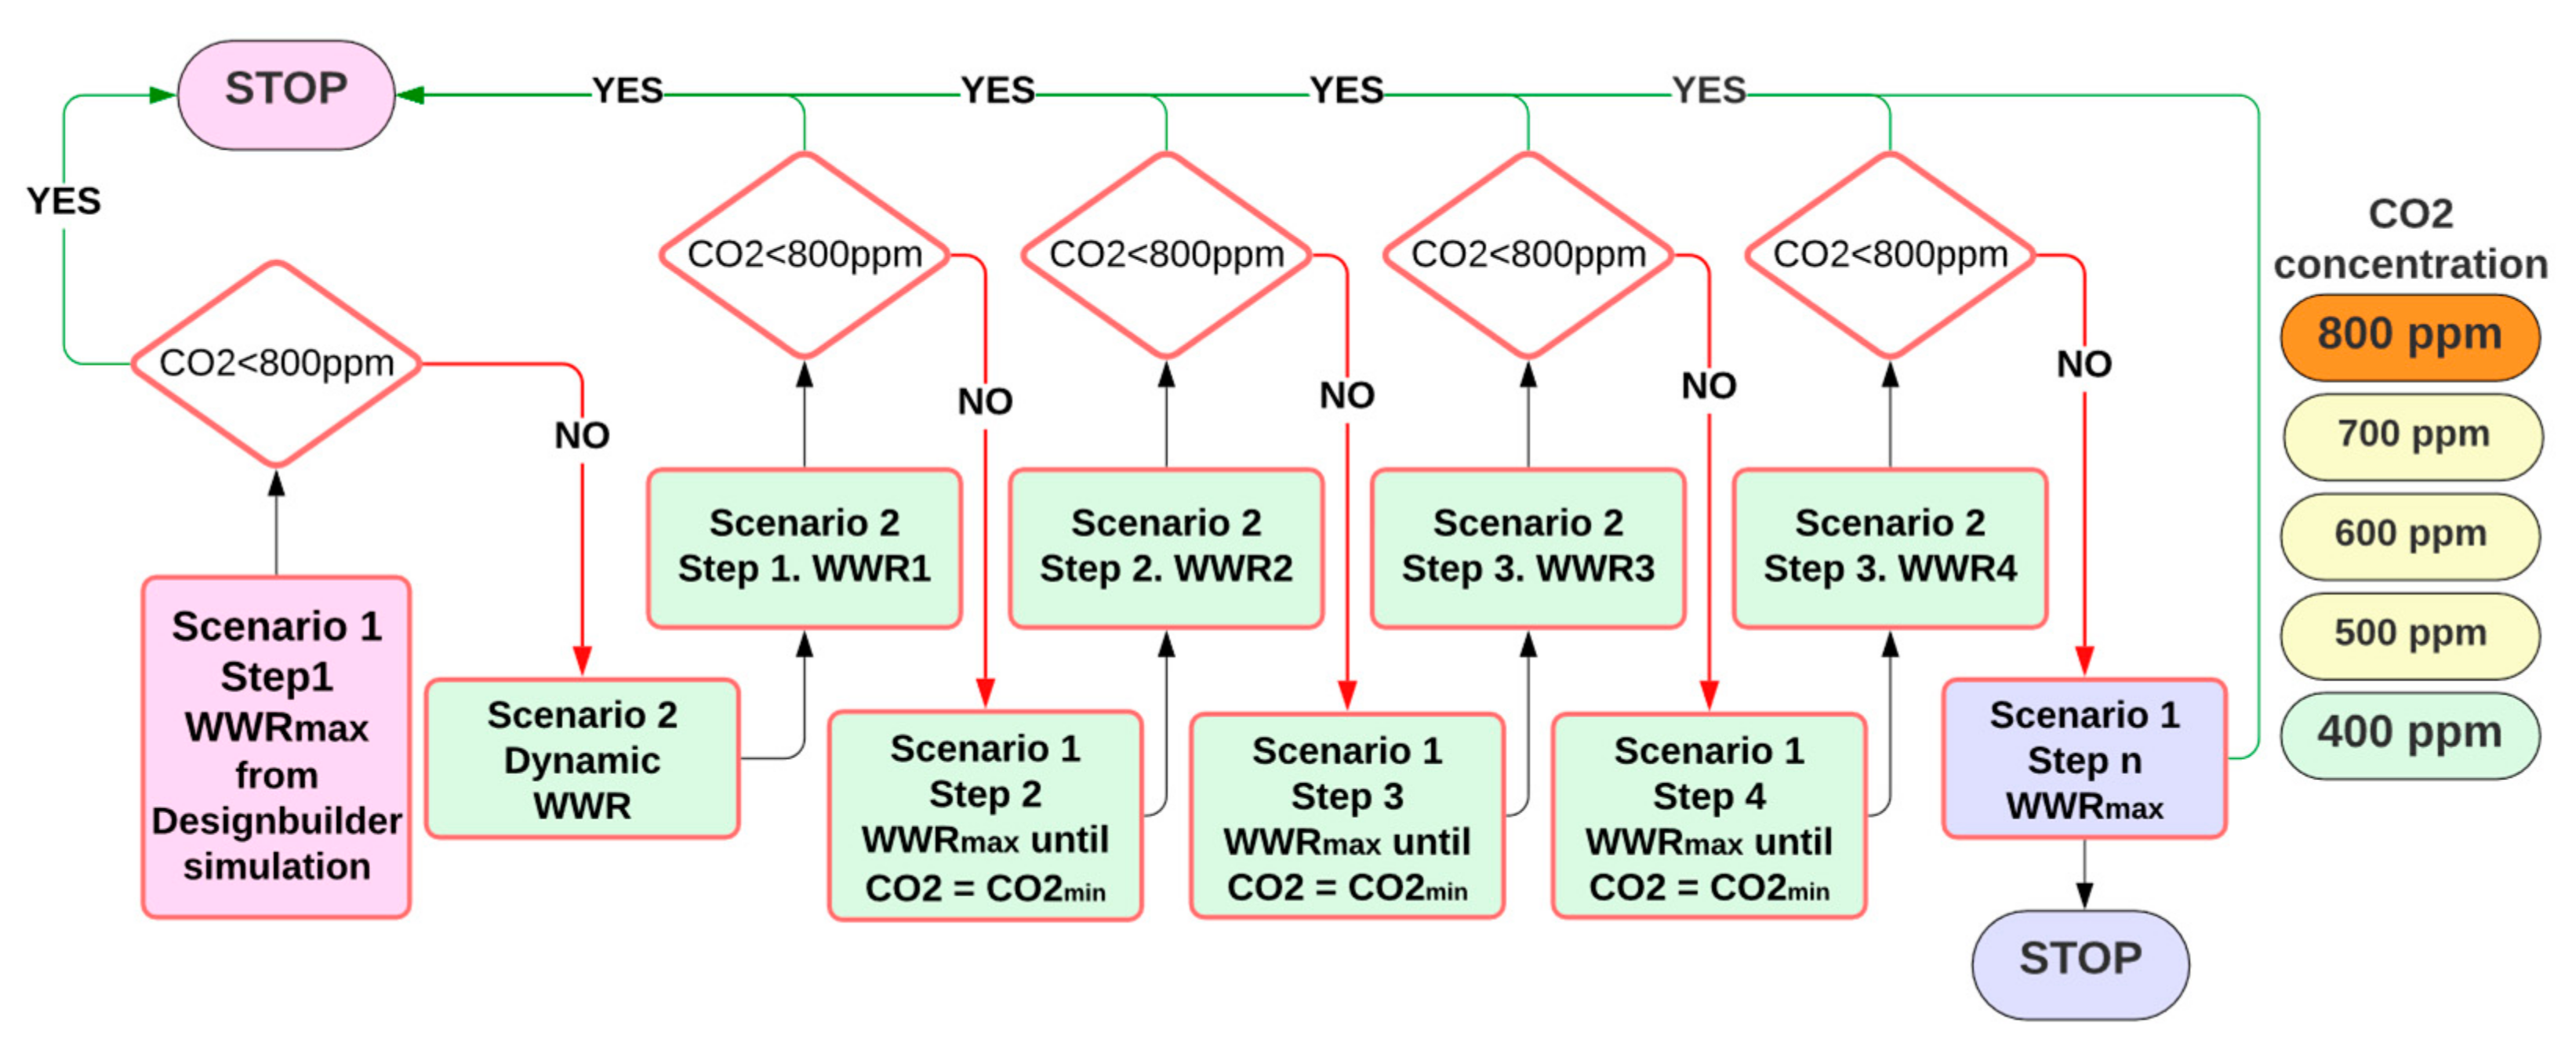
The Dynamic Natural-Ventilation Protocol

The DNVP has been designed as an improvement on the SNVP to increase air renovation control while minimizing the negative effect of thermal loads in extreme seasons. The ease of the DNVP will provide the opportunity for a successful implementation of natural ventilation policies in those school buildings where complex management systems are not available, for some reason. The DNVP can be seen in Figure 6. For scenarios where the outdoor CO2 is circa 400 ppm, the summary of the DNVP can be described as follows:
  • In the first step, if the CO2 concentration is above 800 ppm, then windows must be fully opened to maintain the CO2 as low as possible.
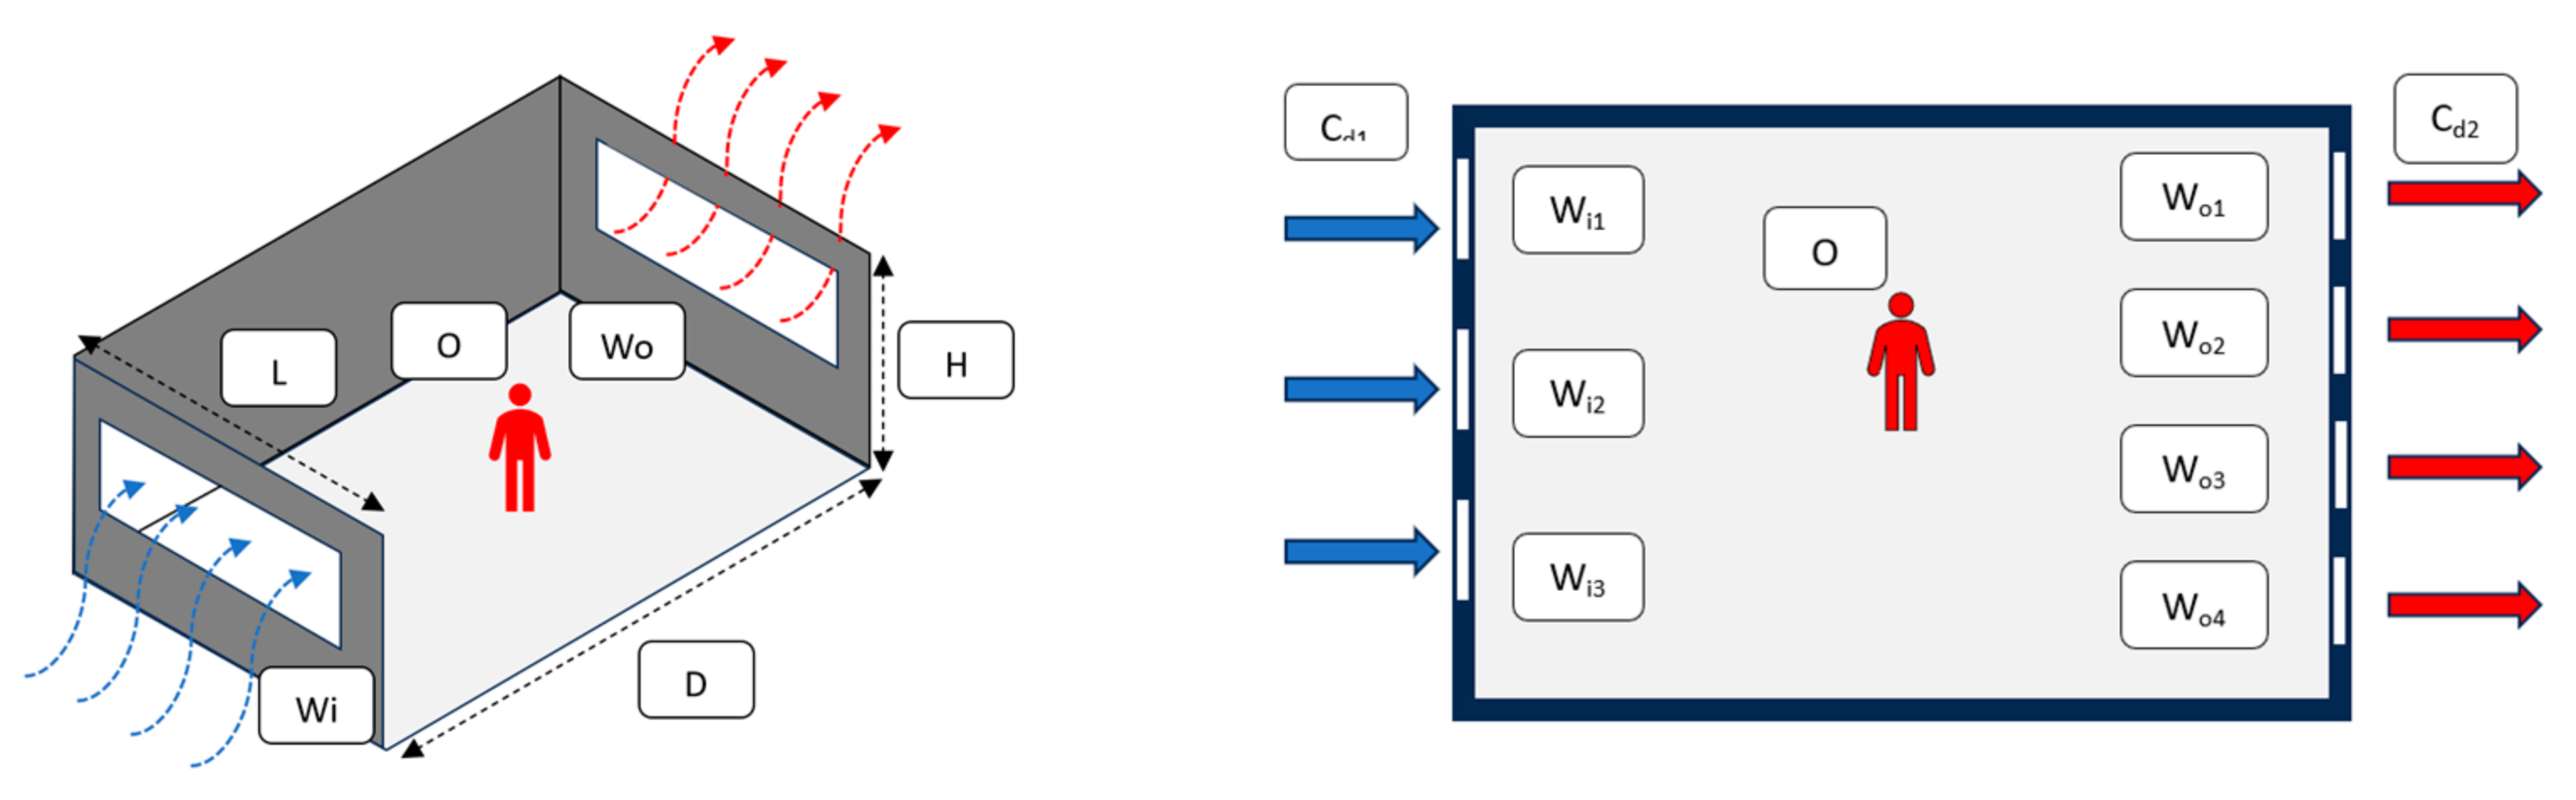
  • In the next step, when CO2 is below 800 ppm, the windows on both sides of the room will be opened according to a rising scale of WWeqR. The WWeqR is the average number of the WWR in the case of cross ventilation with different window sizes in the windward and leeward facade. For each of these openings, the CO2 concentration is measured. If the value remains below 800 ppm, then the process is stopped.
  • If the CO2 rises above 800 ppm, then a full opening must be applied to quickly remove pollutants until the CO2 approaches the CO2 min. The CO2 is the result of the natural ventilation according to the maximum WWeqR of each case. Then, the CO2 concentration can be considered as around 550 ppm. The WWeqR is then set to the next higher value from the previous step. Again, if the value remains below 800 ppm, then the process is stopped. On the contrary, if the CO2 rises above 800 ppm, then the full opening scenario must be applied to repeat the flush process and the WWeqR applied for the next corresponding value.
  • The process must be repeated in several steps until the CO2 remains below 800 ppm or, alternatively, the CO2 is above 800 ppm, but the windows remain fully open.
  • In the next step, when CO2 is below 800 ppm, the windows in both sides are opened according to the increasing scale of WWeqR. The WWeqR is the average number of the WWR in the case of cross ventilation with different window sizes in the windward and leeward side. To ease the process for the school buildings management team, the WWeqR used came from an easy-to-remember opening width: 2-4-8-10-15-22 cm in each of the windows at the same time.

2.3.3. Opening Considerations for This Case Study

According to previous experiments [36], if the size of the windows on the leeward and windward side are different, then the most effective opening configurations include the smaller windows in the windward side, which is the configuration of this case study. The equivalent opening area is calculated through Equation (1) and shown in Table 4.

2.3.4. Calculation of Indoor Carbon Dioxide Concentration

This research uses the calculated natural ventilation mode in DesignbuilderTM with a discharge coefficient of 0.65. The CO2 concentration equations are described in the EnergyPlusTM Engineering Reference [47]. The Carbon Dioxide Predictor-Corrector is based on the following Transient Mass Balance Equation (see Equation (3)). Each element of Equation (2) is detailed in Appendix A.
ρ a i r   V Z   C C O 2   d C Z t d t = i = 1 N s i k g m a s s s c h e d   l o a d 1.0   6 + i = 1 N z o n e s m i   C z i C z t + C C z t + m s y s ( C S U P C Z t )
As described in Appendix A, the CO2 concentration depends on internal CO2 loads, the zone air density and volume, CO2 due to outdoor infiltration and ventilation, which are present in this simulation, and also on CO2 transferred from other zones and CO2 from the air supply stream, which are not present.
The standard EnergyPlusTM epw weather file [48] has been modified to establish the average wind speed and direction for a typical morning in December, with direction 260°, speed 2.6 m/s.
The DesignBuilderTM simulation includes a scheduled ventilation protocol which is not within the current options of the software capabilities. To ensure the proper function of the DNVP, the authors used the EMS runtime scripting tools described in The Application Guide for EMS [47]. The scripting code is presented in Appendix B. The EMS script is acting over the openings to ensure the CO2 remains under 800 ppm, as described in the DNVP in Figure 4. The EMS window-opening actuator is connected to two variables/sensors: Air_CO2_Concentration and TrendDirection. TrendDirection evaluates whether the CO2 concentration is rising or decreasing.
It is expected that slight variations will be found between the simulation forecast and the real-time monitoring data. This is provided by the expected delay between the software simulation and the human management of the windows.
Finally, the monitoring process introduces an evaluation TC according to the method described in the UNE-EN 16798-1:2020 [27], Section A.2.2. UNE. The adaptative comfort is based on the following Equation (3):
θ r m = 1 α × θ e d 1 + α · θ e d 2 + α 2 ·   θ e d 3
θ r m Outdoor running mean temperature for the considered day θ e d 1 Daily mean outdoor air temperature for the i-th previous day

3. Results

This section provides a comprehensive review of IAQ in two different scenarios, according to the methodology explained in Section 2.

3.1. Simulation Stage

At the simulation stage, the validity of the DNVP is evaluated for each WWeqR against the SNVP, from 0.23% to 2.16% WWeqR.
The first set of simulations were run in DesignBuilderTM with a constant wind speed of 2.6 m/s, direction 260°, and a constant WWeqR. These simulations are plotted in Figure 7. Additionally, the figure includes the occupancy level and the recommended CO2 concentration limit defined by the World Health Organization and the RITE [29]. The occupancy defined is 21 people and the CO2 limit is 800 ppm.
The results shown in Figure 7 describe how a 2.16% WWeqR is the only simulation remaining below the established CO2 limit of 800 ppm. All the other configurations of WWeqR provide simulation results between 800 and 2600 CO2 ppm. In all run simulations, the CO2 increases exponentially until it reaches a flat line, which remains constant, except in the simulations with the WWeqR under 0.45%. In these simulations, the CO2 is still rising until the occupancy is zero, between 12:05 and 12:30. The simulations show the WWeqRmax for this case study, which is 4.10%. For the WWeqRmax the average CO2 is circa 544 ppm.
For the next set of simulations run in DessignBuilderTM, all the parameters remain the same except the WWeqR, which is controlled by the DVNP EMS script, as explained in Appendix B. The WWeqRs that provided a CO2 concentration below 800 ppm are not considered in this simulation, following the DNVP algorithm. The results of the CO2 concentration obtained through the calculations via Equation (2), explained in Appendix A, are shown in Figure 8. CO2 limits and wind conditions remain the same as those in Section 3.1.
The results shown in Figure 8 describe the running loops of the different WWeqRs. Each of the WWeqR loops rises until 800 ppm, then they change to 4.10% WWeqR until the CO2 concentration decrease to 400 ppm or as low as possible. As expected, for those opening configurations with a lower WWeqR, the number of loops is higher.
Figure 9 summarize the results of simulations for 0.23% WWeqR, but comparing both the SNVP and the DNVP. Regarding the selected 0.23% WWeqR, the results of CO2 concentration, when the DNVP is on, are below 800 ppm, while they achieve circa 2500 when the SNVP is on.
Data shown in Figure 7, Figure 8 and Figure 9 are organized and presented in Table 5.
The results shown in Table 5 confirm that all WWeqR configurations maintain the CO2 concentration under the limit when the DNVP is active, while only a 2.16% WWeqR configuration maintains the CO2 concentration objective when the SNVP is active.

3.2. Monitoring Results

At the monitoring stage, the most efficient WWeqRs for the DNVP are validated during several days in 2021: 18th and 26th November and 17th December. There, real variable occupancy and weather applies instead of the constant ones considered in Section 3.1.

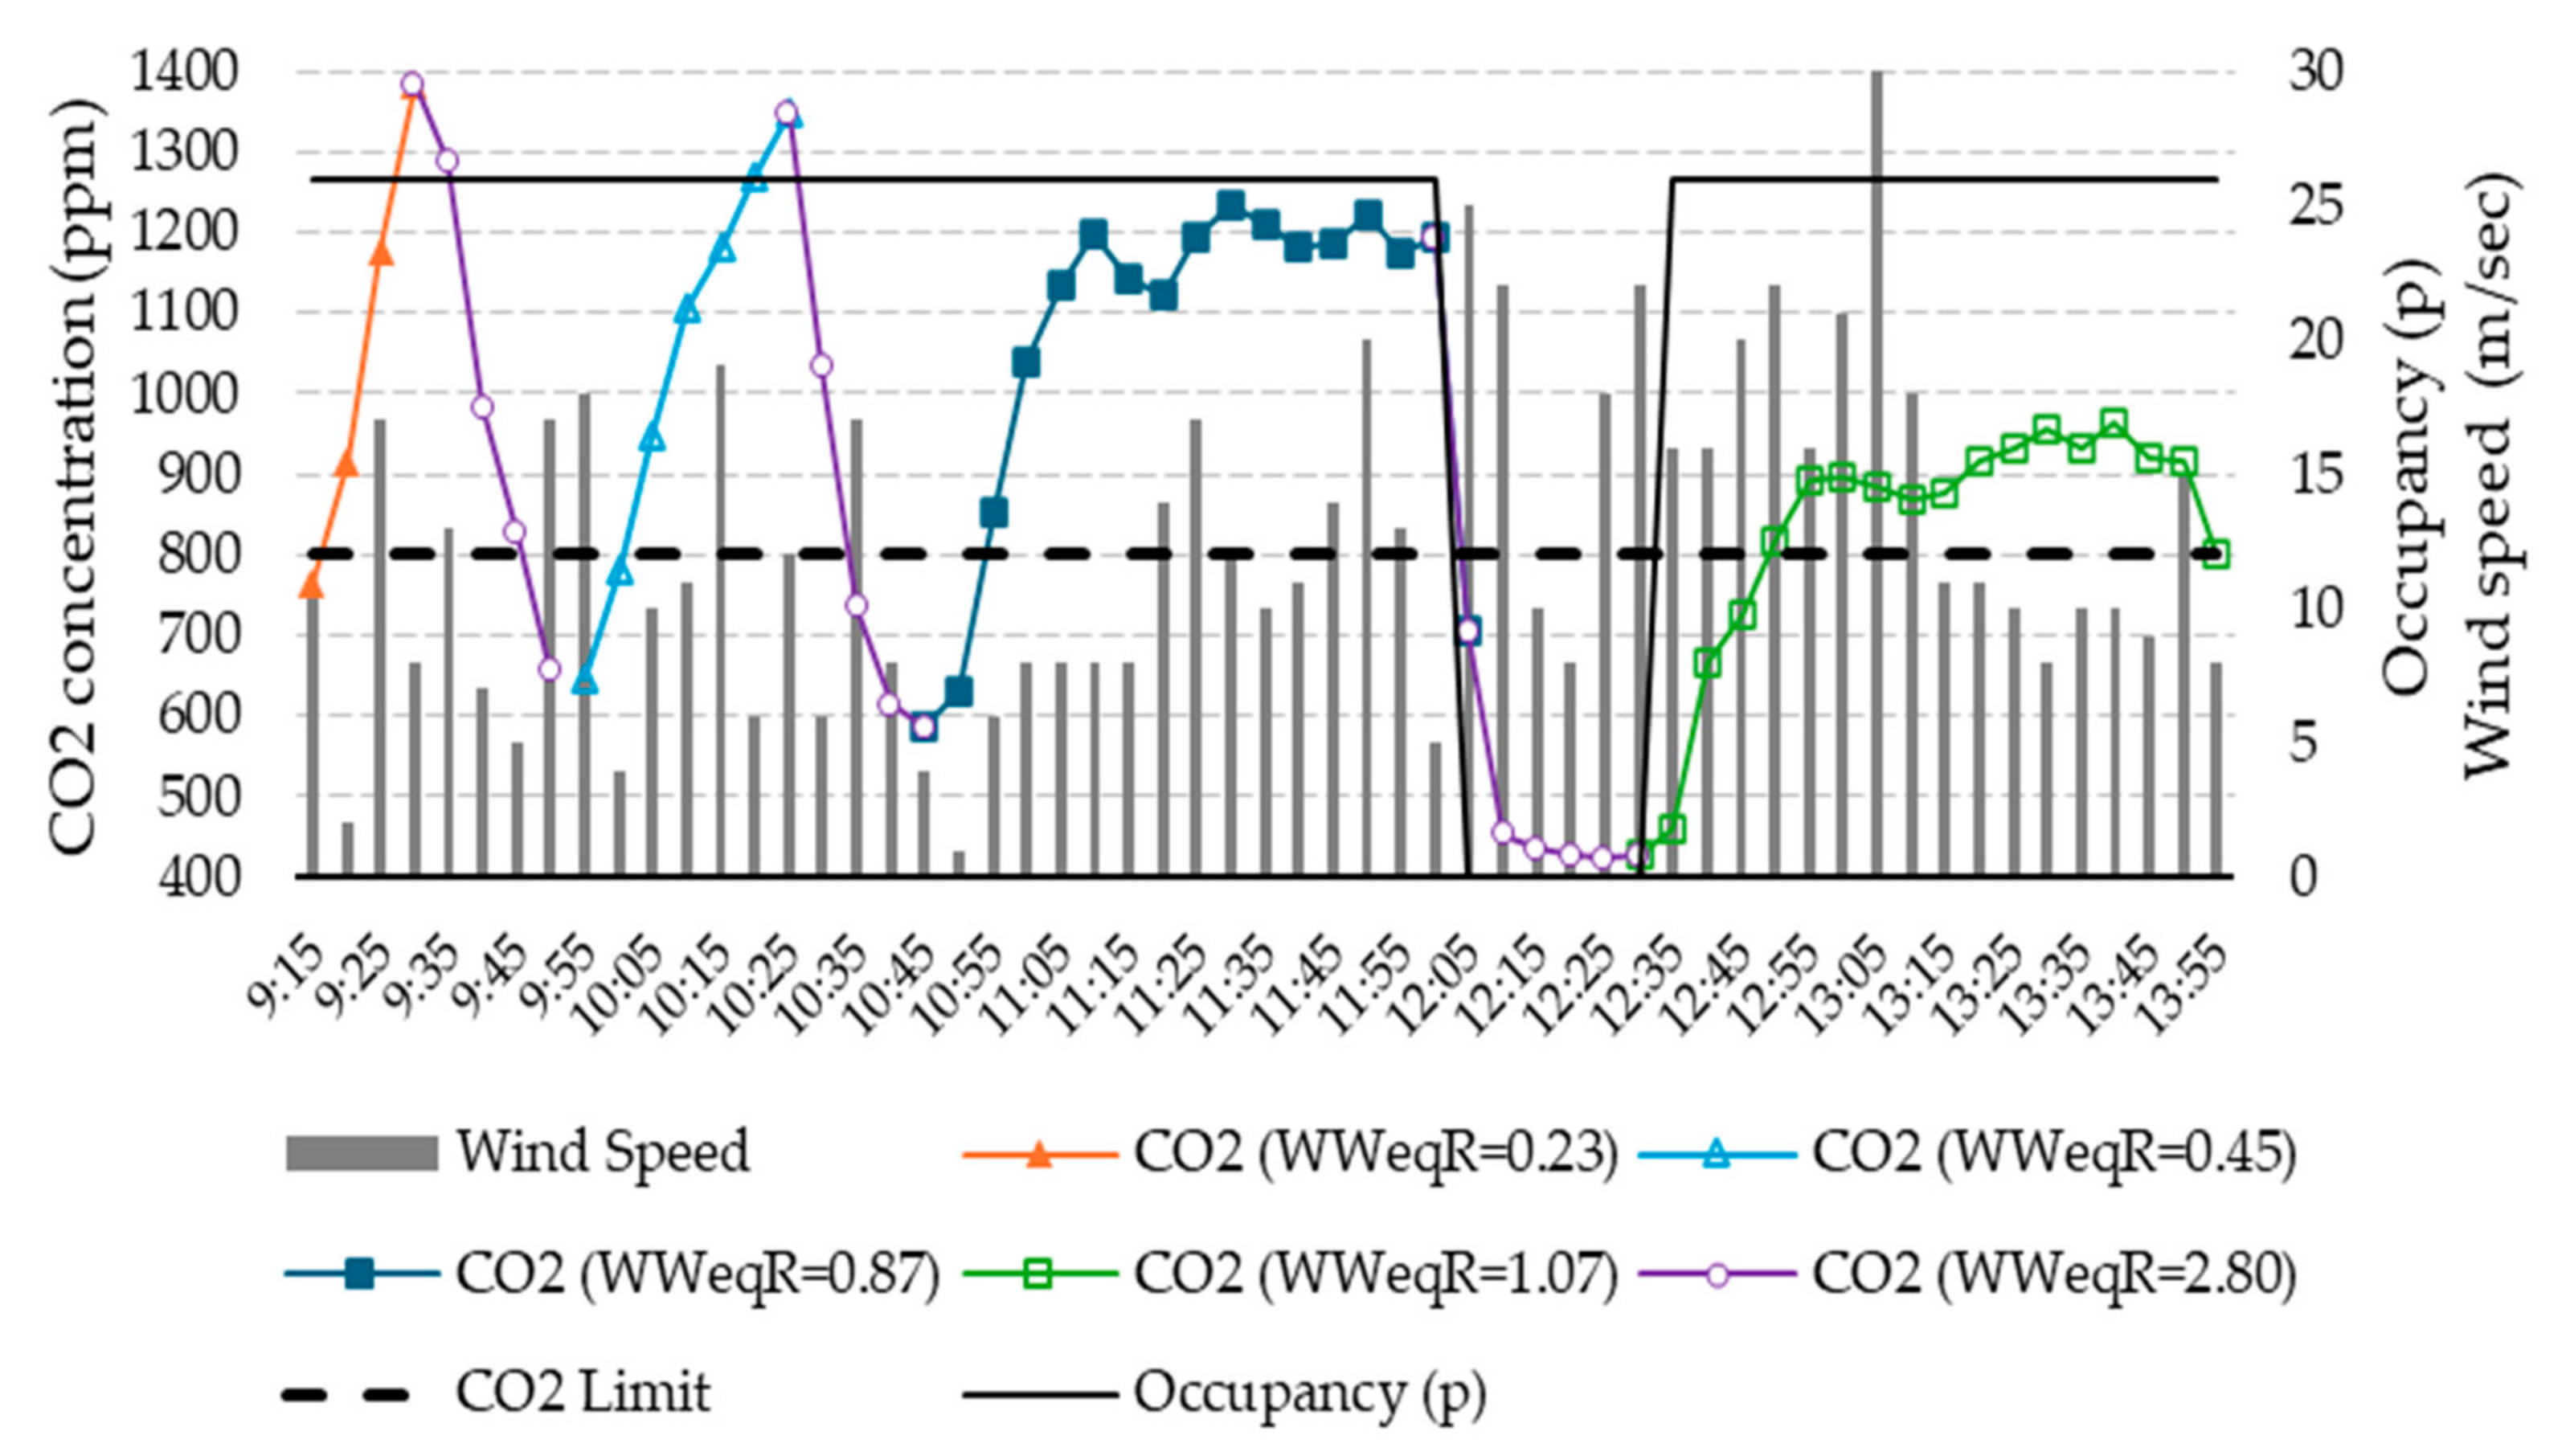
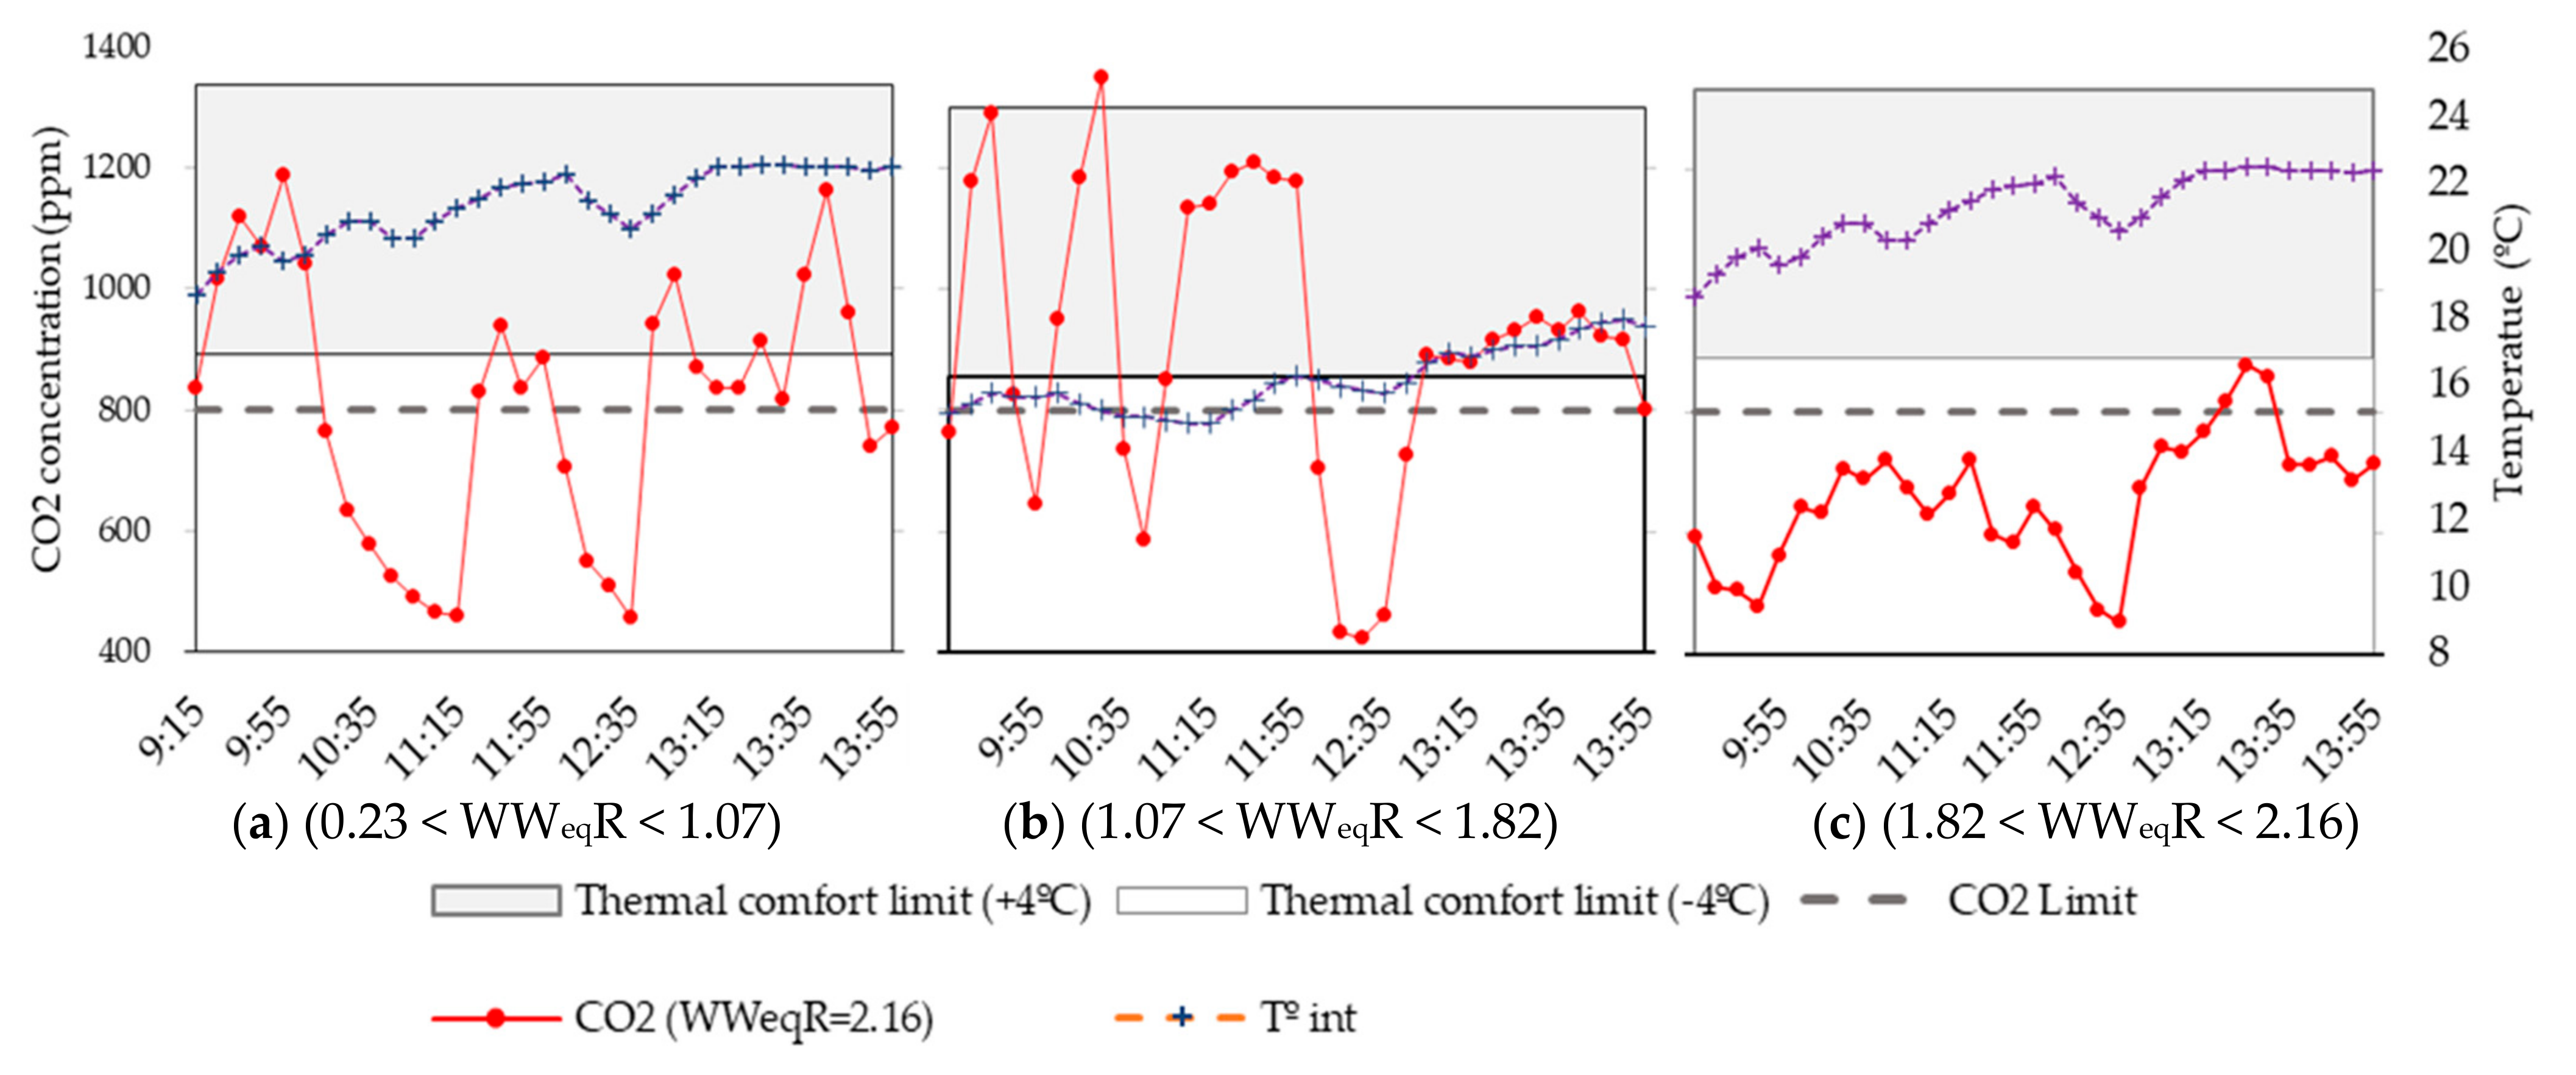
3.2.1. Monitoring of CO2 Concentration through Different WWeqRs with DNVP

The WWeqR applied on site did not match totally with the WWeqR described in the DNVP algorithm. The school staff suggested reducing some WWeqRs to avoid unwanted wind gusts from strong winds from 4.10% to 2.80%, and from 1.54% to 1.07%.
The results gathered after several weeks of IAQ data monitoring during November to December 2021 can be seen in Figure 10, Figure 11 and Figure 12. Figure 10 and Figure 11 shows the evolution of the CO2 concentration in ppm during the DNVP on-site monitoring, from the lowest (0.23%) to the highest (1.07%) WWeqR, including the maximum ventilation flux at 2.80% WWeqR. Figure 11 shows the CO2 concentrations when WWeqR is 2.16% with the SNVP. Figure 10 shows the CO2 concentration evolution for different WWeqRs, from 0.23% to 1.07%. At each CO2 concentration peak, the school building staff modify the WWeqR to 2.80%, until the CO2 falls below 400 ppm or to the lowest possible CO2 concentration. The wind speed shown in Figure 10 indicates a great deviation from the average statistical conditions used in Section 3.1, which has a notable effect on the CO2 concentration. In accordance with the strong wind and the promising results of the lower WWeqR, the school building staff decided to slightly increase the WWeqR to 1.07%, to reduce the TC unsatisfaction of the occupants. Therefore, in the last monitoring stint, between 12:30 and13:55, the CO2 remains between 800 and 1000 ppm.
Figure 11 shows the CO2 concentration evolution for different WWeqRs, from 1.07% to 1.82%, with additional variations up to 2.80%, according to the DNVP algorithm.
The wind speed decreases from Figure 10 to Figure 11, which seems to affect the CO2 concentration. Although the WWeqR was changed between 1.54% and 1.82%, the CO2 concentration rises quickly, circa 1200 ppm, as it did with the 0.87% WWeqR in Figure 10. In both cases, in Figure 10 and Figure 11, the occupancy remained the same and there were no other incidents during the experiment.

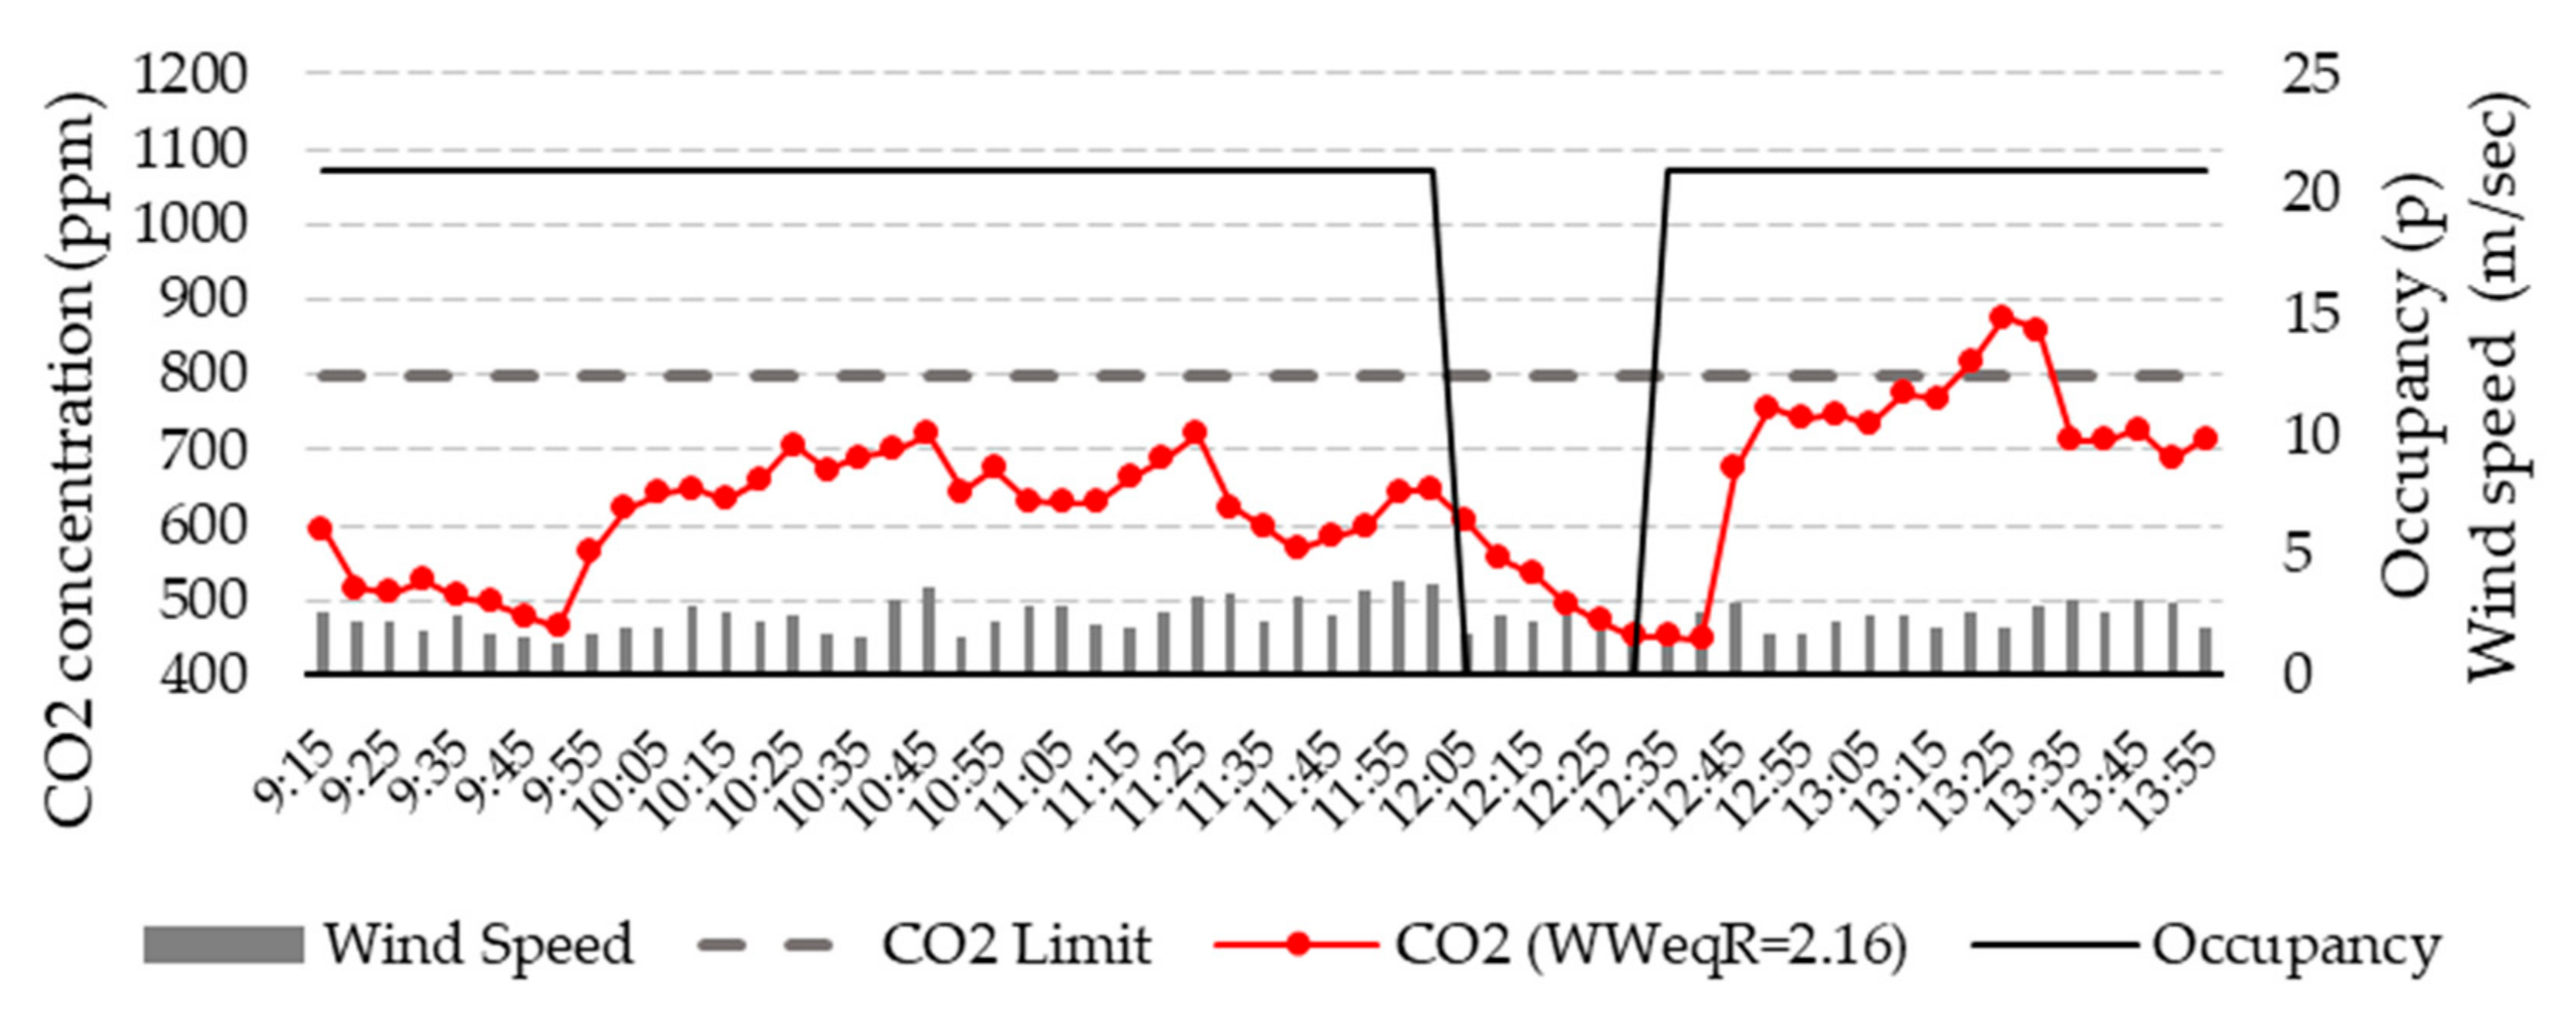
3.2.2. Monitoring of CO2 Concentration through 2.16% WWeqR with SNVP

A new monitoring was carried out on the 17th of December using a 2.16% WWeqR, as suggested by the simulations and the previous monitoring processes. The results are shown in Figure 12.
During the whole process, the SNVP was not activated because the CO2 concentration remained all the time below 800 ppm, except for a 10 min period from 13:20 to 13:30. Therefore the WWeqR selected (2.16%), achieved the maintaining of adequate levels of CO2 concentration. There were some modifications in the key environmental parameters: the occupancy was 21 instead of 26 and the wind speed remain constant, between 2 and 3 m/s. Both parameters have a major influence on CO2 concentration, as described in Equation (2).
Figure 13 shows a comparison of occupancy and wind conditions between the 18th and 26th of November and the 17th of December 2021. In all of them, the wind direction trend is quite similar, a northwest direction, but the wind speed is quite different. The first graph in Figure 13a shows peak speed values over 20 m/s, while the graph in Figure 13b shows lower wind speeds. Results in Figure 13c are similar to those average values described in Section 2.3.4., as used in the simulations. Figure 13a–c also includes the outdoor temperature, which is also relevant in comparing the TC with the climatic conditions. Figure 13a,c show outdoor temperatures from 10 °C to 20 °C, while Figure 13b shows a 5 °C-lower outdoor temperature.
Table 6 includes a summary of the average values for each 30 min time frame for the three different days monitored. Each day starts with a specific WWeqR, from 0.23% to 2.16%. The table also includes the peak value for 2.16%. The table also includes the peak value for each period. During all the time frames, the concentrations of CO2 remain below the suggested limits when the DNVP activates a WWeqR bigger than 2.16%, for a typical windy winter day in Seville.

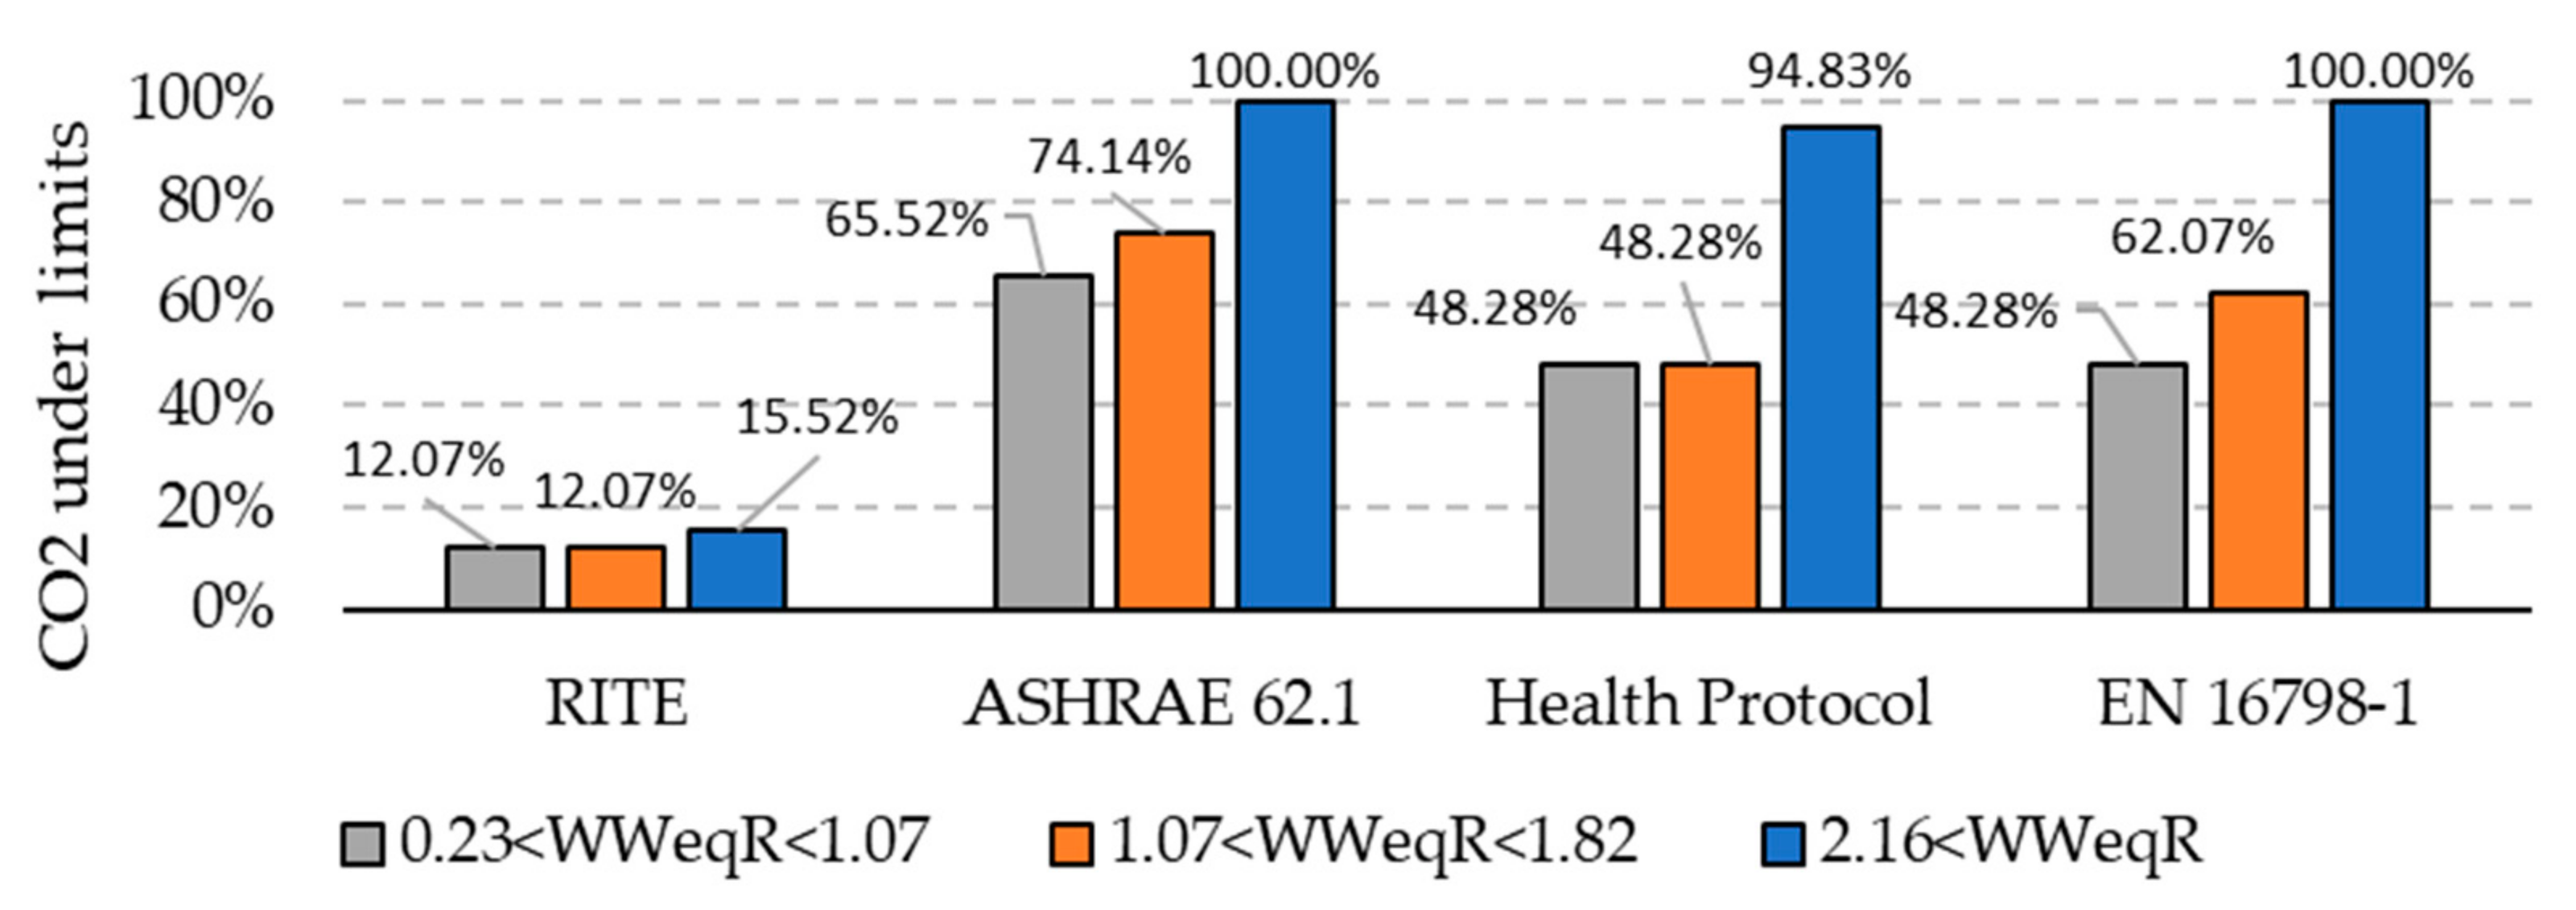
3.2.3. Summary of CO2 Assessment for DNVP and SNVP

Figure 14 shows the time during monitoring when CO2 concentration is below the recommended limits according to the most relevant IAQ standards.
Figure 14 plots the results obtained in the three monitored days and groups them into color bars (gray, brown, and blue) to present a summary of time when the CO2 is below the required limits: the 18th and the 26th of November, and the 17th of December.
When the WWeqR is 2.16%, the 17th of December (blue bar), the CO2 concentration is adequate during 100% of the time according to the EN 16798-1 and ASHRAE 62.1, and during 94.83% of the time according to the Health Protocol, but only during 15.52% of the time according to the RITE. However, the RITE is mandatory for new buildings and/or thermal facilities’ major renovations, but not for existing buildings.
When the WWeqR is between 0.23% and 1.82%, the 18th and the 26th of November (gray and brown bars), then the time within an adequate CO2 concentration is reduced. During the time of data monitored on the 18th of November, with a WWeqR between 0.23 and 1.07 (gray bar), the IAQ was adequate for the standards between 12.07% and 65.52% of the time. During the time of the data monitored on the 26th of November, with a WWeqR between 1.07 and 1.82 (brown bar), the IAQ was adequate for the standards only between 12.07% and 74.14% of the time.
According to the IAQ monitoring realized, if RITE is not considered in the analysis, the CO2 concentration was appropriate during all the time when the WWeqR was at least 2.16%, on the 17th of December. If the WWeqR used is between 0.23% and 1.82%, then the IAQ can be considered appropriate between 48.28% and 74.14% of the time.

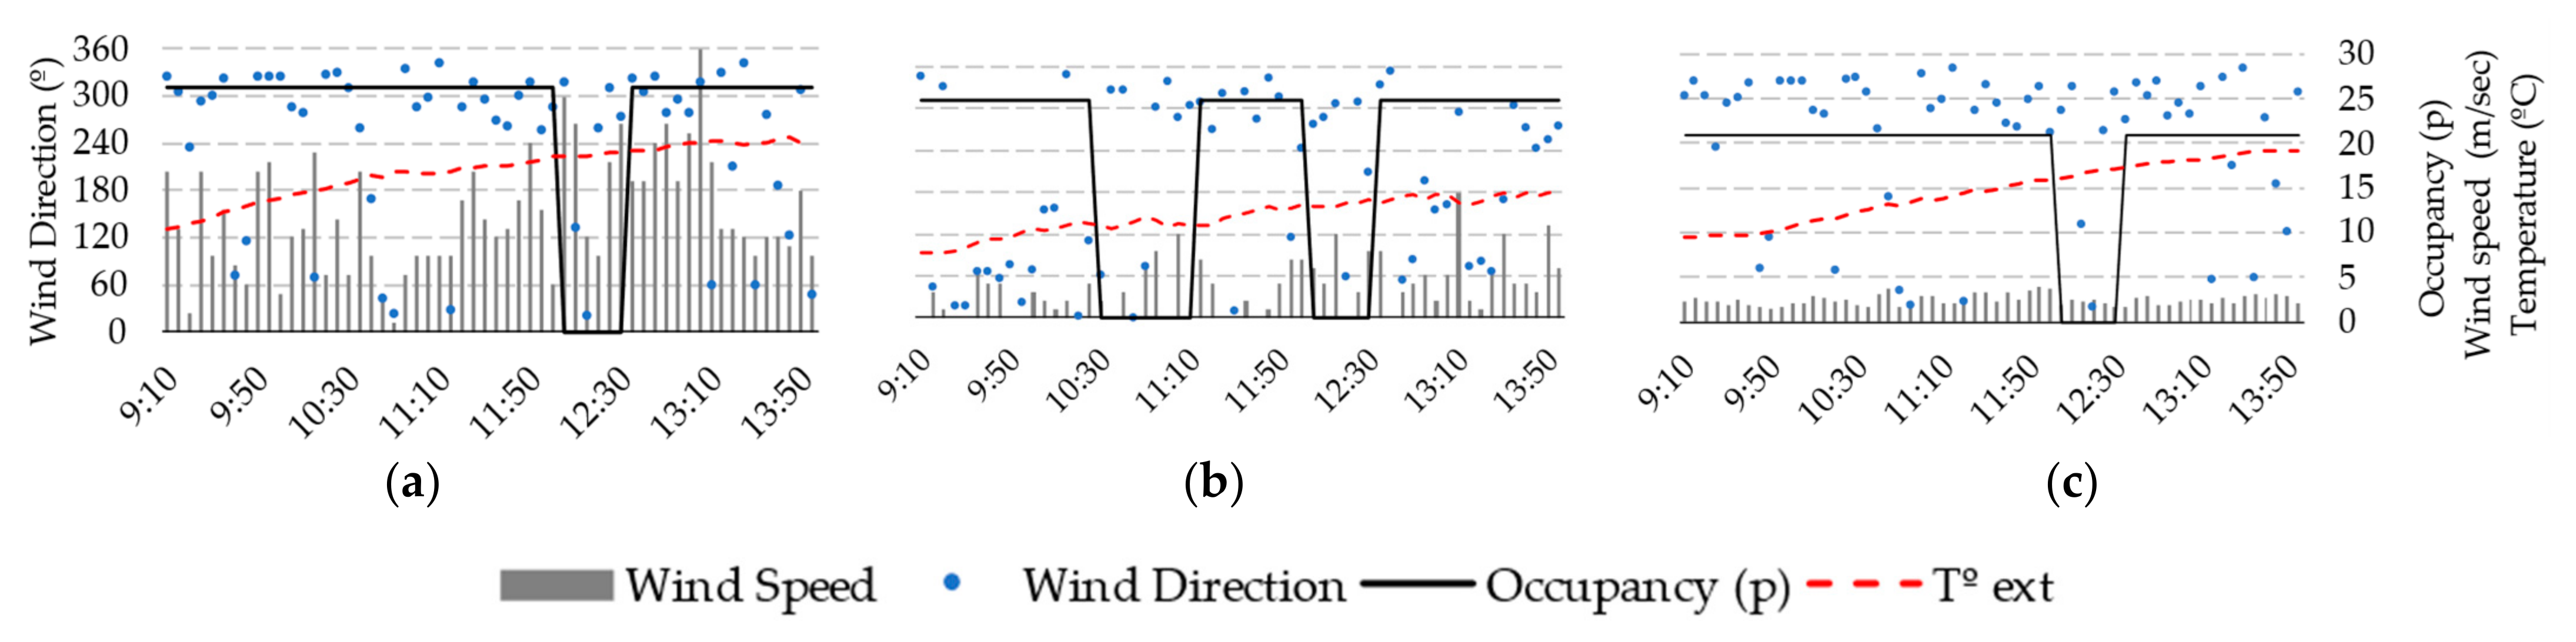
3.2.4. Temperature Monitoring during the Activation of the DNVP

The TC has also been monitored during this experiment, to achieve the necessary balance with IAQ. In Figure 15, the temperatures and CO2 concentration have been plotted with their respective limit levels. The CO2 concentration limits are set at 800 ppm, while the temperature limits are set as described in the UNE-EN 16798 for the adaptive model of passive operation buildings.
Figure 15a includes the data obtained on the 18th of November, with WWeqR from 0.23% to 1.07% according to the DVNP algorithm. The interior temperature remains for all the monitored time within the requested limits for adaptive comfort.
Figure 15b includes the data obtained on the 26th of November, with WWeqR from 1.07% to 1.82% according to the DVNP algorithm. The interior temperature achieves the TC band only at the end of the monitored time (from 12:35).
Figure 15c includes the data obtained on the 17th of December, with WWeqR at 2.16% according to the DVNP. The interior temperature remains for all the monitored time within the requested limits for adaptive comfort.

4. Discussion

4.1. The Convenience of Natural vs. Mechanical Ventilation in Achieving Adequate IAQ

The results shown in Section 3 describe how a natural ventilation protocol can provide acceptable IAQ in cross-ventilated school buildings. The adequate management of the WWeqR as proposed by the DNVP described in Figure 6 helps to achieve IAQ and TC. The alternative implementation of the SNVP can be equally successful in achieving the IAQ objective, but it may bring unwanted effects in TC.
Different IAQ standards have been considered in this study. If the standard applied is RITE [29], considering category IDA 2 with a 500 ppm CO2 concentration limit, then the period below the CO2 objective will be small. However, the RITE standard is only applicable for new construction buildings and major renovations of thermal facilities, which is not the focus of this research. The rest of the buildings that are not affected by the RITE, mostly in-use buildings, are focused on achieving IAQ with the objectives described in ASHRAE 62.1 [28], EN 16798 [27] and The COVID-19 Health Protocol [25]. For these standards, the effectiveness of the natural ventilation strategies can be achieved for circa 100% of the classroom period for buildings with cross ventilation in a subtropical climate with the proper WWeqR implementation regarding the DNVP.
Results shown in Section 3.1 are based on the hypothesis of an outdoor CO2 concentration of 400 ppm. The results shown in Section 3.2, for periods with no occupancy, demonstrate the validity of the outdoor CO2 concentration close to 400 ppm. Future studies may include additional analysis comparing the effectiveness of natural ventilation when the outdoor air quality is above 400 ppm. For those buildings, in cities with high pollution levels, the DNVP should include connection to outdoor sensors [21].
This study is focused on those indicators that affect exclusively thermal comfort. However, high-noise urban areas may be inadequate for natural ventilation. Future versions of the DNVP should include noise-level outdoor sensors to prevent unwanted effects.

4.2. Dynamic vs. Steady Ventilation Controls

The results provided in Section 3.1. show interesting results for maintaining the CO2 concentration below 800 ppm with constant modifications of the WWeqR. The design and implementation of the DNVP seeks to minimize the discomfort provided by the air renovations but maintaining the requested IAQ objective. However, the results shown in Section 3.2 demonstrate no great difference between the application of the SNVP and DNVP algorithms. Figure 15a–c indicates no benefit with the implementation of a DNVP, but according to Figure 13a–c there was a significant modification to the weather conditions compared with those considered as average in the simulations in Section 3.1. Each scenario shown in Section 3 provides comparable, but not identical, results about the convenience of using the DNVP or the SNVP to achieve 800 ppm as the maximum CO2 concentration.
The results provided by other authors [20], in similar climate conditions, indicate 60% hours with no TC when natural ventilation is the only source for obtaining IAQ. However, the results, provided in Figure 15a–c demonstrate a higher period of TC. Figure 15c, with 2.26% WWeqR, achieves 94.38% of IAQ according to the Health Protocol CO2 requirement, and a 100% TC according to the adaptive comfort model [40]. Future studies should focus on the need to extend the monitoring period to include the effects of climate change [42].

4.2.1. Simulation Results

Most of the authors describe the IAQ with natural ventilation as a discussion on the need to maintain a constant or variable WWeqR [6,14]. The results shown in Section 3.1. indicate that a variable WWeqR, alternating a higher and lower WWeqR, can maintain an acceptable IAQ while reducing periods with high WWeqR. That is useful to avoid constant unwanted wind gusts and potential thermal discomfort.
When the SNVP is active, it is necessary to have a minimum WWeqR of 2.16% to achieve the CO2 objective. The use of the maximum WWeqR available for this classroom may provide a 545 CO2 concentration, which does not achieve the requirements of RITE (IDA 2 category) [29]. However, the requirements from all the other standards could be fulfilled.
When the DNVP is applied to the simulation (Appendix B), each of the WWeqR considered, from 0.23% to 1.54%, achieves the CO2 concentration objective. However, this anticipates the need to maintain a constant control on the openings and the WWeqR.
The results are based on a 0.65-discharge coefficient as standard value for DesignbuiderTM simulations, and an average 2.6 m/s wind speed, in the northeast direction. It is not expected that climate conditions can be included in the DNVP algorithm, but future simulation works may include different discharge coefficients according to different school shapes and orientations [6,14].

4.2.2. Monitoring Results

The results shown in Section 3.2 verify the simulation data obtained in Section 3.1 in many ways. However, due to physical restrictions, some parameters had to be changed during the monitoring process: people occupancy, and wind conditions. The monitoring described in Section 3.2 applies the DNVP to a real scenario. In both cases, the occupancy was 26 instead of the 21 used in Section 3.1, which provided an increase in the CO2 concentration. Due to mechanical restrictions in opening the windows, caused by a lack of maintenance, the staff in charge of the experiment had to adapt different WWeqR from the ones used in the simulations.
The research achieves the CO2 objective requested by the ASHRAE 62.1, the Health Protocol and EN 16798-1 when the WWeqR is 2.16%, but its success is reduced to 50% when the WWeqR is reduced. This confirms the strategies described in previous experiments [7], and the adequacy of this WWeqR for this case study, as adequate for the SNVP. The results in Figure 14 demonstrate the difficulties in achieving the CO2 required by RITE for natural ventilation, due to its extreme request.
However, the monitoring results for validating the DNVP provide some slight differences from those obtained in Section 3.1, due several factors:
First, the variations steps of WWeqR for adjusting the IAQ were smaller than expected in the simulation results in Figure 8. Human management of the opening process cannot be fully followed by the school staff. Future versions of the DNVP must consider human limitations or introduce a mechanical control.
Second, wind and occupancy changes and variations could not be anticipated from the simulation to the monitoring process. Future versions of the DNVP could include low-cost outdoor air-quality sensors and a meteorological station to anticipate changes in the trends of CO2 concentration.

4.3. Adaptive Comfort with Natural Ventilation

The improvement in the IAQ of the buildings by adding natural ventilation [7] may have some comfort flaws [48]. IAQ can potentially affect TC and consequently the EE of the buildings [12,33]. However, there are passive-design measures that may combine good IAQ with TC to maintain a low energy demand. Some of these measures are based on adaptive TC [9], and they seek the combination of natural ventilation with climatization in a mix-mode approach. As shown in Figure 15a,c, for subtropical climates with mild winters, the TC can be achieved for 100% of the time if the adaptive comfort approach [27] is considered. However, the results shown in Figure 15b demonstrate that significant variations in outdoor temperatures produce a reduction in the time within the TC limits. It has been demonstrated that the introduction of control patterns in existing buildings with natural ventilation such as the DNVP, whether they are manual or mechanical, can improve the IAQ while maintaining adaptive TC on mild winter days.
The DNVP must be revised to be used in school buildings in different climatic regions, to demonstrate its convenience. Other authors suggest overheating as the main barrier for TC introducing natural ventilation to achieve IAQ in a hot, humid climate [22]. There, the DNVP may introduce an additional input temperature sensor.

5. Conclusions

The research describes the principles, simulation, implementation, and monitoring of two different scenarios of natural cross ventilation applied to a school building affected by a subtropical climate. The findings are summarized in the following points:
  • Two different ventilation control algorithms, the SNVP and DNVP, were developed by the contribution of the software simulation to guarantee an acceptable IAQ, according to the most-accepted standards.
  • For this case study simulation, the SNVP provides a 2.16% WWeqR to maintain CO2 below 800 ppm for a typical winter day in a subtropical climate, with 2.6 m/s wind and a northeast direction, when the occupancy is twenty-one students.
  • The simulation of the DNVP anticipates that any WWeqR below 2.16% can maintain CO2 below 800 ppm if it increases the WWeqR to remove the unwanted CO2.
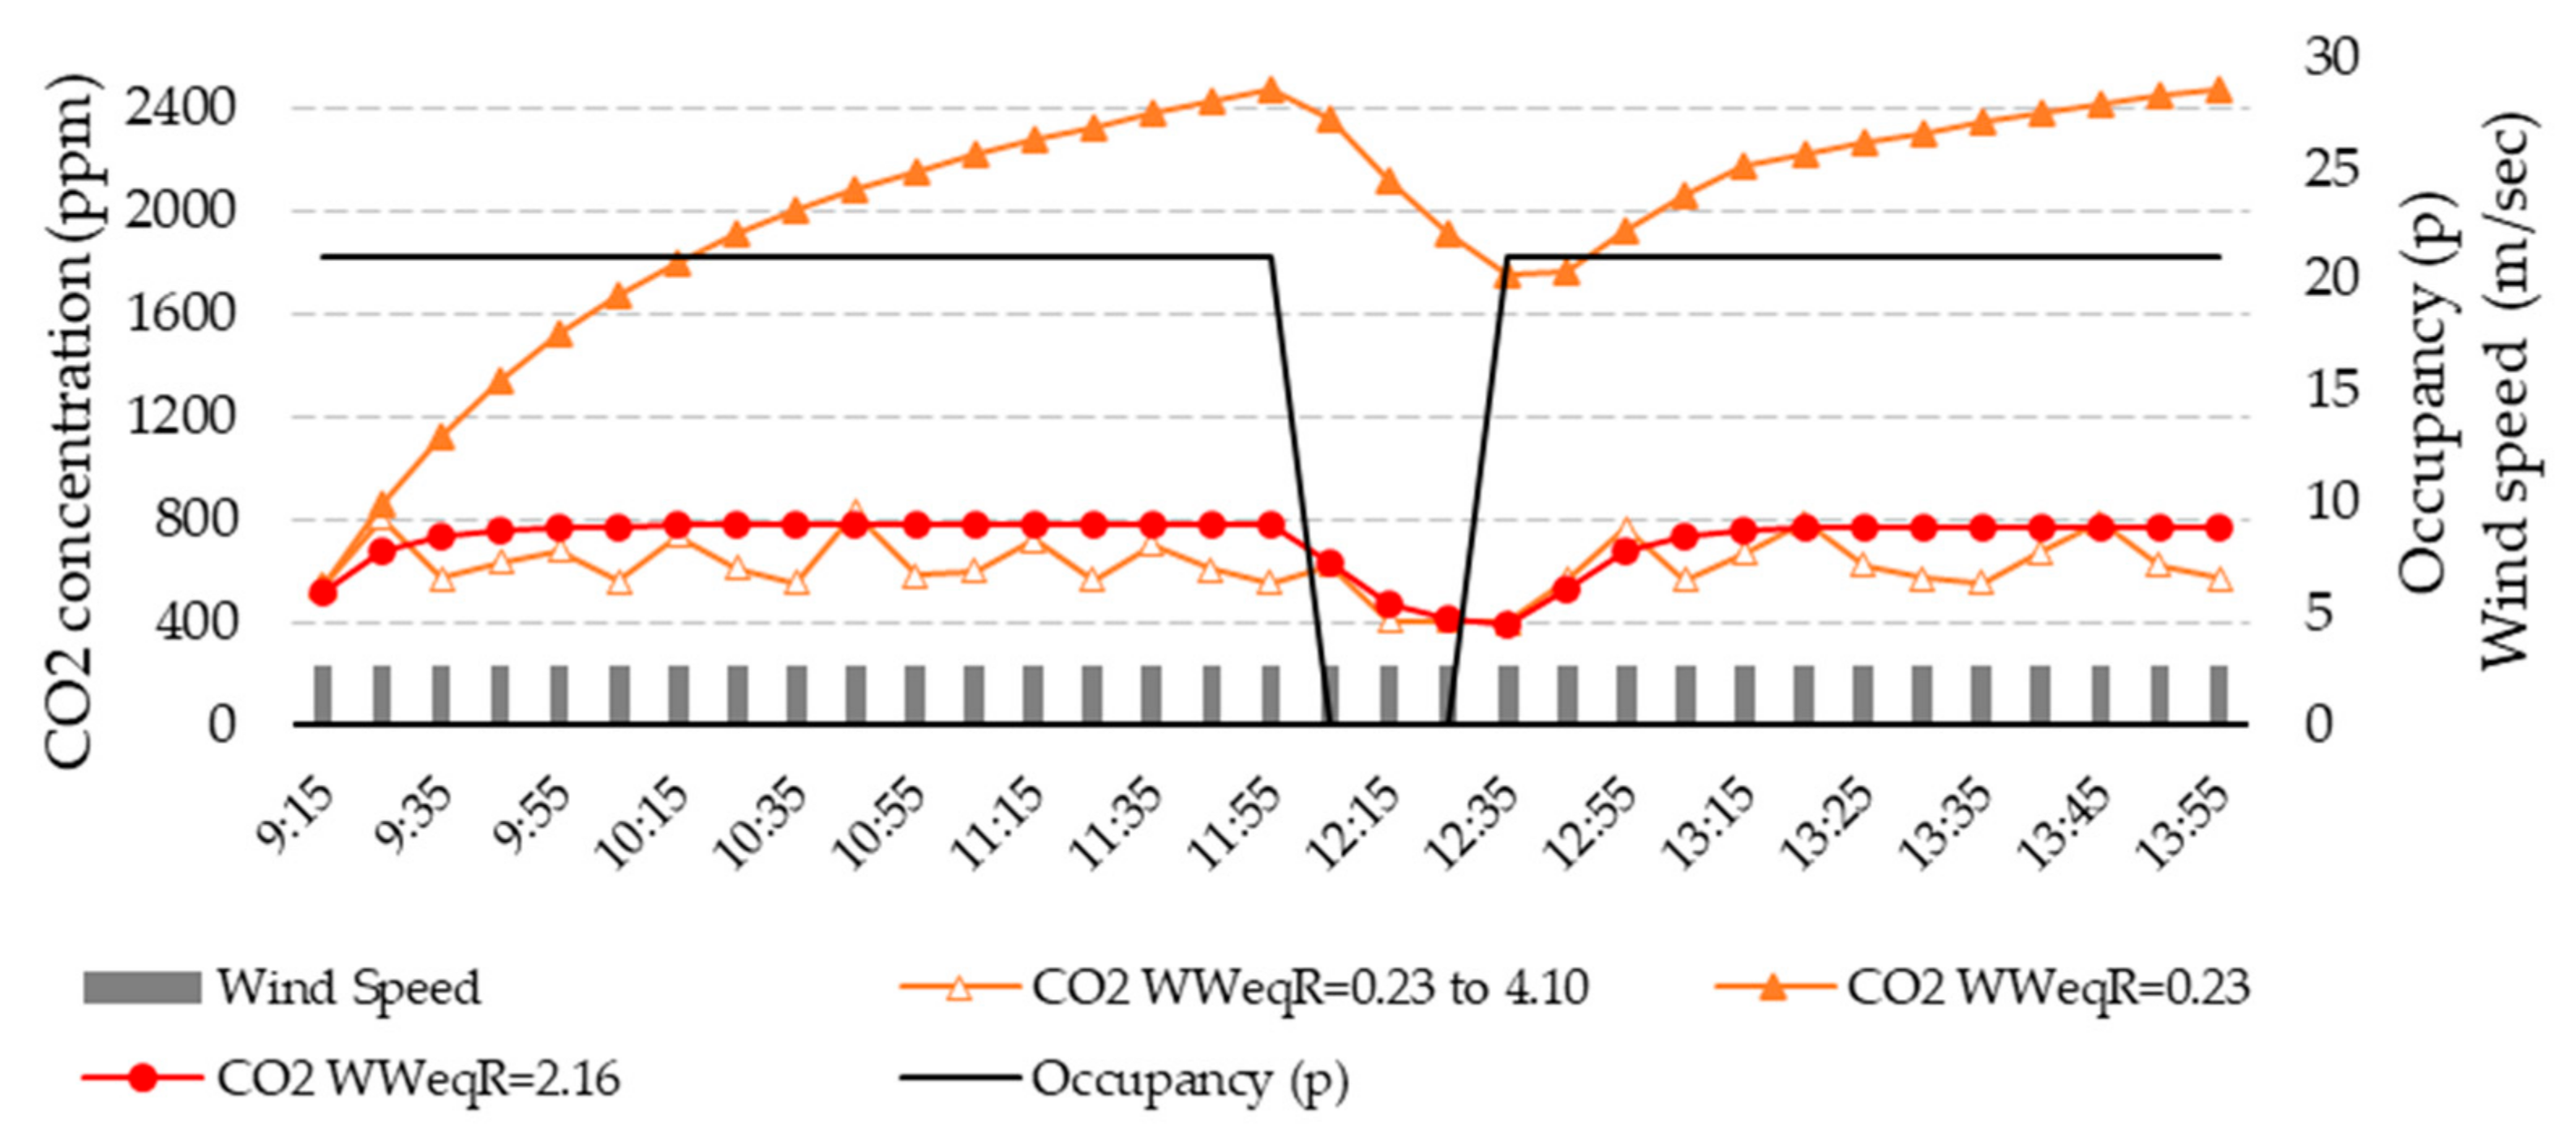
  • The simulations, run in DesignbuilderTM, obtain a different grade of validation for the SNVP. The results, with a steady 2.16% WWeqR, shown in Figure 9, are similar to the monitored results in Figure 12. However, the accuracy of the simulated DNVP is reduced because of a lack of accuracy in the opening management. The DNVP simulation describes double the WWeqR modifications compared to the DNVP monitoring. The implementation of manual proceedings applied by the building staff seem to be less effective than mechanical controls. This may be considered in future studies.
  • According to the results obtained in the monitoring process, the application of the SNVP maintains the CO2 concentration under 800 ppm during 100% of the operational time when the WWeqR was 2.16%, but failed during part of the study when the DNVP was applied. That suggests the need to implement better WWeqR controls to increase the efficiency of the protocols, as described in the simulation process.
  • The CO2 limits proposed by RITE, 500 ppm, were only achieved for 15.52% of the time with the maximum WWeqR applied, which demonstrates the inadequacy of the natural ventilation to fulfil the standard.
  • When the DNVP is used with a WWeqR below 2.16%, it can partially maintain CO2 under the required limits for those standards different to RITE. The analysis demonstrates compliance for 48.28% to 65.52% of the monitored time if the WWeqR is between 0.23 and 1.07, and a compliance for 48.28% to 74.14% of the monitored time if the WWeqR is between 1.07 and 1.82.
  • During the monitoring process, the TC was also monitored to demonstrate the adequacy of the natural ventilation protocols with the adaptive TC described in the UNE-EN 16798 [27], for category III with a ±4 °C of adaptation. The application of the DNVP on a mild winter day achieved 100% TC during the full monitoring period. For schools in colder climatic zones, the TC could be compromised, if the rest of the conditions remain the same. However, passive-design principles could be used.
  • Future versions of these ventilation protocols may include temperature sensors to improve the WWeqR control. Therefore, it could lead to an increase in energy efficiency to become nearly zero-energy buildings by means of passive-design techniques.

Author Contributions

Conceptualization, methodology, software, validation, formal analysis, investigation, data curation, writing—original draft preparation, and visualization, A.S.C.; supervision, project administration, writing—review and editing, S.G.M. and J.M.A.M. All authors have read and agreed to the published version of the manuscript.

Funding

This work has been funded by the Research Center for Technology, Energy and Sustainability (CITES) at the University of Huelva (Spain).

Institutional Review Board Statement

Not applicable.

Informed Consent Statement

Not applicable.

Data Availability Statement

Data are contained within the article.

Conflicts of Interest

The authors declare no conflicts of interest.

Appendix A

The Transient Mass Balance Equation. As briefly described in Section 2.3, the DesignBuilderTM CO2 prediction is based on the calculation provided by EnergyPlusTM in the Engineering Reference, Section 2.5 [47]. The full equation and all its elements are described here:
ρ a i r   V Z   C C O 2   d C Z t d t = i = 1 N s i k g m a s s s c h e d   l o a d 1.0   6 + i = 1 N z o n e s m i   C z i C z t + C C z t + m s y s ( C S U P C Z t )
where
i = 1 N s i k g m a s s s c h e d   l o a d = sum of each sum of scheduled internal carbon dioxide loads. The zone air density is used to convert the volumetric rate of carbon dioxide generation from user input into mass generation rate [kg/s]. The coefficient of 106 is used to convert the units of carbon dioxide to ppm.
i = 1 N z o n e s m i   C z i C z t = carbon dioxide transfer due to interzone air mixing [ppm-kg/s]
C z i = carbon dioxide concentration in the zone air being transferred into this zone [ppm]
m i n f ( C a ? ? C z t ) = carbon dioxide transfer due to infiltration and ventilation of outdoor air [ppm-kg/s]
C a ? ? = carbon dioxide concentration in outdoor air [ppm]
m i n f ( C s u p C z t ) = carbon dioxide transfer due to system supply [ppm-kg/s]
C S U P = carbon dioxide concentration in the system supply airstream [ppm]
m s y s = air system-supply mass flow rate [kg/s]
ρ a i r   V Z   C C O 2   d C Z t d t = carbon dioxide storage term in zone air [kg/s]
C Z t = zone air carbon dioxide concentration at the current time step [ppm]
ρ a i r   = zone air density [kg/m3], V Z = zone volume [m3]
C C O 2 = carbon dioxide capacity multiplier [dimensionless]

Appendix B

EMS script for DNVP. The DesignBuilderTM simulation includes a ventilation protocol schedule, which is not within the current options of the software capabilities. To ensure the proper function of the DNVP, the authors used the EMS runtime scripting tools. The scripting code for north windward windows is presented here (the same has been used for the south leeward side, but with the corresponding opening factors):
Applsci 14 04651 i001

References

  1. Huang, L.; Krigsvoll, G.; Johansen, F.; Liu, Y.; Zhang, X. Carbon emission of global construction sector. Renew. Sustain. Energy Rev. 2018, 81, 1906–1916. [Google Scholar] [CrossRef]
  2. Becker, R.; Goldberger, I.; Paciuk, M. Improving energy performance of school buildings while ensuring indoor air quality ventilation. Build. Environ. 2007, 42, 3261–3276. [Google Scholar] [CrossRef]
  3. Cordero, A.S.; Melgar, S.G.; Márquez, J.M.A. Green building rating systems and the new framework level(s): A critical review of sustainability certification within Europe. Energies 2019, 13, 66. [Google Scholar] [CrossRef]
  4. Pisello, A.L.; Castaldo, V.L.; Taylor, J.E.; Cotana, F. The impact of natural ventilation on building energy requirement at inter-building scale. Energy Build. 2016, 127, 870–883. [Google Scholar] [CrossRef]
  5. Rodrigues, A.M.; Santos, M.; Gomes, M.G.; Duarte, R. Impact of natural ventilation on the thermal and energy performance of buildings in a Mediterranean climate. Buildings 2019, 9, 123. [Google Scholar] [CrossRef]
  6. Hwang, R.L.; Huang, A.W.; Chen, W.A. Considerations on envelope design criteria for hybrid ventilation thermal management of school buildings in hot–humid climates. Energy Rep. 2021, 7, 5834–5845. [Google Scholar] [CrossRef]
  7. Melgar, S.G.; Cordero, A.S.; Rodríguez, M.V.; Márquez, J.M.A.; Control, T.E.P.; Técnica, E.; De Ingeniería, S.; De Huelva, U.; Huelva, C.P. Influence on indoor comfort and energy demand due to the application of COVID-19 natural ventilation protocols for schools at subtropical climate during winter season. In Proceedings of the 3rd International Symposium on Architecture Research Frontiers and Ecological Environment (ARFEE 2020), Guangzhou, China, 18–20 December 2020; p. 6. [Google Scholar]
  8. Sánchez-García, D.; Bienvenido-Huertas, D.; Rubio-Bellido, C. Computational approach to extend the air-conditioning usage to adaptive comfort: Adaptive-Comfort-Control-Implementation Script. Autom. Constr. 2021, 131, 103900. [Google Scholar] [CrossRef]
  9. Sánchez-García, D.; Rubio-Bellido, C.; Tristancho, M.; Marrero, M. A comparative study on energy demand through the adaptive thermal comfort approach considering climate change in office buildings of Spain. Build. Simul. 2020, 13, 51–63. [Google Scholar] [CrossRef]
  10. Melgar, S.G.; Cordero, A.S.; Rodríguez, M.V.; Andújar Márquez, J.M. Matching energy consumption and photovoltaic production in a retrofitted dwelling in subtropical climate without a backup system. Energies 2020, 13, 6026. [Google Scholar] [CrossRef]
  11. Melgar, S.G.; Bohórquez, M.Á.M.; Márquez, J.M.A. UhuMEB: Design, construction, and management methodology of minimum energy buildings in subtropical climates. Energies 2018, 11, 2745. [Google Scholar] [CrossRef]
  12. Melgar, S.G.; Martínez Bohórquez, M.Á.; Andújar Márquez, J.M. Uhumebr: Energy refurbishment of existing buildings in subtropical climates to become minimum energy buildings. Energies 2020, 13, 1204. [Google Scholar] [CrossRef]
  13. Soares, N.; Bastos, J.; Pereira, L.D.; Soares, A.; Amaral, A.R.; Asadi, E.; Rodrigues, E.; Lamas, F.B.; Monteiro, H.; Lopes, M.A.R.; et al. A review on current advances in the energy and environmental performance of buildings towards a more sustainable built environment. Renew. Sustain. Energy Rev. 2017, 77, 845–860. [Google Scholar] [CrossRef]
  14. Hwang, R.L.; Liao, W.J.; Chen, W.A. Optimization of energy use and academic performance for educational environments in hot-humid climates. Build. Environ. 2022, 222, 109434. [Google Scholar] [CrossRef]
  15. World Health Organization; Regional Office for Europe. WHO Guidelines for Indoor Air Quality: Selected Pollutants; World Health Organization: Geneva, Switzerland, 2010. [Google Scholar]
  16. Mannan, M.; Al-Ghamdi, S.G. Indoor air quality in buildings: A comprehensive review on the factors influencing air pollution in residential and commercial structure. Int. J. Environ. Res. Public Health 2021, 18, 3276. [Google Scholar] [CrossRef]
  17. Bateson, T.F.; Schwartz, J. Children’s response to air pollutants. J. Toxicol. Environ. Health Part A Curr. Issues 2008, 71, 238–243. [Google Scholar] [CrossRef] [PubMed]
  18. Bogdanovica, S.; Zemitis, J.; Bogdanovics, R. The Effect of CO2 Concentration on Children’s Well-Being during the Process of Learning. Energies 2020, 13, 6099. [Google Scholar] [CrossRef]
  19. Stabile, L.; Dell’Isola, M.; Russi, A.; Massimo, A.; Buonanno, G. The effect of natural ventilation strategy on indoor air quality in schools. Sci. Total Environ. 2017, 595, 894–902. [Google Scholar] [CrossRef]
  20. Alonso, A.; Llanos, J.; Escandón, R.; Sendra, J.J. Effects of the COVID-19 pandemic on indoor air quality and thermal comfort of primary schools in winter in a mediterranean climate. Sustainability 2021, 13, 2699. [Google Scholar] [CrossRef]
  21. Sofia, D.; Giuliano, A.; Gioiella, F.; Barletta, D.; Poletto, M. Modeling of an air quality monitoring network with high space-time resolution. Comput. Aided Chem. Eng. 2018, 43, 193–198. [Google Scholar] [CrossRef]
  22. Domínguez-Amarillo, S.; Fernández-Agüera, J.; González, M.M.; Cuerdo-Vilches, T. Overheating in schools: Factors determining children’s perceptions of overall comfort indoors. Sustainability 2020, 12, 5772. [Google Scholar] [CrossRef]
  23. Morawska, L.; Milton, D.K. It Is Time to Address Airborne Transmission of Coronavirus Disease 2019 (COVID-19). Clin. Infect. Dis. 2020, 71, 2311–2313. [Google Scholar] [CrossRef]
  24. Peng, Z.; Jimenez, J.L. Exhaled CO2 as a COVID-19 infection risk proxy for different indoor environments and activities. Environ. Sci. Technol. Lett. 2021, 8, 392–397. [Google Scholar] [CrossRef]
  25. Ministerio de Sanidad Gobierno de España. Medidas de Prevención, Higiene y Promoción de l Salud Frente a COVID-19 Para Centros Educativos en el Curso 2020–2021. Available online: http://www.educacionyfp.gob.es/dam/jcr:7e90bfc0-502b-4f18-b206-f414ea3cdb5c/medidas-centros-educativos-curso-20-21.pdf (accessed on 1 November 2021).
  26. Chatzidiakou, L.; Archer, R.; Beale, V.; Bland, S.; Carter, H.; Castro-Faccetti, C.; Edwards, H.; Finneran, J.; Hama, S.; Jones, R.L.; et al. Schools’ air quality monitoring for health and education: Methods and protocols of the SAMHE initiative and project. Dev. Built Environ. 2023, 16, 100266. [Google Scholar] [CrossRef]
  27. EN 16798-1:2020; Energy Performance of Buildings—Ventilation for Buildings—Part 1: Indoor Environmental Input Parameters for Design and Assessment of Energy Performance of Buildings Addressing Indoor Air Quality, Thermal Environment, Lighting and Acoustic. European Standard: Newark, DE, USA, 2020. Available online: https://standards.iteh.ai/catalog/standards/cen/b4f68755-2204-4796-854a-56643dfcfe89/en-16798-1-2019 (accessed on 1 November 2021).
  28. ANSI/ASHRAE Standard 62.1-2019; Ventilation for Acceptable Indoor Air Quality. American Society of Heating, Refrigerating and Air-Conditioning Engineers, Inc.: Atlanta, GA, USA, 2019.
  29. RITE. Reglamento de Instalaciones Térmicas en los Edificios. Bol. Estado 2021, 71, 33748–33793. Available online: https://www.boe.es/eli/es/rd/2021/03/23/178 (accessed on 1 November 2021).
  30. International Well Building Institute. The Well Building Standard V2; International WELL Building Institute (IWBI): New York, NY, USA, 2021. [Google Scholar]
  31. Kapsalaki, M. ASHRAE Position Document on Indoor Carbon Dioxide; ASHRAE: Atlanta, GA, USA, 2022. [Google Scholar]
  32. Persily, A.; de Jonge, L. Carbon dioxide generation rates for building occupants. Indoor Air 2017, 27, 868–879. [Google Scholar] [CrossRef]
  33. Gilani, S.; O’Brien, W. Natural ventilation usability under climate change in Canada and the United States. Build. Res. Inf. 2021, 49, 367–386. [Google Scholar] [CrossRef]
  34. Daemei, A.B.; Limaki, A.K.; Safari, H. Opening Performance Simulation in Natural Ventilation Using Design Builder (Case Study: A Residential Home in Rasht). Energy Procedia 2016, 100, 412–422. [Google Scholar] [CrossRef]
  35. Jiang, Z.; Kobayashi, T.; Yamanaka, T.; Sandberg, M. A literature review of cross ventilation in buildings. Energy Build. 2023, 291, 113143. [Google Scholar] [CrossRef]
  36. Tecle, A.; Bitsuamlak, G.T.; Jiru, T.E. Wind-driven natural ventilation in a low-rise building: A Boundary Layer Wind Tunnel study. Build. Environ. 2013, 59, 275–289. [Google Scholar] [CrossRef]
  37. Pathirana, S.; Rodrigo, A.; Halwatura, R. Effect of building shape, orientation, window to wall ratios and zones on energy efficiency and thermal comfort of naturally ventilated houses in tropical climate. Int. J. Energy Environ. Eng. 2019, 10, 107–120. [Google Scholar] [CrossRef]
  38. Zhang, X.; Weerasuriya, A.U.; Wang, J.; Li, C.Y.; Chen, Z.; Tse, K.T.; Hang, J. Cross-ventilation of a generic building with various configurations of external and internal openings. Build. Environ. 2022, 207, 108447. [Google Scholar] [CrossRef]
  39. Yoon, N.; Piette, M.A.; Han, J.M.; Wu, W.; Malkawi, A. Optimization of Window Positions for Wind-Driven Natural Ventilation Performance. Energies 2020, 13, 2464. [Google Scholar] [CrossRef]
  40. de Dear, R.; Schiller Brager, G. The adaptive model of thermal comfort and energy conservation in the built environment. Int. J. Biometeorol. 2001, 45, 100–108. [Google Scholar] [CrossRef] [PubMed]
  41. ANSI/ASHRAE Standard 55-2013; Thermal Environmental Conditions for Human Occupancy. American Society of Heating, Refrigerating and Air-conditioning Engineers, Inc.: New York, NY, USA, 2010.
  42. Bienvenido-Huertas, D.; de la Hoz-Torres, M.L.; Aguilar, A.J.; Tejedor, B.; Sánchez-García, D. Holistic overview of natural ventilation and mixed mode in built environment of warm climate zones and hot seasons. Build. Environ. 2023, 245, 110942. [Google Scholar] [CrossRef]
  43. DesignBuilder Software Ltd. DesignBuilder v7. Available online: https://designbuilder.co.uk/download/documents (accessed on 1 November 2021).
  44. Berkeley, L.; Ridge, O.A.K.; Ut-battelle, M.B.Y.; For, A.; Energy, S.; Or, D.; In, T.; Form, A.N.Y.; By, O.R.; Means, A.N.Y.; et al. Application Guide for EMS; U.S. Department of Energy: Washington, DC, USA, 2020.
  45. Schulze, T.; Eicker, U. Controlled natural ventilation for energy efficient buildings. Energy Build. 2013, 56, 221–232. [Google Scholar] [CrossRef]
  46. Kottek, M.; Grieser, J.; Beck, C.; Rudolf, B.; Rubel, F. World map of the Köppen-Geiger climate classification updated. Meteorol. Zeitschrift 2006, 15, 259–263. [Google Scholar] [CrossRef]
  47. U.S. Department of Energy. Engineering Reference—EnergyPlus™ Version 22.1.0 Documentation. 2022. 1774p. Available online: https://energyplus.net/assets/nrel_custom/pdfs/pdfs_v22.1.0/EngineeringReference.pdf (accessed on 1 November 2021).
  48. Department of Energy’s (DOE) Building Technologies Office (BTO). Weather Data Download—Sevilla 083910 (SWEC). 2021. Available online: https://energyplus.net/weather-location/europe_wmo_region_6/ESP/ESP_Sevilla.083910_SWEC (accessed on 1 November 2021).
Figure 1. Main parameters affecting cross ventilation.
Applsci 14 04651 g001
Figure 2. Digital monitoring systems: TEMTOP M2000C 2nd air-quality monitor on the left (a) and the Froggit HP1000 SE wireless meteorological station on the right (b).
Applsci 14 04651 g002
Figure 3. Classroom layout (a) and north 3D axonometric view of classroom (b).
Applsci 14 04651 g003
Figure 4. Opening elevation layout (a) and DesignBuilderTM model 3D view (b).
Applsci 14 04651 g004
Figure 5. SNVP for optimal IAQ during winter season.
Applsci 14 04651 g005
Figure 6. DNVP for optimal IAQ during the winter season.
Applsci 14 04651 g006
Figure 7. CO2 concentration for different WWeqRs with SNVP.
Applsci 14 04651 g007
Figure 8. CO2 concentration for different WWeqRs with DNVP activated.
Applsci 14 04651 g008
Figure 9. CO2 concentration at 0.23% WWeqR for simulation with DNVP vs. SNVP.
Applsci 14 04651 g009
Figure 10. CO2 concentration for different WWeqRs with DNVP on the 18th of November 2021.
Applsci 14 04651 g010
Figure 11. CO2 concentration for different WWeqRs with DNVP on the 26th of November 2021.
Applsci 14 04651 g011
Figure 12. CO2 concentration for 2.16% WWeqR with SNVP on the 17th of December 2021.
Applsci 14 04651 g012
Figure 13. Wind conditions on 18th and 26th of November (a,b) and 17th of December 2021 (c).
Applsci 14 04651 g013
Figure 14. Percentage of time with CO2 under limits described in Section 1 for several standards.
Applsci 14 04651 g014
Figure 15. CO2 concentration and TC for a DNVP with WWeqR from 0.23% to 2.16%.
Applsci 14 04651 g015
Table 1. Most relevant IAQ indicators by standard.
IndicatorProtocol 2EN 16798-1ASHRAE 62.1WELL [30]RITE [29]
CO2800 ppm900 ppm1000 1 ppm900 ppm500 ppm
1 recommend considering assumption [31], 2 hygiene measures against COVID-19 [25].
Table 2. Classroom simulation parameters.
Main ParametersThermal Transmittance
ElementComponentsU (W/(m2K))
Area49.60 m2Roof boardsAsbestos + air cavity3.077
Height2.85 mCeilingConcrete slab1.505
Volume141.36 m3FlooringConcrete slab1.505
Occupancy26 pupils + teacherExternal wall2 brick leaves1.390
Occupancy ratio0428 p/m2OpeningsAluminum frame + 2 panes of glass (3 + 6 + 3)1.960
Area49.60 m2Interior partition2 brick leaves1.425
Table 3. TEMTOP M2000C 2, most relevant specifications.
SpecificationsTEMTOP M2000C 2ndFroggit HP 1000SE PRO
IndoorMeteo stationIndoor sensor
Operation frequency 868 Mhz868 Mhz
Temperature range0–50 °C−40–60 °C,−40–60 °C,
Temperature accuracy±0.3 °C±1 °C±1 °C
Relative humidity range0–90%1–99%1–99%
Relative humidity accuracy±3%±5%±5%
CO2 measuring range400–5000 ppm
CO2 accuracy±40 ppm
Table 4. WWR and WWeqR depending on opening configuration.
Windward/Northeast Windows
59 cm Height × 134 cm Wide
WWeqR 1
as Equation (1)
Leeward/Southwest Windows
105 cm Height × 107.5 cm Wide
Opening ConditionsOpening Conditions
Wide (cm)Wide (%)WWR (%)WWR (%)Wide (%)Wide (cm)
21.5%0.23%0.23%0.54%1.9%2
43.0%0.46%0.45%1.07%3.0%4
86.0%0.92%0.87%2.14%6.0%8
157.5%1.72%1.54%4.02%11.2%15
2211.2%2.53%2.16%5.90%16.4%22
3015.2%3.45%2.80%8.04%22.3%30
5147.7%6.78%4.10%10.99%44.0%41
1 equivalent ratio calculated with Equation (1) considering windows at both sides (wind and lee).
Table 5. Simulation summary of average CO2 concentration in ppm for several WWeqRs.
WWeqRProtocol09:10 09:3009:30 10:0010:00 10:3010:30 11:0011:00 11:3011:30 12:0012:00 12:3012:30 13:0013:00 13:3013:30 14:00Peak
0.23 (%)DNVP608643637641634620485579627640641
* SNVP6231274 *1764 *2063 *2261 *2414 *2136 *1827 *2191 *2416 *2416 *
0.45 (%)DNVP599642632628630632477581632642642
* SNVP6131180 *1532 *1707 *1807 *1880 *1539 *1236 *1618 *1813 *1880 *
0.87 (%)DNVP593652645647644642427573644649649
* SNVP5961037 *1229 *1292 *1320 *1340 *984 *790 *1173 *1302 *1340 *
1.54 (%)DNVP565653667680668662431574636636680
* SNVP569861 *927 *937 *940 *943 *641 *602 *893 *937 *940 *
2.16 (%)DNVP543729750752755757469544745757757
SNVP547749773774774774525551758771774
4.10 (%)DNVP-----------
SNVP544544544544544544481418532544544
The results of CO2 concentration are grouped by a set of rows for the same WWeqR. Each column describes a 30 min time frame to show the average CO2 concentration simulated every 30 min period. Values over the 800 ppm CO2 limit are shown in red *.
Table 6. Monitorization summary of average CO2 concentration in ppm for several WWeqRs.
WWeqRProtocol09:10 09:3009:30 10:0010:00 10:3010:30 11:0011:00 11:3011:30 12:0012:00 12:3012:30 13:0013:00 13:3013:30 14:00Peak
0.23–1.07
18th-Nov.
DNVP964 *880 *1106 *5701139 *1201 *607666896 *915 *1201 *
1.07–1.82
26th-Nov.
DNVP880 *1114 *839 *538562888 *655767877 *912 *1114 *
2.16
17th-Dec.
DNVP529503652684661603552588787711787
Disclaimer/Publisher’s Note: The statements, opinions and data contained in all publications are solely those of the individual author(s) and contributor(s) and not of MDPI and/or the editor(s). MDPI and/or the editor(s) disclaim responsibility for any injury to people or property resulting from any ideas, methods, instructions or products referred to in the content.

