Article

Optimal Design of an Ecofriendly Pickup Truck Overhang and Roof to Reduce the Drag Coefficient

by
Min Seok Kim
1,
Yein Bang
1,
Jongwon Kim
2 and
Taek Keun Kim
1,*
1
Department of Mechatronics Engineering, Korea University of Technology and Education, Cheonan-si 31253, Republic of Korea
2
Department of Electromechanical Convergence Engineering, Korea University of Technology and Education, Cheonan-si 31253, Republic of Korea
*
Author to whom correspondence should be addressed.
Appl. Sci. 2024, 14(11), 4667; https://doi.org/10.3390/app14114667
Submission received: 9 March 2024 / Revised: 13 May 2024 / Accepted: 17 May 2024 / Published: 29 May 2024

Abstract

:
Until now, various studies have been conducted on the drag coefficient of pickup trucks, but little research has been conducted on the effect of the front overhang length and roof design on the drag coefficient. In this study, the flow characteristics and drag coefficients of 54 models with different front overhang lengths, roof angles, and angular positions were compared using a computational fluid dynamics code to reduce the drag coefficient of an eco-friendly pickup truck. Reducing the aerodynamic drag of electric vehicles can improve battery utilization and improve the overall performance of the powertrain, so it is important to analyze and optimize geometric design steps to improve drag reduction strategies. The three-dimensional steady-state analysis model used in this study was verified by comparing the model results with experimental values reported in previous studies. In addition, the impacts of four factors on the drag coefficient were analyzed to develop an optimal design that takes into account smaller and better characteristics. The drag coefficient was reduced by 10.3% compared to that of the base model. Based on the numerical analysis of all models to be applied to pickup truck design, a correlation of the drag coefficient with the shape was proposed, showing a low error range of +1.9% to −1.74%.

1. Introduction

The emission of soot from vehicles with internal combustion engines and air pollutants discharged from industrial complexes have accelerated global warming. Regulations have been implemented worldwide to prevent environmental pollution, resulting in changes in various industries. The most dramatic change occurred in the automobile industry, where internal combustion engine vehicles have been replaced with ecofriendly vehicles that use batteries. Although internal combustion engine vehicles are dominantly used in many countries, some have gradually increased their proportions of ecofriendly vehicles, such as electric and hybrid vehicles, to respond to climate change.
Many companies have introduced various ecofriendly vehicles to meet national environmental regulations. Because internal combustion engines have been replaced by batteries in vehicles, the size of the engine room has been gradually decreasing. This has also changed the front overhang length, which is the horizontal distance from the front end of a vehicle to the center of the front wheel, thereby increasing the design freedom of ecofriendly vehicles. Increased design freedom allows automobile manufacturers to improve the fuel economy with diverse geometries.
The drag coefficient generally ranges from 0.3 to 0.35 for sedans and from 0.41 to 0.44 for sports utility vehicles (SUVs). It ranges from 0.46 to 0.49 for pickup trucks, which is higher than that of other types of vehicles [1,2]. A high drag coefficient decreases the fuel economy by increasing the power consumption of the vehicle, indicating the need for aerodynamic performance improvement [3]. Various studies have been conducted to reduce the power consumption of pickup trucks.
The analysis of the flow field of a pickup truck is difficult because of the open bed behind the cabin. Therefore, Al-Garni et al. [4] presented the experimental data of the flow near the wake of a pickup truck. They reported a recirculating flow region on the bed but none on the top of the tailgate. Mukda [5] compared the drag coefficients of six shapes of pickup trucks through experiments and computational fluid dynamics (CFD). It was found that the drag coefficient was the lowest for the sedan-type truck and highest for the SUV-type truck. Owing to the square-shaped accessories of the bed, the drag coefficient of the SUV-type truck was twice as high as that of the sedan-type truck. The open bed behind the cabin of a pickup truck makes the flow field more complex than that of conventional vehicles. This is because the wake zone changes depending on the bed geometry. Previous studies found that the bed geometry, such as the length and height of the open bed, affects the drag coefficient and confirmed that the height of the bed is a dominant factor for the size of the wake zone [6,7]. Unlike an open bed, a closed bed allows the streamline to fall smoothly behind the vehicle. In this case, the size of the wake zone decreases, making it possible to obtain a lower drag coefficient than in the case of the open bed.
Flaps are devices used to reduce drag. Tian et al. [8] added two types of flaps with various angles at the four corners of the 25 °   a n d   35 ° slopes of the standard Ahmed model, thereby reducing the drag by up to 21.2% through changes in the wake. Altaf et al. [9] researched the optimal angles and lengths of the rectangular, elliptical, and triangular flaps in bluff body models similar to square-back road vehicles such as trucks and buses, rather than the streamlined form. The maximum drag reduction rate of 11% was observed when the elliptical flap had an angle of 50 ° . Ha et al. [10] attached a flap near the rear edge of the cabin roof such that the bed flow could be directed toward the tailgate. The drag coefficient decreased as the downward angle and length of the flap increased, even though the backflow increased in the wake zone. However, when the downward angle exceeded a certain value, the drag coefficient tended to increase. Therefore, it is important to determine the optimal flap conditions. The wake behind a vehicle varies depending on the angle, length, and geometry of the flap, which affects the pressure difference between the front and rear of the vehicle. Ahmed et al. [11] used a simplified model and experimentally analyzed the influence of the wake on it by varying the back-slant angle for various speed ranges.
The flow characteristics of a pickup truck vary depending on the geometry of the cabin as well as that of the bed. Ait et al. [12] investigated the changes in the drag coefficient when cabin bumps were installed at the rear end of the cabin roof. They applied various optimization methods to determine the number and size of bumps that could most significantly reduce the drag coefficient. They achieved a reduction of 6–10% in the drag coefficient. Markina et al. [13] installed cab fairing and cab-side extenders on the cabin of a large truck and investigated the fuel reduction rate according to the aerodynamic resistance. The fuel consumption decreased by 4.4% at a driving speed of 100 km/h and by 9.31% at 90 km/h. Kim et al. [14] observed the flow when the roof of the pickup truck was installed at an angle. They called this model a tapered cab roof, which decreased the drag of the vehicle by making the flow separation point different from that of the basic model. Compared with the basic model, the drag was reduced by 4.37% at 30 mph, 13.19% at 50 mph, and 14.35% at 70 mph.
Lietz et al. [15] compared the drag coefficient according to various external shapes, such as side mirrors, underbody shields, and spoilers of sedans, SUVs, and trucks, and Paul et al. [16] studied drag reduction in passenger cars. The effects of the vane-type vortex generator array and the rear spoiler on the trunk were analyzed through experiments and CFD, and the optimal conditions that minimized the drag coefficient were found.
Ildarkhanov and Radik [17] proposed a formula for the annual fuel consumption of trucks considering various technical variables, including the drag coefficient, and Yuan, Xinmei et al. [18] conducted a comparison of mileage according to the rolling coefficient, battery energy density, and drag area and analyzed the resulting CO2 emissions.
Various studies on the geometry of pickup trucks have been conducted to reduce the drag coefficient, which significantly affects the mileage. However, most of the reported designs involve an increase in the production cost owing to changes in the bed geometry or the entire pickup truck geometry. Table 1 is a past paper on the drag coefficient of pickup trucks.

2. Methodology

The influence of the roof geometry and change in the front overhang length caused by a battery-based drive system on the flow field of a vehicle has hardly been researched. Numerical analysis was used to investigate the flow and drag coefficient for different roof geometries and front overhang lengths. To verify the analytical model, the results were compared with experimental data. In addition, after identifying the decreasing tendency of the drag coefficient according to the geometric conditions, a correlation for the drag was suggested using the geometric parameters utilized in the research. This equation makes it possible to derive the drag coefficient of the pickup trucks considered in this study without conducting additional experiments or numerical analyses. Based on the variation in the drag coefficient according to the shape, the specific conditions that could reduce the drag coefficient were selected.

3. Numerical Analysis

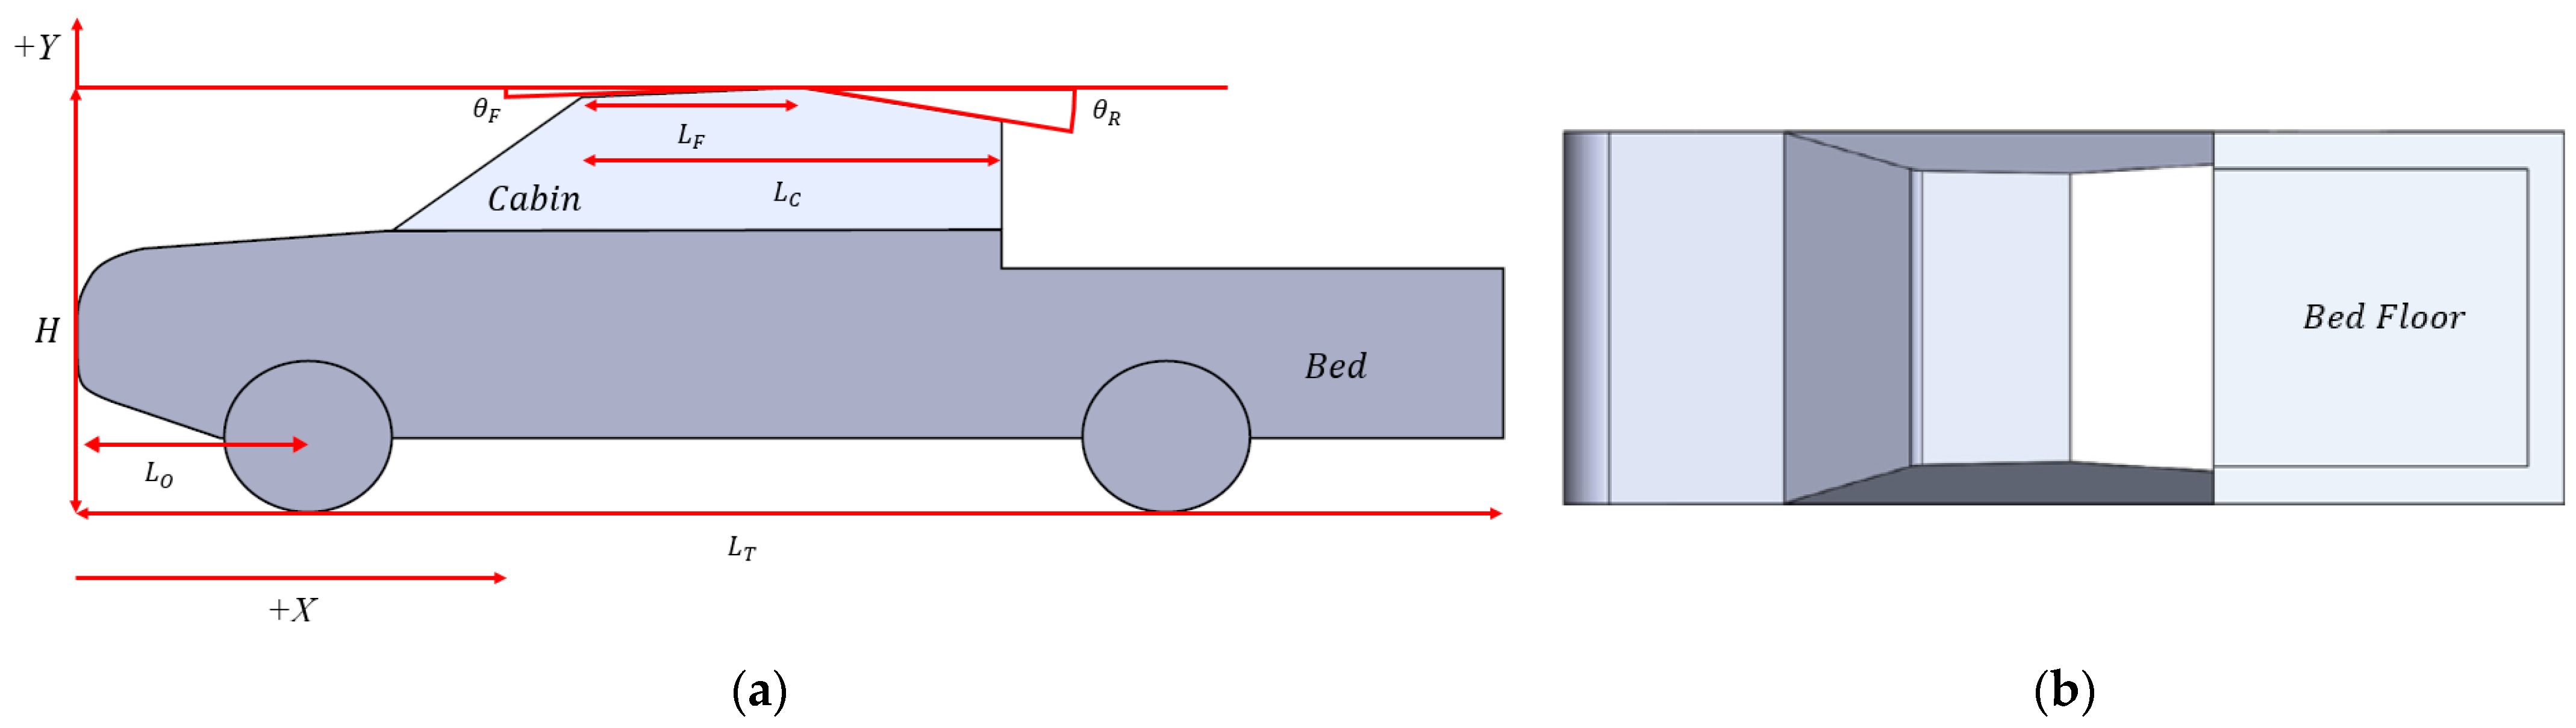
3.1. CAD Geometry of a Pickup Truck

Figure 1 shows the overall geometry of the pickup truck used in this study. The pickup truck consisted of a cabin, bed floor, sidewalls, and tailgate. The scale was one-tenth that of an actual commercial vehicle. Unnecessary parts such as side-view mirrors were excluded from the modeling to investigate the flow characteristics of the roof and overhang length of the pickup truck, and the geometry was simplified as much as possible.
The reason for specifying the parameters is that research on the drag coefficient of pickup trucks has mainly focused on the bed. In the case of electric pickup trucks, there is no need for an engine room, which increases freedom in the design of the cabin geometry. The parameters were chosen because the design of the cabin is mainly influenced by the overhang and roof. Six factors ( L T , L O , L C , L F , θ F ,   a n d   θ R ) were considered in this study. Four of these are related to the length, and two are related to the angle. Two factors ( L T   a n d   L O ) were used to analyze the flow characteristics of the total vehicle length and front overhang length. L T represents the total vehicle length from the starting point of the engine room to the endpoint of the bed, including the tailgate. L O is the front overhang length, which represents the distance from the starting point of the engine room to the center of the front wheel. Four factors ( L C , L F , θ F ,   a n d   θ R ) were used to analyze the flow characteristics of the pickup truck roof. L C is the length from the starting point to the endpoint of the cabin roof. L F is the distance from the starting point of the cabin roof to the position at which the angle changes. θ F is the front angle of the roof, and θ R is the rear angle of the roof. X is the distance from the front of the vehicle, and Y is the height from the bottom of the vehicle. This is used for non-dimensionalization. Table 2 lists the conditions for these six factors. All length-related conditions were dimensionless. Table 3 lists 54 cases obtained by combining the conditions in Table 2. Three cases with overlapping factors were excluded; therefore, the drag coefficient was derived for 51 cases.
To minimize the drag according to the front overhang and roof conditions of the pickup truck, the drag coefficient, which is the derived objective function, was defined as shown in (1). F D is the drag force exerted on the pickup truck by the working fluid. The ρ is the density, and U is the freestream velocity of the working fluid. A is the projected area of the pickup truck in the main flow direction.
C D = F D 0.5 ρ A U 2

3.2. CFD Simulation

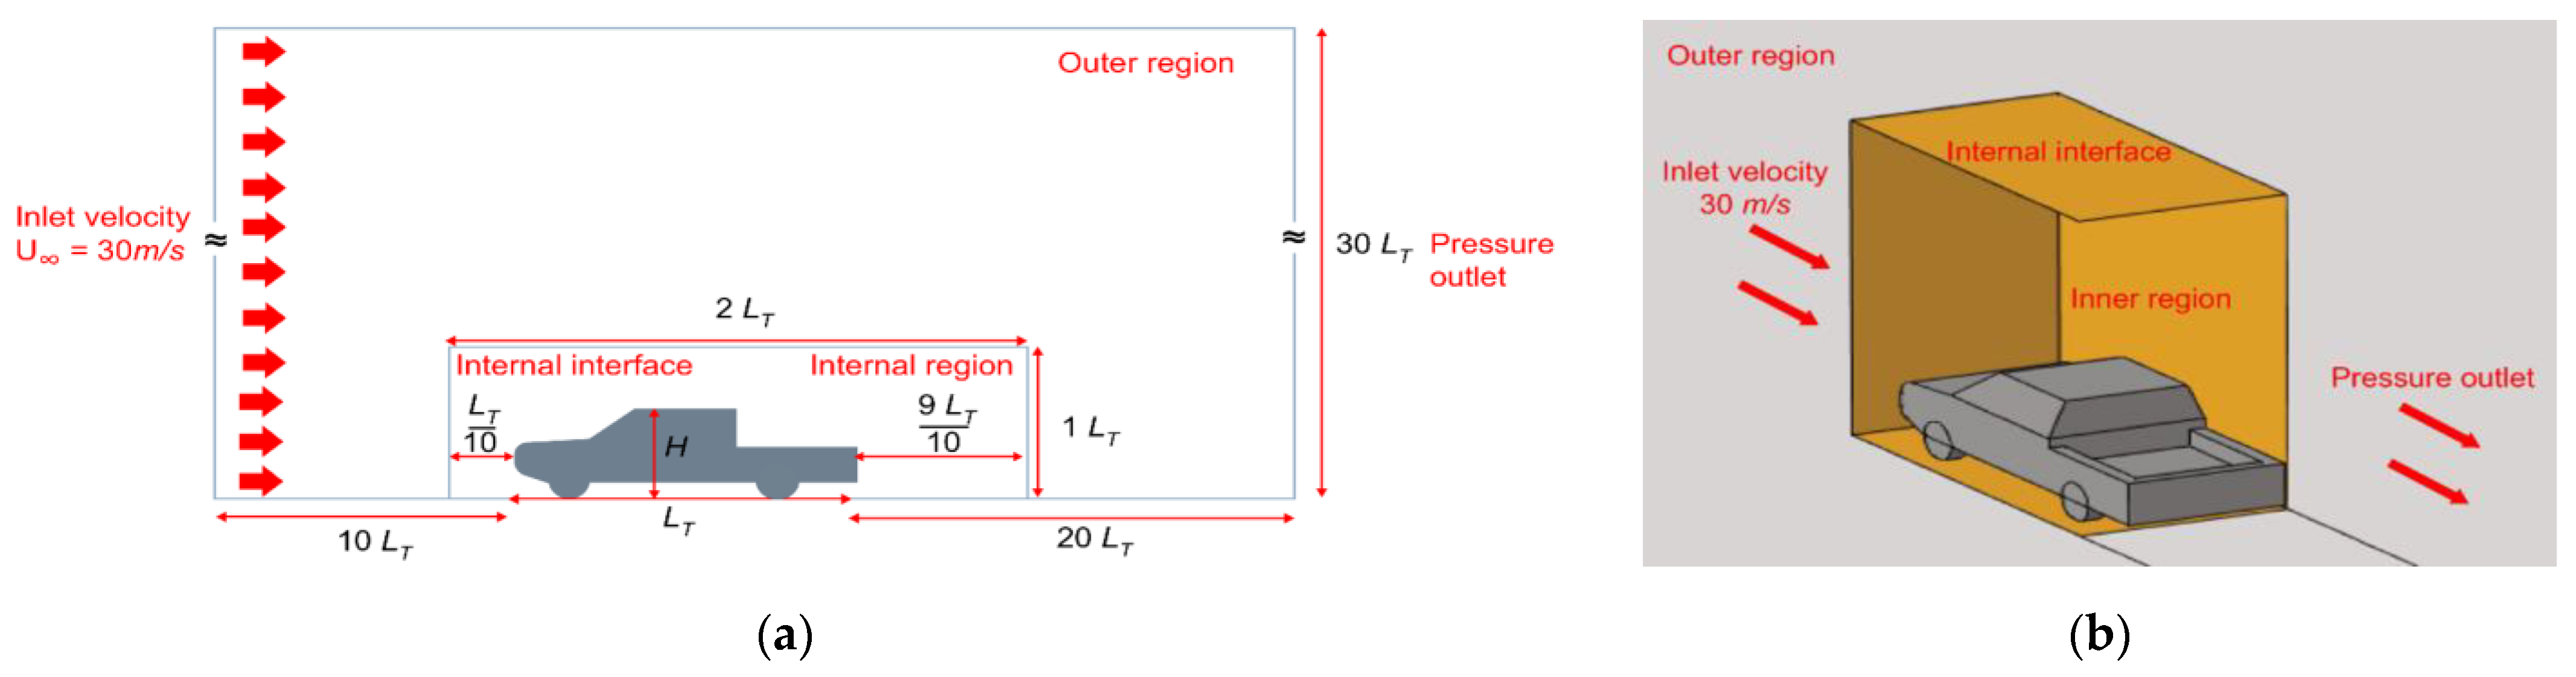
3.2.1. Boundary Conditions

Figure 2 shows the domain conditions used for STAR-CCM+ 11.06. The inlet condition is that of the vehicle traveling at a high speed, and the inlet velocity is 30 m/s. The outlet condition is in terms of the outlet pressure, and the external pressure is 0 Pa. Air at 300 K and 1 atm was used as the working fluid. The density of air is 1.18 k m / m 3 , and the coefficient of kinematic viscosity is 1.855 ×   10 5 Pa∙s.
A no-slip condition was set for the wall in contact with the fluid, and the external flow area was set to 30 times the vehicle length to minimize the effect of the fully developed area on the flow around the vehicle. The interface between the outer and inner regions was designed to allow the fluid to flow by imposing an internal interface condition. To obtain accurate results while minimizing the number of grid cells used for numerical analysis, the outer and inner regions were separately constructed under different grid conditions. The grid size of the outer region was set to 150 mm, that of the inner region was set to 3 mm, and that of the vehicle was set to 2 mm.

3.2.2. Turbulence Model

In this study, a three-dimensional steady-state and incompressible flow was assumed for numerical analysis. In addition, temperature change was not considered when examining the drag and flow distributions. The shear stress transport (SST) k ω turbulence model of Menter [19] was used for the turbulence model. The S S T   k ω turbulence model is not related to the freestream value, shows good agreement with experimental data on adverse pressure gradient boundary layer flows, and combines the benefits of the k ε turbulence model and k ω turbulence model (Mohamed et al. [20]). Bardina et al. [21] found that the S S T   k ω turbulence model has higher accuracy than the k ω ,   k ε ,   a n d   S A turbulence models when separation occurs in an adverse pressure gradient flow. Therefore, the S S T   k ω turbulence model was applied in this study. The experimental results of Ha et al. [7] and the S S T   k ω results are listed in Table 4 for comparison.
It can be seen that the S S T   k ω turbulence model had lower experimental values and error.

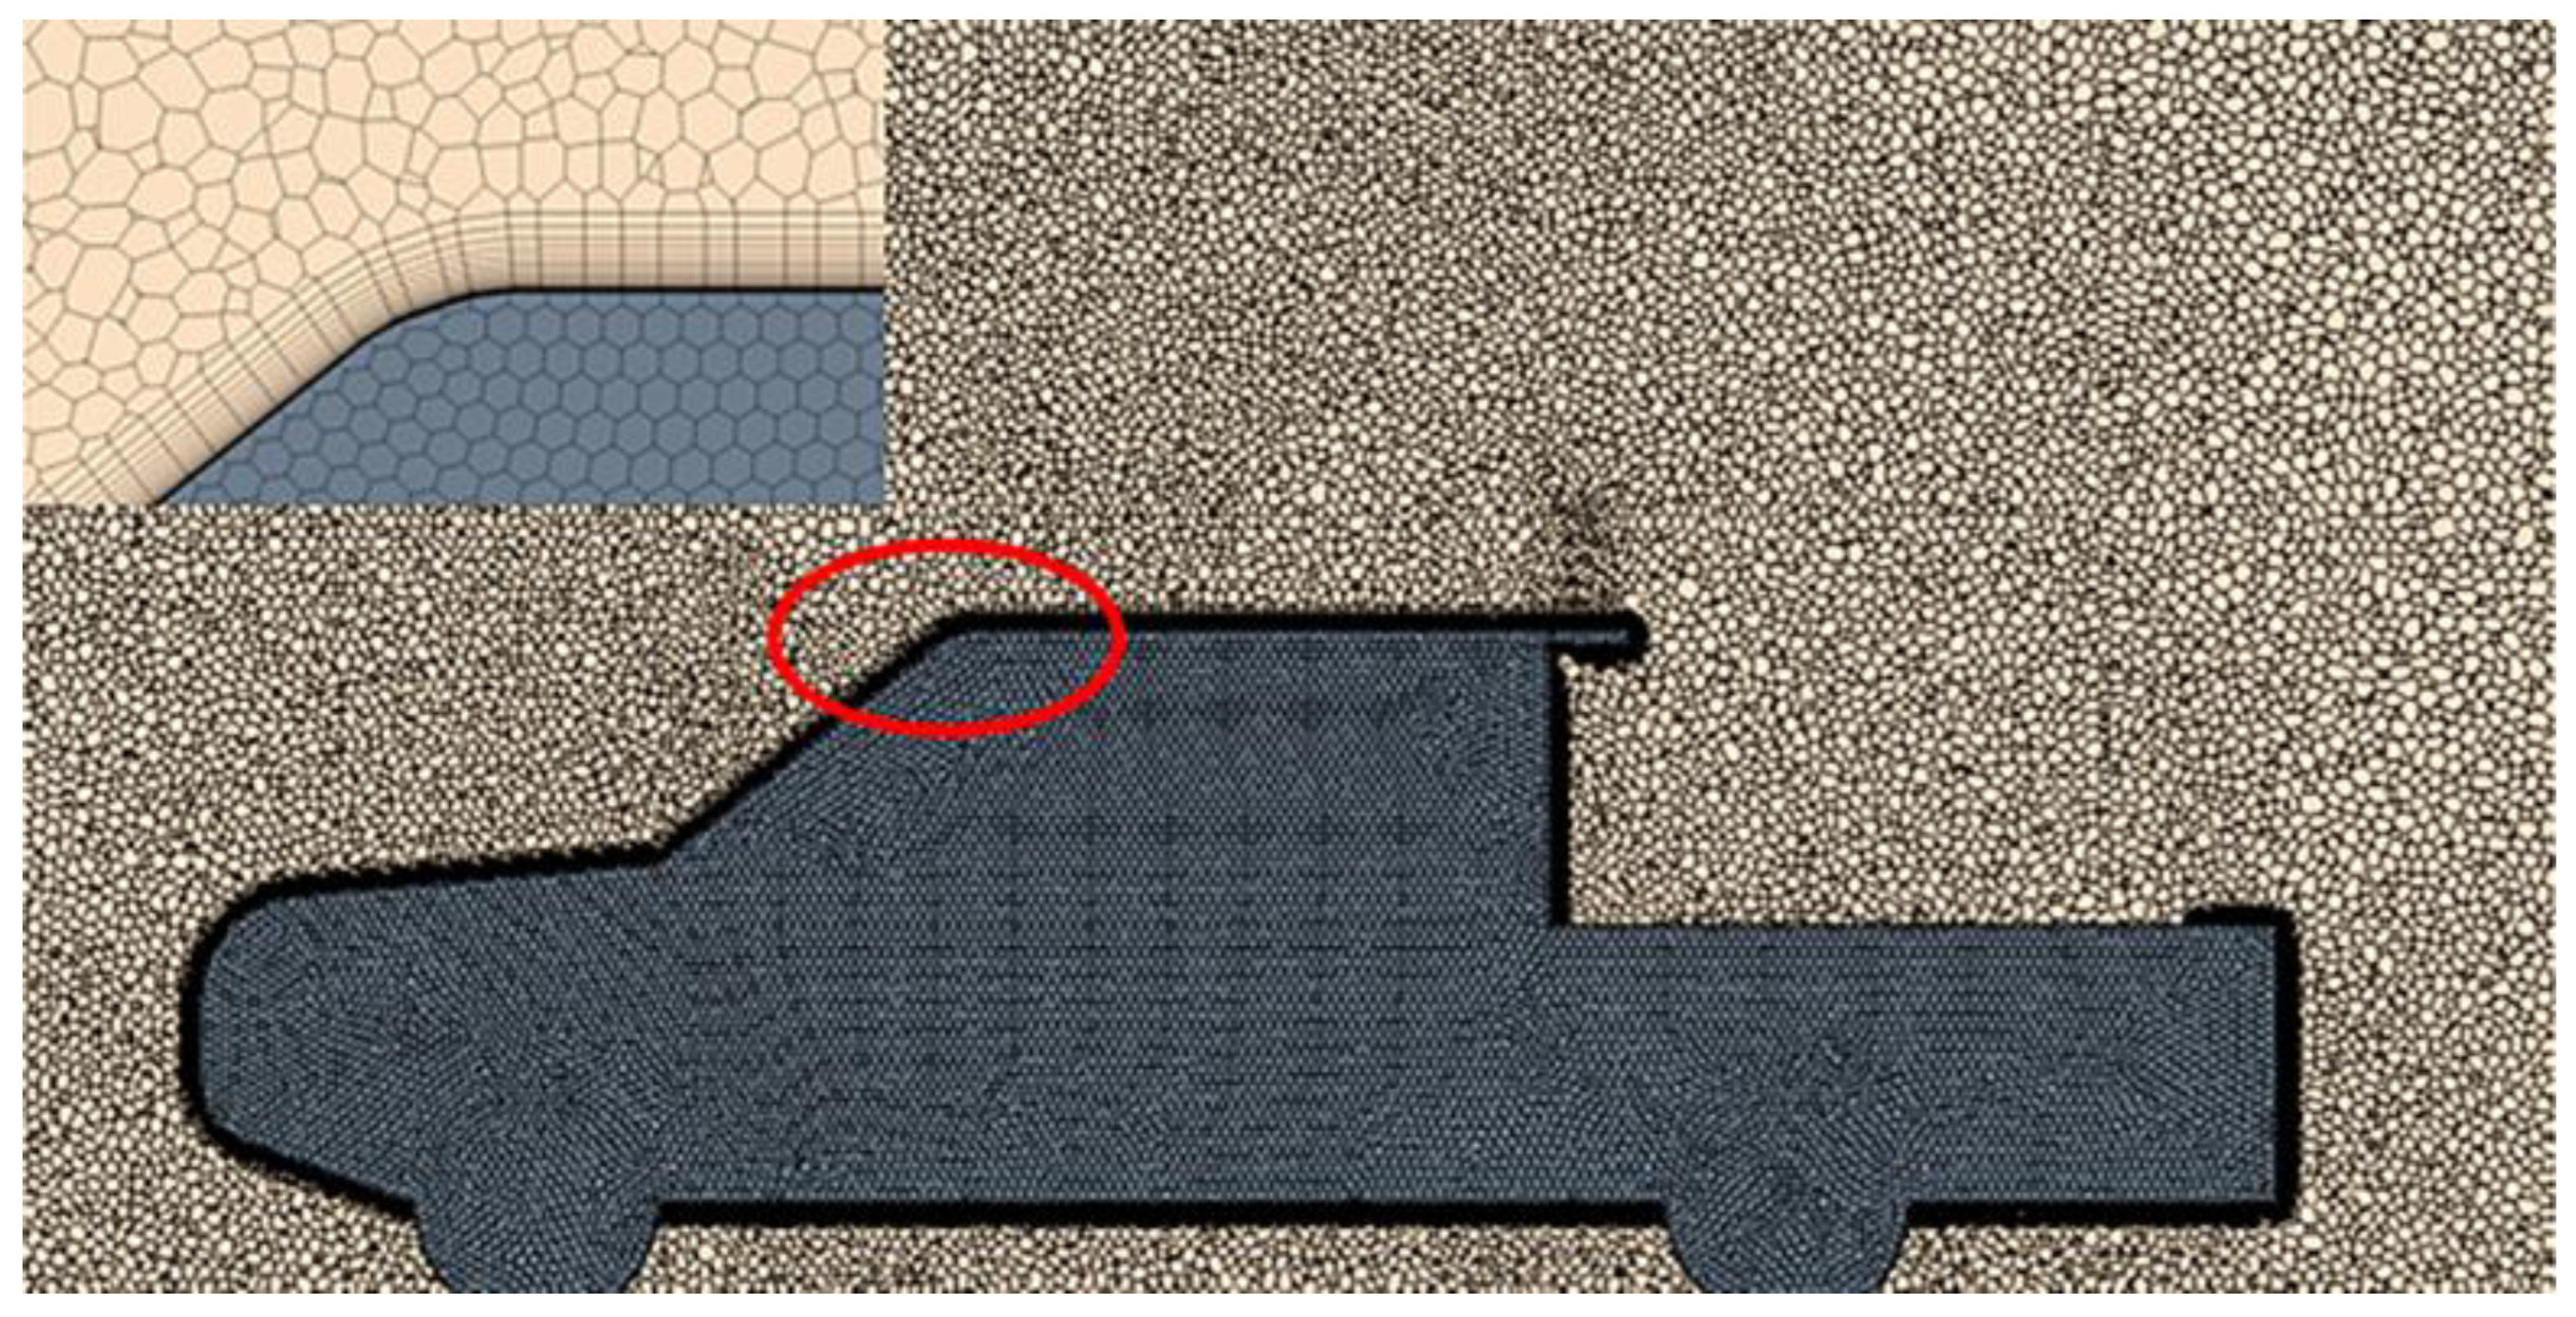
3.2.3. Grid Independence

A grid-independence test was conducted to determine the optimal grid conditions for the simulation. Polyhedral elements were used for the grid. Ibraheem [22] observed the characteristics of hexahedral, tetrahedral, and polyhedral elements and found that the numerical analysis of polyhedral elements requires less time. Moreover, they can achieve highly accurate results in addition to requiring fewer resources for calculation and improving the mesh quality.
Figure 3 shows the grid of the inner region and prism layer at the interface between the solid and fluid regions. This is a cross-sectional cut at the middle of the three-dimensional (3D) geometry of the vehicle. When the fluid meets the vehicle surface, it either flows along the solid surface or collides with the surface, depending on the flow angle. The prism layer condition was applied to obtain accurate results for the velocity gradient at the boundary layer. The prism layer had an initial thickness of 0.0267 mm and was set to grow at the rate of 1.2. In total, 20 layers were created.
Figure 4 shows the results of the grid-independence test, in which the convergence of the drag coefficient was examined according to the number of grid cells to determine the optimal number of grid cells for the numerical analysis. The drag coefficient distribution was examined for the geometry of the base model when the number of grid cells was increased from 6 million to 17 million. The drag coefficient tended to decrease under the second grid condition and almost converged under the third grid condition. From the fourth condition onward, the computation time increased due to the unnecessarily large number of grid cells. Therefore, a numerical analysis was conducted for all models using the third grid condition (15 million cells).

4. Results

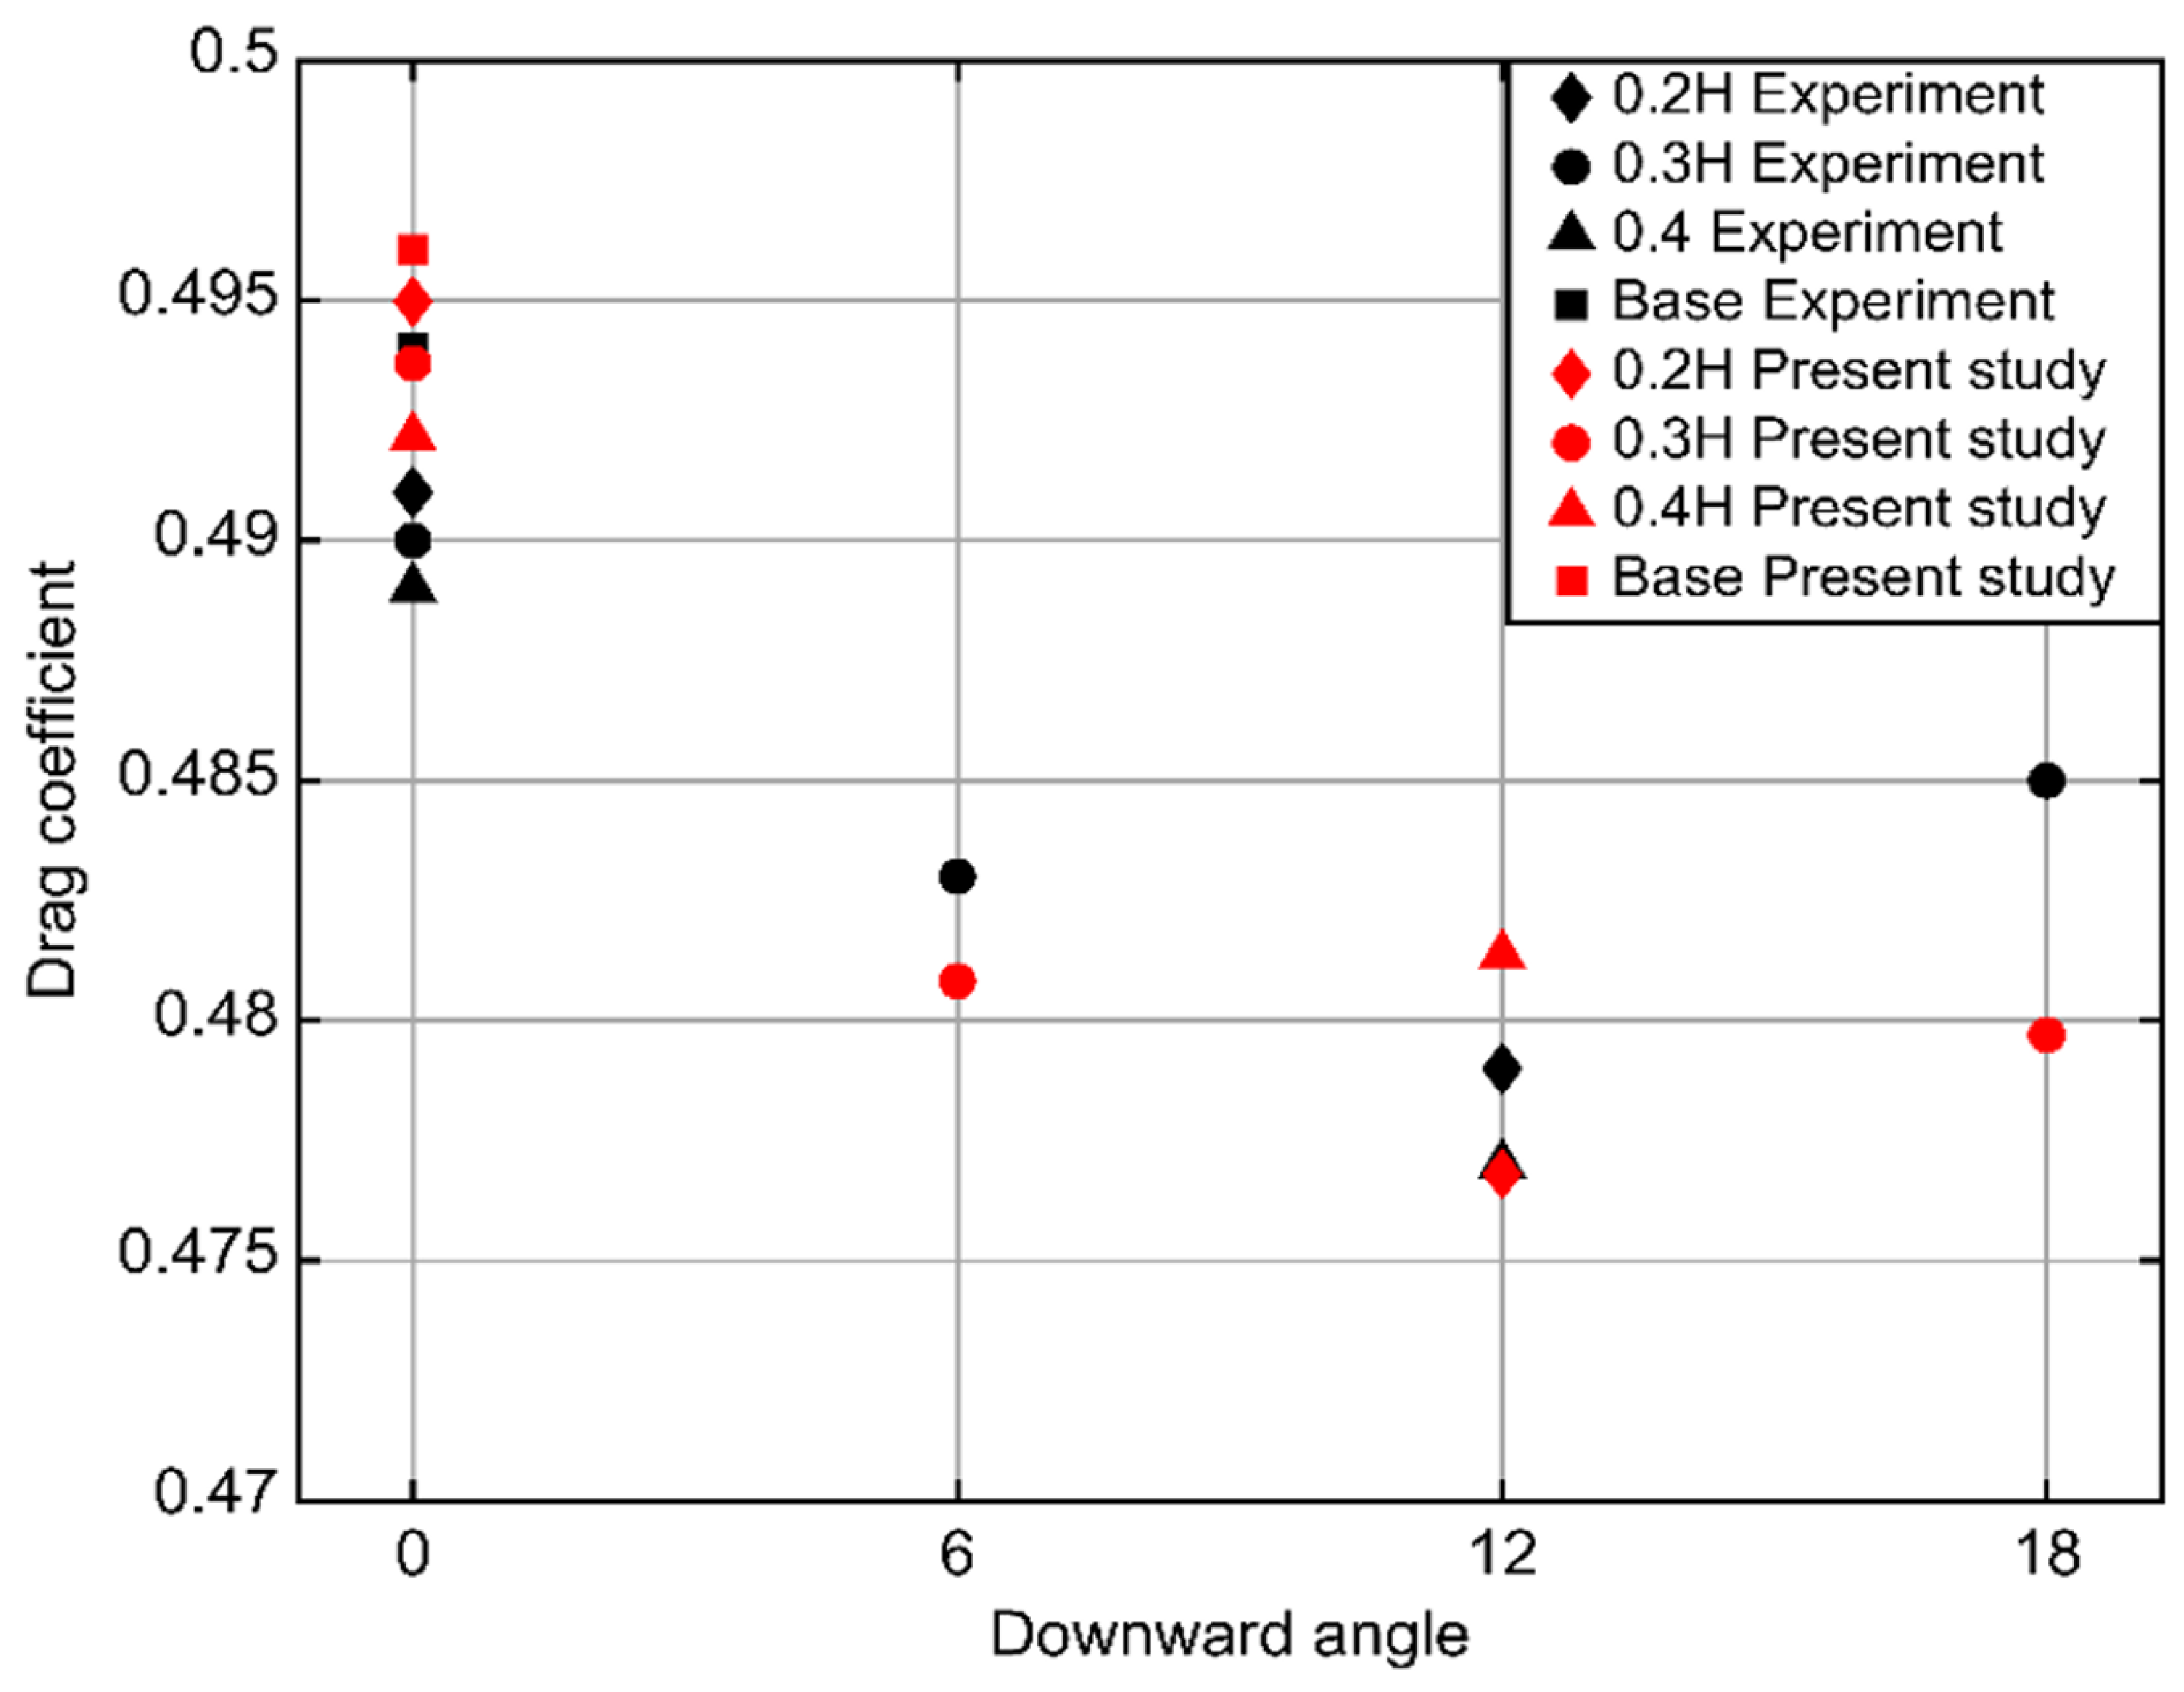
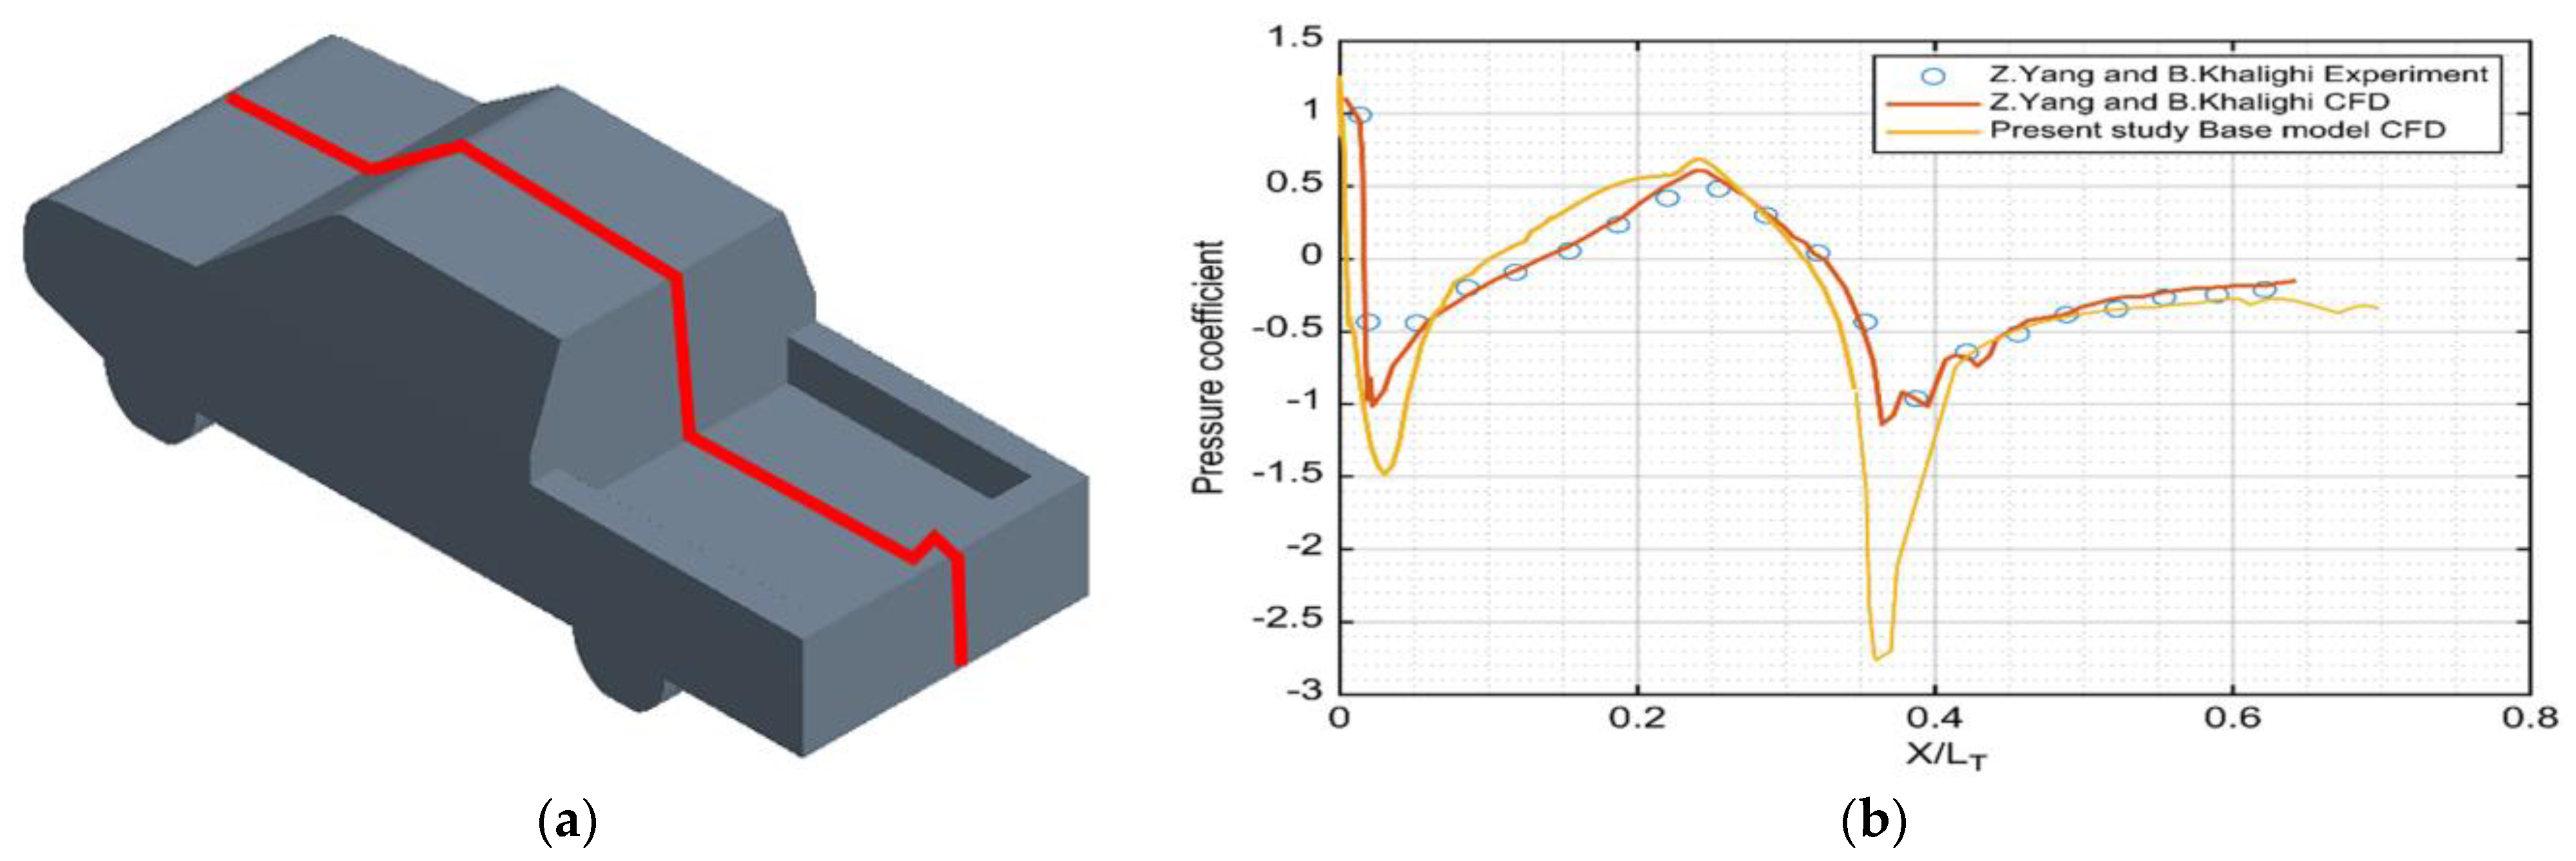
4.1. Validation of the Drag Coefficient

To verify the validity of the simulation model, the drag coefficient ( C D ) was compared with the wind tunnel test results of Ha et al. [7]. They installed a rear flap on a pickup truck and derived the drag reduction by conducting a wind tunnel test and numerical analysis. Figure 5 shows a comparison of the experimental values with the drag coefficient of the simulation model used in this study. ‘H’ is the flap length, and the downward angle on the x-axis represents the inclined angle of the rear flap. The y-axis represents the drag coefficient. The black symbols are the experimental values, whereas the red symbols are the results of the simulation model used in this study. The error was less than 1% in all cases, except for the case in which the length of the rear flap was 0.3H and the downward angle was 18 ° , indicating the validity of the simulation model.
The trends of the pressure coefficient ( C P ) of the pickup truck in a symmetric plane and drag coefficient were analyzed. The pressure coefficient is defined in (2), where p is the pressure and p is the pressure in the freestream area.
C p = p p 0.5 ρ A U 2
The pressure coefficient of the base model used in this study and the drag coefficient were compared with the experimental values and numerical analysis results of Yang and Khalighi [3] to examine their tendencies. The top and bottom sections were separately compared. The pressure coefficient for the top section of the pickup truck is shown in Figure 6, and that for the bottom section is shown in Figure 7. On the horizontal axis, the distance from the stagnation point was nondimensionalized by dividing it by the total vehicle length, and the vertical axis represents the pressure coefficient. The comparison results showed that the overall tendencies were similar; however, there were jagged areas in the top and bottom sections of the base model. The areas that showed significant differences in the pressure coefficient were positions where the behavior of the fluid changed sharply owing to a fillet in the modeling or a change in the angle, such as that at the joint between the bumper and bonnet of the vehicle and the joint between the windshield and roof. In such areas, a significant difference in the pressure coefficient occurred because of the difference in geometry between the base model and the model of Yang and Khalighi [3]; however, the overall tendencies of the pressure coefficient were almost identical, thereby establishing the validity of the analysis model.

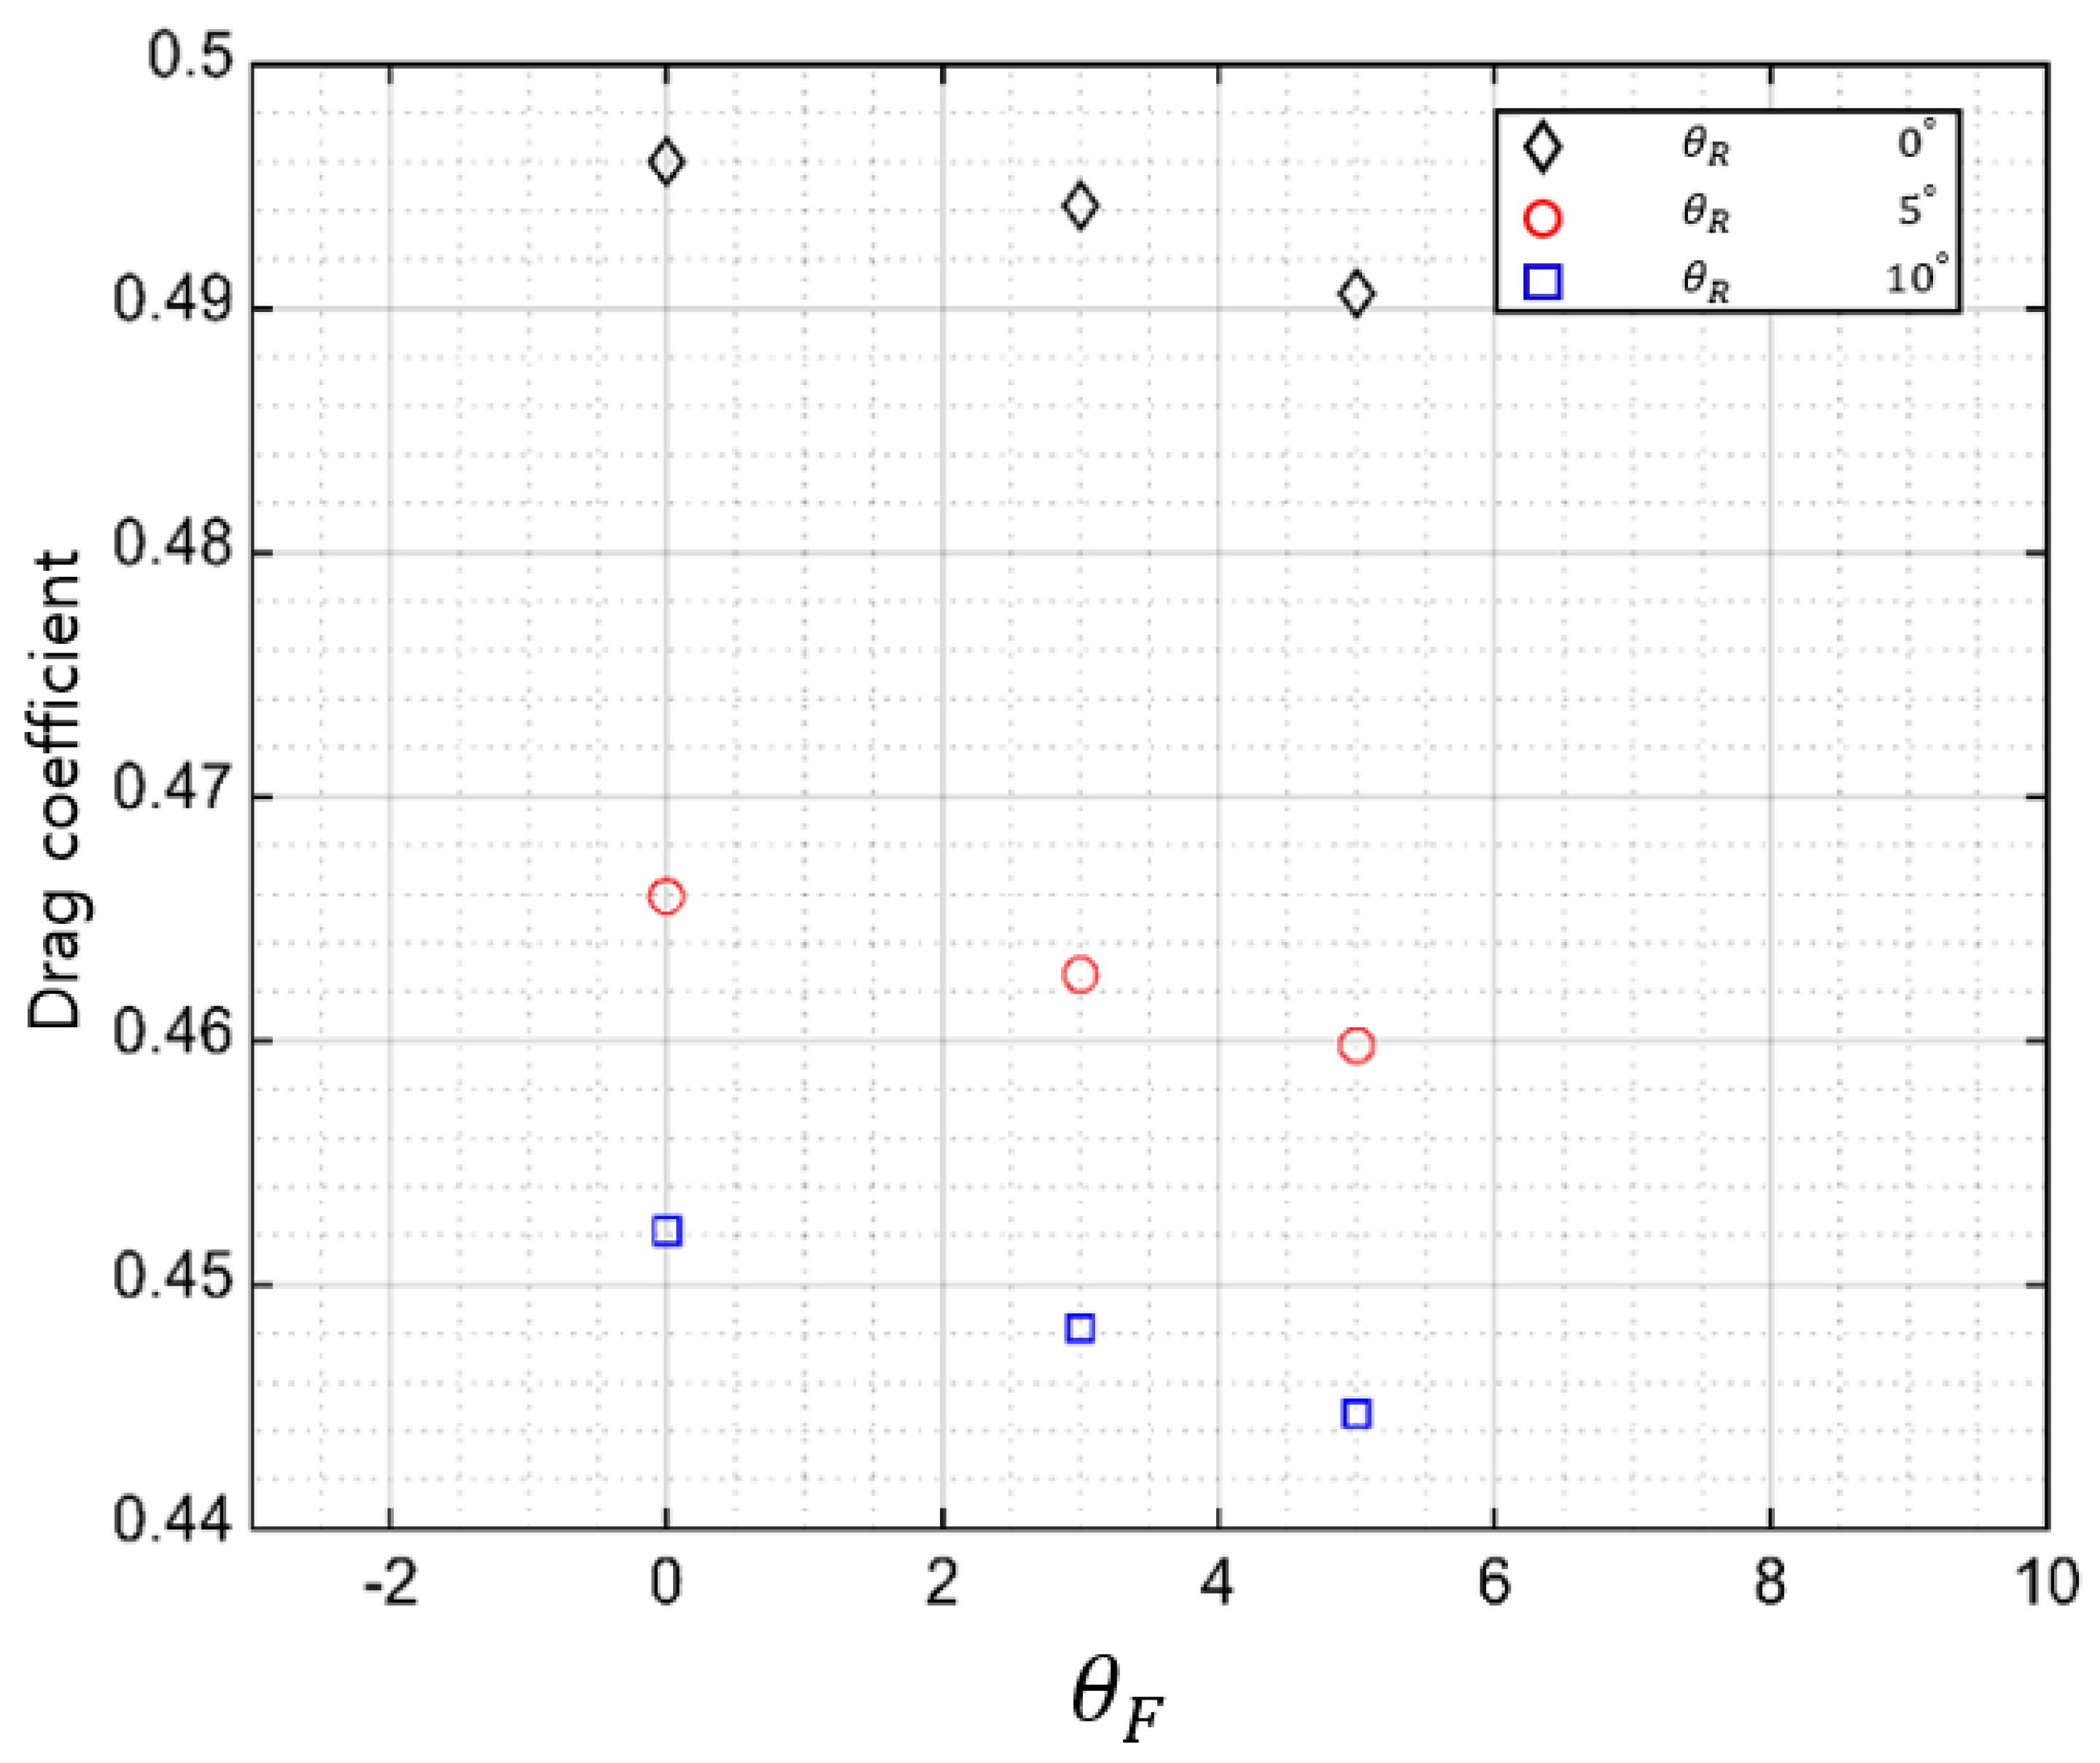
4.2. Flow Characteristics According to the Front Angle

The influence of the change in the front angle of the roof on the drag coefficient was analyzed. For the analysis, the front angle was changed to 0°, 3°, and 5°, whereas the other conditions ( L O L T , L F L C , and rear angle) remained the same.
Figure 8 shows the drag coefficient distribution when the front angle was increased from 0° to 3° and 5° at the rear angles of 0°, 5°, and 10°. As the front angle increases, the drag coefficient shows a tendency to decrease. In addition, as the rear angle increases, the drag coefficient decreases further. Regardless of the front angle, there was no significant change in the wake zone of the vehicle, and only slight changes in the flow field above the roof were observed. Figure 9 shows the velocity profile in the height direction at the joint between the windshield and roof for the base model, 1-3 model, and 1-6 model with a rear angle of 0°. Each axis was nondimensionalized using the vehicle height (H) and freestream velocity ( U ). When the maximum velocity of each model was compared with that of the base model, the maximum velocity of the 1-6 model was found to be 1.92% higher at the same Y position. As the velocity increased, the flow separation point moved further toward the rear section when compared with the trend of the base model because the momentum significantly affects the movement of the fluid. This decreased the drag force on the vehicle by reducing the wake zone size. In addition, an increase in the front angle can reduce the flow resistance caused by the geometry because the windshield and roof of the vehicle are connected smoothly.

4.3. Flow Characteristics According to the Rear Angle

Figure 10 shows the drag coefficient distribution when the rear angle was increased from 0° to 5° and 10°, whereas the other conditions remained the same. Compared with the base model, the drag coefficient decreased by 6% for the 1-1 model with a rear angle of 5° and by 8.8% for the 1-2 model with a rear angle of 10°. Under identical geometric and angle conditions, the drag reduction effect for the 1-6 and 1-1 models, which differ only by the position of the angle (the front angle or rear angle), was found to be larger when the roof had a rear angle oriented toward the bed.
Figure 11 shows the velocity contour according to the rear angle. When the behavior of the fluid was examined for the base model (a) and 1-2 model (c), it was found that the fluid that separated from the cabin flowed toward the tailgate instead of moving in the main flow direction under the effect of the rear angle. In this case, the air stagnation zone in the bed of the pickup truck was larger than that in the base model. The stagnation zone reduced the size of the wake zone above the bed, thereby allowing the fluid to flow in a more stable manner. Therefore, the flow passing over the bed became more streamlined.
Figure 12 shows the velocity contour in the wake zone behind the vehicle. Because the wake zone was recovered at the position of x L T = 1.2 , the change in the wake zone was best observed at x L T = 1.1 . Therefore, the velocity contours in the plane section at x L T = 1.1 were compared. The wake zone of the 1-2 model was found to be recovered in a more stable manner when compared with those of the base and 1-1 models. This indicates that it is necessary to change the rear angle rather than the front angle to reduce the vehicle drag. The flow stagnation in the bed can be effectively controlled by appropriately adjusting the tailgate height and rear angle, which can significantly contribute to a reduction in the drag coefficient by directly affecting the wake zone behind the vehicle.

4.4. Flow Characteristics According to the Angle Position

Figure 13 shows the characteristics according to the angle position with a comparison of the drag coefficients at different positions where the roof angle changes. An additional model was introduced to closely observe the change in flow according to the angle position. The additional model, 2-2 model, and 2-10 model had the same overhang length, front angle, and rear angle. The angle position, however, was the 1/3 point from the front for the additional model, the center of the roof for the 2-2 model, and the 2/3 point from the front for the 2-10 model. Compared with the additional model, the drag coefficient increased by 1.4% for the 2-2 model and by 3.5% for the 2-10 model. The drag coefficient of the model tended to be smaller when the angle position was closer to the front.
In general, when a separation point exists in the rear part of the geometry, the drag tends to decrease further owing to an adverse pressure gradient behind the geometry. However, the above drag coefficient values showed opposite results due to the influence of the momentum caused by the velocity. Figure 14 shows the velocity profile in the Y-direction at the angle position. Among the models compared, the additional model showed the highest maximum velocity at the same Y position, followed by the 2-2 and 2-10 models. In terms of geometry, the 2-10 model had the flow separation point at the 2/3 point of the roof but exhibited a smaller momentum than the additional model. Therefore, when the angular position is in the front part of the roof, the increase in momentum caused by the velocity has a greater influence on the drag than the position of the separation point.

4.5. Flow Characteristics According to the Overhang Length

Figure 15 shows a comparison of the drag coefficient when the overhang length changes under the conditions of the same angle position, front angle, and rear angle. For the 2-1 and 3-1 models, only the front overhang length differed under the same roof conditions and engine room geometry. Compared with the base model, the drag coefficient increased by 0.82% for the 2-1 model and by 1.79% for the 3-1 model. This indicates that the drag of the pickup truck increases as the front overhang length decreases.
Figure 16 shows the velocity contour according to the front overhang length. The vector scene shows that there was no difference between the three models at the stagnation point near the bumper. As the front overhang length increases, as in the base model, the fluid heads toward the windshield in a stable manner along a sufficiently long bonnet. In this case, a small wake zone is generated at the joint between the bonnet and the windshield. If the front overhang length is short, as in the 3-1 model, the stabilization section is insufficient when the fluid that is separated at the front end of the bumper flows along the bonnet. The generated unstable flow created a large recirculation area at the joint. As the front overhang length decreased, the size of the recirculation area above the bonnet increased due to the flow characteristics, thereby increasing the drag coefficient.

4.6. Comparison of the Drag Coefficient, Lift Coefficient, and Energy Reduction Rate According to the Geometry

Table 5 compares the drag coefficient, lift coefficient, and energy reduction rate of each model with those of the base model. Compared with the base model, the drag coefficient and energy consumption decreased as the rear and front angles increased, but the lift coefficient showed the opposite tendency. In particular, as the overhang length decreased, the drag coefficient increased, but the lift coefficient decreased significantly. In addition, when the angle position was in the front part, the drag coefficient decreased further, but the lift coefficient increased. The results in the above table indicate that the rear angle has a significant influence on the drag coefficient of the pickup truck, and the overhang length affects the lift coefficient. The energy reduction rate exhibited the same tendency as that of the drag coefficient. Thus, the flow resistance can be reduced by increasing the rear angle and decreasing the overhang length.

4.7. Design Optimization

Figure 17 shows the effects of four factors on the drag coefficient obtained using 54 models as the main effect plot for the drag coefficient. The larger the slope of the graph, the greater the effect on the drag coefficient. Based on this result, it is possible to determine the effects of the factors on the drag coefficient.
0.1   L O L T 0.16  
  0.5     L F L C     0.666
0 °     F r o n t   a n g l e     5 °
  0 °     R e a r   a n g l e     10 °
The front and rear angles should be increased, and the overhang should be longer. As the roof angle moved forward, the drag decreased. Considering this tendency and the mesh characteristics, within the shape range mentioned in (3), the shape features of model 1-8 reduce the drag coefficient to the greatest extent.
The drag coefficient of the 1-8 model was approximately 10% lower than that of the base model. Figure 18 compares the pressure coefficient and velocity contour between the base model and the 1-8 model. The overall tendencies of the pressure coefficient are the same; however, at certain points, the pressure coefficient drops and then recovers owing to the front and rear angles. Regarding the velocity contour, in the case of the 1-8 model, the fluid separated at the end of the roof in the direction of the tailgate owing to the rear angle, and the wake zone above the bed was significantly reduced. In addition, the flow was stable in this section because the overhang length was the largest. As the angle of the roof changes in the front part, the separation point moves backward. Thus, the 1-8 model can reduce the drag coefficient most significantly.
Figure 17. Main effect plot for the drag coefficient.
Applsci 14 04667 g017
Figure 18. Comparison of the pressure coefficient, stream line, and velocity contour between the base model and 1-8 model. (a) Pressure coefficient at the top; (b) velocity contour of the 1-8 model; (c) stream line contour of the 1-8 model; (d) velocity contour of the base model; (e) stream line contour of the base model.
Applsci 14 04667 g018aApplsci 14 04667 g018bApplsci 14 04667 g018c

4.8. Empirical Correlation

Based on the results of the numerical analysis, a drag coefficient correlation was derived for application to the pickup truck design, as shown in (4). The error in the numerical analysis results was analyzed to examine the validity of the equation for the 54 models. The error was −1.74% for the 1-15 model and 1.90% for the 3-9 model, whereas it was less than 1% for most of the remaining models. In addition to the 54 models used for the derivation of the correlation, four additional models were created within the geometry ranges, and the error was analyzed. The results are presented in Table 6. Because the differences between the numerical analysis results of the four models and the correlation values were less than 1.3%, it was judged that the correlation was valid within the given ranges.
C D = 0.51835 0.2268 L O L T + 0.01852 L F L C 0.1109 θ F r o n t 0.21797 θ R e a r

5. Discussion

As the electric vehicle market is rapidly growing, various designs of electric vehicles have been presented. In this study, among various electric vehicle designs, the design with the lowest air resistance was studied to improve the driving range of electric pickup trucks. In particular, the changes in the drag coefficient according to the length of the overhang and roof geometry were analyzed. Most studies on pickup truck drag coefficients focus on the bed, and this is the first time that research has been conducted on the overhang and roof. Although in this study, there are only two design elements of pickup trucks, the overhang and roof, we plan to conduct research on the correlation between various factors that affect the air resistance of pickup trucks, such as the bed and height, in the future.

6. Conclusions

In this study, a numerical analysis was conducted on the influence of the roof conditions and overhang length of a pickup truck on the drag coefficient, which has not yet been researched. Six factors ( L T , L O , L C , L F , θ F ,   a n d   θ R ) were used in this study, and the flow was analyzed after creating 54 pickup truck models by combining the factors. Accurate flow analysis of each condition was performed by varying one factor while maintaining the others constant. Four geometric conditions (front angle, rear angle, angle position, and overhang length) were analyzed using the flow field and velocity profile.
An increase in the front angle results in the rearward movement of the flow separation point, leading to a reduction in the wake zone size and consequently lowering the vehicle’s drag. Moreover, a larger front angle facilitates a seamless integration between the windshield and the roof, diminishing the flow resistance arising from geometric factors.
Similarly, an increase in the rear angle directs fluid toward the tailgate, thereby reducing the size of the upper wake zone and promoting more stable fluid flow. When the angular position is situated towards the front section of the roof, the momentum increase induced by the velocity exerts a more significant impact on the drag than the separation point position does. Furthermore, an elongated front overhang encourages a smoother fluid flow toward the windshield along the sufficiently extended bonnet. Consequently, a smaller wake zone forms at the junction between the bonnet and the windshield, resulting in a reduced drag coefficient.
The lift coefficient showed the same tendency as the drag coefficient under changes in the rear and front angles. The lift coefficient significantly decreased as the overhang length decreased. The energy reduction rate exhibited the same tendency as that of the drag coefficient. Therefore, the energy consumption can be reduced by increasing the rear angle, and the driving resistance can be minimized by decreasing the overhang length. Therefore, the more the front and rear angles are increased, the closer the angular position of the roof is to the windshield, and the longer the overhang length is, the more optimal the design is to reduce the drag coefficient when designing a vehicle.
This study investigated the front overhang and roof design of pickup trucks, which had rarely been done before. Based on the results of this study, we analyzed the trends in the drag coefficient, lift coefficient, and energy reduction rate for a total of 54 shapes, derived the drag coefficient correlation equation, and verified the validity of the correlation using an additional model. Recently, as the demand for electric vehicles has increased, the number of automobile companies releasing electric pickup trucks has increased. Through the correlation equation of the derived shape factors, it is possible to derive an optimal design that can reduce drag, which has a significant impact on the driving distance of electric pickup trucks.

Author Contributions

Conceptualization, T.K.K. and M.S.K.; methodology, T.K.K. and Y.B.; software, J.K. and Y.B.; validation, T.K.K. and M.S.K.; data curation, M.S.K. and Y.B.; writing—original draft preparation, M.S.K.; writing—review and editing, T.K.K. and J.K.; visualization, M.S.K.; supervision, T.K.K. and M.S.K.; project administration, T.K.K. All authors have read and agreed to the published version of the manuscript.

Funding

Korea Institute for Advancement of Technology (KIAT): P0008458.

Institutional Review Board Statement

Not applicable.

Informed Consent Statement

Not applicable.

Data Availability Statement

The raw data supporting the conclusions of this article will be made available by the authors on request.

Acknowledgments

This research paper was supported by the Education and Research Promotion Program of KOREATECH in 2022.

Conflicts of Interest

The authors declare no conflicts of interest.

References

  1. Krishnani; Nari, P.; Zhou, D. CFD analysis of drag reduction for a generic SUV. In Proceedings of the ASME International Mechanical Engineering Congress and Exposition, Lake Buena Vista, FL, USA, 13–19 November 2009; Volume 43864. [Google Scholar]
  2. Adem, F.A. Drag Reduction of Pickup Truck Using Add-On Devices. Ph.D. Thesis, California State University, Sacramento, CA, USA, 2009. [Google Scholar]
  3. Yang, Z.; Khalighi, B. CFD simulations for flow over pickup trucks. Soc. Automot. Eng. 2005, 1, 0547. [Google Scholar]
  4. Al-Garni, A.M.; Bernal, L.P. Experimental investigation of the near wake of a pick-up truck. In Proceedings of the SAE 2003 World Congress & Exhibition, Detroit, MI, USA, 3–7 March 2003. [Google Scholar]
  5. Mukda, P. Effect from accessories on pickup aerodynamics by computational fluid dynamics. In Proceedings of the 6th Int’l Conference on Advances in Engineering Sciences and Applied Mathematics (ICAESAM’2016), Kuala Lumpur, Malaysia, 21–22 December 2016; pp. 59–63. [Google Scholar]
  6. Ha, J.; Obayashi, S.; Kohama, Y. Drag characteristics of a pickup truck according to the bed geometry. In Proceedings of the 7th IASME/WSEAS International Conference on Fluid Mechanics and Aerodynamics (FMA’09), Moscow, Russia, 20–22 August 2009; pp. 122–127. [Google Scholar]
  7. Ha, J.; Jeong, S.; Obayashi, S. Flow characteristics of a pickup truck with regard to the bed geometry variation. Proc. Inst. Mech. Eng. Part D J. Automob. Eng. 2010, 224, 881–891. [Google Scholar] [CrossRef]
  8. Tian, J.; Zhang, Y.; Zhu, H.; Xiao, H. Aerodynamic drag reduction and flow control of Ahmed body with flaps. Adv. Mech. Eng. 2017, 9. [Google Scholar] [CrossRef]
  9. Altaf, A.; Omar, A.A.; Asrar, W. Passive drag reduction of square back road vehicles. J. Wind Eng. Ind. Aerodyn. 2014, 134, 30–43. [Google Scholar] [CrossRef]
  10. Ha, J.; Jeong, S.; Obayashi, S. Drag reduction of a pickup truck by a rear downward flap. Int. J. Automot. Technol. 2011, 12, 369–374. [Google Scholar] [CrossRef]
  11. Ahmed, S.R.; Ramm, G.; Faltin, G. Some salient features of the time-averaged ground vehicle wake. In Proceedings of the SAE International Congress and Exposition, Detroit, MI, USA, 24–28 February 1984; pp. 473–503. [Google Scholar]
  12. Ait, M.A.; Fischer, J.; Yadav, R. Aerodynamic drag reduction for a generic truck using geometrically optimized rear cabin bumps. J. Eng. 2015, 2015, 789475. [Google Scholar]
  13. Markina, A.A.; Lukashuk, A.D.; Chepkasov, S.N.; Starovoytenko, A.V. Improving aerodynamic characteristics for drag reduction of heavy truck. IOP Conf. Ser. Mater. Sci. Eng. 2020, 862, 032032. [Google Scholar] [CrossRef]
  14. Kim, J.; Pattermann, J.; Menon, V.; Mokhtar, W. A CFD study of pickup truck aerodynamics. In Proceedings of the 2011 ASEE North Central & Illinois-Indiana Section Conference, Pleasant, WI, USA, 1–2 April 2011. [Google Scholar]
  15. Lietz, R.; Larson, L.; Bachant, P.; Goldstein, J.; Silveira, R.; Shademan, M.; Ireland, P.; Mooney, K. An Extensive Validation of an Open Source Based Solution for Automobile External Aerodynamics; No. 2017-01-1524; SAE Technical Paper; SAE International: Warrendale, PA, USA, 2017. [Google Scholar]
  16. Paul, A.J.; Jain, A.; Alam, F. Drag reduction of a passenger car using flow control techniques. Int. J. Automot. Technol. 2019, 20, 397–410. [Google Scholar] [CrossRef]
  17. Ildarkhanov, R. The calculation of the fuel cost for a car. Period. Polytech. Transp. Eng. 2019, 47, 277–282. [Google Scholar] [CrossRef]
  18. Yuan, X.; Li, L.; Gou, H.; Dong, T. Energy and environmental impact of battery electric vehicle range in China. Appl. Energy 2015, 157, 75–84. [Google Scholar] [CrossRef]
  19. Menter, F.R. Two-equation eddy-viscosity turbulence models for engineering applications. AIAA J. 1994, 32, 1598–1605. [Google Scholar] [CrossRef]
  20. Mohamed, M.H.; Ali, A.M.; Hafiz, A.A. CFD analysis for H-rotor Darrieus turbine as a low speed wind energy converter. Eng. Sci. Technol. 2015, 18, 1–13. [Google Scholar] [CrossRef]
  21. Bardina, J.; Huang, P.; Coakley, T.; Bardina, J.; Huang, P.; Coakley, T. Turbulence modeling validation. In Proceedings of the 28th Fluid Dynamics Conference, Snowmass Village, CO, USA, 29 June 1997–2 July 1997; p. 2121. [Google Scholar]
  22. Ibraheem, A. Evaluating the efficiency of polyhedral mesh elements in solving the problem of the flow around ship’s rudder. Int. J. Eng. Manag. Sci. 2021, 6, 241–256. [Google Scholar]
Figure 1. Schematic of pickup truck geometry. (a) Side view; (b) top view.
Applsci 14 04667 g001
Figure 2. Boundary domain of the pickup truck: (a) 2D boundary domain of the pickup truck; (b) 3D boundary domain of the pickup truck.
Applsci 14 04667 g002
Figure 3. Mesh structure of the middle section of a pickup truck. (The red circle is the area where the grid is enlarged).
Applsci 14 04667 g003
Figure 4. Results of the grid-independence test.
Applsci 14 04667 g004
Figure 5. Comparison of the experimental results of Ha et al. [7] and the CFD model results for the drag coefficient.
Applsci 14 04667 g005
Figure 6. Pressure coefficient in the top section of the pickup truck. (a) Upper center part of pickup truck (b); pressure coefficient at the center of the upper part of the pickup truck [3]. (The red line is the location of the pressure coefficient).
Applsci 14 04667 g006
Figure 7. Pressure coefficient in the bottom section of the pickup truck. (a) Bottom center part of the pickup truck; (b) pressure coefficient at the center of the bottom part of the pickup truck [3]. The red line is the location of the pressure coefficient.
Applsci 14 04667 g007
Figure 8. Drag coefficient of the pickup truck according to the front angle.
Applsci 14 04667 g008
Figure 9. Velocity profile in the height direction at the joint between the windshield and roof. (a) Velocity profile measurement point; (b) velocity profile in the direction of height at point A.
Applsci 14 04667 g009
Figure 10. Drag coefficient of the pickup truck according to the rear angle.
Applsci 14 04667 g010
Figure 11. Velocity contour according to the rear angle. (a) Base model; (b) 1-1 model; (c) 1-2 model.
Applsci 14 04667 g011aApplsci 14 04667 g011b
Figure 12. Velocity contour in the plane section at the position of x L T = 1.1 . (a) Base model; (b) 1-1 model; (c) 1-2 model.
Applsci 14 04667 g012
Figure 13. Drag coefficient of the pickup truck according to the angle position.
Applsci 14 04667 g013
Figure 14. Velocity profile according to the angle position.
Applsci 14 04667 g014
Figure 15. Drag coefficient of the pickup truck according to the overhang length.
Applsci 14 04667 g015
Figure 16. Vector contour according to the overhang length. (a) Base model; (b) 1-1 model; (c) 1-2 model.
Applsci 14 04667 g016aApplsci 14 04667 g016b
Table 1. Literature review.
AuthorsRefResearch Focus
Al-Garni et al.[4]Analysis of wake effects inside and on top of the pickup truck bed
Mukda[5]Comparison of drag coefficients of six types of pickup trucks
Ha et al.[6,7]Flow and drag analysis according to pickup truck bed geometry
Tian et al.[8]Comparison of the drag coefficient according to the angle of the Ahmed model
Altaf et al.[9]Study of the optimal angle and length of rectangular, oval, and triangular flaps
Ha et al.[10]Comparison of drag coefficients for the angle and length of cabin rear flaps
Ahmed et al.[11]Analysis of the influence of the rear flap angle at different velocities
Ait et al.[12]Application of an optimization method to determine the number and size of bumps at the cabin roof end
Markina et al.[13]Investigation of fuel savings by installing cab fairing and cab-side extenders in the cabin of a large truck
Kim et al.[14]Flow analysis according to the tapered cab roof of a pickup truck
Lietz et al.[15]Comparison of drag coefficients for various external geometries of vehicles
Paul et al.[16]Analysis of the influence of a vortex generator and rear spoiler on drag coefficient
Ildarkhanov and Radik[17]Formula proposal for the fuel consumption of trucks taking into account various technical variables
Yuan, Xinmei et al.[18]Comparison of mileage according to the rolling coefficient, battery energy density, and drag area and the resulting CO2 emissions.
Table 2. Roof and overhang conditions used in this study.
L O L T L F L C θ F θ R
0.160.5
0.66
0 ° 0 °
0.13 3 ° 5 °
0.1 5 ° 10 °
Table 3. Detailed dimensions of the overhang and roof.
Case L O L T L F L C Front Angle
[Degree]
Rear Angle
[Degree]
Base model0.160.500
1-10.160.505
1-20.160.5010
1-30.160.530
1-40.160.535
1-50.160.5310
1-60.160.550
1-70.160.555
1-80.160.5510
Base model0.160.6600
1-90.160.6605
1-100.160.66010
1-110.160.6630
1-120.160.6635
1-130.160.66310
1-140.160.6650
1-150.160.6655
1-160.160.66510
2-10.130.500
2-20.130.505
2-30.130.5010
2-40.130.530
2-50.130.535
2-60.130.5310
2-70.130.550
2-80.130.555
2-90.130.5510
2-10.130.6600
2-100.130.6605
2-110.130.66010
2-120.130.6630
2-130.130.6635
2-140.130.66310
2-150.130.6650
2-160.130.6655
2-170.130.66510
3-10.10.500
3-20.10.505
3-30.10.5010
3-40.10.530
3-50.10.535
3-60.10.5310
3-70.10.550
3-80.10.555
3-90.10.5510
3-10.10.6600
3-100.10.6605
3-110.10.66010
3-120.10.6630
3-130.10.6635
3-140.10.66310
3-150.10.6650
3-160.10.6655
3-170.10.66510
Table 4. Comparison of the turbulence model results with experimental values for the drag coefficient from Ha et al. [7].
Flap
Length
Downward AngleExperimental ValuesCFD ResultsError
k ε
T u r b u l e n c e
S S T   k ω
T u r b u l e n c e
0.2 H 0 ° 0.4910.5350.5067.1%3.0%
0 H
(Base model)
0 ° 0.4790.5230.4919.2%2.6%
Table 5. Comparison of the drag coefficient, lift coefficient, and energy reduction rate.
-ModelDrag CoefficientLift CoefficientEnergy Reduction Rate
Base Model000
Rear angle1-1 model−6.06%2.04%−6.40%
1-2 model−8.84%2.78%−8.74%
Front angle1-3 model−0.37%−2.81%−0.34%
1-6 model−1.09%−2.92%−1.06%
Overhang2-1 model0.82%−12.66%0.97%
3-1 model1.79%−37.16%1.06%
Angle position1-4 model−6.71%4.38%−6.81%
1-12 model−5.94%−1.83%−5.74%
Table 6. Comparison of the drag coefficient between correlation verification models and the correlation.
Correlation Verification Model L O L T L F L C Front Angle
[Degree]
Rear Angle
[Degree]
Drag Coefficient
[CFD]
Drag Coefficient
[Correlation]
Difference
[%]
10.120.5522.50.48210.48791.19
20.140.5522.50.48000.48340.69
30.140.647.50.45990.46140.33
40.150.58280.45490.46071.27
Disclaimer/Publisher’s Note: The statements, opinions and data contained in all publications are solely those of the individual author(s) and contributor(s) and not of MDPI and/or the editor(s). MDPI and/or the editor(s) disclaim responsibility for any injury to people or property resulting from any ideas, methods, instructions or products referred to in the content.

