Featured Application
The described methodology can be utilized to simulate and optimize microgrids with similar or desired designs, with the objective of assessing the logistical and environmental performance indicators of their operations.
Abstract
European islands have been leading the charge in renewable energy innovation. Yet, the intermittent nature of sources like solar and wind poses challenges such as grid saturation and frequency variations. Limited interconnection with mainland grids exacerbates these issues, necessitating backup from conventional power sources during low-production periods. Until 2021, Crete operated independently, but new infrastructure now integrates it with the Greek mainland grid, facilitating swift energy transfers. This integration enables surplus power from Crete’s solar and wind systems to be transmitted to the mainland and vice versa. However, reliance on remote power production exposes the island to market fluctuations and distant disruptions, impacting electricity production. Storage technologies offer a solution, enhancing renewable energy penetration while reducing carbon emissions. Green hydrogen, a rising storage method, shows promise in offsetting carbon emissions. Its clean-burning nature minimizes environmental impact and reduces reliance on costly and harmful conventional sources. This study aims to evaluate the feasibility of achieving carbon-neutral electricity production in Crete, Greece, using hydrogen storage to offset annual carbon emissions in a financially viable and sustainable manner. Hydrogen’s clean-burning properties reduce environmental impact and lessen dependence on expensive and environmentally harmful conventional sources. The methodology prioritizes the independence of the Cretan electricity system, utilizing electrolysis to produce green hydrogen and proton-exchange membrane (PEM) fuel cells for energy generation. It investigates the optimal expansion of renewable energy systems, including photovoltaic (PV) and wind turbine (WT) parks, alongside the installation of hydrogen storage, under specific assumptions. This proposed installation aims to achieve both island independence and profitability, requiring an additional expansion in PV capacity of 2.13 GW, WT capacity of 3.55 GW, and a hydrogen system with electrolyzer and fuel cell capacities totaling 278.83 MW each, along with a hydrogen tank capacity of 69.20 MWh. The investment entails a capital expenditure (CAPEX) of 6,516,043,003.31 EUR for a nearly zero net present value (NPV) over 20 years. However, carbon neutrality cannot be attained through this optimal solution alone, as relying solely on carbon sequestration from olive groves, the primary crop cultivated on the island, is insufficient as a carbon sink method. The annual net carbon emissions from electricity production, island transport, residential heating, and carbon sequestration are estimated at 94,772.22 tCO2.
1. Introduction
The increasingly evident climatic shifts present a formidable challenge for the global scientific community. With every facet of existence affected, from weather patterns to ecosystem dynamics, thorough study and analysis are imperative for a transition toward sustainable and environmentally secure living conditions. Scientists worldwide are diligently investigating these changes, striving to comprehend their complexities and devise innovative solutions. Through collaborative efforts and interdisciplinary approaches, they aim to pave the way for a future where humanity coexists harmoniously with the planet, fostering habitats that prioritize ecological integrity and resilience.
At present, considerable attention is being directed towards exploring the vast potential of renewable energy sources (RES) across the globe. Various alternative methods of energy acquisition are being meticulously evaluated, with a focus on deploying cutting-edge technologies to maximize efficiency while minimizing environmental impact. From solar and wind to hydroelectric and geothermal power, the spectrum of renewable energy options offers a promising avenue for reducing reliance on fossil fuels and mitigating the adverse effects of climate change. Research and development efforts are increasingly geared towards refining existing technologies and pioneering new approaches to harnessing renewable energy on a large scale. By embracing these advancements and fostering a global culture of innovation, societies can aspire towards a future powered by sustainable, clean energy solutions that benefit both people and the planet.
The traditional electrical grid is experiencing substantial augmentation to ensure system dependability and enhance both energy efficacy and ecological sustainability. A conventional grid is transforming into a smart grid (SG) that includes a diversified, heterogeneous mix of operational measures such as smart appliances, meters, and renewable energy resources. The SG is a new design for the electric power grid since it produces more efficient outcomes and is more reliable. The SG is one of the most promising innovations as a solution to the energy dilemma. A major advancement involves the developments in power electronics technologies that have contributed to the development of power conversion systems used in RES and other energy applications. The benefits include an increase in reliability, resilience of power sources, and electromagnetic compatibility between different power sources applied to microgrids [1]. Nonetheless, it is intricate, and decentralizing it might be of immense advantage [2].
From the beginning of the Industrial Revolution, the amount of carbon dioxide (CO2) equivalent in the atmosphere has approximately doubled, according to various reports [3]. As a result, this has led to a rise in world average temperature, which is having an adverse effect on the climate on a global scale [4]. Recent advancements in a variety of renewable energy technologies have improved their reliability while simultaneously minimizing their cost, making them suitable for usage in a wider variety of scenarios. Significant improvements have been achieved in both renewable energy systems and hydrogen technologies, resulting in increased efficiency and productivity [5,6]. The Mediterranean area is distinguished by its abundance of indigenous solar and wind energy resources, which have the potential to be used in the creation of power, heat, and cooling [7].
1.1. Islands Pioneers in RES Integration
In the context of European legislation and the shift to green energy technologies [8], the extensive literature has been established regarding the application of ecologically friendly technologies to island power systems. Juswanto and Ali [9] conducted a thorough analysis of recent advancements in the field of renewable energy in the Pacific islands. According to the authors, the present contribution of renewable energies such as solar and wind power to their overall energy balance is between 20 and 40 percent.
Meschede et al. [10] composed an overview of the 100% usage of renewable energy on islands. A total of 97 papers were analyzed on islands, with a focus on various regions like the Atlantic Ocean, Mediterranean islands, North and Baltic Sea, Caribbean Sea, Pacific Ocean, and Indian Ocean. The majority of papers in their study aimed to assess renewable energy systems, with a distinction between studies focusing on achieving 100% renewable energy supply and those analyzing different renewable energy systems on islands. According to the authors, Solar PV and wind technologies are the primary technologies for achieving 100% renewable energy systems on islands. On the other hand, there is a need to seriously consider area limitations on islands for all renewable energy sources based on full energy system studies and area demand. The International Renewable Energy Agency (IRENA) [11] has reported on international uses of RES in island settings. The paper included a number of case studies dealing with the use of renewable energy sources for the production of electricity on a variety of islands located all over the globe. There have been reports of the use of RES on European islands [12]. The possibility of islands fulfilling all their energy needs with renewable energy sources was discussed in the study, with specific reference to the island of Samso. It focuses on organizational and technological challenges as well as on local considerations affecting the availability and usage of RES. It offers a variety of case studies about the exploitation of RES in EU islands.
Marczinkowski et al. [13] conducted research on the topic of converting an island’s energy systems to be 100% reliant on RES by the year 2030. The authors investigated how three different islands in Europe—Samso, Orkney, and Madeira—made the transition to the total use of renewable energy sources in order to achieve energy independence. Regarding the transition of the island to 100% renewable energy sources, they said that there are a number of different energy systems and solutions that may be implemented based on the local circumstances, development stages, and local availability of different RES. In addition, the author performed research [14] on the process of converting the energy grid on Madeira Island to one that is powered entirely by renewable resources. The authors used the EnergyPLAN modeling program in order to investigate and compare two distinct energy strategies. They noted that due to the absence of international trade, the island must implement a sophisticated energy system and make use of innovative technology in order to increase its level of energy self-sufficiency.
Chatziargiriou and colleagues [15] conducted research on the development of renewable energy sources on the Greek islands. According to the authors, Greece is made up of 124 inhabited islands, any number of which might serve as a prototype for the use of RES in the country’s efforts to advance its economy. They also said that the implementation of RES on these islands might provide local inhabitants an extra source of income while offering the chance for the development of novel RES systems that include power storage.
A group of islands in the Nordic region has been formed, and one of its goals is to achieve carbon neutrality [16]. More than sixty (60) different technologies that are based on RES have been identified as having the potential to be implemented on these islands in order to reduce their carbon footprint or bring it down to zero.
Breyer et al. [17] explored the possibility of reaching net-zero CO2 emissions in Europe by 2050. Building on existing 100% renewable energy models, the authors developed scenarios for achieving carbon neutrality by 2040 and 2050, using a high-resolution, multi-region energy system model covering all energy sectors. The results reveal a cost-neutral pathway toward net zero emissions by 2050, reducing electricity costs. An accelerated transition by 2040 would see a 9% increase in energy costs but a 17% improvement in CO2 emissions reduction. Solar photovoltaics would dominate the total electricity production, becoming 61–63% of total generation in 2050. The authors suggested a ‘power-to-X’ economy as a key feature of Europe’s energy future by transforming most chemical products into electricity so that solar power can be converted to methanol, kerosene, and hydrogen in order to be stored for seasonal inequality.
1.2. Zero Carbon Crete
The pursuit of a carbon-neutral Crete has been investigated extensively. Vourdoubas [7] has examined the prospect of constructing residential structures on the Greek island of Crete that produce zero net carbon emissions. According to the author, it is possible to meet all of the energy needs of residential structures in Crete using locally sourced renewable energy sources, which would result in such buildings having no net carbon footprint as a result of their usage of energy. Moreover, he claimed that it is possible to reach carbon neutrality with the use of solar thermal energy, solar photovoltaic energy, and high-efficiency heat pumps. Also, he investigated the use of RES in the more rural parts of the island of Crete [18]. According to the author, Crete already makes use of many different types of renewable energy, including solar energy, wind energy, hydro energy, biomass, and low enthalpy geothermal energy. Furthermore, it was noted that renewable energy sources currently contribute over 20% to the island’s overall power consumption, with the anticipation of this proportion to increase in the foreseeable future.
1.3. Interconnections of Islands in Greece
Before its completion, Biza et al. [19] conducted research on the subject of the interconnection between Peloponnese and Crete. Per the authors, the connectivity would be completed in two stages. The electric grid of Crete would be coupled with the system of Peloponnese in phase 1 of the project, with a capacity for transmitting power ranging from 150 MW to 180 MW. During phase 2, the electric grid of Crete is expected to be integrated with the system of Attica, and the capacity for transmitting power will be 1000 MW [20].
Tzanes et al. [21] conducted research on the current production of power on the non-interconnected islands in the Aegean Sea, with the exception of the islands of Crete and Rhodos. According to the authors, the yearly contribution of renewable energies in the overall energy mix has remained relatively constant at roughly 15% to 18% due to the current technological limits. They also claimed that the cost of generating energy on tiny islands using thermal power plants is significant, coming in at roughly 600 EUR/MWh. They suggested the creation of electricity storage devices as a means of increasing the proportion of renewable energies that are included in the overall energy mix on these islands.
Tsekeris [22] has focused on the process of energy transition in the islands of Greece that are not connected with each other. According to what was stated in the article, customized transitional policies need to be devised. He also noted that the national objectives for the year 2030 include a decrease in CO2 emissions of forty (40) percent and a penetration of renewable energy sources of thirty-two (32) percent in the overall energy mix. Regarding the transportation industry, it is anticipated that there will be a complete shift in the kind of fuels that are used, in addition to an increase in the number of electric cars and trains.
1.4. Islandic Electricity Storage
Bertsiou and Baltas [23] conducted research on the topic of combining renewable energy sources with the generation of hydrogen and its usage using fuel cells on a Greek island. The paper discusses the comparison between a single storage system (PHS) and a hybrid storage system (HPHS) for fulfilling energy requirements on islands, with the HPHS showing lower loss of load probability values despite higher cost, conducted on the island of Fournoi Korseon in Greece. The study emphasizes the importance of utilizing wind potential and coupling with storage systems for energy security.
Rodrigues et al. [24] conducted research on the possibility of installing energy storage systems on the island of Terceira, which is located in the Azores and belongs to Portugal. The authors claimed that the installed power on the island in 2012 was 75.1 MW, while the greatest energy demand in 2018 would be approximately 30 MW to 35 MW. This difference was due to the fact that the maximum electricity demand in 2018 would be much lower. They determined that the optimal size of an energy storage system for 2018 would be 8.1 MW, which would be produced by water turbines working in a static waterfall at 340 m with a water flow rate of 3 m3/s. They also investigated the similarities and differences between electric batteries and hydro pump storage. The cost of a hydro pump storage system with 8.1 MW was predicted to be 15.56 million EUR, whereas the cost of batteries was 28.27 million EUR.
Nikolaou et al. [25] conducted research on the topic of the storage of surplus power generated by wind farms on the Greek island of Crete by using hydro pump storage devices. The writers discussed the “Potamon” dam, which is situated in the prefecture of Rethymno and has the potential to be utilized for the storage of extra power. They indicated that the optimal capacity of power-producing turbines should be 31 MW, and it is projected that the yearly produced energy would account for 2.0–2.2% of the island’s annual consumption of electricity.
The introduction of storage methods can also assist in issues arising from RES’s increased penetration levels to a microgrid. Evangelos Pompodakis et al. [26] optimized the installation of hybrid power plants through the development of the energy system of the island of Rhodes. The stochastic production of the WT installed on the island presented significant frequency fluctuations, resulting in enforced RES curtailment. The methodology proposed a WT-battery storage coupling, estimating a reduction in frequency fluctuations and a yearly cost reduction above 7.9 million EUR.
1.5. Cretan Power Grid
Electricity generation and fossil fuel consumption in Crete in 2022 has been reported by the Hellenic Electricity Distribution Network Operator (HEDNO) SA [27]. Total electricity generation in Crete during 2022 was 20,784.7 MWh, while most of it was generated in thermal power stations fueled by heating oil and diesel oil. The share of RES in electricity generation was slightly higher than 23%. According to HEnEx data [28], in 2023, the island’s annual energy demand was 3.14 TWh, 1.48 TWh of which were produced using the island’s conventional power plants, 701.7 GWh from RES production, while the rest were imported through the interconnection. The proposed methodology receives as input the load and means of energy demand hourly values of Crete for 2023. An alternative priority chain of load satisfaction and RES production is proposed, based on which the optimal RES expansion and hydrogen system introduction is determined for an independent, sustainable, and carbon-neutral energy system. The potential of storing power on the island is discussed, and the CO2 emissions that are caused by the usage of fossil fuels in the production of electricity are estimated. In the following section, the requirements for net zero CO2 emissions due to electricity use in Crete are stated.
The current operational scheme is dictated by the participation of the island’s electricity producers (both RES and power plants) and providers in the HEnEx, with the interconnection facilitating the transmission of purchased quantities. This research explores an alternative model of an independent grid, demonstrating a method to increase the use of RES in energy production. This approach aims to reduce carbon emissions and fossil fuel consumption in Crete, offering a replicable model for other islands. This paper’s methodology presents a comprehensive analysis of the economic and environmental aspects of an innovative project design using the most recent data from 2023. The analysis employs a methodological model that utilizes techniques to analyze and simulate large-scale real-world data, including hourly values for an entire year. This approach provides targeted insights into the real-time energy management of a microgrid, capturing the actual dynamics of both energy consumption and production throughout the year. This holistic understanding of microgrid performance allows us to coherently assess its economic and environmental dimensions, paving the way for more informed decision-making.
2. Materials and Methods
2.1. Electricity Generation of Crete
Crete is the fifth biggest island in the Mediterranean and the largest in Greece, with a population of around 620,000 people living on an area of 8303 km2. During the tourist season, which lasts from May to October, Crete’s population and demand for electricity increase. Since November 2021, Crete’s energy suppliers and providers have participated in the Hellenic Energy Exchange (HEnEx). The HEnEx’s platform provides the island’s hourly electricity demand [28]. In Figure 1, the monthly electricity consumption for 2023 is illustrated:
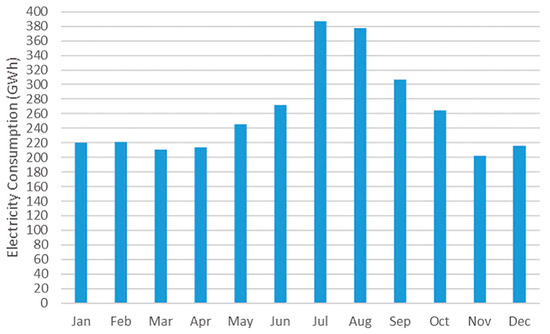
Figure 1.
Crete’s electricity consumption in 2023.
July and August, characterized by the peak of the tourist season, are the months with the highest energy demand. The significant fluctuations between peak and off-peak energy demand, closely tied to seasonal variations, underscore the necessity for adaptability and highlight the challenge of managing operational costs.
Crete’s power system was the biggest independent electrical system in Greece until the first connectivity with the mainland grid happened in 2021, while the second is scheduled to become operational in 2024 [29].
2.2. Conventional Generation of Crete
The majority of Island’s energy is generated by three (3) oil-fired thermal power plants, as seen in Figure 2. Three power plants with varied technology, fuels, and response characteristics have a combined capacity of 607 MW.
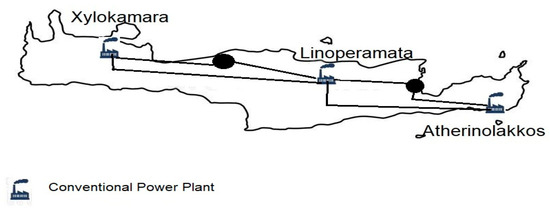
Figure 2.
Conventional power plant locations in Crete.
There are, specifically, steam turbines, internal combustion engines, open-cycle gas turbines, and one combined cycle (CC) unit. The fuel analysis for each thermal oil plant is presented in Table 1. The base-load demand is primarily supplied by steam and diesel units. Gas turbines typically provide the daily peak load or the load that cannot be provided by the other units during outages [29].

Table 1.
Conventional power plants.
In Figure 3, the monthly conventional production is depicted, displaying a similar trend to that of Figure 1:
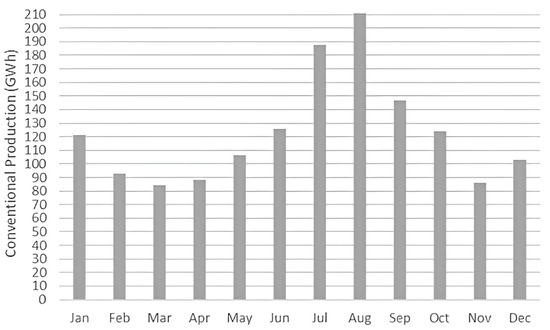
Figure 3.
Total conventional production in Crete during 2023.
2.3. Productivity of Existing RES in Crete
Solar and wind speed potential of Cretan Island is one of the greatest in EU, reaching up to 2100 kWh/m2/year solar radiation and above 8.5 m/s average wind speed in various spots on the island. The percentage of total output from RES contribution was increased for the year 2020 to reach 23.5%. The island is a single administrative region of Greece, which is divided into 4 individual prefectures, which in the context of this study are called areas 1, 2, 3, 4. As can be seen in Table 2, there are a total of 47 wind farms erected around the island, with a combined nominal power output of 215.12 MW [18].

Table 2.
Wind power plant allocation.
In addition, as indicated in Table 3, there are now 1204 small PV plants erected around the island, each with a nominal power output of 80 kW. The majority of these plants are attached to substations with voltages ranging from 0.4 kV to 20 kV, which is the standard practice worldwide [30].

Table 3.
Photovoltaic power plant allocation.
In Figure 4, the Cretan RES production for each month of 2023 is depicted as follows:
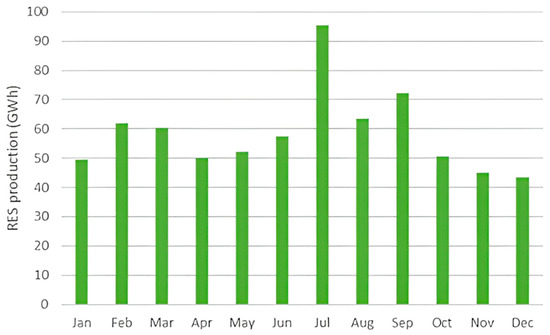
Figure 4.
Total RES production in Crete during 2023.
The highest production was noted in July when the PV parks reached their peak due to prolonged sun exposure, accompanied by the production of WT parks. In addition to energy from the sun and the wind, the enormous olive tree farming that takes place on the island of Crete provides the island with a significant amount of solid biomass resources. In Crete, there are insufficient supplies of hydro energy and geothermal energy with a high enthalpy. It is anticipated that in the not-too-distant future, Crete will be host to not just one but many wind farms located offshore in addition to a solar thermal power plant. With the interconnection of Crete’s electric grid, it is anticipated that the island would produce more environmentally friendly power that is derived from renewable energy sources. Table 4 and Table 5 exhibit Crete’s electricity production and carbon emissions from the island’s different fossil fuels and energy sources, while Table 4 presents the island’s installed capacities for those fuels and sources [31].

Table 4.
Crete’s carbon emissions and electricity production from various fossil fuel and power sources.

Table 5.
Crete’s installed power plant capacity and the efficiency of its solar photovoltaic and wind power plants.
Based on the information that is now available on the installed power and the output of energy for 2018, which is provided in Table 2, an estimate was made regarding the productivity of the solar-PV systems and the wind parks that are currently operating in Crete. Comparatively, the capacity factor of wind farms is 0.291, whereas the yearly productivity of solar photovoltaic systems is 1412 MWh/MWp.
2.4. Cretan Electric Grid Interconnection
The Greek government’s priority is focused on connecting the unconnected islands in order to reduce energy production costs. Notwithstanding the project’s technical problems, it was intended, in earlier years, to link the island’s electric grid to the mainland’s electric grid via two underwater cables. One cable can carry 150–180 MW, while the other can transport 350 MW. The installation of the smaller cable was completed by the end of 2020, whilst the second was anticipated to be completed by 2023. The net position of 2023 imports–exports is shown in Figure 5:
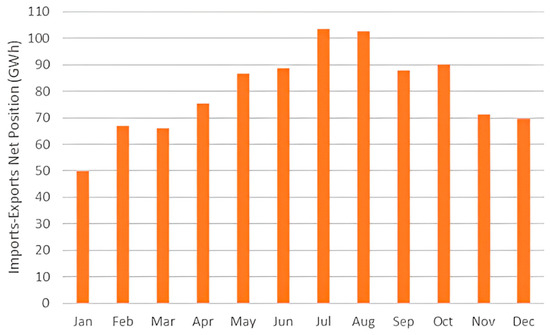
Figure 5.
Imports–exports net position in Crete during 2023.
The interconnection is utilized most extensively during the summer season, as demand surges due to sudden increases in population and commercial traffic. In the past, when Crete’s electric grid operated on its own, there were restrictions placed on the maximum installed power of intermittent renewable energy systems such as solar-PV and wind-generated electricity. These restrictions were implemented for reasons related to maintaining the stability of the grid. Despite the fact that previous research has shown both their technical and economic viability, hydro pump storage systems for the purpose of power storage have not yet been developed on the island of Crete. With the aforementioned limitations, the contribution of renewable energies to the total mix of local energy sources is now slightly greater than 23%. Due to the operation of undersized and inefficient thermal power facilities, the price of energy in Crete is at present costly, accompanied by high greenhouse emissions. Crete has an abundance of sun and wind, and the technology to turn those resources into power is established and cost-effective. Despite investor enthusiasm for implementing these projects, the island has attracted energy investment in solar-PV systems and wind farms that are much lower than its capacity. Wind farms and solar energy production systems are anticipated to replace the polluting and inefficient thermal power facilities in Crete.
2.5. Crete’s Electricity Storage
There are various electrical energy storage technologies, including electrochemical batteries, hydrogen-based storage, and hydropower-pumped storage (HPS) systems. While current developments in their technology allow for the use of huge capacity batteries capable of storing several MWh, electric batteries only have the ability to store relatively tiny amounts of power. It is anticipated that in the not-too-distant future, power will be stored in massive batteries once their prices become competitive. In addition, energy has the capability of being stored in the batteries of electric cars, which is a feature that promotes V2G solutions. Pumped hydro storage systems are more advantageous for the scale of the electric grid that serves Crete, a result of the geomorphology of the island, meaning that various locations may be identified and utilized for the building of energy storage systems. By taking into consideration both technical and economic factors, pumped hydro storage systems are now the greatest alternative for power storage in Crete. Moreover, the deployment of these systems would strengthen the energy security of the island [32]. Because of both economic and technological considerations, the use of H2 for the storage of power is not yet advised. Yet, it continues to be an appealing choice for Crete’s economic future, particularly in light of the impending requirement of the switch to a hydrogen-based economy.
2.6. Crete’s Carbon Emissions via Electricity Generation
It is anticipated that fossil fuel power plants will release 1,801,196 metric tons of carbon dioxide into the atmosphere in 2021 (Table 4). Taking into consideration the fact that there are a total of 620,000 permanent residents on the island, the amount of CO2 emissions that are caused by the production of electricity has been determined to be 2.9 tn CO2 per capita. According to research conducted by the World Bank [31], Greece’s CO2 emissions in 2019 were 5.6 tn CO2 per capita. As a result, the CO2 emissions that are caused by the production of electricity in Crete account for more than 50% of the total CO2 emissions that are produced on the island.
2.7. Crete’s Carbon Emissions Due to Electricity Generation
The interconnection of the electric networks of Crete and mainland Greece enables power to be transferred through the two underwater cables. Since low-cost energy can be transmitted to the island, the electricity generation cost in Crete using the existing thermal power plants is significantly reduced. The electric lines enable power production from the plentiful RES in Crete, ideally solar and wind energy, contributing to the decarbonization of power generation. When there is a surplus of environmentally friendly power produced in Crete, it will be sent to the Greek mainland. Conversely, in scenarios where electricity generation on Crete falls short of demand, electrical power will be transferred via the subsea cables. As a result, the interconnection of the island’s several electrical grids makes the decarbonization of the island a lot easier. To achieve net zero carbon emissions from power production in Crete, the following requirements must be met:
Limiting the reliance on fossil fuels in the island’s electricity production is crucial, with a simultaneous push for the promotion of renewable energy sources. While fossil fuel-generated electricity from mainland Greece will be transmitted to Crete through the subsea interconnector, an annual equivalent of “green electricity” generated by Crete’s renewable sources should be transmitted back. Any excess carbon emissions that are the result of the use of fossil fuels for the production of electricity in Crete must be offset yearly by the carbon sequestration that ought to come from tree plantations that are required to be grown in Crete.
Renewable energy technologies that are currently used or could be used in the future for electricity generation in Crete are presented in Table 6, including utilization of solar energy, wind energy, hydroelectric energy, and biomass.

Table 6.
Sustainable Energy Technologies can be applied in Crete for electricity generation.
2.8. Hydrogen Production
The overall energy efficiency of a hydrogen production system, whether connected or not, is closely linked to the performance of its key components, namely the electrolyzers and hydrogen storage tanks, which fundamentally impact the final quantity of produced hydrogen as well as the production cost [33]. Su et al. demonstrate the close relationship between electrolyzer performance and the energy efficiency of the hydrogen production process [34]. Improving electrolyzer efficiency leads to a reduction in energy losses and an increase in the final hydrogen output, offering significant energy savings.
On the other hand, Sharma et al.’s study [35] emphasizes the importance of enhancing hydrogen storage tanks in reducing production costs. Enhancing the efficiency of these tanks can minimize energy losses and improve the economic efficiency of the hydrogen production process. Hence, the combined improvement of electrolyzers and hydrogen storage tanks holds paramount importance for the integrated energy and economic performance of the hydrogen production system.
The typical performance in hydrogen production and storage varies depending on the technologies used and operational conditions. Electrolyzers, the primary subsystems for hydrogen production, often exhibit efficiencies ranging between 60% and 80% [36]. This percentage is a crucial parameter for process efficiency, as higher efficiencies lead to reduced energy losses and increased hydrogen output.
However, hydrogen storage tanks also impact the overall system efficiency. Typically, the performance of these tanks hovers around 60%, resulting in losses during hydrogen storage [37]. Nevertheless, technological advancements in recent years have allowed improvements in these figures, potentially increasing the efficiency of the storage tanks.
2.9. Methodology
Minimizing CO2 emissions on an electrically interconnected island represents an integral and challenging campaign to enhance the sustainability and efficiency of the energy system. With the coexistence of conventional power plants and renewable energy sources on the island, flexibility and optimal use of the energy produced is vital. An innovative approach involves the use of a hydrogen tank to store excess energy produced from RES sources. Additionally, the sustainability and independence of the island’s grid are also pursued, utilizing the interconnection only for power export to the mainland for financial gain. Therefore, the methodology’s pursuits are the achievement of the following grid properties:
- Independence;
- Sustainability;
- Carbon neutrality.
Hydrogen storage is a central element in the mechanism for storing the energy produced, allowing it to be converted into electricity during periods of peak demand. This enhances the reliability of the energy grid, allowing excess energy to be sold either as electricity to other regions through the interconnection or as compressed hydrogen gas for industrial use.
The combination of conventional and renewable energy sources with the use of hydrogen storage allows for flexible and more efficient management of energy demand and supply. With the help of algorithms and computing systems solutions, it is feasible to determine the optimal combination of RES, conventional production units, and interconnection usage in collaboration with hydrogen production and storage in order to achieve a minimum environmental impact from CO2 emissions.
- Creating a precise mathematical model to compute the parameters outlined in this study is intricate and heavily reliant on the unique conditions and attributes of the energy grid of the specific island under consideration. Based on aforementioned data, a simplified model has been devised to estimate the optimal performance of a hydrogen energy storage system, which follows these steps:
- Simulation of Crete’s network as proposed.
- Calculation of annual values based on key parameters.
- Estimation of environmental and financial metrics based on real data.
- Development of an optimization model to reach the desired goals under certain constraints.
The power dispatch strategy prioritizes grid stability and minimizes reliance on conventional fuels by employing a tiered approach. The priority chain commences by activating only the minimum essential load coverage from conventional power plants, ensuring stable operation while conserving conventional fuel resources. Subsequently, available energy from locally produced RES is directly utilized to meet demand, maximizing the use of clean and sustainable energy. If real-time RES production proves insufficient, the strategy incorporates stored energy, potentially captured from prior periods of high-RES production through electrolysis. This stored energy can be converted for use through fuel cells. In scenarios where demand surpasses both real-time RES production and stored energy capacity, conventional generation is proportionally increased up to their technical limits or until the hourly load is satisfied. As a final resort, if all previous stages are inadequate, a controlled import of energy from the external grid can be implemented, though this option is used sparingly due to potential dependence on external energy sources. The specified priority chain is summarized in Figure 6:

Figure 6.
Priority axis of load satisfaction.
The proposed approach for managing excess RES production exceeding the total hourly load and minimum conventional unit operation requirements employs a multi-step strategy. Firstly, the system prioritizes conversion of any surplus into hydrogen for storage in available tanks through electrolysis. The electrolysis process efficiency is estimated to be around 80% [37]. This approach capitalizes on hydrogen as a viable storage solution, enabling the use of excess RES during low-demand periods. Following hydrogen storage prioritization, any remaining excess beyond the technical minimum and storage capacity is exported to the main grid. This export is limited to a pre-determined value. The export of surplus electric energy through the interconnector is subject to a pre-established nominal value. This value is contingent upon either the interconnector’s maximum load capacity or negotiated power purchase agreements with the relevant electricity provider.
Finally, if a surplus persists after storage and export, the strategy suggests the additional option of hydrogen production for sale, primarily targeting the industrial sector up to the full capacity of the electrolysis system. Any remaining excess production beyond this point is, thus, rejected by the system. The specified process is summarized in Figure 7:

Figure 7.
RES production allocated following the proposed priority.
On an hourly basis, the simulation calculates the hourly RES production. This includes the RES production recorded for each hour T of the year 2023, CRETE RES[T] (sourced from HEnEx data) and the additional production from the RES system expansion. The production from the expansion is determined by multiplying the installed capacities of PV and WT systems (denoted as and ) by the normalized output of a photovoltaic and wind park located in Crete, using Equation (1):
Direct RES refers to the renewable energy production that directly meets demand, as calculated in Figure 8.
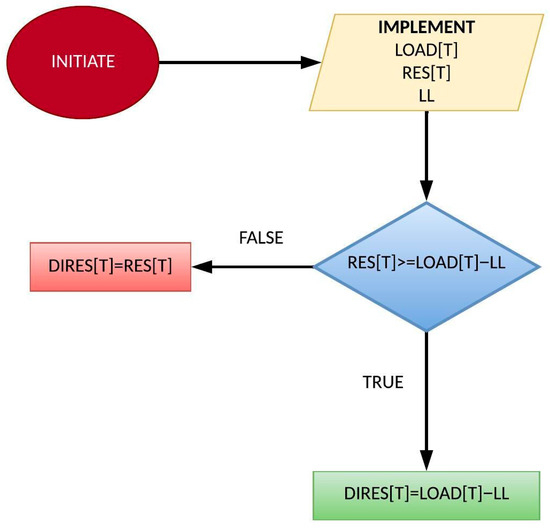
Figure 8.
Computation of RES production successfully allocated for demand satisfaction.
The determination of the hydrogen storage system’s state of charge is delineated across two figures: Figure 9, illustrating the charging instances, and Figure 10, depicting the discharging instances. The hydrogen system discharges hydrogen to contribute to load through the fuel cell system until satisfaction or total release. The tank is filled with green hydrogen produced through electrolysis by an amount attributed to the surplus of RES energy production or until full capacity.
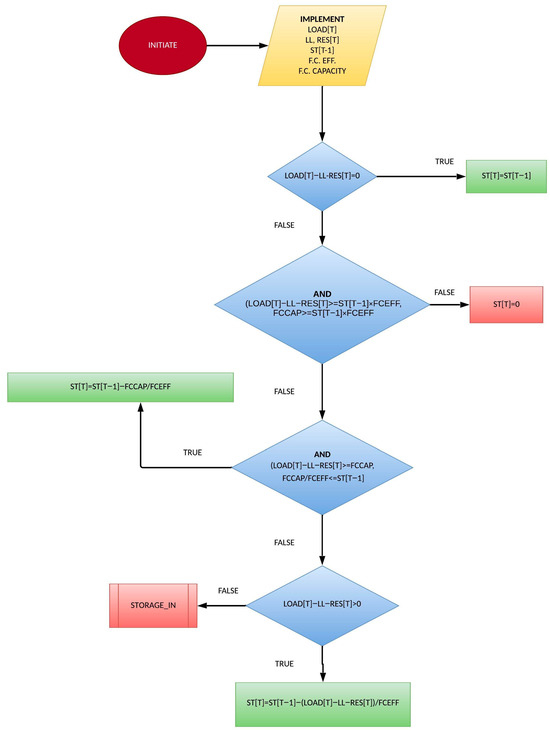
Figure 9.
Hydrogen storage’s state of charge in case of required discharge.
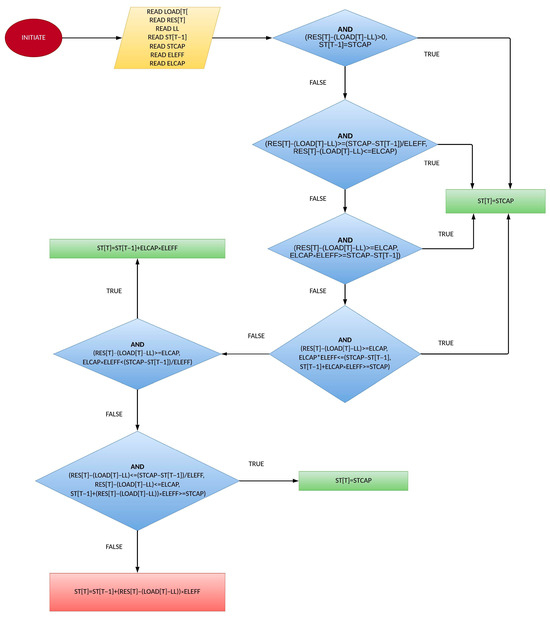
Figure 10.
Hydrogen storage’s state of charge in case of electrolysis process after load satisfaction.
If hydrogen storage is ample, Figure 11 computes the contribution of the fuel cell system to the hourly demand. The fuel cell system’s priority is higher than the power plants’, which is so in order to decrease the carbon footprint associated with the emissions originating from the plants’ fuel consumption. The contribution of the fuel cell system is countified through the monitoring of the hydrogen tank’s state of charge for each hour.
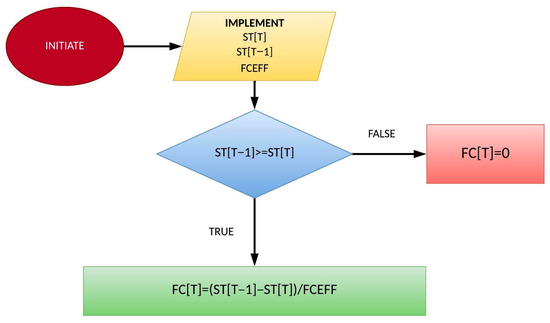
Figure 11.
Calculation of hourly fuel cell system’s contribution.
Figure 12 calculates the amount of surplus energy effectively stored in the hydrogen tank for each hour.
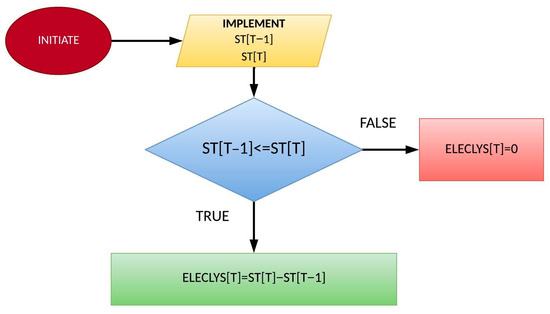
Figure 12.
Hourly green hydrogen production through successfully stored electrolysis.
In order to estimate the current annual CO2 emissions derived from diesel and mazut, the data were used in [38] and presented in Table 7. Since the data concern the year 2021, the assumption being made is that the energy mix has not deviated significantly in the span of 2 years.

Table 7.
Mixed energy sources of Crete in 2021.
Using Table 7, the shares of the two fuels of the total conventional production are estimated. This is achieved by estimating the efficiency of the two fuels, which is calculated using Table 8 and [39]. Similarly to Table 7, the contents of Table 8, which concern the year 2020, are assumed to remain relatively the same in 2023.

Table 8.
Electricity generation and consumption for the two fuels for the Cretan system in 2020.
Figure 13 computes the combined hourly contribution of the diesel and Mazut power plants for each hour of the simulation.
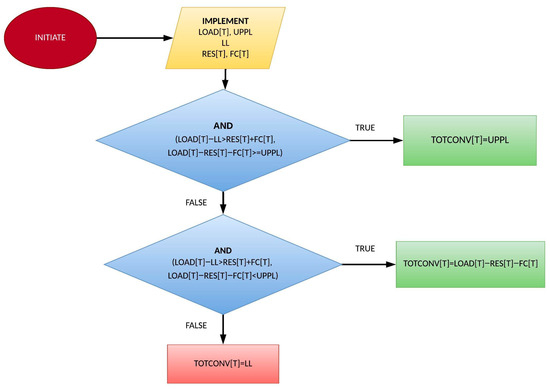
Figure 13.
Power plant system’s total hourly contribution.
To estimate the annual carbon emissions generated during the simulation, the emission factors of diesel and Mazut were used ([40,41]) to calculate the annual CO2 production, as presented in Table 9.

Table 9.
Emission factors for the two fuels.
By referring to Figure 13 and Table 7 and Table 9, the annual emissions can be calculated as the percentage of each fuel’s contribution to the total power plant production multiplied by their respective emission factor under the assumption of identical fuel participation in 2023. Equation (2) represents this relationship.
The system’s emissions are linearly correlated to the annual energy produced by the conventional system, which can be decreased down to the total sum of the hourly lower limit, a crucial aspect to be commented on in the appropriate section.
The calculation of the energy import needed to fulfill the remaining demand is depicted in Figure 14. To ensure the simulation’s hourly power balance, the imported energy is equal to the amount needed if all other measures do not suffice. The imports are attributed with the least priority, opting for their removal after the optimization process.
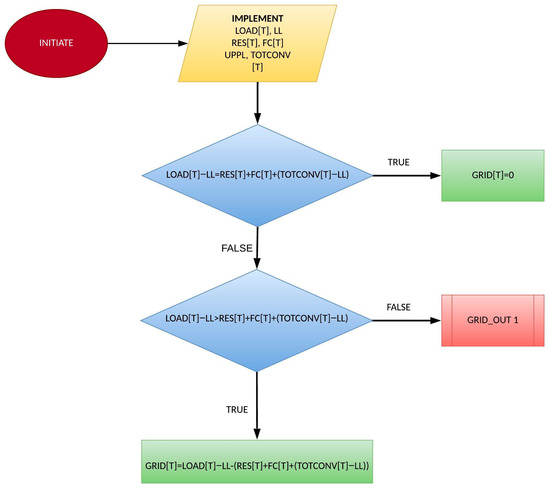
Figure 14.
Imports from the Peloponnese–Crete interconnection.
In contrast to imports, exported energy is constrained by the capacity of the interconnection, which imposes an upper limit. The constraint is especially useful in case of extended renewable energy production, particularly from PV and WT systems, that could substantially increase during periods of intense sunlight and wind. Such limitation would turn out to be crucial, as surplus energy can be directed towards hydrogen production or rejected energy, which cannot be utilized by the system. From a financial perspective, this may also be advantageous, especially if revenue from selling green hydrogen exceeds that from exporting electricity via the interconnection, which often fluctuates in price according to the country’s energy exchange.
The calculation of surplus energy sold to the main grid is illustrated in both Figure 15 and Figure 16. The algorithm has been divided into two images to improve readability.
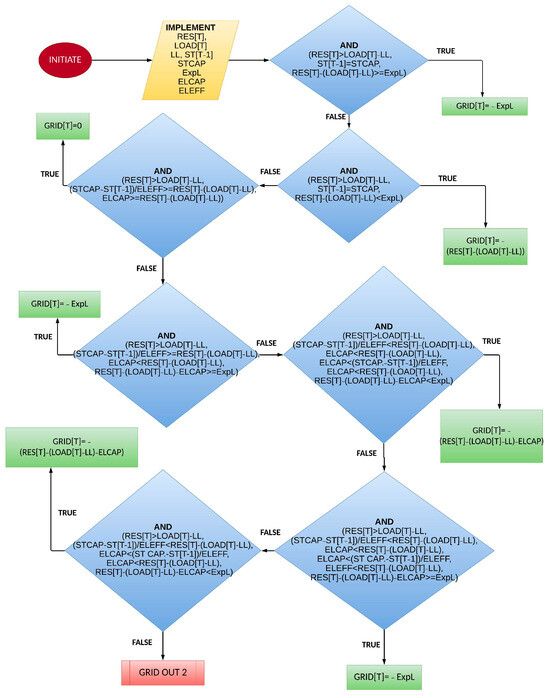
Figure 15.
Power exported to the mainland through the interconnection (1st half).
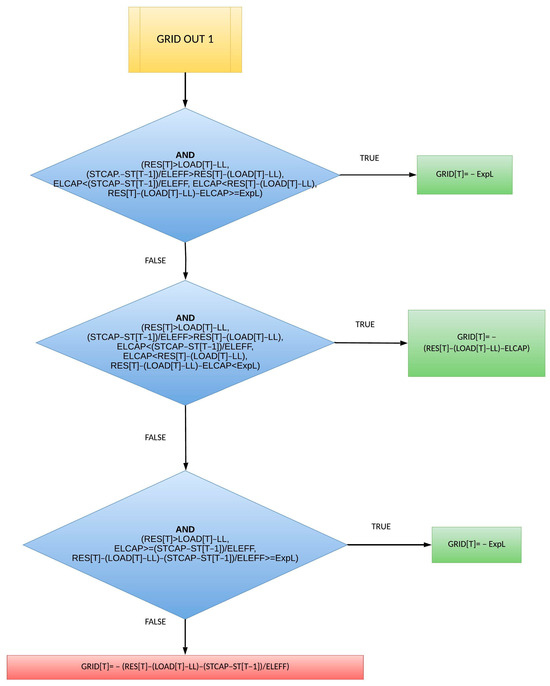
Figure 16.
Power exported to the mainland through the interconnection (2nd half).
If the electrolyzed energy has not reached its nominal value, the remaining energy is utilized for hydrogen production intended for industrial purposes, a crucial part of the business scheme, as it is the main contributor to the system’s financial gain. The quantity is determined as illustrated in Figure 17.
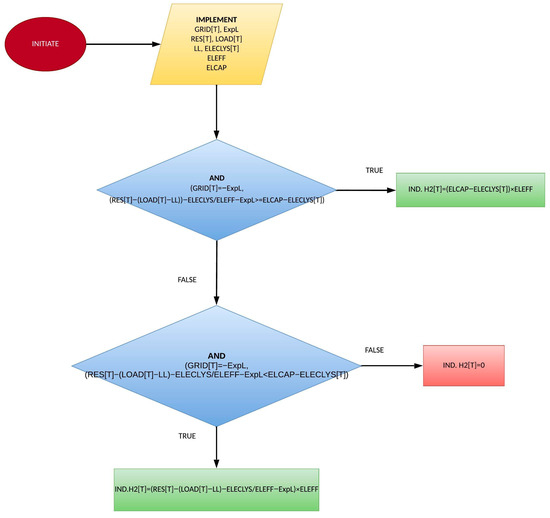
Figure 17.
Hydrogen produced and sold for industrial purposes, calculated in energy units.
The calculation of the mass of hydrogen produced (in kilograms) requires the use of the lower heating value of hydrogen (LHV H2) set at 33.33 kWh/kg. The resultant mass of hydrogen to be compressed for sale is then determined using Equation (3):
Losses are attributed solely to the hydrogen system. Losses associated with electricity production and transmission from RES and the conventional system are considered negligible due to their minimal impact on the overall efficiency. Additionally, the transmission losses through the interconnection are regarded as practically nonexistent, given the high efficiency involved in the interconnection infrastructure. This assumption simplifies the analysis by focusing on the most significant source of energy loss, the hydrogen system.
Figure 18 provides a quantification of the losses linked to the operation of the electrolyzer and/or fuel cell system.
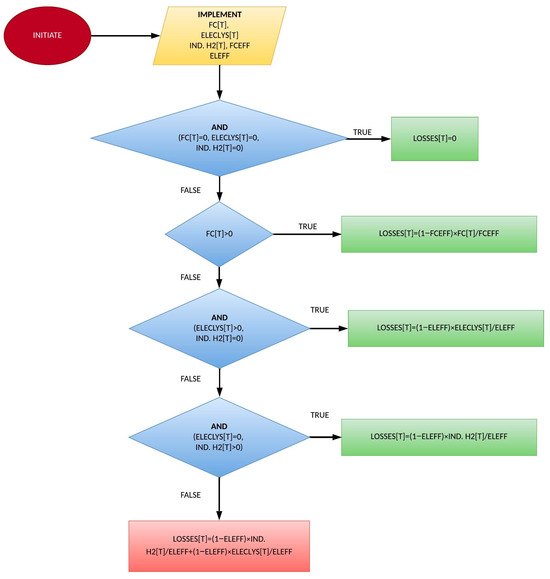
Figure 18.
Hourly energy system’s losses attributed to electrolysis or fuel cell use.
The limited hydrogen storage, export capacity of the interconnection, and maximum hourly capacity of the electrolyzer system imply the possibility of rejection of RES production in case of surplus. The annual rejections of the system are considered an important metric of the design’s efficiency. High rates of rejections imply RES installation that neither contributes to the island’s electricity demand nor is exported through the interconnection, therefore failing to contribute financially. Combined with their high cost of installation and maintenance, they could potentially burden the expenses of the investment needlessly.
The flowchart in Figure 19 details the methodology used to estimate the system’s rejected power per operating hour, ensuring power balance for all hours of the simulation:
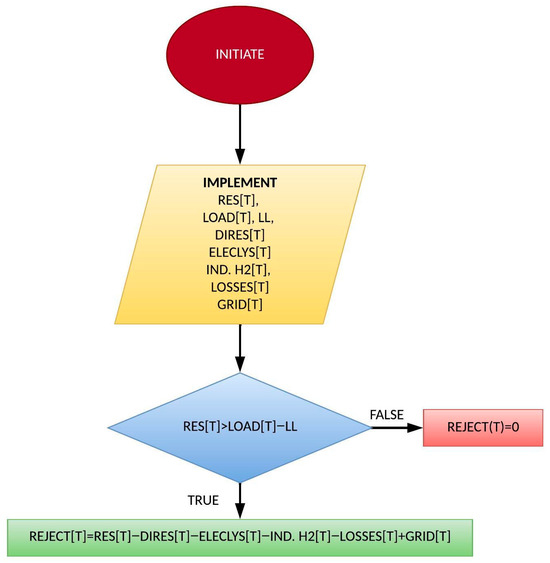
Figure 19.
Total RES production rejected from the system after each hour.
After computing the hourly values to simulate the system’s operation, the sustainability metrics utilized encompass the assessment of capital expenditure and net present value. This evaluation leverages the prices associated with the necessary components for investment and consumable costs, as detailed in Table 10. Using as reference [42,43], Table 10 lists inverters necessary for converting DC current generated by PV, WT, and the fuel cell system into AC current, as well as a compressor for compressing electrolysis-produced green hydrogen and storing it in suitable hydrogen tanks.

Table 10.
Investment-related costs.
The interconnection price is determined to be equivalent to the HEnEx Market Clearing Price (MCP) published in the HEnEx platform for each hour of the year, denoted in EUR/MWh, to which Crete, like all market participants, is subject.
The expected lifespans of the fuel cell and electrolyzer system are estimated to be 10 years, whereas those of PV and WT are projected to be 20 years. Using Table 10, the NPV is calculated using Equation (4):
The CAPEX comprises the costs associated with the PV and WT installation, coupled with inverters and the hydrogen system, which includes the electrolysis system, fuel cell system, hydrogen tank, inverter connected to the fuel cell, and compressor.
Cash inflows comprise revenue generated from exported energy, calculated by multiplying the exported energy amount by the interconnection price, along with income from hydrogen sales, determined by multiplying the quantity of hydrogen sold (in metric tons) by its price. Conversely, cash outflows encompass expenses such as grid import costs, fuel expenses for conventional system operation, total operational and maintenance costs of the RES system (estimated as an annual percentage of the installation cost), as well as operational and maintenance (O&M) costs of the hydrogen system.
The carbon neutrality metrics are calculated through the estimation of carbon emissions produced by energy production, transport and residential heating, and carbon absorption through the island’s primary cultivation. Along with the system’s emissions, the island absorbs the carbon emissions at a certain rate through the natural process of carbon sequestration. According to [44], olive tree is the dominant cultivated tree in Crete, occupying an area of 142,900 ha. The same reference presents the annual absorption of CO2 from olive groves and annual emission for heating purposes in residences, while [45] presents the annual generation of CO2 for transportation within the island’s road grid. The data are compiled in Table 11.

Table 11.
Annual carbon emission and absorption in Crete for 2018.
Table 11 outlines the overall emissions attributed to electricity production for achieving net zero carbon in Crete. In the proposed simulation without hydrogen storage, emissions are estimated to amount to 920,138.9 tCO2. The objective is to align the emissions from all three activities (electricity generation, residential heating, and transportation) with the annual absorption rate from olive groves.
To achieve that goal, an optimization model is formulated, using as the model’s decision variables the PV installed capacity (), WT capacity () to be installed in order to increase the annual RES production, the capacity of the electrolyzer system (ELCAP), and the storage capacity (in energy units) of the hydrogen tank (STCAP), serving as storage method for the compressed hydrogen gas stemming from electrolysis. The installed capacity of the fuel cell is selected to be equal to the capacity of the electrolyzer.
The objective is to decrease CO2 emissions from the energy system to match the disparity between emissions from heating and transportation and carbon absorption. Consequently, the objective function represents the annual CO2 emissions generated by electricity production, computed using Equation (2). The constraints encompass the positivity of decision variables and zero NPV to determine the CAPEX required for the long-term sustainability of the system. In essence, the optimization problem is structured as follows:
Subject to the constraints:
The emissions of the energy system, determined by Equation (2), rely on the values of TOTAL CONV[T]. The conditional computation of these values introduces a non-linear attribute to the objective function.
The simulation is conducted within a specific scenario where the technical lower and upper limits of total conventional production are set to the minimum and maximum values observed in the time series depicted in Figure 3. Additionally, the maximum hourly power import or export through the interconnection is set at 150 MW, and the initial storage of the tank equals its capacity. The chosen fuel cell technology is the PEM fuel cell, with an overall efficiency of 60% and electrolysis efficiency of 80%.
3. Results
Prior to commencing the optimization process, the initial solution values are outlined in Table 12.

Table 12.
Initial solution.
The implementation of the methodology produces the values of the decision variables and the system’s metrics, as illustrated in Table 13.

Table 13.
Optimal solution and results.
The optimal energy system’s annual emissions are estimated at 279,358.2 tCO2. For the specific solution, the island’s energy mix is illustrated in Figure 20:
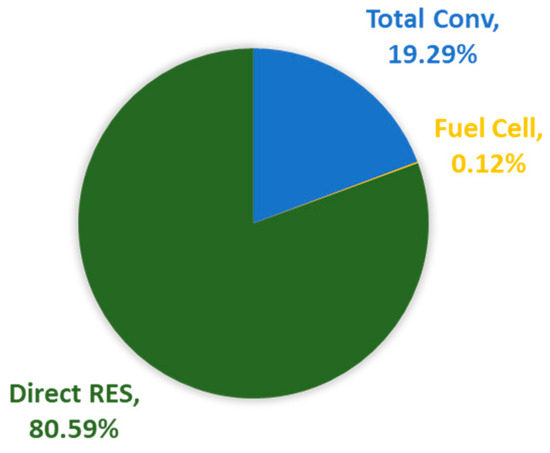
Figure 20.
Optimal energy mix of Crete.
The methodology has effectively eradicated imports through the interconnection, rendering the island self-sufficient. The extensive expansion of RES ensures that the majority of the load is met through Direct RES production, with conventional sources minimized to an average hourly contribution equal to 69.1 MW, slightly above their hourly lower technical limits. The utilization of fuel cells is rare, occurring only for a few hours annually when RES production proves insufficient due to weather conditions.
On a monthly basis, Figure 21 illustrates the energy mix for the load time series of 2023.
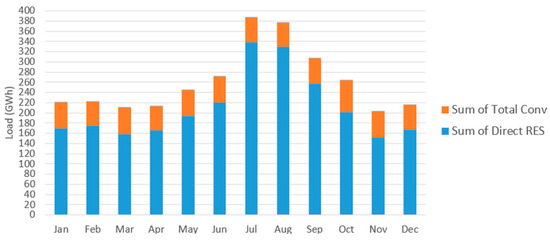
Figure 21.
Optimal monthly energy mix for 2023.
The main contribution stems from Direct RES generation, while total conventional production operates mostly at its lower technical limit. This implies that additional conventional reduction would necessitate the shutdown of power plants, facilitating further penetration of RES and leading to a subsequent reduction in CO2 emissions.
The annual RES production is shown in Figure 22 as percentage shares:
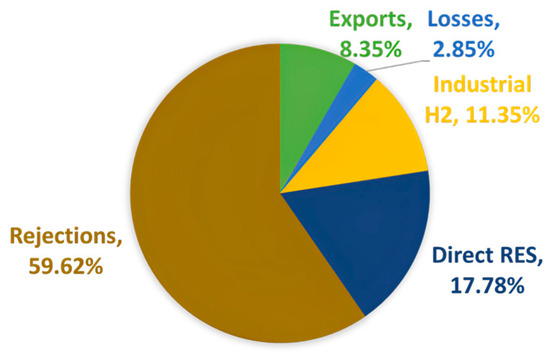
Figure 22.
Optimal RES allocation for 2023.
In a scenario where RES production is exceptionally high, there is almost zero electrolysis leading to storage (0.05%). Instead, electrolysis serves almost exclusivelyfor conversion to industrial hydrogen, with the majority of the produced energy being rejected, rendering the system inefficient. This underscores a mismatch between energy supply and demand, highlighting the need for achieving the desired goals with means other than the expansion of the installed capacity of RES to this extent.
On a monthly basis, Figure 23 shows the monthly production, mostly comprised of rejections of the system.
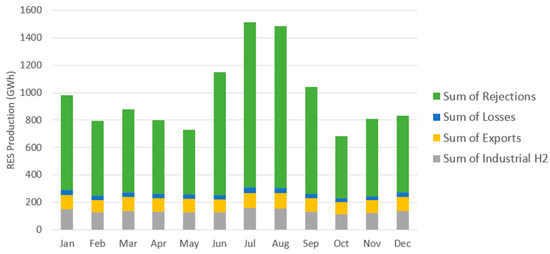
Figure 23.
Optimal monthly RES allocation for 2023.
Despite the substantial profits estimated, the optimized system fails to manage the surplus energy produced in a financially viable manner, as production significantly exceeds the island’s total consumption.
The initial capital expenditure for the optimal solution is presented in Figure 24, demonstrating the ratio of RES system expenditure to the hydrogen system cost.
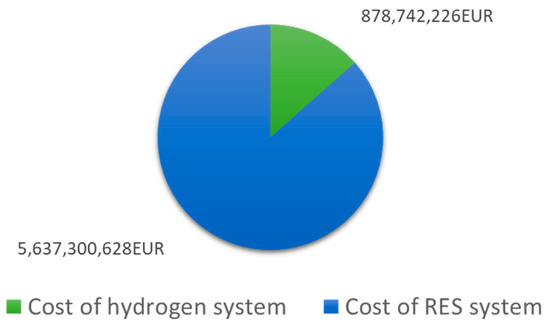
Figure 24.
Capital expenditure for the RES system’s expansion and hydrogen system’s installation.
The majority of the costs stem from the expansion of RES, primarily due to the high installed capacities and elevated costs in comparison to the components of the hydrogen system.
The annual cashflows for the entirety of the investment’s lifespan are presented in Figure 25, presenting the most impactful contributors to the business model’s operation:
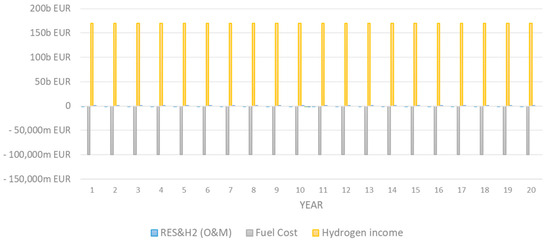
Figure 25.
Estimated annual cashflows for 20 years of operation.
In a scenario where the income from hydrogen sales surpasses any maintenance or consumable costs, assuming an infinite demand for hydrogen mass, the system appears financially robust. Interestingly, the interconnection plays a negligible role, neither utilized for imports nor serving as a significant source of income. Throughout each year, inflows and outflows remain relatively constant, excluding the tenth year when replacement of the electrolyzer and fuel cell system becomes necessary. Despite the need for replacement, the overall investment presents a profitable outlook, albeit within a strictly defined context.
4. Discussion
The methodology emphasized the island’s autonomy from the mainland grid and aimed to optimize specified targets within specific constraints, resulting in independence from the mainland grid, pursuing, at the same time, sustainability and smooth operation over the project’s 20-year lifespan. However, the calculated CAPEX relied on assumptions such as constant MCP values, stable fuel and hydrogen prices, and unlimited demand for industrial hydrogen. Any deviation or flexibility in these assumptions could result in a negative NPV. Moreover, despite the failure to achieve carbon-neutral operation, the proposed system could only meet one of the three requirements since the estimated CAPEX exceeds the total funding for projects related to RES and hydrogen systems in Crete ([46,47]). Therefore, the proposed methodology is infeasible under the specified conditions. However, the methodology presented in this paper for achieving net zero carbon emissions in a microgrid transcends the specific case study and offers a versatile framework applicable to a broader spectrum of microgrid configurations. Its strength lies in its ability to integrate existing energy sources, like RES, hydrogen, and conventional units, with a customized fuel mix of various emission factors. The implementation also extends to future advancements in diversified energy generation and the emerging hydrogen market. This adaptability acknowledges the dynamic nature of the energy landscape, where new, environmentally friendly sources are constantly developed. By incorporating these potential additions, the methodology can be continuously optimized to maintain zero carbon emissions in microgrids with diverse energy mixes (e.g., biomass and geothermal energy) and fluctuating fuel prices.
Future research will focus on pursuing the three specified requirements by introducing a hybrid storage system comprising lithium batteries and green hydrogen storage. This approach would allow for increased penetration of RES without the high costs associated with PV and WT installations or significant amounts of rejected energy. This is also crucial for the investigation of any financial feasibility to map the current market state of hydrogen supply and demand, as well as current supply routes and methods. Additionally, a more detailed estimation of carbon absorption on the island would lead to more precise environmental targets and evaluation metrics. Moreover, carbon capture and storage (CCS) technologies should be explored as more reliable alternatives to carbon sequestration for achieving a net-zero carbon footprint on islands, aiming to enhance the logistical sustainability of the system.
5. Conclusions
This paper examines the feasibility of a standalone energy system for Crete, relying on hydrogen-based storage infrastructure. The suggested energy system prioritizes consumption coverage through renewable energy production, local fuel cell production using green hydrogen, and conventional production from locally produced Mazut and diesel power plants, supplemented by imports via the mainland grid interconnection. Surplus energy generation is earmarked for storage as green hydrogen is produced through electrolysis, either for future use or potential sale. The system’s optimal sizing is determined using financial and environmental metrics, such as NPV and carbon neutrality. Carbon neutrality is pursued by balancing emissions from transportation, residential heating, and energy production with absorption through carbon sequestration in olive groves. This study highlights the significant research idea of enhancing renewable energy integration in islands, particularly focusing on Crete, to reduce carbon emissions and fossil fuel consumption. The research achievement lies in proposing a method to boost the use of renewable energy sources, contributing to the European goal of achieving carbon neutrality by 2050. The methodology fails to introduce a feasible sizing for the proposed installation that meets all objectives. Yet, its high level of replicability justifies the study of the installation under these conditions. This study underscores the pivotal role of islands in pioneering renewable energy systems and emphasizes the importance of transitioning towards sustainable energy solutions to combat climate change effectively.
Author Contributions
Conceptualization, E.K. and I.M.; methodology, I.M. and M.N.; validation, E.K., I.M., M.N., and A.T.; formal analysis, I.M. and M.N.; investigation, I.M. and M.N.; resources, I.M. and M.N.; writing—original draft preparation, I.M. and M.N.; writing—review and editing, I.M., M.N., and E.K.; visualization, M.N.; supervision, E.K.; project administration, E.K. All authors have read and agreed to the published version of the manuscript.
Funding
This research received no external funding.
Institutional Review Board Statement
Not applicable.
Informed Consent Statement
Not applicable.
Data Availability Statement
The original data regarding Crete’s participation in the HEnEx presented in the study are openly available at https://www.enexgroup.gr/web/guest/markets-publications-el-day-ahead-market (accessed on 5 May 2024). The data regarding fuel prices are publicly available at http://oil.gge.gov.gr/. The recorded data of photovoltaic and wind park production are not publicly accessible as they were shared in confidence by the relevant stakeholders.
Conflicts of Interest
The authors declare no conflicts of interest.
Nomenclature
| Symbol | Description | Unit |
| CAPEX | Capital Expenditure | EUR |
| Cashflows(i) | Sum of the investment’s total expenses and income in year i | EUR |
| CC | Combined Cycle | - |
| CCS | Carbon Capture and Storage | - |
| CRETE RES[T] | Cretan RES production recorded in hour T | MWh |
| DIRES[T] | RES production on load in hour T | MW |
| ELCAP | Electrolyzer System’s hourly maximum H2 production | MWh |
| ELECLYS[T] | Electrolyzer System’s hourly H2 production in hour T | MWh |
| ELEFF | Electrolyzer System’s overall efficiency | - |
| ExpL | Maximum hourly energy exported | MWh |
| GRID[T] | Total energy imported/exported in hour T | MWh |
| FC[T] | Fuel Cell System’s electricity production in hour T | MWh |
| F.C. CAP. | Fuel Cell System’s hourly maximum electricity production | MWh |
| F.C. EFF. | Fuel Cell System’s overall efficiency | - |
| HEnEx | Hellenic Energy Exchange | - |
| HPS | Hydropower Pumped Storage | - |
| Produced H2 for sale in mass units | kg | |
| IND. H2[T] | Produced H2 for sale in energy units | MWh |
| LHV | Lower Heating Value | - |
| LL | Conventional System’s Technical Lower Limit | MW |
| LOAD[T] | System’s Demand in hour T | MW |
| LOSSES[T] | Hydrogen System’s total losses in hour T | MWh |
| MCP | Market Clearing Price | - |
| NPV | Net Present Value | EUR |
| PEM | Proton Exchange Membrane | - |
| PV | Photovoltaic | - |
| PV system’s installed capacity | MW | |
| r | Annual Discount Rate | - |
| REJECT[T] | RES production’s rejected energy | MWh |
| RES | Renewable Energy Sources | - |
| RES[T] | RES electricity production in hour T | MWh |
| RES O&M cost | Operation and Maintenance cost of RES system | EUR |
| SG | Smart Grid | - |
| ST[T] | Hydrogen Tank’s State of Charge in hour T | MWh |
| STCAP | Hydrogen Tank’s storage capacity | MWh |
| Total O&M cost | RES and hydrogen systems’ operation and maintenance cost | EUR |
| TOTCONV[T] | Conventional System’s total production in hour T | MWh |
| UPLL | Conventional System’s Technical Upper Limit | MW |
| V2G | Vehicle to Grid | - |
| WT | Wind Turbine | - |
| Wind turbine system’s total installed capacity | MW |
References
- Sun, J.; Sun, H.; Jiang, J. An Improved Modulation Method for Low Common-Mode Current Non-Isolated Series Simultaneous Power Supply Dual-Input Inverters for New Energy Generation Applications. Electr. Eng. 2024. [Google Scholar] [CrossRef]
- Jha, A.V.; Ghazali, A.N.; Appasani, B.; Ravariu, C.; Srinivasulu, A. Reliability analysis of smart grid networks Incorporating hardware failures and packet loss. Rev. Roum. Des. Sci. Tech. 2021, 65, 245–252. [Google Scholar]
- Allen, M.R.; Dube, O.P.; Solecki, W.; Aragón-Durand, F.; Cramer, W.; Humphreys, S.; Kainuma, M.; Kala, J.; Mahowald, N.; Mulugetta, Y.; et al. IPCC Special Report on Global Warming of 1.5 °C; Cambridge University Press: Cambridge, UK; New York, NY, USA, 2018; pp. 49–92. [Google Scholar] [CrossRef]
- Yaqoob, S.J.; Motahhir, S.; Agyekum, E.B. A New Model for a Photovoltaic Panel Using Proteus Software Tool under Arbitrary Environmental Conditions. J. Clean. Prod. 2022, 333, 130074. [Google Scholar] [CrossRef]
- Wei, Y.; Sun, H.; Zhang, T.; Jiang, J.; Su, X.; Zeng, N. Study of Inductively Coupled Fuel Cell DMPPT Converters. Electr. Eng. 2024. [Google Scholar] [CrossRef]
- Zhang, C.; Cao, C.; Chen, R.; Jiang, J. Three-Leg Quasi-Z-Source Inverter with Input Ripple Suppression for Renewable Energy Application. Energies 2023, 16, 4393. [Google Scholar] [CrossRef]
- Vourdoubas, J. Creation of Net Zero Carbon Emissions Residential Buildings due to Energy use in the Mediterranean Region: Are they Feasible? Civ. Eng. Res. J. 2020, 10, 555777. [Google Scholar]
- Directorate-General for Climate Action. Going Climate-Neutral by 2050: A Strategic Long Term Vision for a Prosperous, Modern, Competitive and Climate Neutral EU Economy; European Commission: Brussels, Belgium, 2019. [Google Scholar] [CrossRef]
- Juswanto, W.; Ali, Z. Renewable energy and sustainable development in Pacific Island countries. In Proceedings of the Pacific Update Conference: Inclusive Growth for Enhanced Resilience, Suva, Fiji, 18–19 July 2016; Available online: https://www.adb.org/sites/default/files/publication/215216/adbi-pb2016-5.pdf (accessed on 5 February 2021).
- Meschede, H.; Bertheau, P.; Khalili, S.; Breyer, C. A Review of 100% Renewable Energy Scenarios on Islands. WIREs Energy Environ. 2022, 11, e450. [Google Scholar] [CrossRef]
- International Renewable Energy Agency (IRENA). A Path to Prosperity: Renewable Energy for Islands. In Proceedings of the Framework Convention on Climate Change, Marrakesh, Morocco, 7–18 November 2016. Available online: https://www.irena.org/-/media/Files/IRENA/Agency/Publication/2016/IRENA_Path_to_Prosperity_Islands_2016.pdf (accessed on 5 February 2021).
- Bunger, J. Renewable Energy Islands in Europe. In Proceedings of the European Seminar on Renewable Energy Islands, Samso Island, Denmark, 29–30 June 1998; Available online: https://www.osti.gov/etdeweb/servlets/purl/317117 (accessed on 5 February 2021).
- Marczinkowski, H.; Alberg Østergaard, P.; Roth Djørup, S. Transitioning Island Energy Systems—Local Conditions, Development Phases, and Renewable Energy Integration. Energies 2019, 12, 3484. [Google Scholar] [CrossRef]
- Marczinkowski, H.M.; Barros, L. Technical Approaches and Institutional Alignment to 100% Renewable Energy System Transition of Madeira Island—Electrification, Smart Energy and the Required Flexible Market Conditions. Energies 2020, 13, 4434. [Google Scholar] [CrossRef]
- Chatziargiriou, N.; Margaris, I.; Dimeas, A. Renewable Energy Developments in Greek Islands; Friedrich Ebert Stiftung: Athens, Greece, 2016; Available online: https://library.fes.de/pdf-files/bueros/athen/13050.pdf (accessed on 9 March 2023).
- Refsgaard, K.; Kull, M.; Bogason, Á.; Salolammi, P.; Slätmo, E.; Zelenkauskė, M. Carbon Neutral Islands; Nordregio Projects: Stockholm, Sweden, 2021; Available online: https://nordregioprojects.org/carbon-neutral-islands/ (accessed on 9 March 2023).
- Breyer, C.; Bogdanov, D.; Ram, M.; Khalili, S.; Vartiainen, E.; Moser, D.; Román Medina, E.; Masson, G.; Aghahosseini, A.; Mensah, T.N.O.; et al. Reflecting the Energy Transition from a European Perspective and in the Global Context—Relevance of Solar Photovoltaics Benchmarking Two Ambitious Scenarios. Prog. Photovolt. 2023, 31, 1369–1395. [Google Scholar] [CrossRef]
- Vourdoubas, J. Use of renewable energy sources for energy generation in rural areas in the island of Crete, Greece. Eur. J. Environ. Earth Sci. 2020, 1, 1–7. [Google Scholar] [CrossRef]
- Biza, S.; Piromalis, D.; Barkas, D.; Psomopoulos, C.S.; Tsirekis, C.D. Crete—Peloponnese 150kV AC Interconnection. Simulation Results for Transient Phenomena in Main Switches. Energy Procedia 2019, 157, 1366–1376. [Google Scholar] [CrossRef]
- Home|Ariadne Interconnection. Available online: http://www.ariadne-interconnection.gr/en (accessed on 16 April 2024).
- Tzanes, G.; Zafeiraki, E.; Papapostolou, C.; Zafirakis, D.; Konstantinos, M.; Kavadias, K.; Chalvatzis, K.; Kaldellis, J.K. Assessing the Status of Electricity Generation in the Non-Interconnected Islands of the Aegean Sea Region. Energy Procedia 2019, 159, 424–429. [Google Scholar] [CrossRef]
- Tsekeris, D.; The Energy Transition of the Greek Non-Interconnected Islands. Greek Minist. Environ. Energy 2019. Available online: https://hybridpowersystems.org/wp-content/uploads/sites/13/2019/06/1_1_HYB19_088_presentation_Tsekeris_Dimitris.pdf/ (accessed on 17 April 2024).
- Bertsiou, M.M.; Baltas, E. Power to Hydrogen and Power to Water Using Wind Energy. Wind 2022, 2, 305–324. [Google Scholar] [CrossRef]
- Rodrigues, A.; Machado, D.; Dentinho, T. Electrical Energy Storage Systems Feasibility; the Case of Terceira Island. Sustainability 2017, 9, 1276. [Google Scholar] [CrossRef]
- Nikolaou, T.; Stavrakakis, G.S.; Tsamoudalis, K. Modeling and Optimal Dimensioning of a Pumped Hydro Energy Storage System for the Exploitation of the Rejected Wind Energy in the Non-Interconnected Electrical Power System of the Crete Island, Greece. Energies 2020, 13, 2705. [Google Scholar] [CrossRef]
- Pompodakis, E.E.; Kryonidis, G.C.; Karapidakis, E.S. Optimizing the Installation of Hybrid Power Plants in Non-Interconnected Islands. J. Energy Storage 2023, 74, 109511. [Google Scholar] [CrossRef]
- Hellenic Electricity Distribution Network Operator (HEDNO) SA, Annual Financial Report 2020. Available online: https://deddie.gr/media/36008/annual-financial-report-2020-%CE%B1%CE%B3%CE%B3%CE%BB%CE%B9%CE%BA%CE%B1.pdf (accessed on 15 April 2024).
- Day-Ahead Market—EnExGroup. Available online: https://www.enexgroup.gr/web/guest/markets-publications-el-day-ahead-market (accessed on 5 May 2024).
- IPTO (Independent Power Transmittion Operator). Available online: https://www.admie.gr/erga/erga-diasyndeseis/diasyndesi-tis-kritis-me-tin-peloponniso (accessed on 15 April 2024).
- Al-Shetwi, A.Q.; Hannan, M.A.; Jern, K.P.; Alkahtani, A.A.; Pg Abas, A.E. Power Quality Assessment of Grid-Connected PV System in Compliance with the Recent Integration Requirements. Electronics 2020, 9, 366. [Google Scholar] [CrossRef]
- CO2 Emissions (Metric Tons per Capita)—Greece. Available online: https://data.worldbank.org/indicator/EN.ATM.CO2E.PC?locations=GR (accessed on 3 April 2024).
- Katsaprakakis, D.; Antonakakis, I.; Dakanali, I.; Christakis, D. Turning Crete into an energy independent island. In Proceedings of the 4th International Hybrid Power Systems Workshop, Agia Pelagia Crete, Greece, 22–23 May 2019; Available online: https://www.researchgate.net/publication/333701601_Turning_Crete_into_an_energy_independent_island (accessed on 3 April 2024).
- Takatsu, N.; Farzaneh, H. Techno-Economic Analysis of a Novel Hydrogen-Based Hybrid Renewable Energy System for Both Grid-Tied and Off-Grid Power Supply in Japan: The Case of Fukushima Prefecture. Appl. Sci. 2020, 10, 4061. [Google Scholar] [CrossRef]
- Su, W.; Zheng, W.; Li, Q.; Yu, Z.; Han, Y.; Bai, Z. Capacity Configuration Optimization for Green Hydrogen Generation Driven by Solar-Wind Hybrid Power Based on Comprehensive Performance Criteria. Front. Energy Res. 2023, 11, 1256463. [Google Scholar] [CrossRef]
- Sharma, S.; Agarwal, S.; Jain, A. Significance of Hydrogen as Economic and Environmentally Friendly Fuel. Energies 2021, 14, 7389. [Google Scholar] [CrossRef]
- Jadhawar, P.; Saeed, M. Optimizing the Operational Efficiency of the Underground Hydrogen Storage Scheme in a Deep North Sea Aquifer through Compositional Simulations. J. Energy Storage 2023, 73, 108832. [Google Scholar] [CrossRef]
- Shiva Kumar, S.; Himabindu, V. Hydrogen Production by PEM Water Electrolysis—A Review. Mater. Sci. Energy Technol. 2019, 2, 442–454. [Google Scholar] [CrossRef]
- Karapidakis, E.; Mozakis, I.; Iliadis, I. Ultra-High Share of Renewable Energy Sources in Interconnected Island Systems. In Proceedings of the International Conference on Electronics, Engineering Physics and Earth Science (EEPES’23), Kavala, Greece, 21–23 June 2023; p. 15. [Google Scholar]
- Available online: https://www.admie.gr/en/market/market-statistics/detail-data?process%5B0%5D=529&data_type%5B0%5D=518&since=&until=&op=Submit&_wrapper_format=html&page=4 (accessed on 14 May 2024).
- Brigitte, K.; Alessandro, C.; Marlene, D.; Andreea, I.; Albana, K.; Greet, J.-M. CoM Default Emission Factors for the Member States of the European Union—Version 2017, European Commission, Joint Research Centre (JRC) [Dataset]. 2017. Available online: http://data.europa.eu/89h/jrc-com-ef-comw-ef-2017 (accessed on 15 April 2024).
- Klimenta, D.; Mihajlović, M.; Ristić, I.; Andriukaitis, D. Possible Scenarios for Reduction of Carbon Dioxide Emissions in Serbia by Generating Electricity from Natural Gas. Energies 2022, 15, 4792. [Google Scholar] [CrossRef]
- Available online: http://oil.gge.gov.gr/ (accessed on 2 May 2024).
- Ahmed, A.; Pompodakis, E.E.; Katsigiannis, Y.; Karapidakis, E.S. Optimizing the Installation of a Centralized Green Hydrogen Production Facility in the Island of Crete, Greece. Energies 2024, 17, 1924. [Google Scholar] [CrossRef]
- Vourdoubas, J. Estimation of Carbon Sequestration from Olive Tree Groves in the Island of Crete, Greece. Int. J. Agric. Environ. Res. 2018, 6, 560. [Google Scholar] [CrossRef]
- Vourdoubas, J. Studies on the Electrification of the Transport Sector in the Island of Crete, Greece. OJEE 2018, 7, 19–32. [Google Scholar] [CrossRef]
- Available online: https://cordis.europa.eu/project/id/101112169 (accessed on 14 May 2024).
- Available online: https://energypress.eu/nsrf-support-worth-over-e40m-announced-for-energy-communities/ (accessed on 14 May 2024).
Disclaimer/Publisher’s Note: The statements, opinions and data contained in all publications are solely those of the individual author(s) and contributor(s) and not of MDPI and/or the editor(s). MDPI and/or the editor(s) disclaim responsibility for any injury to people or property resulting from any ideas, methods, instructions or products referred to in the content. |
© 2024 by the authors. Licensee MDPI, Basel, Switzerland. This article is an open access article distributed under the terms and conditions of the Creative Commons Attribution (CC BY) license (https://creativecommons.org/licenses/by/4.0/).