Article

Fragility Analysis of Step-Terrace Frame-Energy Dissipating Rocking Wall Structure in Mountain Cities

1
Key Laboratory of Education Ministry for Construction and New Technology of Mountain Cities, Chongqing University, Chongqing 400045, China
2
College of Civil Engineering, Chongqing University, Chongqing 400045, China
*
Author to whom correspondence should be addressed.
Appl. Sci. 2024, 14(11), 4731; https://doi.org/10.3390/app14114731
Submission received: 17 April 2024 / Revised: 24 May 2024 / Accepted: 27 May 2024 / Published: 30 May 2024
(This article belongs to the Section Civil Engineering)

Abstract

:
Rocking walls can control the overall deformation pattern and the distribution of plastic energy dissipation in structures, suppressing the occurrence of weak layers. In the case of step-terrace frame structures, issues such as severe lateral stiffness irregularities, abrupt changes in floor-bearing capacity, and concentrated deformation in upper ground layers exist. To improve the yielding and failure modes of step-terrace frame structures in mountainous regions, this paper proposes a structural system combining step-terrace frame structures with energy dissipation rocking walls attached to their bottoms, aiming to control the yielding mechanism of the structure, further reduce the seismic response, limit residual deformation, and propose a structural system of step-terrace frame structures with buckling-restrained braces (BRBs) and energy dissipation rocking walls. Two sets of numerical models for step-terrace frame structures with different numbers of dropped layers and spans were established. Through simulating low-cycle repeated loading tests on step-terrace frame structures, the rationality of the models and parameters was verified. Incremental dynamic analysis (IDA) was employed to systematically investigate the vulnerability of step-terrace frame structures with energy dissipation rocking walls under different dropped layer and span configurations. This investigation covered aspects such as IDA curve clusters, percentile curves, seismic demand models, fragility functions, failure state probabilities, vulnerability indices, collapse resistance factors, and safety margins. The results indicated that the change in dropped layer numbers had a far greater impact on the vulnerability of step-terrace frame structures with energy dissipation rocking walls than the change in dropped span numbers. Under seismic excitations with the same peak ground acceleration (PGA), rocking walls can limit the depth of structural plasticity development, reduce the dispersion of peak responses, and lower the probability of exceeding various performance levels, thereby exhibiting good collapse resistance. The addition of buckling-restrained braces (BRBs) can further enhance the seismic performance and collapse resistance of the rocking wall frame structure. By analyzing the correlation between seismic intensity measures and peak structural responses, the validity of using peak ground acceleration as a scaling indicator for incremental dynamic analysis (IDA) has been verified.

1. Introduction

Due to the vertical irregularity, step-terrace frame structures in mountainous regions experience abrupt changes in structural stiffness, leading to significant differences in stress and deformation characteristics compared to conventional building structures. These structures also exhibit two types of vertical irregularities, as listed in relevant codes: lateral stiffness irregularity and sudden changes in floor-bearing capacity, which are inherent and difficult to adjust [1]. Previous studies have shown that the failure of step-terrace frame structures in mountainous regions mainly occurs in the upper ground layers, where weak layers are located, often adjacent to the upper ground layers. The presence of weak layers makes the column ends of upper ground columns highly susceptible to plastic hinges, resulting in yielding and failure at the layer interfaces [2]. Narayanan et al. [3] conducted a field survey on building damage after the Sikkim earthquake and found that the extent of damage and the collapse rate of frame structures with soft stories were significantly more severe than those of other regular frame structures on flat ground. Investigations following seismic events, such as the 12 May Wenchuan earthquake, have revealed varying degrees of damage to mountainous building structures. Figure 1 illustrates typical damage to mountainous building structures caused by the Wenchuan earthquake [4]. The distribution of plastic hinges in low-cycle repeated loading tests on step-terrace frame structures is depicted in Figure 2 [5]. In the figure, circles represent sections where hinges occurred, with solid circles indicate yielding on both sides of the section (upper and lower sides for beams, left and right sides for columns), while hollow circles indicate yielding on one side only. The numbers next to the circles indicate the sequence of appearance of plastic hinges on that section. Yingmin Li et al. [6] conducted comparative analyses through shake table testing on 1/8 scale step-terrace frame structures and typical frame structure models, both consisting of six stories. The seismic responses of the structures were evaluated. The experimental results indicated differences in mode shapes and slope-parallel deformations between step-terrace frame structures and typical frame structures. Moreover, the failure modes of step-terrace frame structures differ from those of typical frame structures, where the latter tend to exhibit partial floor yielding mechanisms. Welsh-Huggins et al. [7] suggested that increasing the shear bearing capacity and ductility of the upper ground floor of soft-story frame structures can enhance the overall seismic performance of the structure. Han Jun et al. [8] proposed that changing the support constraint method is one approach to improving the seismic performance of soft-story frame structures and recommended installing isolation or sliding bearings on the upper ground floor when there are many soft stories. Yang Youfa et al. [9], from the perspective of energy dissipation and damping, recommended installing viscous dampers in soft-story frame structures. Through shaking table tests, Zhang Longfei [10] and Wu Zhengjia [11] found that installing isolation bearings on both the upper and lower ground floors of hillside soft-story structures can significantly improve the seismic performance of these structures. Placing rocking walls on the upper ground side of step-terrace frame structures in mountainous regions can evenly distribute inter-story displacements, effectively improving the seismic performance of step-terrace frame structures [12,13] and reducing the concentration of damage in the upper ground layers [14]. Energy dissipation and seismic dampening techniques involve installing energy dissipation dampers at locations with significant structural deformations to artificially increase structural damping, dissipate seismic energy, and mitigate structural damage [15]. Combining swinging technology, replaceable technology, and seismic control technology forms the structural system of step-terrace frame structures with energy dissipation rocking walls. Changes in the number of tiers and spans result in alterations to the distribution of structural stiffness, affecting the seismic performance and vulnerability of the structure [16]. This paper establishes two sets of mountainous step-terrace frame structures with energy dissipation rocking walls, varying in the number of tiers and spans. Incremental dynamic analysis (IDA) is employed to investigate the impact of tier and span variations on the vulnerability of step-terrace frame structures with energy dissipation rocking walls. This investigation encompasses aspects such as IDA percentile curves, seismic probability models, fragility functions, failure state probabilities, vulnerability indices, and collapse resistance capabilities.

2. The Working Principle of Rocking Walls

In the rocking wall structure, the bottom constraints are relaxed, allowing the rocking walls to sway during an earthquake. This reduces the seismic response of the structure and effectively prevents concentrated deformation failure in frame structures under the “strong column–weak beam” scenario. Additionally, dampers can be installed at the rocking wall’s motion points to increase energy dissipation. This mitigates concentrated deformation in the structure, enhances energy absorption, and protects structural safety. Energy-dissipating components can be quickly replaced after an earthquake, restoring the structure’s functionality.
The working principle of rocking walls can be illustrated through a simple frame-rocking wall structure. The rocking wall is connected to the floors using connectors that only transfer shear forces. Rigid links are used instead of connectors, with the shear force transferred by the connectors being replaced by the axial force of the rigid links. The frame is simplified using a continuous method, considering only shear deformation, not bending deformation, and modeled as a shear beam with constant shear stiffness. Conversely, the rocking wall is simplified to consider only bending deformation and not shear deformation, modeled as a bending beam with constant flexural stiffness. It is assumed that the simplified beams of the frame and the rocking walls are tightly connected, with axial forces continuously distributed along the interface. The schematic diagram for the calculation is shown in Figure 3.
Let the lateral displacement of the frame and rocking wall axes be y ( x ) , where   x is the vertical direction along the simplified beam. The flexural stiffness of the rocking wall is E w I w . The shear stiffness of the frame is K , p ( x ) is the external load distribution, and the continuously distributed internal force between the rocking wall and the frame is p F ( x ) .
From the equilibrium of forces on the rocking wall, it can be obtained that:
E w I w d 4 y d x 4 = p ( x ) + K d 2 y d x 2
Introducing dimensionless parameters λ and ζ :
λ = H K E w I w
ζ = x H
Derive the general solution:
y = C 1 + C 2 ζ + A sinh λ ζ + B cosh λ ζ + y 0
where sin   h x is the hyperbolic sine function, cos h x is the hyperbolic cosine function, and y 0 is a particular solution of the differential equation:
sinh x = e x e x 2 cosh x = e x + e x 2
Write the expression for y ( x ) . Based on this expression, derive the bending moment and shear force of the rocking wall, as well as the shear force of the frame:
M w = E w I w d θ d x = E w I w H 2 d 2 y d ζ 2
V w = E w I w d 2 θ d x 2 = E w I w H 3 d 3 y d ζ 3
V F = K d θ = K d y d x
When the external load distribution is uniform p ( x ) = q , the boundary conditions of Equation (1) can be derived from the above formulas, as follows:
When x = H ( ζ = 1 ) , V = V w + V F = 0 .
When x = H ( ζ = 1 ) , M w = 0 .
When x = 0 ( ζ = 0 ) , M w = 0 .
When x = 0 ( ζ = 0 ) , y ( 0 ) = 0 .
The lateral displacement of the structure is obtained as follows:
y = q H 2 λ 2 K 1 + λ 2 ξ + 1 cosh λ sinh λ sinh λ ξ + cosh λ ξ λ 2 2 ξ 2
The bending moment of the rocking wall is:
M w = q H 2 λ 2 1 + 1 cosh λ sinh λ sinh λ ξ + cosh λ ξ
The shear force of the rocking wall is:
V w = q H λ 2 1 cosh λ sinh λ cosh λ ξ + sinh λ ξ
The shear force of the frame is:
V F = q H 1 + 1 cosh λ sinh λ 1 λ cosh λ ξ + 1 λ sinh λ ξ ξ
From Equations (11) and (12), it can be seen that the shear force shared by the frame becomes more uniformly distributed along the height as λ decreases. When x = 0 ( ζ = 0 ) , the rocking wall “pulls” the frame at the bottom, resulting in a tensile force. Conversely, when x = H ,   ζ = 1 , the rocking wall “pushes” the frame at the top, resulting in a compressive force. This interaction makes the shear force on the frame more uniform, leading to more even inter-story displacement distribution, reducing the deformation concentration, and enhancing the deformation capacity of the structure.

3. The Fundamental Principles of Vulnerability Analysis

Seismic vulnerability describes the probability of a structure reaching a certain limit state and experiencing damage, establishing the relationship between the degree of structural damage and the intensity of seismic motion. Structural seismic vulnerability can be expressed using Equation (13):
P f x = P D > C I M = x
In the equation, P f x represents the exceedance probability function, D denotes the structural damage indicator, DM( θ m a x ) , C represents the limit state, and IM denotes the seismic intensity measure. In civil engineering, seismic vulnerability is often represented using vulnerability curves, with the seismic intensity measure (IM) plotted on the horizontal axis and the structural damage indicator (DM) on the vertical axis. By analyzing the various limit state points on the vulnerability curve, the probability of experiencing ultimate damage can be determined. As an effective method for evaluating the probability of a structure’s resistance to collapse, seismic vulnerability analysis methods have garnered significant attention [17]. Shi Wei et al. [18] conducted research on the collapse resistance of reinforced concrete frame structures at different fortification levels based on structural collapse vulnerability curves, using collapse reserve coefficients as evaluation indicators. Lu Xinzheng et al. [19] further studied the influence of three-dimensional seismic input on collapse vulnerability curves. Lv Dagang et al. [20,21] conducted research on probability seismic risk theory and applications based on seismic vulnerability analytical functions. This study explores the influence of the number of stories and spans on the vulnerability of mountain landslide frame structures with energy dissipation rocking walls from various aspects, including IDA percentile curves, seismic probability models, vulnerability functions, probability of damage states, vulnerability indices, and collapse resistance.
Seismic demand probability model:
Specify that the relationship between the demand measure (DM) and intensity measure (IM) follows an exponential distribution:
D M = α I M β
Then, it can be inferred that:
θ m a x = α P G A β
Taking the natural logarithm of both sides of Equation (15) yields the following expression:
ln ( θ m a x ) = A + B ln P G A β
In the equation, A = ln α and B = β . The values of A and B are obtained through logarithmic linear regression using structural response data obtained from incremental dynamic analysis. The established probabilistic seismic demand model provides a basis for subsequent vulnerability analysis.
Plotting vulnerability curves:
According to the literature, under a specified intensity measure (IM), both the demand function, D, and the capacity function, C, follow a lognormal distribution. The probability of failure, P f , is:
P f x = Φ ln C / D β c 2 + β d 2
In the equation, C represents the median of the limit state indicator, β c is the corresponding logarithmic standard deviation, D denotes the median of the structural damage indicator, and β d is the corresponding logarithmic standard deviation.
Substitute Equation (15) into Equation (16) and simplify to obtain:
P f x = Φ ln α P G A β / m c β c 2 + β d 2
The values of β c and β d are determined based on the HAZU99 [22] guidelines. When the spectral acceleration, S a , is used as the intensity measure (IM), β c 2 + β d 2 is taken as 0.4. When the peak ground acceleration (PGA) is used as the intensity measure (IM), β c 2 + β d 2 is taken as 0.5.
After determining the values of each parameter, calculate the exceedance probability using Equation (18). Then, plot the vulnerability curves to provide a basis for subsequent vulnerability analysis.

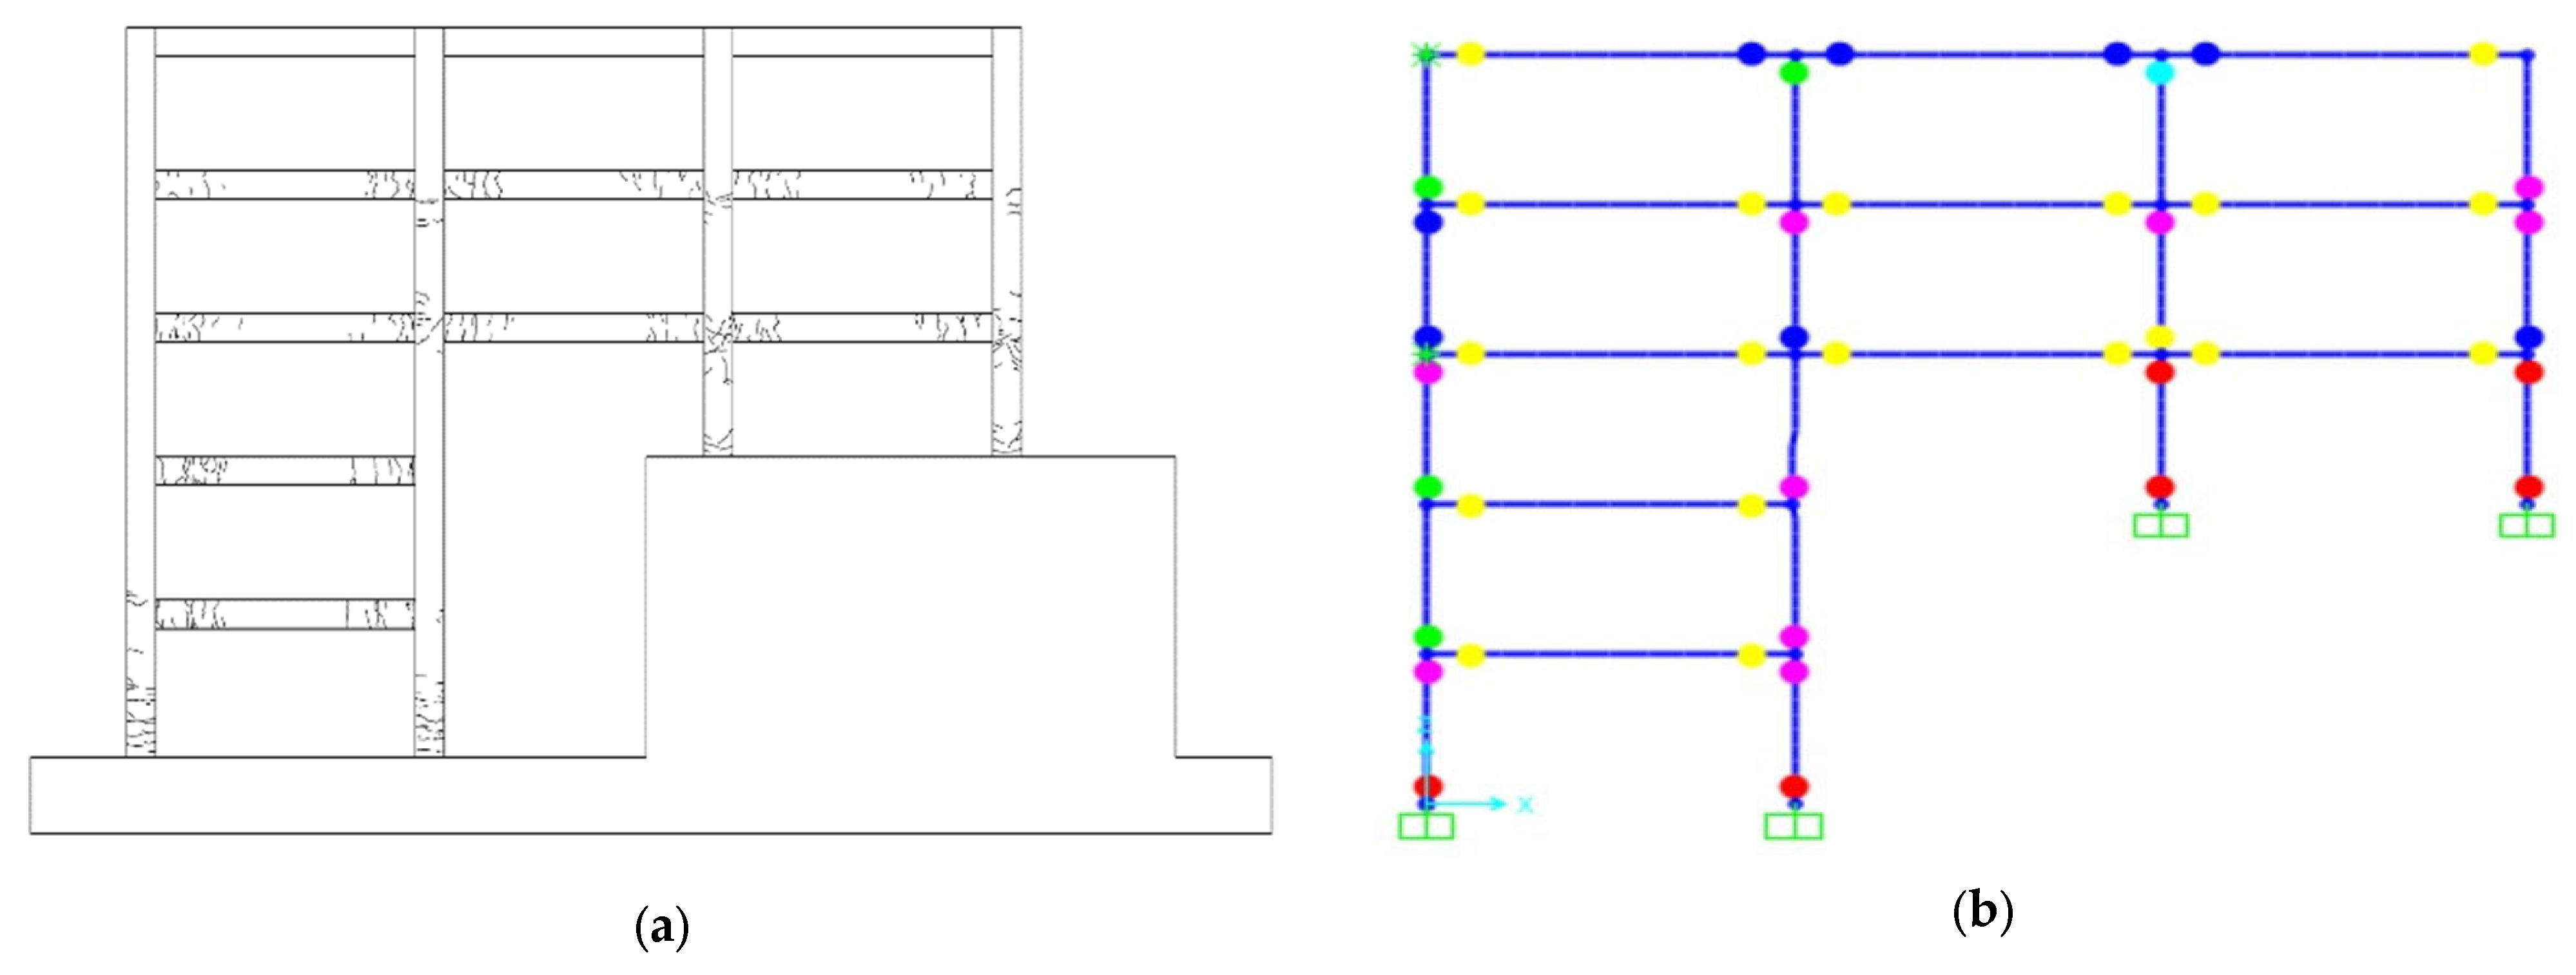
4. Model Establishment

4.1. Model Information

The primary distinction between mountainous and conventional structures lies in the uneven embedment of foundations. Below are the names of the various parts of a mountainous step-terrace frame structure, as illustrated in Figure 4. The structure is divided into two parts at the upper ground interface. The portion above the upper ground surface is referred to as the upper slope portion, while the portion below is termed the lower slope portion or step-terrace portion. The floors adjacent to the upper ground are termed upper ground floors, and the columns contained within are referred to as upper ground columns. Conversely, the floors adjacent to the lower ground are termed lower ground floors, with their respective columns known as lower ground columns. The floors within the step-terrace portion are labeled sequentially from top to bottom, starting from first floor, second floor, and so forth. Similarly, floors within the upper slope portion are labeled from bottom to top, starting from Upper 1st floor, Upper 2nd floor, etc. Now, let CmKn represent a step-terrace frame structure with m dropped layers and n dropped spans. For instance, a mountainous step-terrace frame structure with two dropped layers and three spans is denoted as C2K3. If this structure includes additional rocking walls and buckling-restrained braces (BRBs), it is termed a mountainous step-terrace frame structure with energy dissipation rocking walls and BRBs, abbreviated as C2K3YBR, where “R” signifies the presence of buckling-restrained braces (BRBs). The ends of energy dissipation components and rocking walls are articulated at both ends and at the base, respectively.
Using OPENSEES to establish a finite element analysis model, reinforced concrete frames were simulated using force-based beam-column elements, integrating stiffness matrices through fiber section integration. Concrete was modeled using the concrete02 linear tensile softening model, while steel was simulated using the Steel02 uniaxial isotropic strain-hardening model for reinforcement. The expected performance goal of the rocking wall is to remain elastic under major earthquakes. Therefore, elastic beam elements were used in the modeling. Connections between the rocking wall and the main structure were established using connectors to transmit horizontal shear forces. Truss elements were employed to simulate the connectors, limiting rotation outside the plane of the swinging wall. Acting as truss elements, they solely transmit horizontal shear forces [23]. Buckling-restrained braces (BRBs) were positioned at the base of the rocking wall to efficiently dissipate energy due to the concentration of deformation at the bottom of the rocking wall, facilitating easy replacement post-earthquake.

4.2. Design Data

We designed the structure according to the Chinese standards “Code for Design of Concrete Structures” (GB 50010-2010) [24] and “Code for Seismic Design of Buildings” (GB 50011-2010) [25]. Seismic fortification intensity was in the 7° zone (0.15 g), site category II, with design seismic grouping as the first group, ground roughness category B, a site characteristic period of 0.35 s, and seismic design level III. For the step-terrace frame structure, beams and columns were made of C30 concrete, longitudinal reinforcement was HRB400, stirrups were HPB300, and rocking walls were made of C40 concrete. The total number of stories was 7, with each story having a height of 3.6 m. The step-terrace portion accounted for a total height of 25.2 m. The structure spanned five spans in the slope direction and four spans longitudinally, with an axis grid dimension of 6 m × 6 m. The column section dimension was 600 mm × 600 mm, and the beam section dimension was 250 mm × 600 mm. The floor slab thickness was 120 mm for the reinforced concrete frame structure. Live load on the floor was 2.0 kN/m2, dead load on the floor was 3.5 kN/m2, dead load on the upper roof was 5.5 kN/m2, roof live load was 2.0 kN/m2, live load on beams was 8.5 kN/m, and load on the parapet wall of the upper roof was 3.0 kN/m. The basic wind pressure was 0.4 kN/m2. The study focused on a single frame of the structure selected from the middle portion.
The design of buckling-restrained braces includes global stability design and local stability design. BRB design parameters were as follows: The damper model was TJC, with the core material made of Q235, and the sleeve and connection materials were made of Q345. The length was 3.6 m, core section area was 7500 mm2, steel elastic modulus was 2.06 × 10⁵ MPa, yield strength was 300 MPa, and the post-yield stiffness ratio of steel material was 0.015.

4.3. Selection and Input of Seismic Waves

In this study, 15 actual seismic ground motion records were selected from the PEER Strong Motion Database, as shown in Table 1, along with the corresponding 15 seismic ground motion acceleration response spectra depicted in Figure 5.

4.4. Analysis Indicators

“Analysis indicators” refer to commonly used seismic intensity measures (IM) in vulnerability analysis. These include spectral acceleration, S a T 1 , corresponding to the fundamental period of the structure, and the peak ground acceleration (PGA). This study selected PGA as the IM [26]. Shear walls can restrain the formation of weak layers in frames, improving the seismic performance of structures, and the maximum inter-story drift angle can be chosen as the engineering demand parameter (EDP) for engineering requirements. The seismic records were amplitude-adjusted using the equal-step amplitude adjustment method, and incremental dynamic analysis was conducted to study the exceedance probability of EDP for predefined performance objectives. According to FEMA 356 [22], seismic performance levels for concrete frame structures can be classified as follows: immediate occupancy (IO), life safety (LS), and collapse prevention (CP). The corresponding inter-story drift angle limits are 0.005, 0.01, and 0.02, respectively. These three limit states serve as critical points between adjacent damage states (DS), which include slight damage (DS1), moderate damage (DS2), severe damage (DS3), and collapse (DS4).

4.5. The Correlation between Selected IM Indicators and EDP

The choice of intensity measure (IM) directly affects the accuracy of the vulnerability analysis results. This study analyzed and compared four IM indicators: PGA, PGV, PGD, and Sa(T1) (spectral acceleration at the structure’s first mode period).The peak inter-story drift angles of the structure under different amplitude inputs were calculated, and the correlation between IM indicators and EDP was analyzed.
In this study, the Pearson correlation coefficient was used to characterize the correlation between different variables. It can be calculated according to Equation (19). In this equation, X and Y are the two variables for which the correlation is to be analyzed. X takes ln ( P G A ) , ln ( P G A ) , ln ( P G D ) , and ln [ S a T 1 ] , respectively, while Y takes ln ( E D P ) . Cov(X,Y) is the covariance of X and Y, and D(X) and D(Y) are the variances of the two variables. The closer the correlation coefficient is to 1, the stronger the positive correlation between the variables, the closer it is to −1, the stronger the negative correlation between the variables, and the closer it is to 0, the weaker the correlation between the variables.
ρ X , Y = C o v ( X , Y ) D ( X ) D ( Y )  
Here, pure frame structure: FR structure, rocking wall-frame structure: ND structure, and energy dissipating rocking wall-frame structure: BD structure.
The correlation coefficients between ln ( E D P ) and ln ( I M ) for FR, ND, and BD structures were calculated sequentially, and the results are shown in Table 2.
From Table 2, it can be observed that the correlation between PGV and EDP was the strongest, while the logarithmic correlation between S a T 1 and EDP was the weakest, with PGA falling between the two. From Figure 5, it can be observed that the predominant period of the average acceleration response spectrum for the 15 records was around 0.3 s. The fundamental period of the BD structure was approximately 0.55 s, while the fundamental periods of the ND and FR structures exceeded 1 s. After the structures entered the plastic range, the periods extended further. Therefore, it was more reasonable to use PGV for scaling in the long-period range, which is consistent with the relevant requirements of Japanese standards. However, the Chinese code expresses the response spectrum in terms of acceleration, and the correlation between PGA and EDP was significantly better than that of S a T 1 . Hence, it was reasonable to use PGA as the IM for incremental dynamic analysis in this study.

4.6. Experimental Validation of the Model

To verify the accuracy and rationality of the parameters of structural analysis software and computational structural models, this paper simulated the low-cycle cyclic loading model of a drop-frame structure completed in the structural laboratory of Chongqing University [5]. The test site loading device is shown in Figure 6, and the dimensions and reinforcement details of the experimental drop-frame structure are shown in Figure 7.
(1)
Experimental Model and Loading System
The prototype of the experiment had a total of 8 stories, with a drop of 2 stories over 1 span, and a total of 3 spans. The design seismic intensity was 8 (0.2 g), the seismic design group was Group 1, the site category was Category II, the concrete strength grade was C30, longitudinal reinforcement adopted HRB400, and stirrups adopted HPB300. The experimental model had a total of 5 stories, with a drop of 2 stories over 1 span, and its geometric dimensions were one-quarter of the prototype frame. Each story had a height of 750 mm, and each span was 1500 mm. Section dimensions were as follows: beams were 100 mm × 150 mm, and columns were 150 mm × 150 mm.
The horizontal and vertical loads on the model were applied using hydraulic jacks. For the beams, loads were applied using steel plates. Vertical loads were transferred to the column tops through steel beams in proportions of 10 kN for end columns and 5 kN for intermediate columns. Horizontal loads were applied as reciprocating loads under displacement control at a ratio of 1:2 only at the third and top stories.
(2)
Numerical Simulation
The comparison between experimental results and software-simulated overall hysteresis curves is shown in Figure 8. It can be observed from the figure that the maximum horizontal thrust for both cases was around 100 kN, and the general trends of the hysteresis curves were relatively consistent. The overall error was within an acceptable range, indicating that the degradation behavior of the bearing capacity and stiffness of the mountain landslide frame structure under reciprocating loads can be simulated relatively accurately. Additionally, the differences in pinching phenomena between the two hysteresis curves were small, indicating that the OPENSEES 3.3.0 structural analysis software can effectively simulate and analyze the mountain landslide frame structure model.
The circle in Figure 9 represents the appearance of plastic hinges in the section, and the color represents the degree of plastic hinge development, from green to blue, yellow, pink, and red, representing the increasing degree of plastic hinge development. By comparing the hinge distribution results with the experimental crack patterns, it can be observed that the numerical simulation results were quite close to the experimental results. The only significant difference was in the hinge results of the top floor. According to the literature, the top floor crack patterns were not drawn in the experiment due to safety considerations and lateral support obstructions. However, based on the longitudinal reinforcement strain gauge values, plastic hinges did form in the top floor columns and side span beams, which is consistent with the OPENSEES analysis results.
Overall, however, the failure modes of both were relatively similar: the upper-ground floor columns had more hinges compared to the lower-ground columns. Additionally, the upper-ground floor columns exhibited hinges at both the top and bottom ends, reaching their ultimate state, indicating that the upper-ground floor was a distinctly weak layer. In contrast, the lower-ground columns only had significant hinge formation at the bottom end, which is consistent with the experimental results.

5. The Influence of the Number of Dropped Layers and Spans on the Vulnerability of Mountain Step-Terrace Frame Structures with Energy Dissipation Rocking Walls

To investigate the impact of the number of dropped layers and dropped spans on the vulnerability of mountain step-terrace frame structures with energy dissipation rocking walls, this study followed the specifications outlined in GB50011-2010 “Code for Seismic Design of Buildings” [25]. Various structural configurations were designed, including structures with different numbers of dropped layers and dropped spans. These configurations included a dropped one-story and two-span step-terrace frame structure with energy dissipation rocking walls (C1K2YBR), a dropped two-story and two-span step-terrace frame structure with energy dissipation rocking walls (C2K2YBR), and a dropped three-story and two-span step-terrace frame structure with energy dissipation rocking walls (C3K2YBR) to examine the influence of the number of dropped stories. Similarly, structures with different numbers of dropped spans were designed, including a dropped two-story and one-span step-terrace frame structure with energy dissipation rocking walls (C2K1YBR), a dropped two-story and two-span step-terrace frame structure with energy dissipation rocking walls (C2K2YBR), and a dropped two-story and three-span step-terrace frame structure with energy dissipation rocking walls (C2K3YBR).

5.1. The Influence of the Number of Dropped Stories and Dropped Spans on the Structural IDA Percentile Curves

Performing amplitude scaling analysis on seismic waves, IDA curves were plotted in the P G A θ m a x coordinate system. The 16%, 50%, and 84% percentile curves were obtained through quantile statistical methods. To facilitate the comparison and analysis of the PGA corresponding to the structural exceedance limit states at different percentiles, bar charts of the PGA corresponding to the limit states of structures with different numbers of dropped spans were plotted, as shown in Figure 10, and bar charts of the PGA corresponding to the limit states of structures with different numbers of dropped stories were plotted, as shown in Figure 11.
From Figure 10 and Figure 11, it can be observed that regardless of the structural limit state, the PGA values corresponding to each percentile line of structures with the same number of dropped stories, but different spans, decreased as the number of dropped spans increased. Similarly, the PGA values corresponding to each percentile line of structures with the same number of dropped spans, but different stories, decreased as the number of dropped stories increased. Taking the 84% percentile curve of the IO limit state as an example: for the C2K1YBR structure, the corresponding PGA value was 0.31038 g, for the C2K2YBR structure, the corresponding PGA value was 0.29473 g, and for the C2K3YBR structure, the corresponding PGA value was 0.2537 g. As the number of dropped spans increased, the maximum decrease was 22.34%. For the C1K2YBR structure, the corresponding PGA value was 0.39339 g, for the C2K2YBR structure, the corresponding PGA value was 0.29473 g, and for the C3K2YBR structure, the corresponding PGA value was 0.27206 g. The maximum decrease was 44.59%. Comparing the changes in PGA values of structures with different numbers of dropped stories and dropped spans, it can be seen that the change in the number of dropped stories had a greater impact on the PGA values, corresponding to the percentile curves of the structural limit states, than the change in the number of dropped spans.

5.2. The Impact of the Number of Dropped Stories and Dropped Spans on the Seismic Probability Demand Model

Taking the logarithm of the seismic intensity indicator PGA and the structural damage indicator θ m a x obtained from the IDA curve, using ln ( P G A ) as the x-axis and ln ( θ m a x ) as the y-axis, the seismic probability demand model was established on the ln P G A ln ( θ m a x ) coordinate axis. Linear regression analysis of the seismic probability demand model for structures with different numbers of dropped spans is shown in Figure 12, while linear regression analysis of the seismic probability demand model for structures with different numbers of dropped stories is shown in Figure 13.
Comparative analysis of Figure 12 and Figure 13 indicated that:
(1)
The mean values of ln ( P G A ) and ln ( θ m a x ) exhibited strong linear correlation for all three structures, with correlation coefficients, R 2 , exceeding 0.99. A value closer to 1 signifies a stronger correlation.
(2)
As ln ( P G A ) increased, the distribution of data points gradually became more scattered, indicating an increase in the dispersion of ln ( θ m a x ) . This is because as PGA increased, the plasticity of the structure further developed, stiffness further degraded, and the structure became more sensitive to seismic excitation, leading to increased variability in θ m a x .
(3)
Regardless of whether the number of dropped spans or the number of dropped stories was changed, the distribution of data points did not undergo significant changes, and the dispersion of ln ( θ m a x ) did not decrease. This indicates that changing the number of dropped stories or dropped spans did not have an effect on controlling the dispersion of ln ( θ m a x ) .
(4)
The slopes of the six demand functions were all maintained around 1.1. This indicates that the function of the rocking wall is to homogenize the overall deformation of the structure. The structural failure mode of the mountain landslide frame structure with energy dissipation rocking walls changed from a story-by-story failure mode to a global failure mode at the ground layer.
(5)
In structures such as C2KXYBR, as the number of dropped spans increased, the y-intercept of the demand function gradually decreased. The maximum intercept was 3.5896, and the minimum intercept was 3.5269, with a decrease of 1.8%, which is less than 2%. This indicates that the change in the number of dropped spans had a relatively small impact on the maximum inter-story drift angle of the structure. As the number of dropped stories Increased, the y-intercept of the demand function gradually decreased. The maximum intercept was 3.7845, and the minimum intercept was 3.5071, with a decrease of 7.91%, which is less than 10%. Comparing the changes in intercept values of structures with different numbers of dropped stories and dropped spans, it can be observed that both changes were small. However, the change in the number of dropped stories had a greater impact on the seismic probability demand model of the structure compared to the change in the number of dropped spans.

5.3. The Impact of the Number of Dropped Stories and Dropped Spans on the Structural Vulnerability Function

According to the structural failure probability formula, vulnerability function curves for structures with six different numbers of dropped stories and dropped spans can be obtained for IO, LS, and CP states. The vulnerability curves for structures with different numbers of dropped spans are shown in Figure 14, while the vulnerability curves for structures with different numbers of dropped stories are shown in Figure 15. The horizontal axis represents the seismic intensity value (peak ground acceleration, PGA), and the vertical axis represents the exceedance probability of the limit state.
From Figure 14 and Figure 15, it can be observed that under frequent earthquakes, the exceedance probability of structures with different numbers of dropped stories and dropped spans beyond the IO limit state was less than 2%. This indicates that the structures can be safely used without the need for repair after an earthquake. For the LS and CP limit states, the exceedance probability of structures was 0, indicating that they did not exceed the life safety and collapse prevention limit states, meeting the performance requirements of “no damage for small earthquakes”.
(1)
Under the design earthquake, for the C2KXYBR structures with the same number of dropped stories but different numbers of dropped spans, the exceedance probability of surpassing the IO limit state gradually increased with the number of dropped spans. Specifically, it increased to 23.73%, 24.53%, and 30.55% as the number of dropped spans increased. Similarly, for the CXK2YBR structures with the same number of dropped spans but different numbers of dropped stories, the exceedance probability of surpassing the IO limit state gradually increased with the number of dropped stories, reaching 9.79%, 24.53%, and 30.67%, respectively. These probabilities are all less than 50%, indicating that the structures can still be safely used, although minor repairs may be required after the earthquake. The exceedance probability of surpassing the LS limit state for all five structures was less than 5%, indicating that the structures had just begun to undergo damage, with low levels of damage. The exceedance probability of surpassing the CP limit state for all structures was very low, less than 1%.
(2)
Under a rare earthquake event, for the C2KXYBR structures with the same number of dropped stories but different numbers of dropped spans, the exceedance probability of surpassing the IO limit state gradually increased with the number of dropped spans. Specifically, it increased to 79.98%, 81.54%, and 85.65% as the number of dropped spans increased. Similarly, for the CXK2YBR structures with the same number of dropped spans but different numbers of dropped stories, the exceedance probability of surpassing the IO limit state gradually increased with the number of dropped stories, reaching 63.00%, 81.54%, and 85.38%, respectively. All structures exceeded the IO limit state, with probabilities exceeding half, indicating that they essentially surpassed the IO limit state. The exceedance probability of surpassing the LS limit state for the C2KXYBR structures with the same number of dropped stories but different numbers of dropped spans gradually increased to 30.04%, 31.72%, and 38.14%, respectively. Similarly, for the CXK2YBR structures with the same number of dropped spans but different numbers of dropped stories, the exceedance probability of surpassing the LS limit state gradually increased to 15.39%, 31.72%, and 36.98%, respectively. This indicates that structures with different numbers of dropped stories and dropped spans had already started to undergo damage. The exceedance probability of surpassing the CP limit state for structures with different numbers of dropped stories and dropped spans remained very low, at less than 5%.

5.4. The Impact of the Number of Dropped Stories and Dropped Spans on the Probability of Damage States

The difference in exceedance probabilities between adjacent limit states can be used to represent the probability of damage states, calculated according to Equation (20):
P f | D S i 1 P f | L S 1 ( i = 1 ) P f | L S i 1 P f | L S i ( i = 2,3 ) P f | L S 3 ( i = 4 )  
where P f | L S 1 corresponds to the IO limit state, P f | L S 2 corresponds to the LS limit state, and P f | L S 3 corresponds to the CP limit state. D S 1 represents the slight damage state, D S 2 represents the moderate damage state, D S 3 represents the severe damage state, and D S 4 represents the collapse state. Combining the four damage states from Section 4.4 with the three limit states, Equation (20) was used to calculate the probability curves of structures with different numbers of dropped stories and dropped spans in different seismic intensity conditions and in different damage states, as shown in Figure 16 and Figure 17.
From Figure 16 and Figure 17, it can be observed that:
(1)
The trends of the probability curves for different numbers of dropped stories and dropped spans were similar, indicating that the change in the probability of damage states was consistent across different structural configurations. However, the trend of the probability curves for damage states differed from that of the vulnerability curves. Not only did the probabilities of damage states monotonically increase with the increase in seismic intensity, but there were also sections where they decreased. This suggests that as the seismic intensity increased, the structural damage states underwent continuous changes.
(2)
In the probability curves for structures with different numbers of dropped stories and dropped spans, there were six intersections between the four curves. Comparing the positions of these six intersections, for structures with the same number of dropped stories but different numbers of dropped spans, the intersections gradually shifted to the left with an increase in the number of dropped spans. However, the shift distance was very small, indicating that structures such as C2KXYBR required slightly lower seismic intensity to reach the corresponding damage states as the number of dropped spans increased. On the other hand, for structures with the same number of dropped spans but different numbers of dropped stories, the intersections also gradually shifted to the left with an increase in the number of dropped stories, and the shift distance significantly increased. This suggests that structures such as CXK2YBR required a noticeably lower seismic intensity to reach the corresponding damage states as the number of dropped stories increased.
(3)
Using a 40% probability of damage state as a threshold, it was easy to observe the probable damage states of each structure within different ranges of seismic intensity. For example, in the case of the C2K3YBR structure: Within the 0 < P G A < 0.2   g range, the structure was likely in the D S 1 (slight damage) state. Within the 0.2   g < P G A < 0.35   g range, the structure was likely in the D S 2 (moderate damage) state. Within the 0.35   g < P G A < 0.65   g range, the structure was likely in the D S 3 (severe damage) state. At time P G A > 0.65   g , the structure was likely in the D S 4 (collapse) state, and the probability of collapse increased monotonically with the increasing seismic intensity.

5.5. The Influence of the Number of Dropped Stories and Spans on the Vulnerability Index

According to the seismic intensity scale in China, the table below lists the seismic damage indices corresponding to different damage states [27], and provides upper and lower limits along with the average seismic damage index treatment, as shown in Table 3.
The vulnerability index (VI) can be calculated using Equation (21):
V I = j = 1 4 D F j × P f | D S j
In the equation, D F j (j = 1, 2, 3, 4) represents the damage factor corresponding to the four structural damage states, namely slight damage, moderate damage, severe damage, and collapse. Based on the damage state probabilities from Section 5.3, the vulnerability index curves for structures with different numbers of dropped floors and spans were calculated according to Equation (21), as shown in Figure 18 and Figure 19.
In Figure 18 and Figure 19, V I M , V I U , and V I D , respectively, represent the mean, upper limit, and lower limit of the structural vulnerability index. The range of the structural vulnerability index corresponding to a specific seismic intensity PGA was calculated, which is represented by the difference between V I U and V I D , indicating the damage range. By comparing with the seismic damage indices in Table 3, the extent of structural damage was quantitatively evaluated, thereby assessing the structure’s resistance to collapse. From Figure 18 and Figure 19, it can be observed that:
(1)
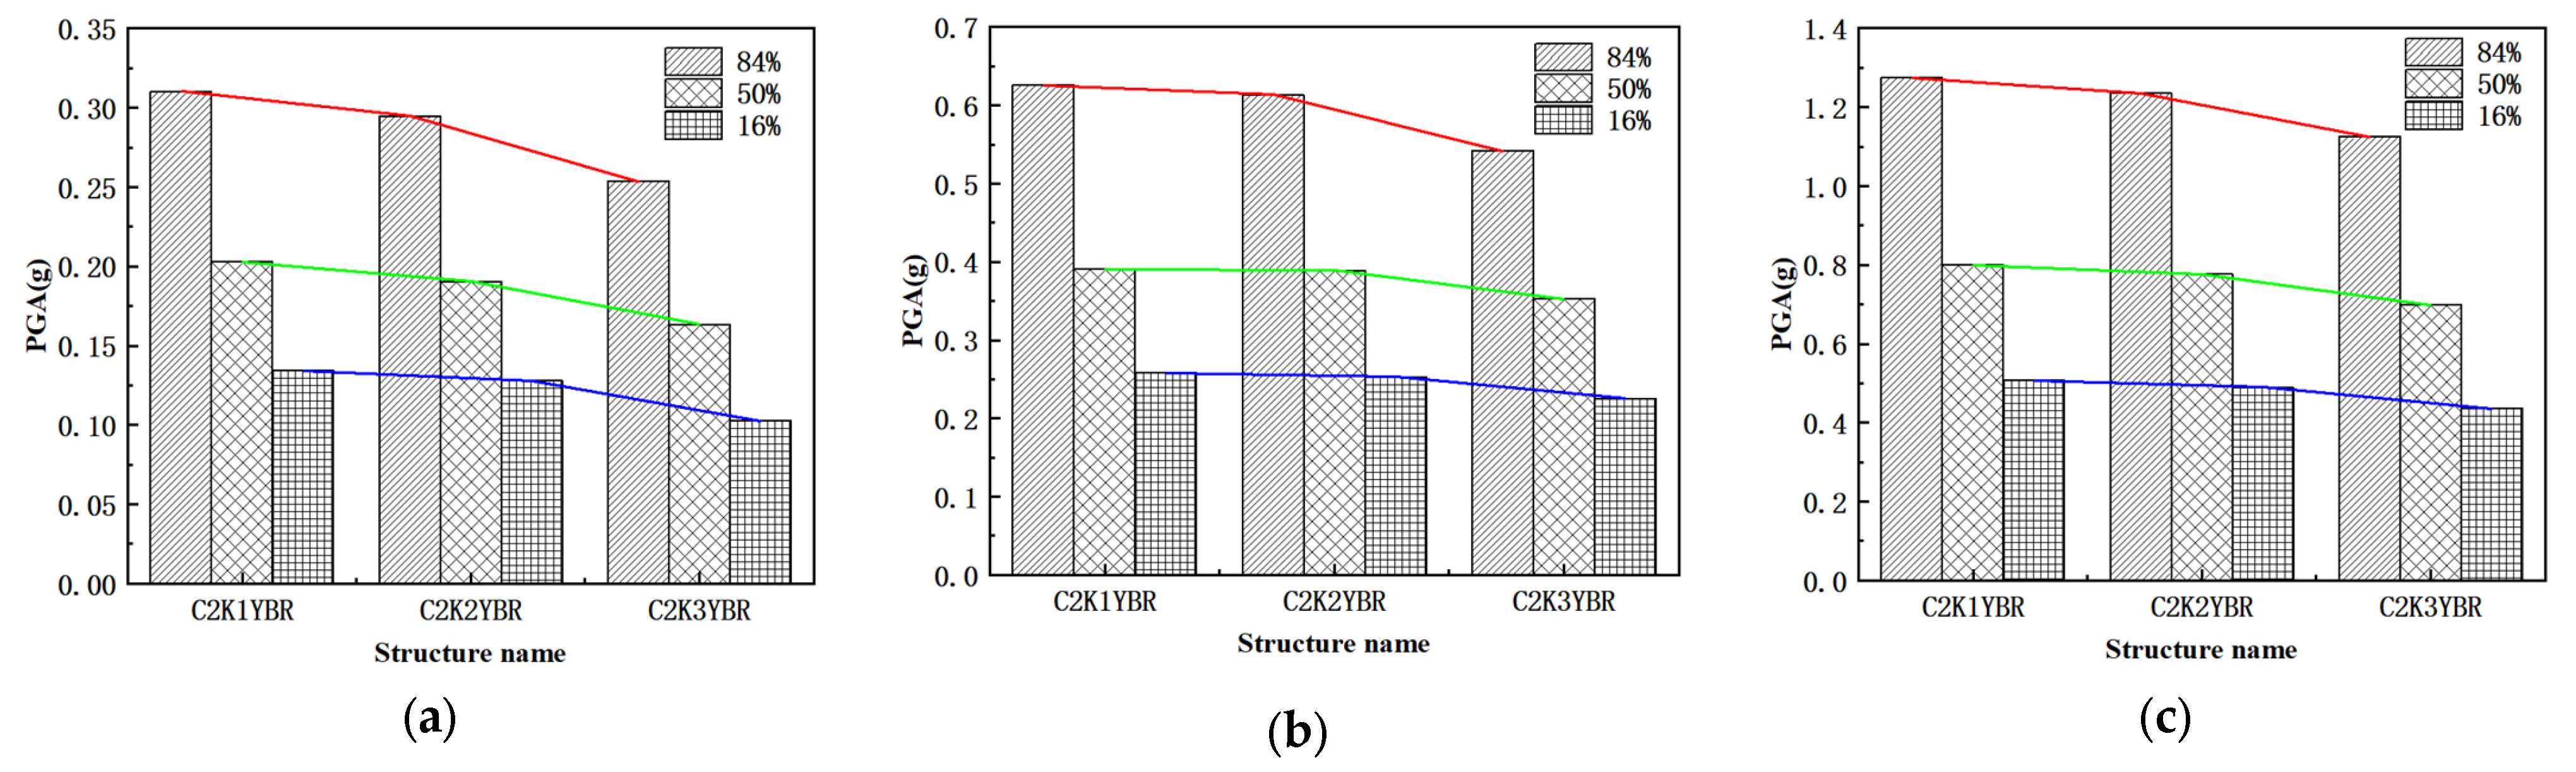
In the case of frequent earthquakes, the upper limit of the vulnerability index for structures with different numbers of dropped stories and spans remained around 30%, with lower limits below 1%, and averages around 15%. The damage range for each structure was less than 30%. This is because under relatively small seismic intensities, the structural seismic response was minimal, and the vulnerability index reflected the D S 1 (slight damage) state. Referring to the seismic damage indices in Table 3, it can be inferred that under frequent earthquakes, the seismic damage to each structure will generally not exceed the level of slight damage.
(2)
In the case of design-level earthquakes, the average vulnerability index, V I M , for structures such as C2KXYBR was as follows: 22.39%, 22.90%, and 25.33%, respectively, all below 30%. With an increase in the number of dropped spans, the average vulnerability index gradually increased, with a maximum increase of 13.13% compared to the minimum, indicating that when the number of dropped stories was the same, the increase in the number of dropped spans had a relatively small impact on the average vulnerability index, V I M . Similarly, the trends for the upper limit, V I U , and lower limit, V I D , of the vulnerability index were also consistent, with V I U consistently below 40% and V I D consistently below 15%, maintaining a damage range of around 28.5%. The maximum change in the damage range compared to the minimum was less than 1%, indicating that the change in the number of dropped spans had a minimal effect on structural damage. For structures such as CXK2YBR, the average vulnerability index, V I M , was as follows: 18.36%, 22.90%, and 24.63%, respectively, all below 30%. This indicates that with the same number of dropped spans, the average vulnerability index gradually increased with an increase in the number of dropped stories, with a maximum increase of 34.15% compared to the minimum, which is greater than 13.13%. This suggests that the change in the number of dropped stories had a greater impact on the vulnerability index of mountain-side dropped-frame structures with energy-dissipating sway walls. Similarly, the trends for the upper limit, V I U , and lower limit, V I D , of the vulnerability index were consistent, with V I U consistently below 40% and V I D consistently below 15%. The damage ranges were 28.60%, 28.79%, and 29.52%, respectively, with the maximum change in damage range compared to the minimum being 3%, which is less than 5%. This indicates that the change in the number of dropped stories had a minimal effect on the damage range of the structure. Referring to Table 3, it can be observed that under design-level earthquakes, the seismic damage to all structures was generally controlled within the level of moderate damage.
(3)
In the case of rare seismic events, the average vulnerability index, V I M , for structures such as C2KXYBR was as follows: 45.92%, 47.03%, and 50.04%, respectively, approaching 50%. With an increase in the number of dropped spans, the vulnerability index gradually increased for structures with different numbers of dropped spans, with a maximum increase of 8.97%, which is less than 10%. This suggests that an increase in the number of dropped spans may slightly increase the average vulnerability index of the structure. The upper limit, V I U , of the vulnerability index was as follows: 59.49%, 60.63%, and 63.26%, respectively, all exceeding 55%, while the lower limit V I D remained below 40%. The damage range remained around 27%, indicating that structures with the same number of dropped stories but different numbers of dropped spans may have already reached a severe damage level. For structures such as CXK2YBR, the average vulnerability index, V I M , was as follows: 36.81%, 47.03%, and 49.55%, respectively, all below 50%. With an increase in the number of dropped stories, the vulnerability index gradually increased for structures with different numbers of dropped stories, with a maximum increase of 34.6%. This also indicates that the change in the number of dropped stories had a greater impact on the vulnerability index of mountain-side dropped-frame structures with energy-dissipating sway walls. Similarly, the trends for the upper limit, V I U , and lower limit, V I D , of the vulnerability index were consistent, with V I U consistently exceeding 50% and V I D remaining below 40%. The damage ranges were 27.15%, 27.57%, and 28.41%, respectively, with the maximum change in damage range compared to the minimum being 4.6%, which is less than 5%. This also suggests that the change in the number of dropped stories had a relatively small impact on the structural damage. Referring to Table 3, it can be observed that under rare seismic events, the seismic damage to all structures may reach a severe damage level.
(4)
Comparing the damage ranges of any mountain-side dropped-frame structure with energy-dissipating sway walls under frequent, design, and rare seismic events, it can be observed that the damage range gradually decreased. This is because as the seismic intensity increased, the buckling-restrained braces (BRBs) came into play after yielding, reducing structural damage and optimizing energy dissipation.

5.6. The Influence of Number of Dropped Stories and Span Reduction on the Collapse Resistance Ability

The quantitative index used to assess structural collapse resistance is the Collapse Margin Ratio (CMR), proposed by the Applied Technology Council (ATC) in the United States. The CMR method evaluates the structural collapse resistance, where a higher CMR value indicates better resistance to collapse under seismic forces. The CMR value is calculated according to Equation (22):
C M R = I M 50 % I M M C E
where I M 50 % represents the peak ground acceleration (PGA) corresponding to a 50% probability of structural collapse under a given seismic intensity (PGA is the seismic intensity indicator chosen in this paper), also known as the average collapse resistance of the structure, i.e., the PGA value corresponding to the 50% exceedance probability of the vulnerability curve. I M M C E represents the seismic intensity, corresponding to a rare earthquake: I M M C E = 0.31   g .
According to Equation (22), the CMR values for the five structures were calculated and presented in Table 4.
According to Table 4, the relationship of Collapse Margin Ratios (CMR) among structures with different numbers of span drops was as follows: C2K1YBR > C2K2YBR > C2K3YBR, with the maximum change being 8.5%, which is less than 10%. This indicates that the change in the number of spans had a relatively small impact on the collapse resistance of structures with the same number of drop layers. Regarding structures with different numbers of drop layers, the relationship of Collapse Margin Ratios (CMR) was as follows: C1K2YBR > C2K2YBR > C2K3YBR, with the maximum change being 32.4%. This suggests that with an increase in the number of drop layers for structures with the same number of spans, the collapse resistance of the structure was weakened. Moreover, the change in drop layers significantly affected the CMR compared to the change in span drops.
To further investigate the structural capacity to reach different limit states under varying seismic intensities, the “safety margin ratio” (SMR) [28] was employed for quantitative analysis of the structure’s ability to resist different degrees of damage. It can be calculated according to Equations (23)–(25):
C M R i , F E = I M 50 % i I M F E   i = 1,2 , 3
C M R i , D B E = I M 50 % i I M D B E   i = 1,2 , 3  
C M R i , M C E = I M 50 % i I M M C E   i = 1,2 , 3  
In the equation, I M F E , I M D B E , and I M M C E represent the seismic intensity indices under frequent, design basis, and maximum considered earthquakes, respectively. I M 50 % i (i = 1, 2, 3) denotes the peak ground acceleration (PGA) corresponding to a collapse probability of 50% at the immediate occupancy (IO), life safety (LS), and collapse prevention (CP) limit states, respectively. In the case where i = 3, CMR and C M R i , M C E are of equal magnitude.
The safety margin ratios for structures with different span numbers and different story numbers under frequent earthquakes (0.055 g), design basis earthquakes (0.15 g), and maximum considered earthquakes (0.31 g) are shown in Figure 20 and Figure 21, respectively.
According to Figure 20 and Figure 21:
(1)
Under different seismic intensities, the safety margin ratios of mountainous layer frame-energy dissipation swing wall structures with different stiffness ratios corresponded to different limit states, as follows: collapse prevention S M R 3 > life safety S M R 2 > immediate occupancy S M R 1 .
(2)
In a rare earthquake scenario, for structures of the C2KXYBR type with the same number of dropped floors and different spans, the safety margin ratio ( S M R 1 , M C E ) at the immediate occupancy (IO) limit state followed the order: C2K1YBR > C2K2YBR > C2K3YBR. Conversely, for structures of the CXK2YBR type with the same span but different numbers of dropped floors, the order of the safety margin ratio ( S M R 1 , M C E ) was: C1K2YBR > C2K2YBR > C2K3YBR. For structures of the C2KXYBR type with the same number of dropped floors and different spans, the safety margin ratio ( S M R 2 , M C E ) at the life safety (LS) limit state followed the order: C2K1YBR > C2K2YBR > C2K3YBR in a rare earthquake scenario. Conversely, for structures of the CXK2YBR type with the same span but different numbers of dropped floors, the order of the safety margin ratio ( S M R 2 , M C E ) was: C1K2YBR > C2K2YBR > C2K3YBR. For structures of the C2KXYBR type with the same number of dropped floors and different spans, the safety margin ratio ( S M R 3 , M C E ) at the collapse prevention (CP) limit state followed the order: C2K1YBR > C2K2YBR > C2K3YBR in a rare earthquake scenario. Conversely, for structures of the CXK2YBR type with the same span but different numbers of dropped floors, the order of safety margin ratio ( S M R 2 , M C E ) was: C1K2YBR > C2K2YBR > C2K3YBR. It can be observed that under different limit states, the trends in the safety margin ratio for structures with varying numbers of dropped floors and spans remained consistent.
(3)
The relationship between the slopes of the SMR values’ lines for structures with different numbers of dropped floors and spans under different limit states was as follows: the slope of structures with different numbers of dropped floors was greater than that of structures with different spans, indicating that changes in the number of dropped floors had a greater impact on the structure’s resistance to various degrees of damage compared to changes in span.

6. Conclusions

Through changing the number of dropped floors and spans, two groups of three structures were established, namely: C1K2YBR, C2K2YBR, and C3K2YBRR, and C2K1YBR, C2K2YBR, and C2K3YBRR. Using incremental dynamic analysis (IDA), comprehensive discussions were conducted on the vulnerability of mountainous dropped-floor frame-energy dissipation brace structure systems from aspects including IDA fragility curves, seismic demand models, vulnerability functions, probability of failure, vulnerability indices, collapse margin ratios, and safety margin ratios. The following conclusions were drawn regarding the influence of the numbers of dropped floors and spans:
(1)
The change in the number of dropped floors had a greater impact on the vulnerability of the mountainous dropped-floor frame-energy dissipation brace structure system compared to the change in the number of spans.
(2)
The variation in the numbers of dropped floors and spans did not effectively control the discreteness of ln ( θ m a x ) , as observed from the comparison between the data distribution of the seismic probability model and the demand function. Under the same input seismic intensity, the slopes of the five demand functions remained around 1.1, indicating that the energy dissipation braces could uniformly distribute the structural deformation. The failure mode of the mountainous dropped-floor frame-energy dissipation brace structure system at the ground-connected side transitioned from a floor-by-floor failure mode to a global failure mode.
(3)
In frequent earthquakes, the exceedance probabilities of surpassing the immediate occupancy (IO) limit state for the mountainous dropped-floor frame-energy dissipation brace structures were all less than 0.5%, indicating that the structures can be safely occupied without the need for post-earthquake repairs. Similarly, for the life safety (LS) and collapse prevention (CP) limit states, the exceedance probabilities were both 0, signifying that the structures will not surpass the life safety and collapse prevention limit states, thus meeting the performance requirement of “minor earthquakes do not cause damage”. In design basis earthquakes, the exceedance probabilities of surpassing the LS limit state for all structures were less than 5%, suggesting that the structures were only beginning to incur damage with a low level of destruction. Under the maximum considered earthquakes, the probabilities of surpassing the CP limit state for all structures were less than 5%, significantly lower than the acceptable collapse probability of 10%, as proposed in the ATC-63 report. This indicates that structures with varying numbers of dropped floors and spans can all meet the performance requirement of “major earthquakes do not result in collapse”.
(4)
The trend of the damage state probability curve differed from that of the structural vulnerability curve. It did not simply increase monotonically with the increase in seismic intensity but exhibited a descending segment, indicating that as seismic intensity increased, the structural damage state continuously changed. Under design basis earthquakes, mountainous dropped-floor frame-energy dissipation brace structures were predominantly in the DS1 damage state, with little risk of collapse. Under maximum considered earthquakes, these structures were unlikely to exceed the DS3 damage state, meeting the performance criterion of “resistance to major earthquakes”. Even under extremely rare earthquakes, these structures were mostly in the DS2 or DS3 damage states, with an extremely low probability of collapse.
(5)
According to the design specifications in China, for mountainous dropped-floor frame-energy dissipation brace structures with varying numbers of dropped floors and spans, under frequent earthquakes, the upper limit of the vulnerability index remained around 30%, with a lower limit of less than 1% and an average of about 15%. The damage ranges were all below 30%. The seismic damage of these structures was generally limited to minor damage levels. Under design basis earthquakes, the upper limit of the vulnerability index was less than 40%, and the damage range was below 30%. The seismic damage of these five structures was mostly controlled at a moderate damage level. Under maximum considered earthquakes, the average vulnerability index was less than 50%. Except for the C1K2YBR structure, the upper limit of the vulnerability index for the remaining structures was greater than 55% but less than 85%. The seismic damage for structures with different numbers of dropped floors and spans could also be controlled at a moderate or severe damage level without collapse damage occurring.
(6)
Structures with different numbers of dropped floors and spans met different limit states of safety margins, in the following order: collapse prevention S M R 3 > life safety S M R 2 > immediate occupancy S M R 1 . The change in dropped spans had less influence on the structure’s resistance to varying degrees of damage compared to the change in dropped floors.

Author Contributions

Conceptualization, Y.Y.; Methodology, Y.Y.; Software, Y.J. and H.J.; Validation, Y.J. and H.J.; Formal analysis, Y.J.; Data curation, Y.J.; Visualization, H.J.; Supervision, Y.Y.; Project administration, Y.Y.; Funding acquisition, Y.Y. All authors have read and agreed to the published version of the manuscript.

Funding

This research was supported by the Chongqing Construction Science and Technology Project (Project No. 2023-3-14).

Institutional Review Board Statement

Not applicable.

Informed Consent Statement

Not applicable.

Data Availability Statement

The original contributions presented in the study are included in the article, further inquiries can be directed to the corresponding author.

Conflicts of Interest

The authors declare no conffict of interest.

References

  1. Li, Y.; Ji, S.; Tang, Y.; Jiang, B.; Liu, L.; Han, J. Special problems and research progress of structure on a slope. J. Build. Struct. 2019, 49, 76–82. [Google Scholar]
  2. Yang, Y.; Wang, Y.; Li, Y.J. Study on seismic resistance behavior of the frame connected with ground by not only the first floor. J. Vib. Shock 2007, 6, 36–41. [Google Scholar]
  3. Narayanan, A.V.; Goswami, R.; Murty, C. Performance of RC Buildings along Hill Slopes of Himalayas during 2011 Sikkim Earthquake; EERI Special Earthquake Report; EERI: Oakland, CA, USA, 2012; pp. 1–14. [Google Scholar]
  4. Wang, L.; Li, Y.; Zheng, N.; Liu, L.; Han, J.; Liu, J. Seismic damage investigation on typical slope building in 5.12 Wenchuan earthquake. Sci. Technol. J. Xian Build. Univ. 2009, 41, 822–826. [Google Scholar]
  5. Yang, B. Quasi-Static Experimental Study on Seismic Performance of Typical Mountain Cliff-Structure. Ph.D. Thesis, Chongqing University, Chongqing, China, 2014. [Google Scholar]
  6. Li, Y.; Tang, Y.; Jiang, B. Shaking table test of RC frame structure on a slope and supported by foundations with different elevations. J. Build. Struct. 2020, 41, 68–78. [Google Scholar]
  7. Welsh-Huggins, S.J. Seismic Vulnerability of Hillside Buildings in Northeast India; University of Colorado at Boulder: Boulder, CO, USA, 2016. [Google Scholar]
  8. Jun, H.; Yingmin, L.; Gelin, T. Influence of ground support types on the seismic performance of structures supported by foundations at different ground levels. China Civ. Eng. J. 2014, 47 (Suppl. S2), 93–100. [Google Scholar]
  9. Yang, Y.; Chen, Y.; Ling, L.; Li, S. Study of seismic mitigation effect of viscoelastic frame structure with special-shaped columns connected with ground by multiple-floor in mountion region. J. Ind. Build. 2014, 44, 91–98. [Google Scholar]
  10. Zhang, L.; Tao, Z.; Pan, W.; Wu, Z.; Lan, X. Shaking table test on isolated step-terrace frame structure in mountainous area. J. Build. Struct. 2020, 41, 24–32. [Google Scholar]
  11. Zengjia, W. Study on the Torsional Effect and Experiment of Isolation Structures on the Slope; Kunming University of Science and Technology: Kunming, China, 2018. [Google Scholar]
  12. Wu, S.-J.; Pan, P.; Zhang, X. Characteristics of frame rocking wall structure and its application in aseismic retrofit. J. Eng. Mech. 2016, 33, 54–60, 67. [Google Scholar]
  13. Shang, Q.; Huang, S.; Gao, S.; Chen, X.; Wang, T. Experimental study on seismic performance of prefabricated rocking wall frame structure. J. Build. Struct. 2022, 43, 12–19. [Google Scholar]
  14. Yang, Y.; Liu, Y.; Liang, T. Seismic performance of step-terrace frame-rocking wall structure. J. Build. Struct. 2020, 41, 210–220. [Google Scholar]
  15. Zhang, W.; Li, G.; Sun, F. Seismic Behavior of Rocking-Truss-Frame with Dampers. J. Tongji Univ. Nat. Sci. 2019, 47, 1235–1243. [Google Scholar]
  16. Xie, L. Probabilistic Seismic Vulnerability Analysis of Mountainous Dropped Floor Frame Structures. Master’s Thesis, Chongqing University, Chongqing, China, 2021. [Google Scholar]
  17. Yu, X.; Lu, D. Seismic collapse fragility analysis considering structural uncertainties. J. Build. Struct. 2012, 33, 8–14. [Google Scholar]
  18. Shi, W.; Ye, L.-P.; Lu, X.-Z.; Tang, D.-Y. Study on the collapse-resistant capacity of RC frames with different seismic fortification levels. Eng. Mech. 2011, 28, 41–048. [Google Scholar]
  19. Lu, X.-Z.; Shi, W.; Zhang, W.-K.; Ye, L.-P.; Ma, Y.-H. Influence of three-dimensional ground motion input on IDA-based collapse fragility analysis. Earthq. Resist. Eng. Retrofit. 2011, 33, 1–7. [Google Scholar]
  20. Dagang, L.; Xiaohui, Y. Theoretical study of probabilistic seismic risk assessment based on analytical functions of seismic fragility. J. Build. Struct. 2013, 34, 41–48. [Google Scholar]
  21. Yu, X.-H.; Lü, D.-G.; Feng, F. Seismic damage assessment of RC frame structures based on vulnerabilty index. J. Eng. Mech. 2017, 34, 69–75, 100. [Google Scholar]
  22. Federal Emergency Management Agency. NEHRP Guidelines for the Seismic Rehabilitation of Buildings; Federal Emergency Management Agency: Oakland, CA, USA, 2009. [Google Scholar]
  23. Cao, H.; Pan, P.; Wu, S.; Ye, L.; Qu, Z. Experimental study of connections of frame-rocking wall system. J. Build. Struct. 2012, 33, 38–46. [Google Scholar]
  24. GB 50010-2010; [2015 Edition] Code for Design of Concrete Structures. China Building Industry Press: Beijing, China, 2010.
  25. GB 50011-2010; Code for Seismic Design of Buildings. Ministry of Housing and Urban-Rural Development: Beijing, China, 2010.
  26. Yakut, A.; Yılmaz, H. Correlation of deformation demands with ground motion intensity. J. Struct. Eng. 2008, 134, 1818–1828. [Google Scholar] [CrossRef]
  27. Bo, J.; Zhang, J.; Sun, P.; Li, W.; Li, P. Discussion on seismic damage index and relevant problems. J. Nat. Disasters 2012, 21, 37–42. [Google Scholar]
  28. Xiaohui, Y. Probabilistic Seismic Vulnerability and Risk Analysis of Reinforced Concrete Frame Structures; Harbin Institute of Technology: Harbin, China, 2012. [Google Scholar]
Figure 1. Seismic damage of mountainous structures.
Applsci 14 04731 g001
Figure 2. Distribution of plastic hinges in low-cycle repeated loading tests for step-terrace frame structures.
Applsci 14 04731 g002
Figure 3. Structural model of the frame-rocking wall: (a) flat model (arrows represent horizontal seismic forces) (b) computing model.
Applsci 14 04731 g003
Figure 4. Three types of step-terrace frame structures.
Applsci 14 04731 g004
Figure 5. Earthquake acceleration response spectra. Each line in the figure represents the acceleration response spectrum of the 15 seismic waves in Table 1.
Applsci 14 04731 g005
Figure 6. The test site loading device.
Applsci 14 04731 g006
Figure 7. Structure dimensions and reinforcements of the step-terrace structure in the test.
Applsci 14 04731 g007
Figure 8. Hysteresis curves of horizontal force.
Applsci 14 04731 g008
Figure 9. Comparison of hinge distribution diagrams: (a) experimental results and (b) OPENSEES results.
Applsci 14 04731 g009
Figure 10. PGA curves corresponding to the limit state of the quantile curve for structures with different numbers of dropped spans: (a) immediate occupancy (IO), (b) life safety (LS), and (c) collapse prevention (CP).
Applsci 14 04731 g010
Figure 11. PGA curves corresponding to the limit state of the quantile curve for structures with different numbers of dropped layers: (a) immediate occupancy (IO), (b) life safety (LS), and (c) collapse prevention (CP).
Applsci 14 04731 g011
Figure 12. Earthquake probability demand model for structures with different numbers of dropped spans: (a) the probability demand model for the C2K1YBR structure in civil engineering, (b) the probability demand model for the C2K2YBR structure in civil engineering, and (c) the probability demand model for the C2K3YBR structure in civil engineering.
Applsci 14 04731 g012
Figure 13. Earthquake probability demand model for structures with different numbers of dropped layers: (a) the probability demand model for the C1K2YBR structure in civil engineering, (b) the probability demand model for the C2K2YBR structure in civil engineering, and (c) the probability demand model for the C3K2YBR structure in civil engineering.
Applsci 14 04731 g013
Figure 14. Vulnerability curves for structures with different numbers of dropped spans: (a) the vulnerability curve for the C2K1YBR structure in civil engineering, (b) the vulnerability curve for the C2K2YBR structure in civil engineering, and (c) the vulnerability curve for the C2K3YBR structure in civil engineering.
Applsci 14 04731 g014
Figure 15. Vulnerability curves for structures with different numbers of dropped layers: (a) the vulnerability curve for the C1K2YBR structure in civil engineering, (b) the vulnerability curve for the C2K2YBR structure in civil engineering, and (c) the vulnerability curve for the C3K2YBR structure in civil engineering.
Applsci 14 04731 g015
Figure 16. Damage state probability curves for structures with different numbers of spans: (a) the probability curve of damage states for the C2K1YBR structure in civil engineering, (b) the probability curve of damage states for the C2K2YBR structure in civil engineering, and (c) the probability curve of damage states for the C2K3YBR structure in civil engineering.
Applsci 14 04731 g016
Figure 17. Damage state probability curves for structures with different numbers of dropped layers: (a) the probability curve of damage states for the C1K2YBR structure in civil engineering, (b) the probability curve of damage states for the C2K2YBR structure in civil engineering, and (c) the probability curve of damage states for the C3K2YBR structure in civil engineering.
Applsci 14 04731 g017
Figure 18. Vulnerability index curves for structures with different numbers of spans: (a) C2K1YBR vulnerability index curve, (b) C2K2YBR vulnerability index curve, and (c) C3K2YBR vulnerability index curve.
Applsci 14 04731 g018
Figure 19. Vulnerability index curves for structures with different numbers of dropped layers: (a) C1K1YBR vulnerability index curve, (b) C2K2YBR vulnerability index curve, and (c) C2K3YBR vulnerability index curve.
Applsci 14 04731 g019
Figure 20. Safety margin ratios (SMR) for structures with different numbers of dropped spans: (a) safety margin ratio, S M R F E , for structures under multiple earthquakes, (b) safety margin ratio, S M R D B E , for structures under earthquake preparedness, and (c) safety margin ratio, S M R M C E , for structures under rare earthquakes.
Applsci 14 04731 g020
Figure 21. Safety margin ratios (SMR) for structures with different numbers of dropped layers: (a) safety margin ratio, S M R F E , for structures under multiple earthquakes, (b) safety margin ratio, S M R D B E , for structures under earthquake preparedness, and (c) safety margin ratio, S M R M C E , for structures under rare earthquakes.
Applsci 14 04731 g021
Table 1. The earthquake records.
NumberEarthquake NameTimeStationDuration(s)Magnitude
1NorthwestCalif-021941Ferndale City Hall38.986.6
2Borrego1942El Centro Array #9506.5
3Kern County1952Santa Barbara Courthouse75.447.36
4Northern Calif-031954Ferndale City Hall406.5
5El Alamo1956El Centro Array #959.986.8
6Borrego Mtn1968San Onofre–So Cal Edison45.26.63
7San Fernando1971Fairmont Dam61.16.61
8San Fernando1971Santa Anita Dam29.726.61
9Friuli-Italy-011976Tolmezzo36.386.5
10Tabas-Iran1978Sedeh407.35
11Imperial Valley-061979Cerro Prieto406.53
12Imperial Valley-061979Parachute Test Site39.366.53
13Loma Prieta1989Hayward City Hall–North39.426.93
14Loma Prieta1989SF–Presidio39.986.93
15Kobe-Japan1995Sakai1396.9
Table 2. The earthquake records.
Calculate the StructurePGAPGVPGD S a T 1
BD0.810.950.800.66
ND0.730.910.820.66
FR0.740.930.820.69
Table 3. Damage states and corresponding damage factor range and means.
Seismic Damage IndexDamage State
Slight Damage ( D S 1 )Moderate Damage ( D S 2 )Severe Damage ( D S 3 )Collapse ( D S 4 )
Extent (%)[0, 30][30, 55][55, 85][85, 100]
Mean Value (%)1542.57092.5
Table 4. CMR value of frames.
Structure Abbreviation I M 50 % I M M C E CMR
C2K1YBR0.75 g0.31 g2.42
C2K2YBR0.73 g0.31 g2.35
C2K3YBR0.69 g0.31 g2.23
C1K2YBR0.90 g0.31 g2.90
C3K2YBR0.68 g0.31 g2.19
Disclaimer/Publisher’s Note: The statements, opinions and data contained in all publications are solely those of the individual author(s) and contributor(s) and not of MDPI and/or the editor(s). MDPI and/or the editor(s) disclaim responsibility for any injury to people or property resulting from any ideas, methods, instructions or products referred to in the content.

