Article

Accurate Identification of Partial Discharge Signals in Cable Terminations of High-Speed Electric Multiple Unit Using Wavelet Transform and Deep Belief Network

by
Zhengwei Liu
1,
Jiali Li
2,
Tingyu Zhang
2,
Shuai Chen
2,
Dongli Xin
2,
Kai Liu
2,*,
Kui Chen
2,*,
Yong-Chao Liu
3,*,
Chuanming Sun
2,4,
Guoqiang Gao
2 and
Guangning Wu
2
1
CRRC Changchun Railway Vehicles Co., Ltd., Changchun 130062, China
2
School of Electrical Engineering, Southwest Jiaotong University, Chengdu 611756, China
3
Energy Department, UTBM, Université Bourgogne Franche-Comté, 90010 Belfort, France
4
CRRC Qingdao Sifang Co., Ltd., Qingdao 266000, China
*
Authors to whom correspondence should be addressed.
Appl. Sci. 2024, 14(11), 4743; https://doi.org/10.3390/app14114743
Submission received: 25 April 2024 / Revised: 21 May 2024 / Accepted: 27 May 2024 / Published: 30 May 2024
(This article belongs to the Section Electrical, Electronics and Communications Engineering)

Abstract

:
Cable termination serves as a crucial carrier for high-speed train power transmission and a weak part of the cable insulation system. Partial discharge detection plays a significant role in evaluating insulation status. However, field testing signals are often contaminated by external corona interference, which affects detection accuracy. This paper proposes a classification model based on wavelet transform (WT) and deep belief network (DBN) to accurately and rapidly identify corona discharge in the partial discharge signals of vehicle-mounted cable terminals. The method utilizes wavelet transform for noise reduction, employing the sigmoid activation function and analyzing the impact of WT on DBN classification performance. Research indicates that this method can achieve an accuracy of over 89% even with limited training samples. Finally, the reliability of the proposed classification model is verified using measured mixed signals.

1. Introduction

The vehicle-mounted cable system is a crucial component of the power transmission for high-speed trains, affecting the safety and reliability of high-speed train operation [1,2,3]. At the same time, the termination of vehicle-mounted cables, as weak points of the insulation, are prone to partial discharge, reducing overall insulation performance [4,5,6,7]. The cable termination often adopts multi-layer heat-shrink composite insulation structures [8]. Due to the differences in thermal conductivity, thermal expansion coefficients, and expansion rates between the materials in each layer (such as stress tubes and main insulation layers), during operation, temperature changes in the external environment and heat generation in the internal cable cores can lead to heat concentration at the interfaces between the materials in each layer [9,10,11]. Consequently, interlayer pressure decreases, and air gaps may form. Under high voltage, discharge is prone to occur at sites of electric field distortion, resulting in insulation failure or even explosion of the cable, causing power outage and suspension of high-speed train operations [12,13].
Partial discharge serves as a crucial technique for assessing the insulation status of cable termination [6,14,15,16]. The level of insulation degradation can be determined based on the detected partial discharge, prompting timely maintenance or replacement actions [17,18,19]. Nevertheless, the intricate operation environment of high-speed trains introduces significant interference that impacts the accurate detection of partial discharge [20,21,22]. There are three kinds of common interference signals, which are white noise interference, periodic narrowband interference, and random pulse interference [23,24]. Domestic and foreign scholars have conducted a lot of research on filtering white noise and periodic narrowband interference, but the research on filtering random pulse interference is relatively scarce [23,24,25,26,27]. Lu L [28] proposed that the advantages of the recursive continuous S-type algorithm are integrated into the adaptive noise cancellation system, which enhances the filtering performance of the system and can solve the problem of partial discharge noise in Gaussian and pulse scenarios at the same time. Long J [29] proposed the use of particle swarm optimization algorithms to optimize variational mode decomposition, adaptively breaking down the original partial discharge signals into a series of narrowband modes. A decision principle based on kurtosis is implemented to identify the pertinent components associated with partial discharge. Subsequently, residual white noise is reduced using wavelet transforms. Mohammed A. Shams [30] presented a method founded on maximum overlap discrete wavelet conversion for the purpose of denoising partial discharge signals generated by power cable defects contaminated with noise at different levels, achieving good denoising results. Sun K [31] utilized adaptive noise complete ensemble empirical mode decomposition to decompose power cable signals and used singular value decomposition to suppress frequency aliasing in the acquired components.
Affected by the complex operating environment of the train, different types of faults will occur in the cable terminal of the vehicle, and the discharge caused by the surface dirt of the cable terminal is corona discharge. As an interference signal, the presence of corona discharge will affect the diagnosis of cable terminal insulation faults. The realization of accurate identification of different discharge signals of cable terminals is helpful to obtain accurate partial discharge signals of cable terminals and to diagnose the process of internal fault occurrence in cable terminals [32,33,34]. With rapid developments in artificial intelligence (AI), its techniques are now widely used in electrical and energy systems [35,36,37,38,39,40,41,42,43,44,45,46]. These AI-related techniques include not only advanced methods but also foundational data analysis methods, which are integral to developing AI-powered pattern recognition methods. Researchers have explored the development of these comprehensive AI-powered methods for detecting and classifying partial discharge signals. These methods include those based on correlation coefficients [47,48], cluster analysis [49,50,51], support vector machines [52,53,54,55,56], and neural networks [49,57,58,59,60,61,62,63], among others.
Tang Y [26] proposed an empirical mode decomposition (EMD)-based method for partial discharge signal noise reduction. The noisy signal is decomposed into modal components of different frequencies, the relationship between the modal components is determined according to the cross-correlation method, and the effective modal components are selected for reconstruction so as to achieve signal noise reduction. But components with similar frequencies can be separated in different modes, thereby affecting the accuracy of noise reduction. Peng X [64] introduced an automatic pattern recognition technique based on partial discharge phase spectrum K-means clustering, and the technique is applied to recognize partial discharge pattern recognition without phase reference information and to suppress interference signals. But this technology may be sensitive to initial conditions and the number of clusters. Alvarez F [65] computed representative parameters linked to the shape of every pulse waveform by utilizing signal feature generation algorithms, allowing them to be separated into different clusters. This effectively classifies the measured partial discharge signals and pulsed noise interference in power cables. Wang J [66] employed the high frequency separation technique to discriminate four kinds of partial discharge, extracting characteristic parameters. By selecting appropriate kernel functions, optimizing support vector machines (SVMs) with principal component analysis (PCA) was performed. The recognition precision can reach 97%, but it requires extensive optimization and feature extraction processes. Li L [67] proposed a method for identifying different sources of partial discharge by utilizing the combined principal of PCA and SVMs. Three features most representative of the original data were selected from ten features. A support vector machine recognition model was developed by utilizing the grey wolf optimization (GWO) algorithm to optimize the kernel factor g and the non-negative punishment function c. This approach involved tailoring the SVM model through GWO techniques to enhance its performance. But, its optimization process is time-consuming, resulting in limited usage scenarios. Ref. [68] conducted experimental research on the partial discharge phenomenon of internal insulation in transformers. They used wavelet packet analysis technology to perform time–frequency decomposition and feature extraction on the signal, thereby obtaining fractal dimensions on different frequency bands. The reciprocal of fractal dimensions was used as the feature parameter and input into an improved support vector machine. The recognition results indicate that even with a small number of samples, this method can still achieve a high recognition rate and fast convergence speed. However, this method may not be able to capture all necessary signal features in complex signals due to its dependence on fractal dimensions. Masoud Karimi et al. [69] proposed a partial discharge pattern recognition method based on deep belief network (DBN); collected three discharge signals of corona discharge, internal discharge, and surface discharge; constructed vector parameterization (PRPD) of phase decomposition partial discharge; and extracted four different features. Three different discharge signals can be classified by using DBN. Xiaosheng P [70] carried out laboratory tests on different types of artificial manufacturing defects in ethylene propylene rubber (EPR) cables and carried out partial discharge tests. Features were derived from the mixed signals and a convolutional neural network model was used for signal classification and recognition, demonstrating higher accuracy than SVMs and back-propagation neural networks. But, it is time-consuming due to manual feature extraction.
In comparison to the methods mentioned above, this paper proposes a partial discharge classification model based on wavelet transform and DBN (WT-DBN) for accurate identification of corona interference in partial discharge signals of vehicle-mounted cable termination. The contributions made in this article are as follows:
(1) This model can accurately identify corona interference in partial discharge signals of vehicle cable termination without the need for manual feature extraction.
(2) The use of WT for signal denoising processing, combined with DBN, improves the accuracy of signal classification.
(3) This model explores the impact of different activation functions and training data volumes on recognition results based on runtime and accuracy requirements in different scenarios.
(4) By conducting experiments on mixed signals containing corona discharge and partial discharge, it was verified that the method proposed in this paper can accurately detect partial discharge signals in mixed signals containing corona discharge.

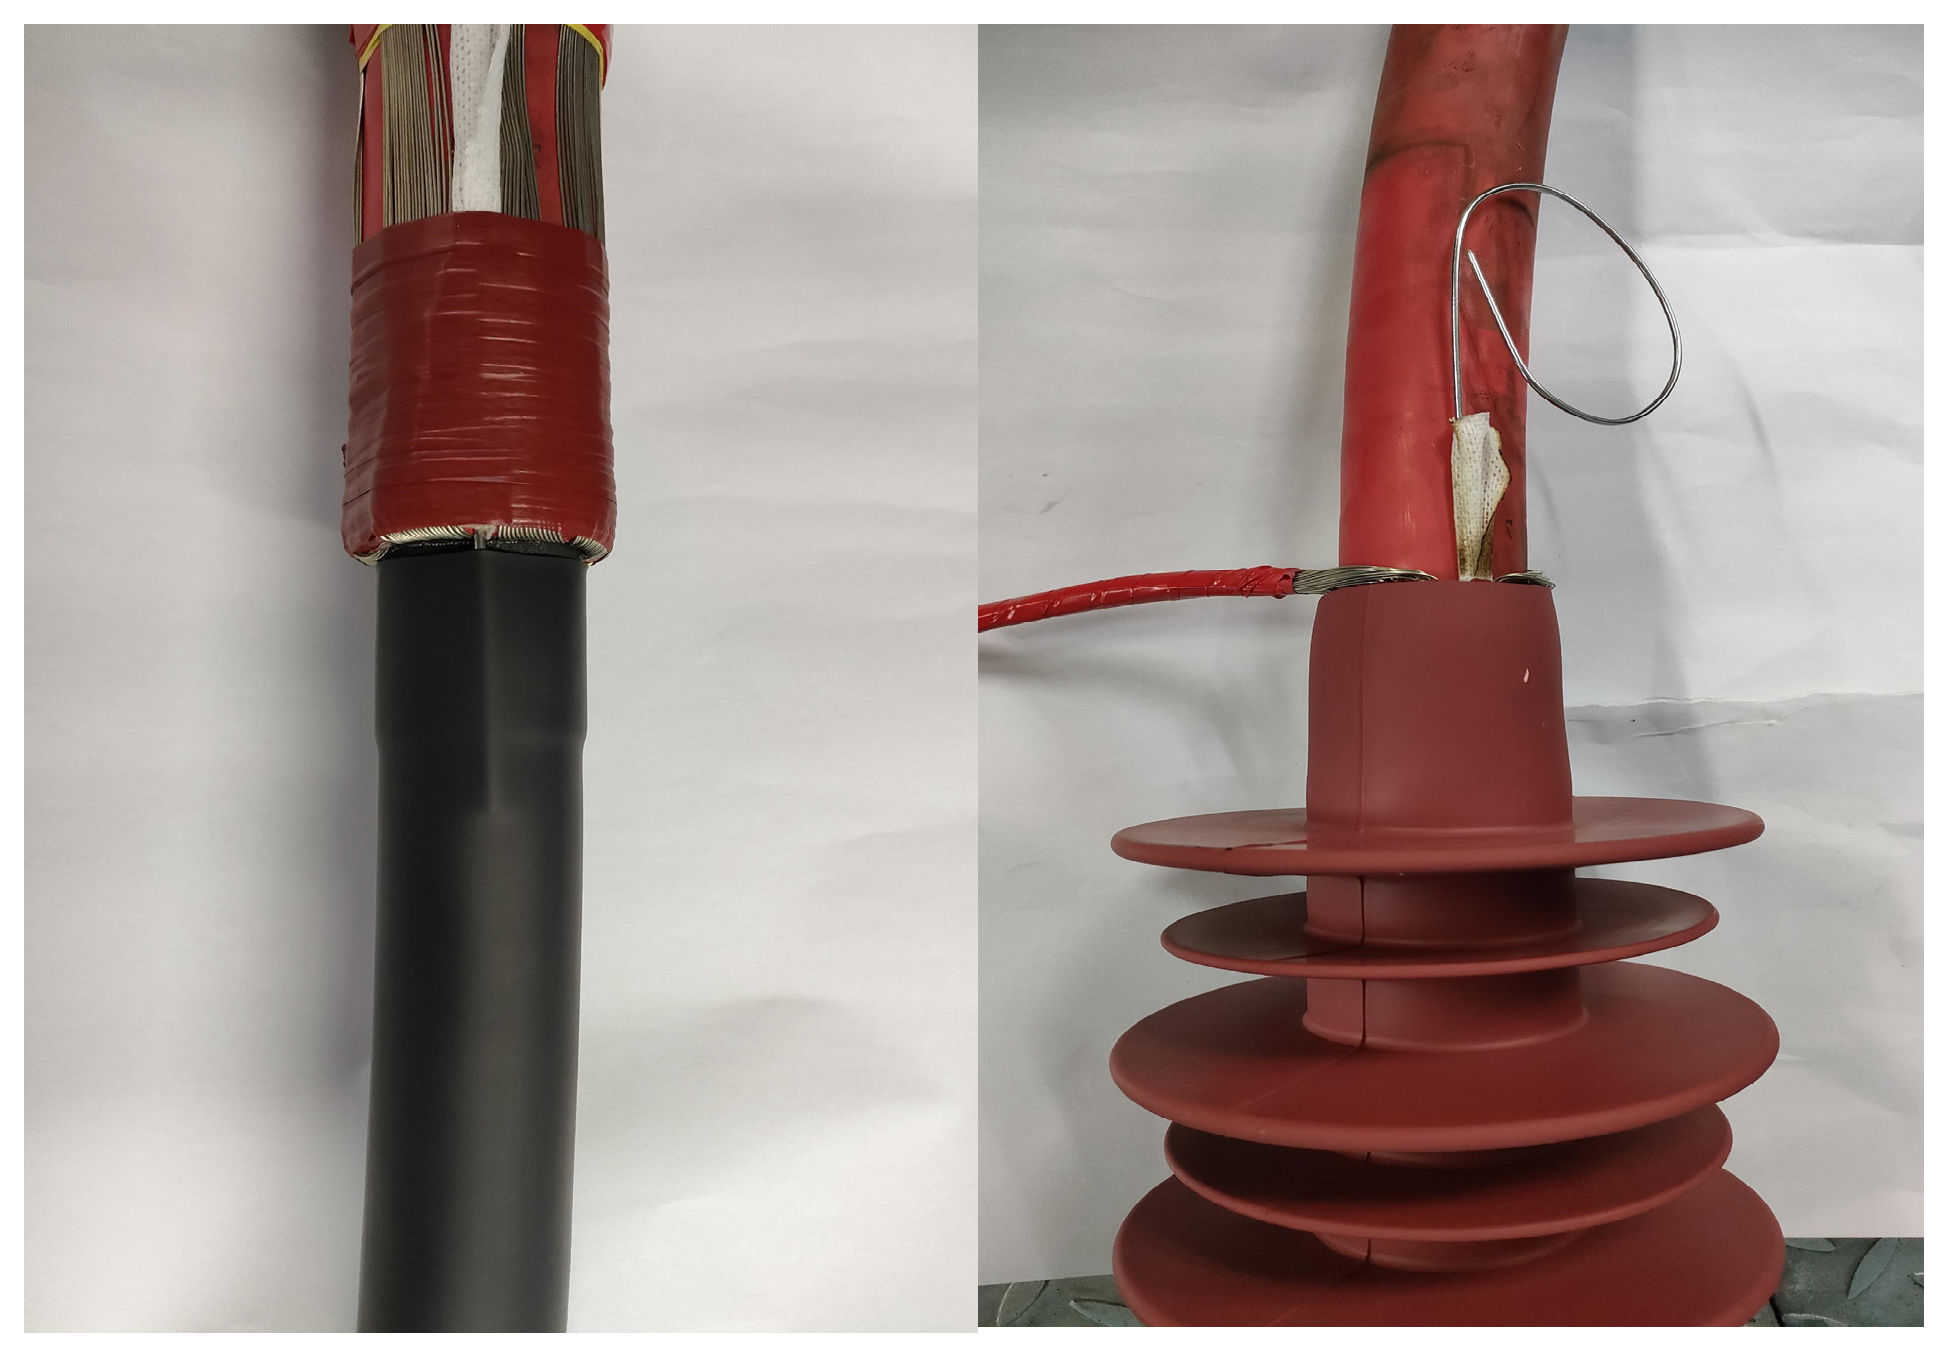
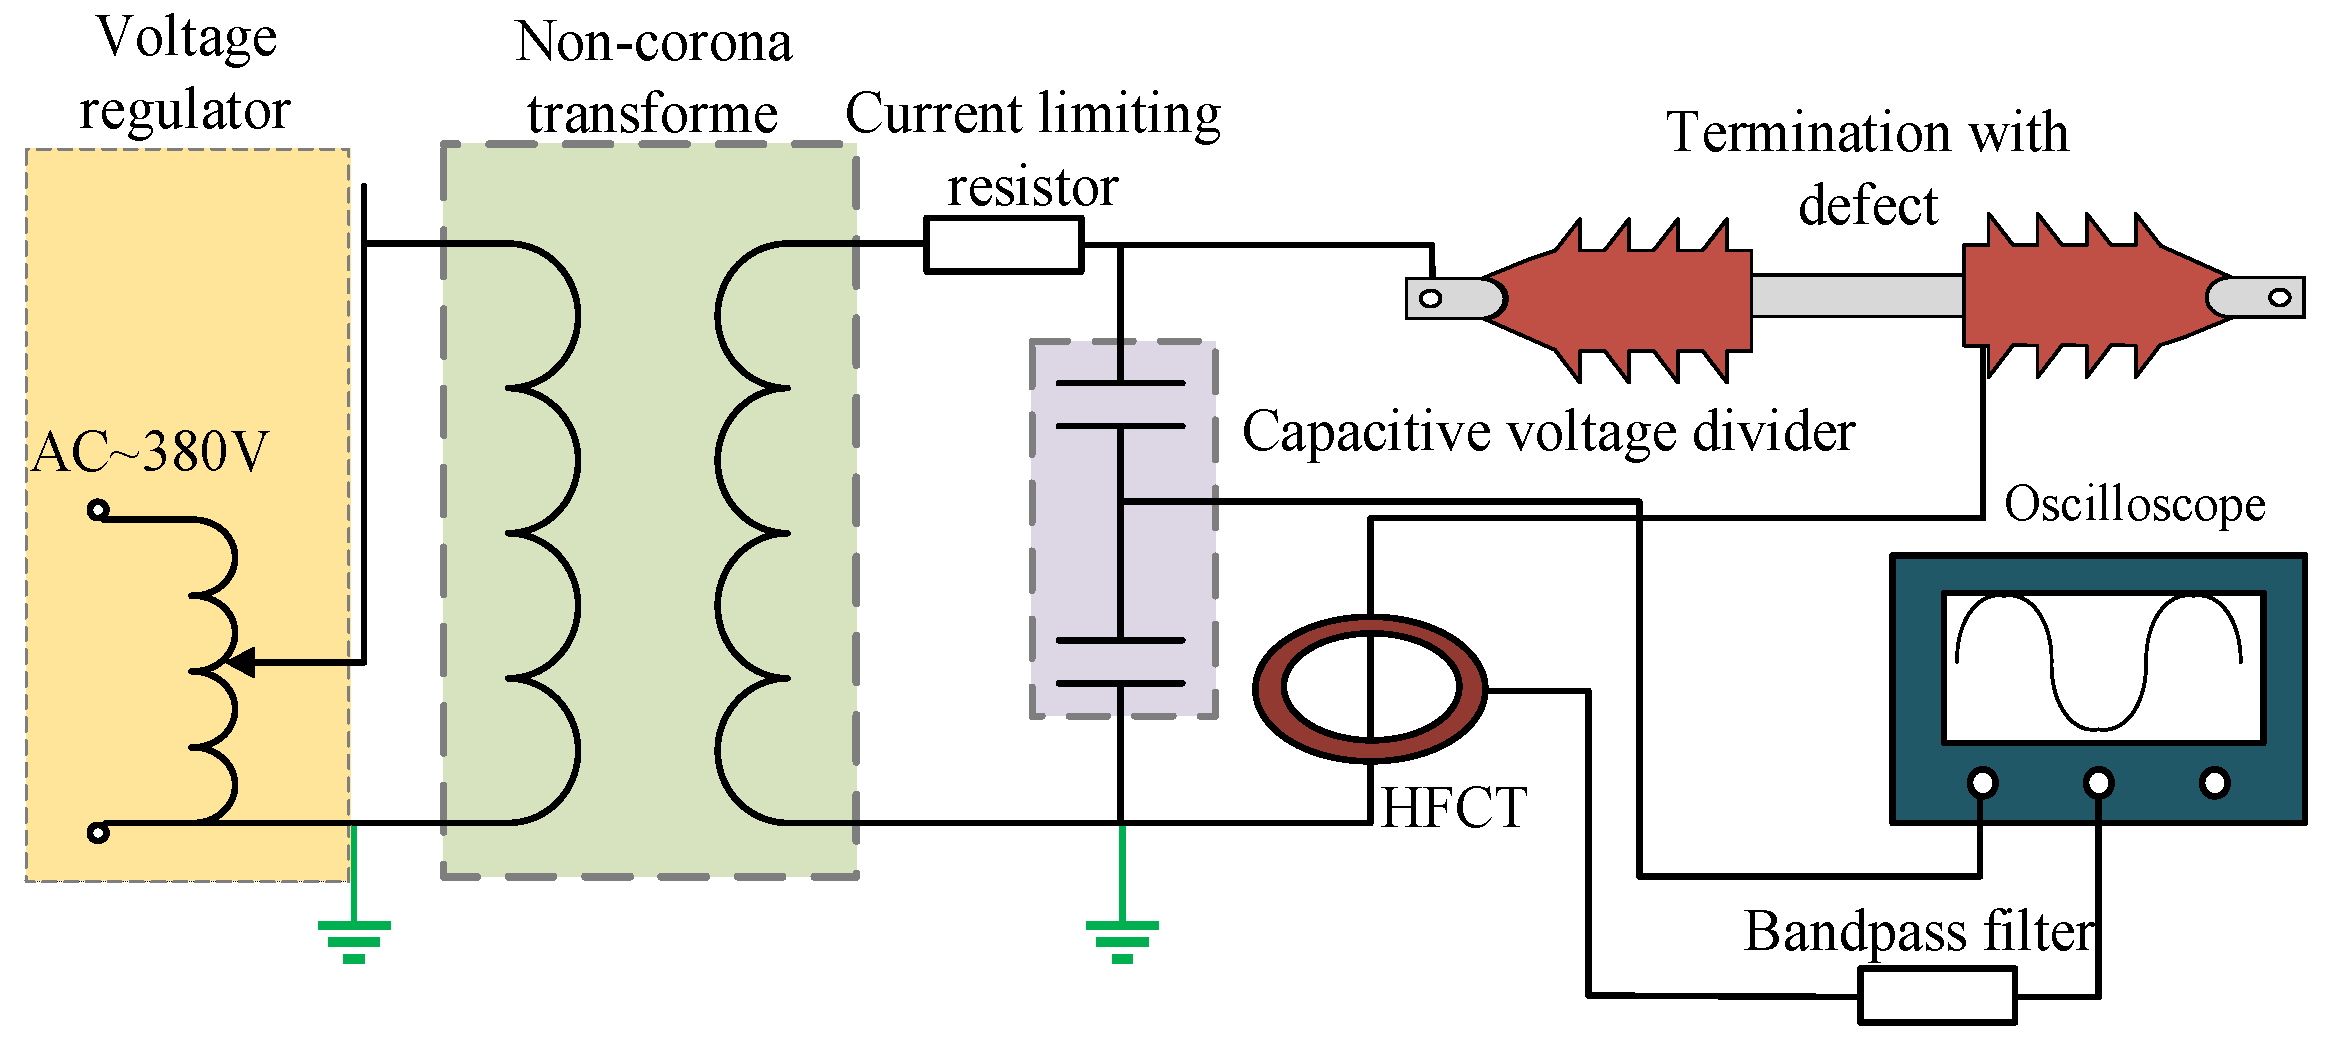
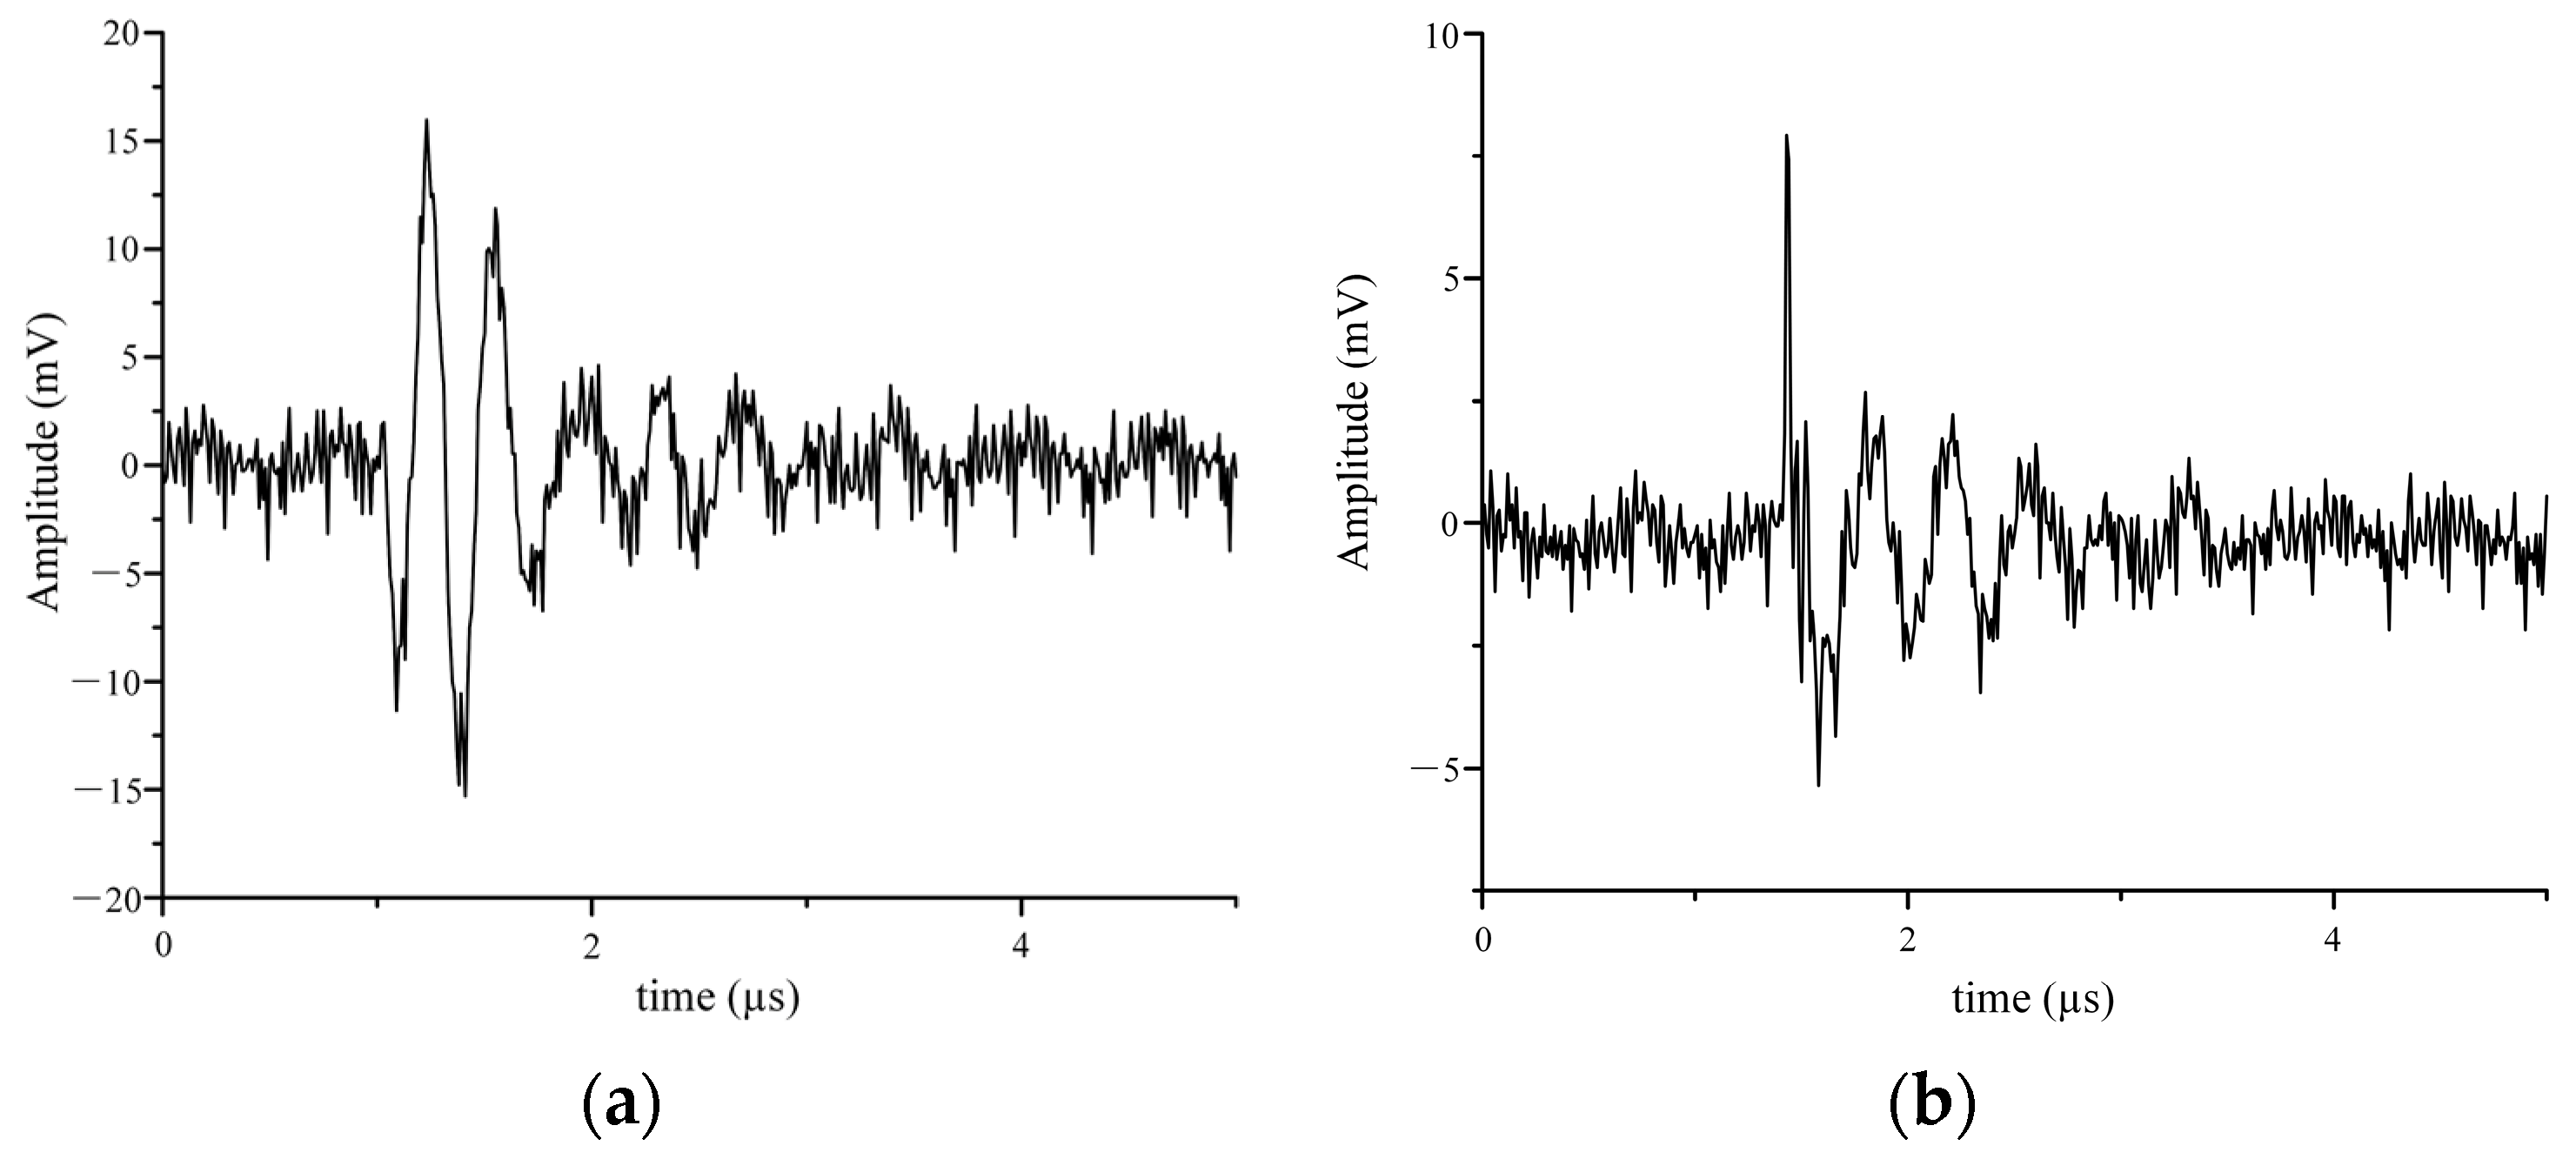
2. Partial Discharge Data Acquisition

The vehicle cable termination undergoes stress due to electrical, magnetic, thermal, mechanical, and flow effects during operation, leading to aging of the insulation material and the formation of gaps between different insulation materials. This can result in partial discharge under high electric field, leading to insulation failure and faults in the cable termination. The termination structure of vehicle-mounted cables mainly consists of cable cores, inner semiconducting layers, main insulation, carbon traces, air gaps, insulation pipes, stress control pipes, insulation glue, and umbrella skirts. In the laboratory environment, to simulate on-site air-gap discharge faults, the manufacturer was commissioned to manufacture cable terminals with air-gap defects. Cable termination is cut at the interface of the stress layer and the main insulation to create a 50 mm long and 2 mm wide gap, and the integrity of the defect was maintained by introducing a steel needle into the gap, which was subsequently removed for testing purposes. The structure of the artificial defect cable termination can be observed in Figure 1, and the physical image is provided in Figure 2.
The high-frequency current technique (HFCT) is employed for the detection of the pulse current signal emanating from partial discharge sources. The coil-type sensor is installed on the cable termination grounding wire. The partial discharge testing platform is mainly composed of a power supply, a corona-free transformer, a protective resistor, and a coupling capacitor. Connecting the AC power supply to the isolation transformer can ensure that its power supply has no interference. The input of the voltage regulator is 380 V AC power frequency, and the output is continuously adjustable from 0 to 500 V. The voltage level is improved using a non-partial discharge transformer with a transformation ratio of 1:400 and a capacity of 200 kVA. A 5 kΩ current-limiting resistor is connected in series to the test circuit to prevent large currents from occurring during breakdown. The transformation ratio of the capacitor voltage divider is 1000:1.
When there is an air gap between the inner layers of the cable termination, partial discharge occurs within the gap and is coupled to the cable-shielding layer through cable distributed capacitance, generating pulsed current at the shielding layer ground connection. High-frequency current sensors (Rogowski coils) are installed on the ground wire for the detection of ultrahigh-frequency pulsed current signals [71]. The laboratory constructed a circuit for partial discharge testing using the HFCT method, as shown in Figure 3. The cable termination with a gap defect in the above test circuit is replaced with a defect-free cable termination, and a probe is inserted at the cable end to detect and record corona discharge without partial discharge. The cable termination with a defect is probed at the end to identify and document mixed signals of partial discharge and corona discharge. The entire experiment is conducted with a sampling frequency of 100 MHz. Figure 4 and Figure 5 show waveform diagrams of partial discharge, corona discharge, and a mixture of corona and partial discharge obtained from three types of experiments.

3. Classification Algorithm Design

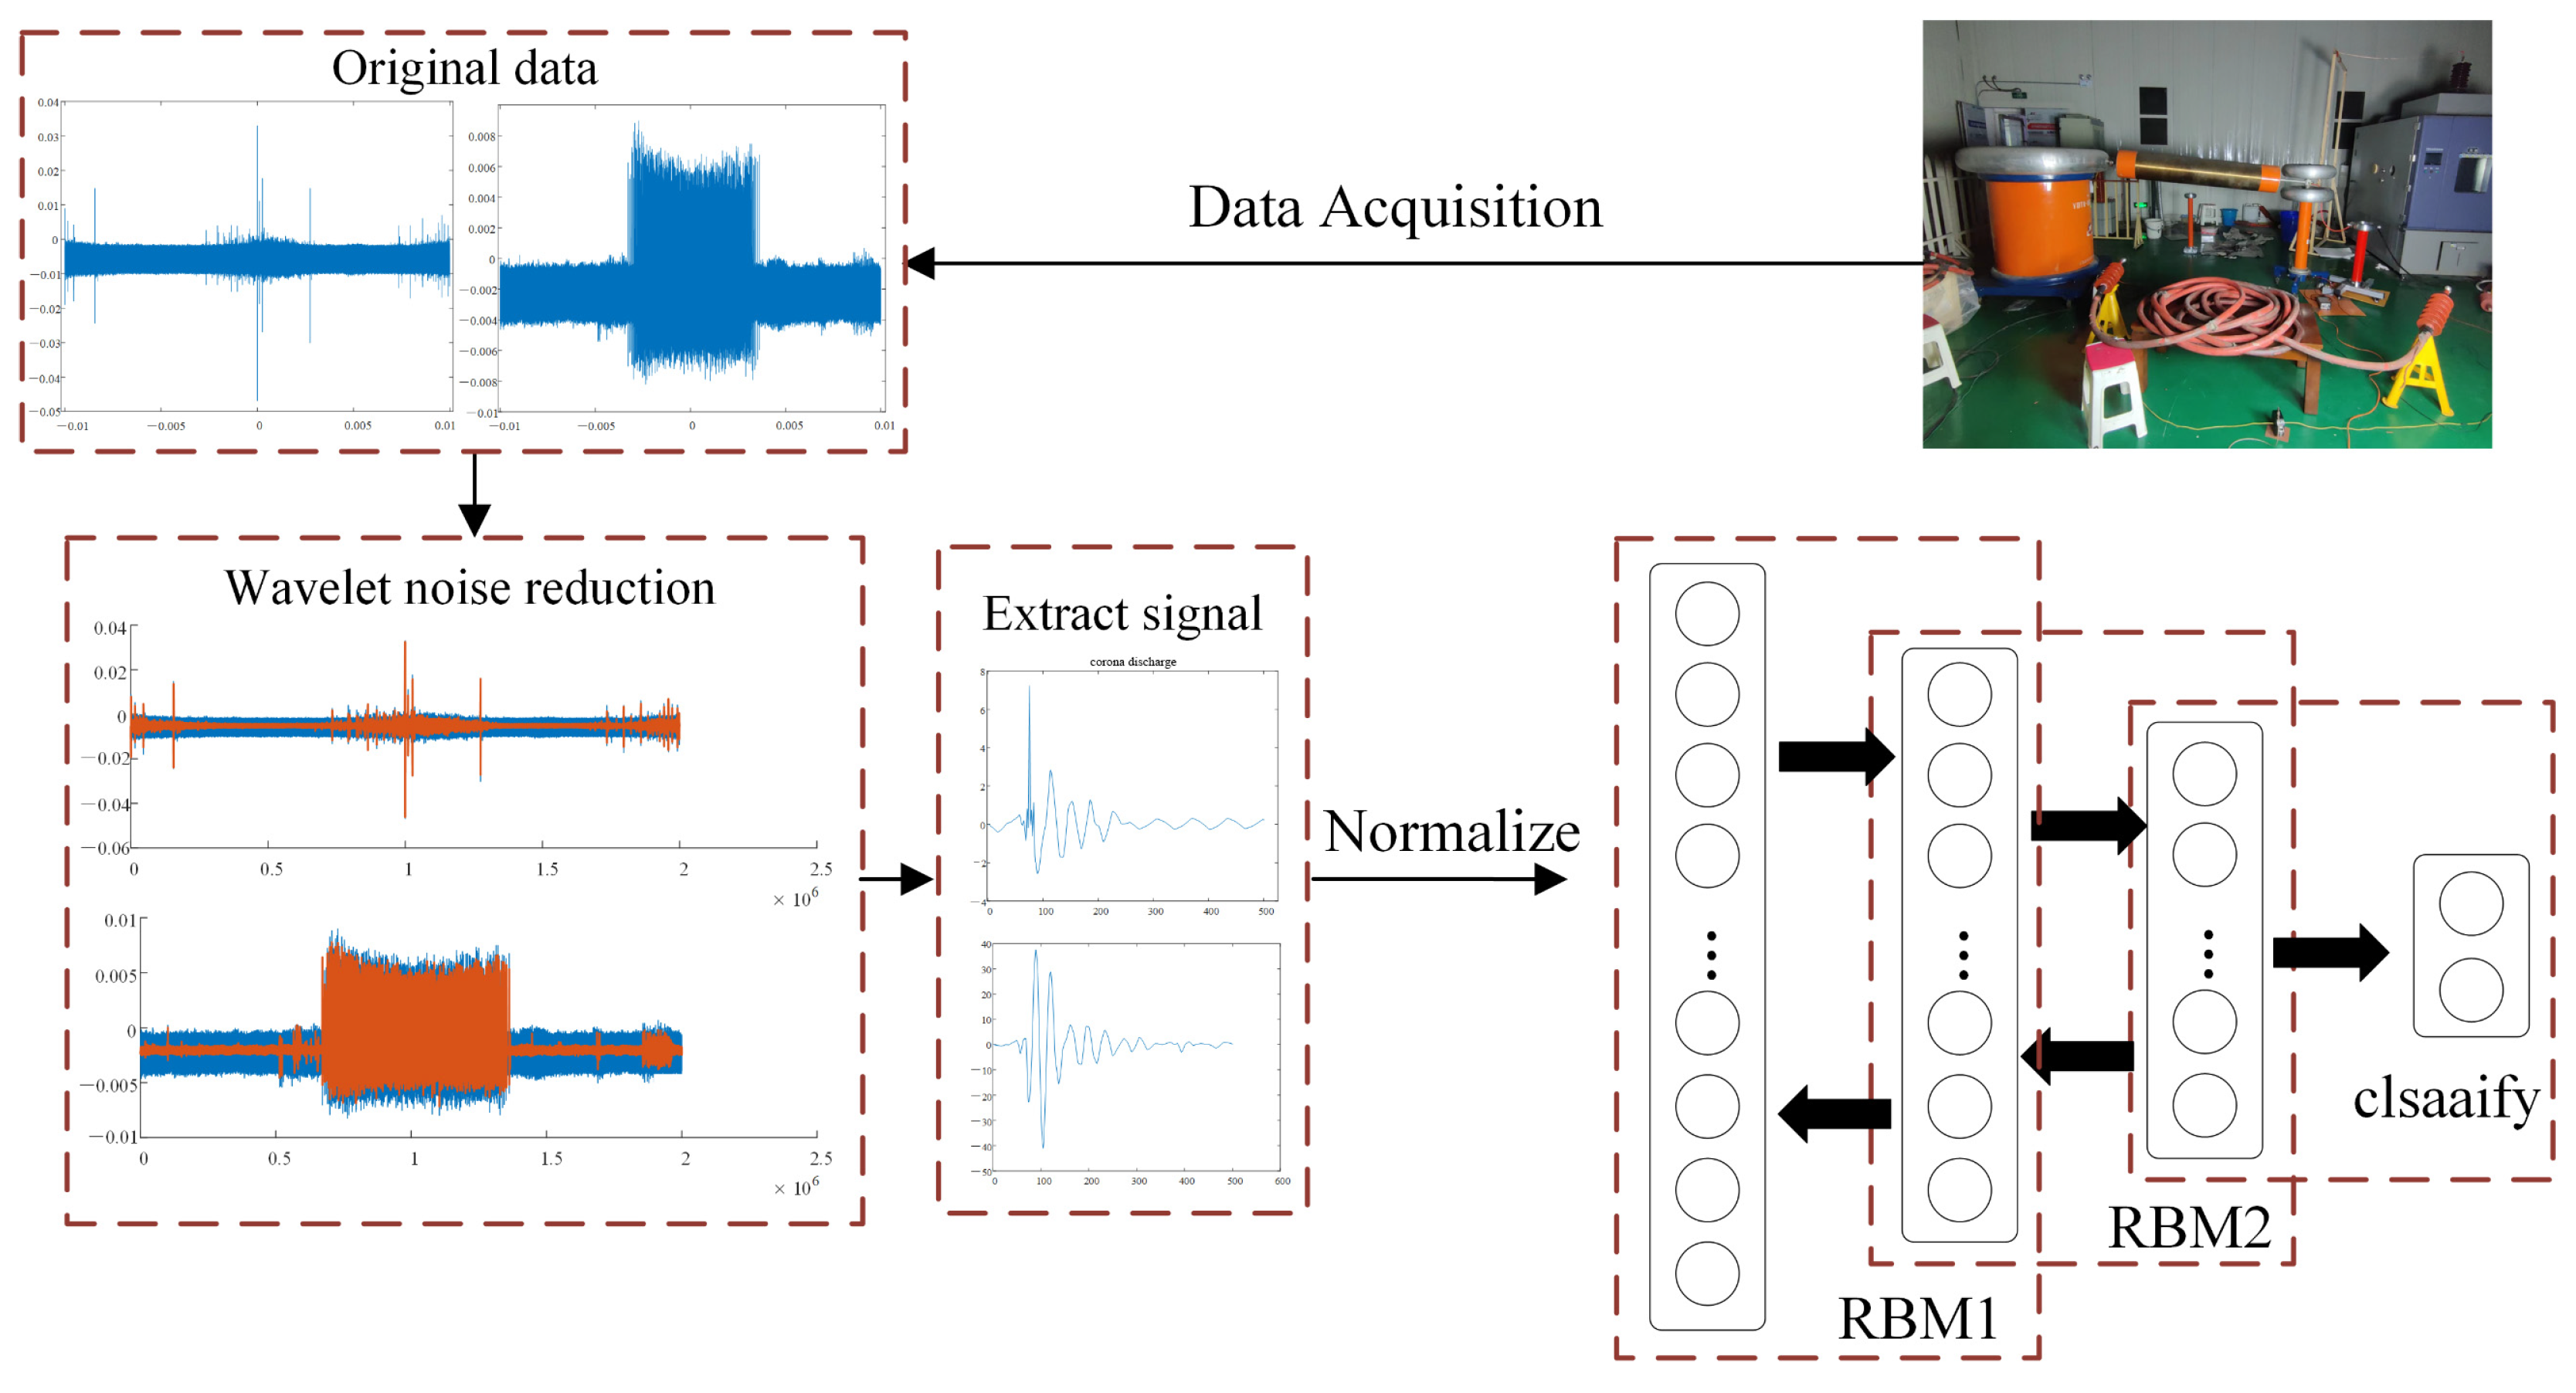
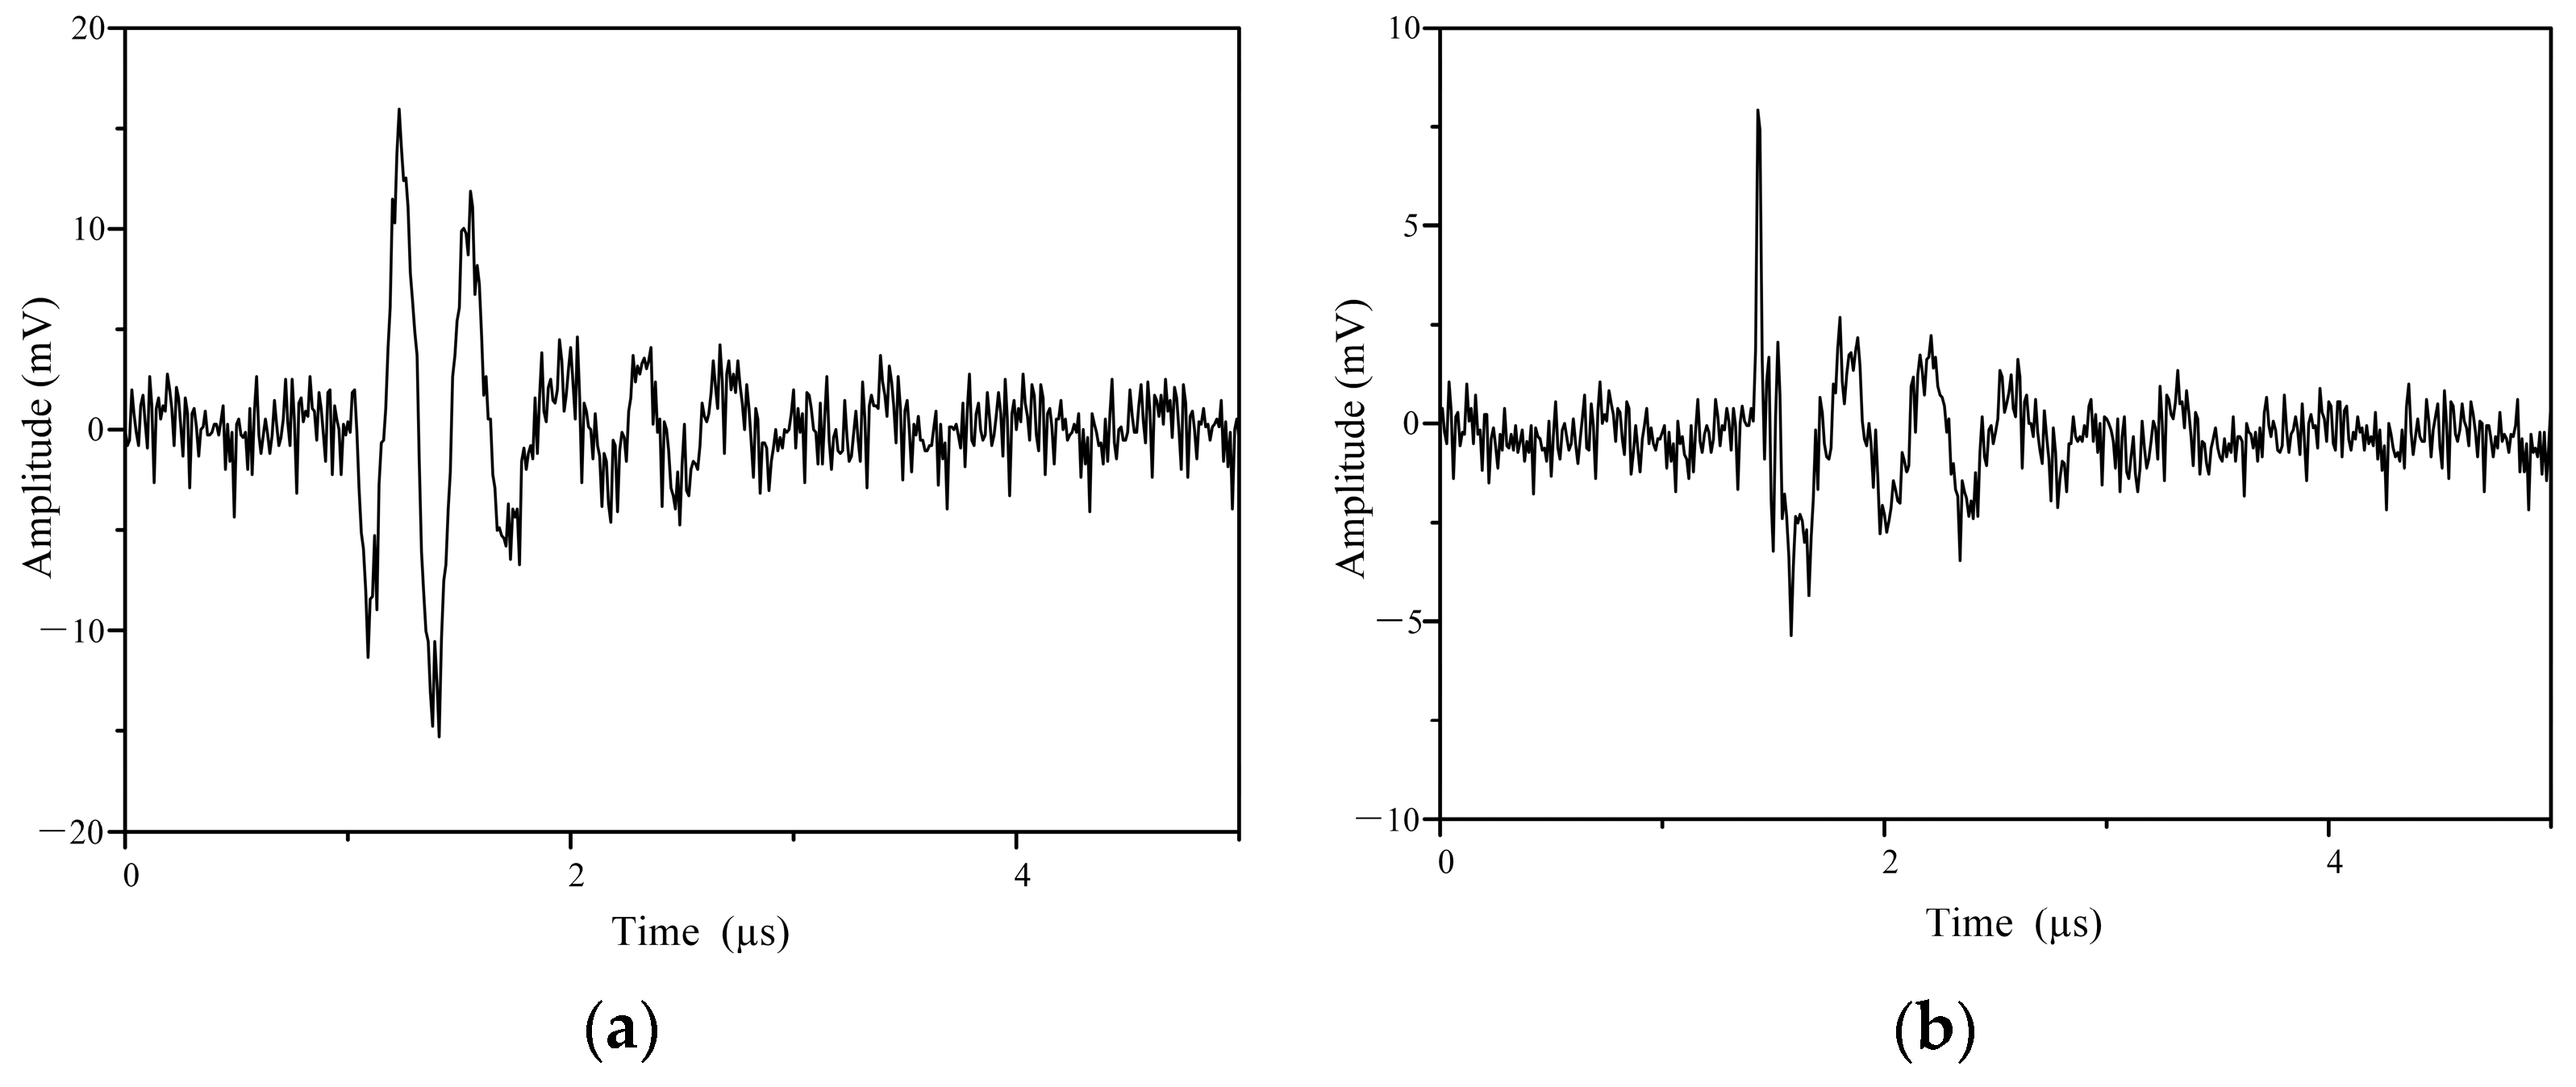
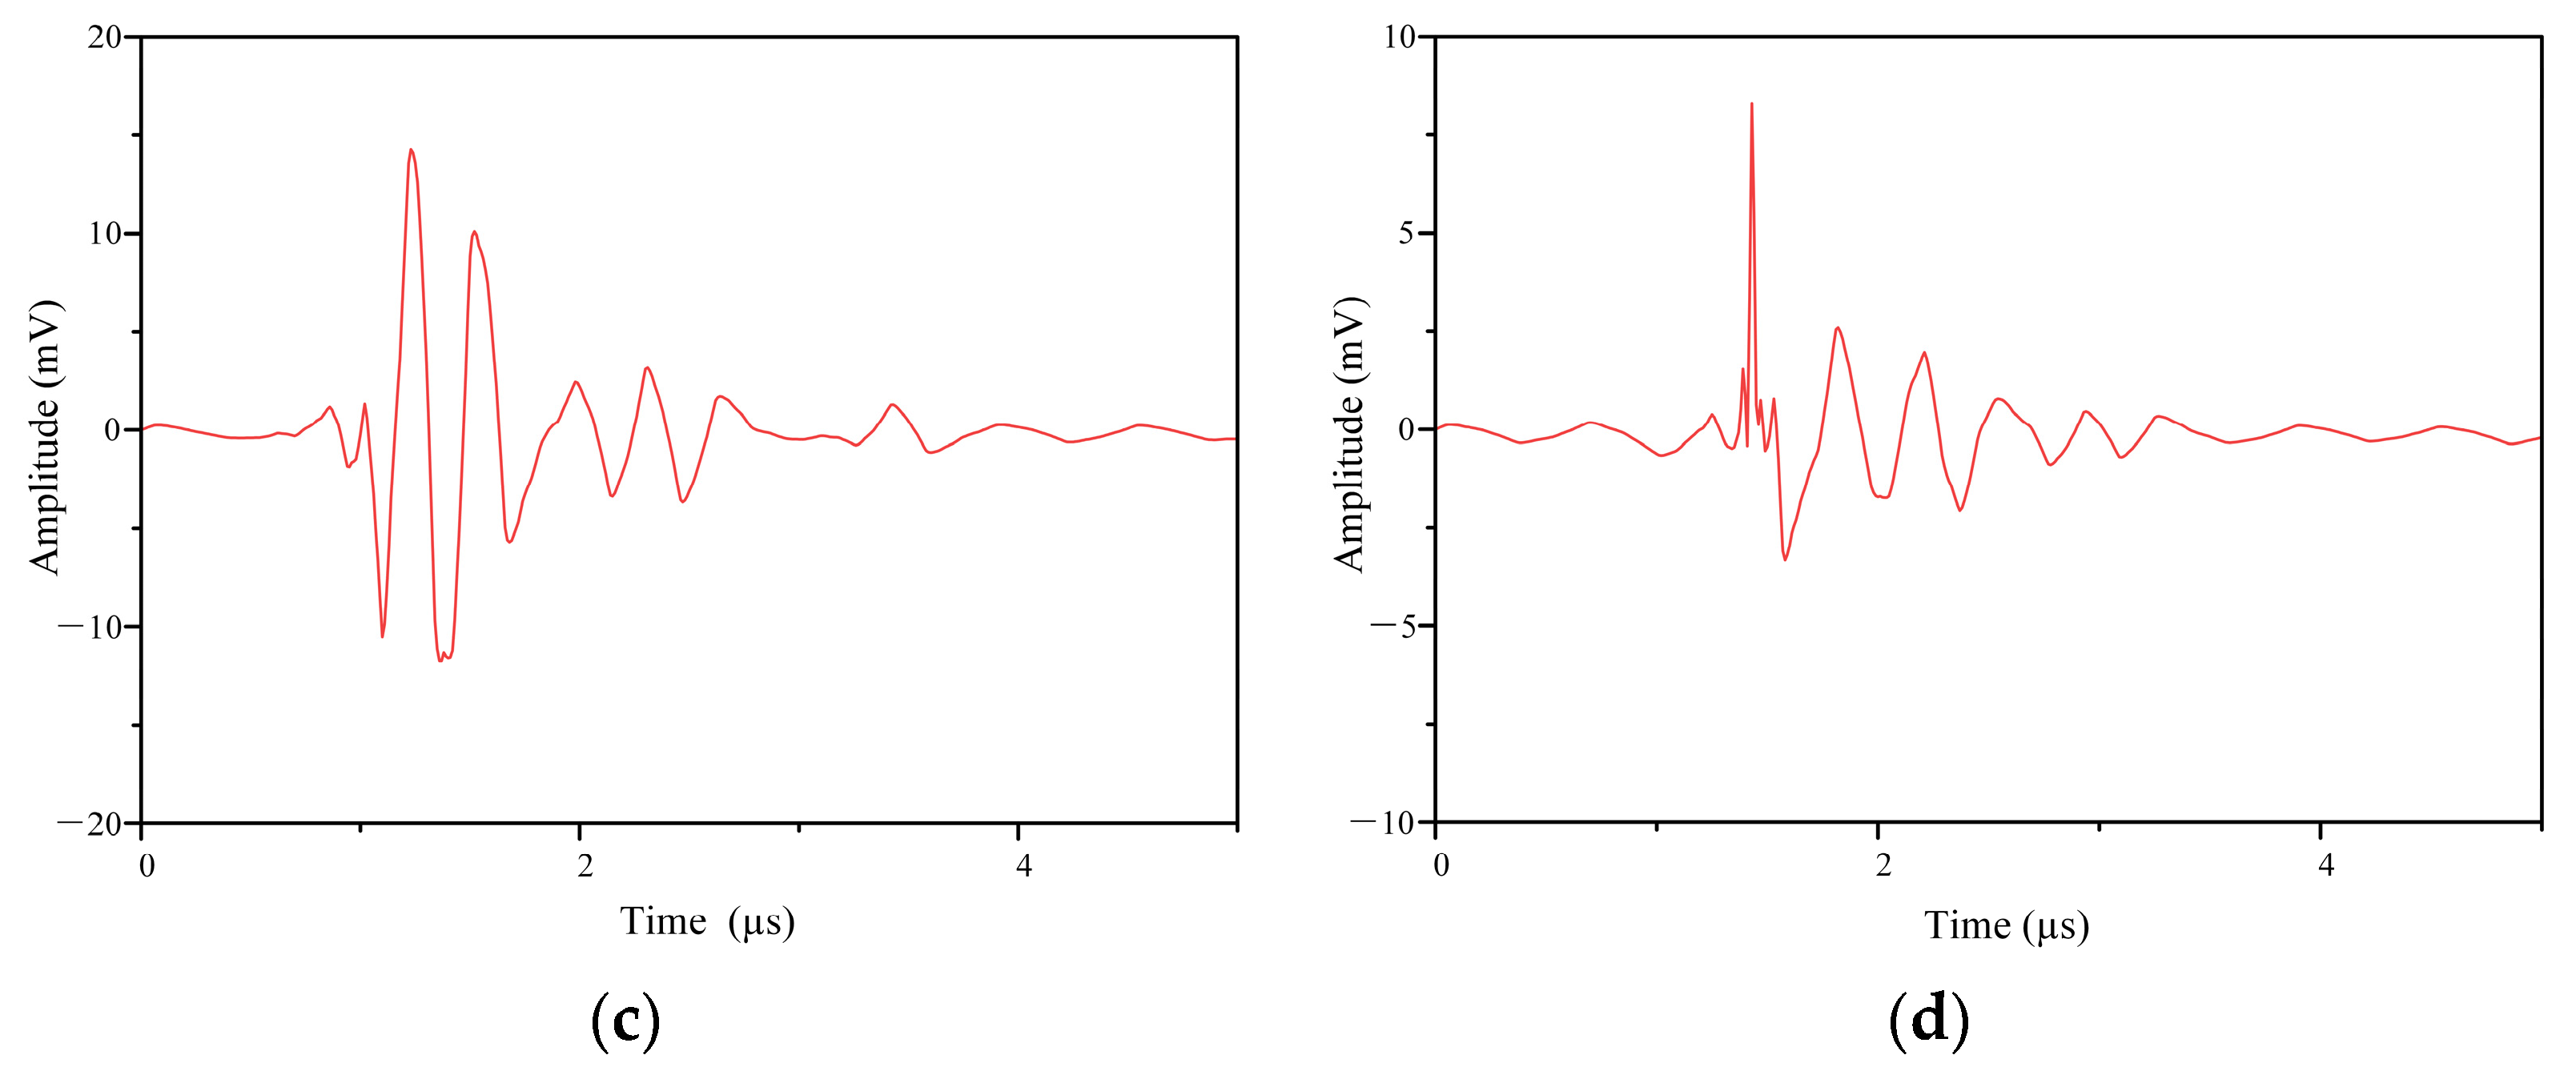
3.1. Noise Reduction Based on Wavelet Transform

The acquisition of partial discharge and corona discharge signals under controlled laboratory conditions is a reliable method for minimizing extraneous noise; however, the existence of white noise can still distort the original signals. Traditional denoising methods include various types, such as the empirical wavelet and wavelet transform (WT) denoising methods [72,73,74,75,76]. WT achieves optimal signal processing results for different signal types by selecting different wavelet basis functions, effectively removing noise from the signal. Addressing this problem, this research employs a wavelet denoising technique to eliminate white noise interference from the signals gathered in the laboratory. The wavelet base function is selected as sym4, and the decomposition level is 8, and white noise displays distinct characteristics. Specifically, the maximal modulus of wavelet transforms for partial discharge and corona discharge tend to increase with the scale, whereas background noise demonstrates contrasting behavior. Through successive wavelet decompositions, the magnitude of the wavelet coefficients associated with the noise diminishes. By establishing appropriate thresholds for high-frequency constituents, wavelet coefficients below the threshold are nullified. Subsequently, the denoised partial discharge and corona discharge signals are reconstructed using the processed wavelet coefficients, resulting in enhanced signal fidelity.
This paper employs discrete wavelet conversion, with the transformation formula depicted as:
Ψ j , k t = a 0 j 2 ψ t k a 0 j b 0 a 0 j = a 0 j 2 ψ a 0 j t k b 0
where a = a 0 j and b = k a 0 j b 0 represent the scale parameter and shift parameter, respectively, j , k Z .
The discrete wavelet coefficients that correspond to the transformation can be depicted as:
C j , k = + f ( t ) ψ j , k * ( t ) d t = < f , ψ j , k >
This study employs the median threshold determined through empirical Bayesian estimation, where σ n represents the variance of the interference signals, σ s represents the variance of the raw signals, and σ represents the variance of the contaminated signals, and their relationship is as follows:
σ 2 = σ s 2 + σ n 2
Estimate the noise variance generated by high-frequency wavelet transforms with Formula (5), and Formula (6) is used to estimate the noisy signal variance.
σ n = m e d i a n ( | ω i ( j , k ) | ) 0.6745
σ 2 = 1 n 2 j , k = 1 n ω i 2 ( j , k )
From Equations (3)–(5), the variance of raw signals can be expressed as Equation (6):
σ s = max [ σ n 2 σ 2 , 0 ]
Thus, the Bayesian threshold formula can be expressed as depicted in Equation (7):
λ = σ n 2 σ 2
This study employs one median threshold formula for selecting wavelet coefficients. Above all, the denoising process of wavelet transform is shown in Figure 6.

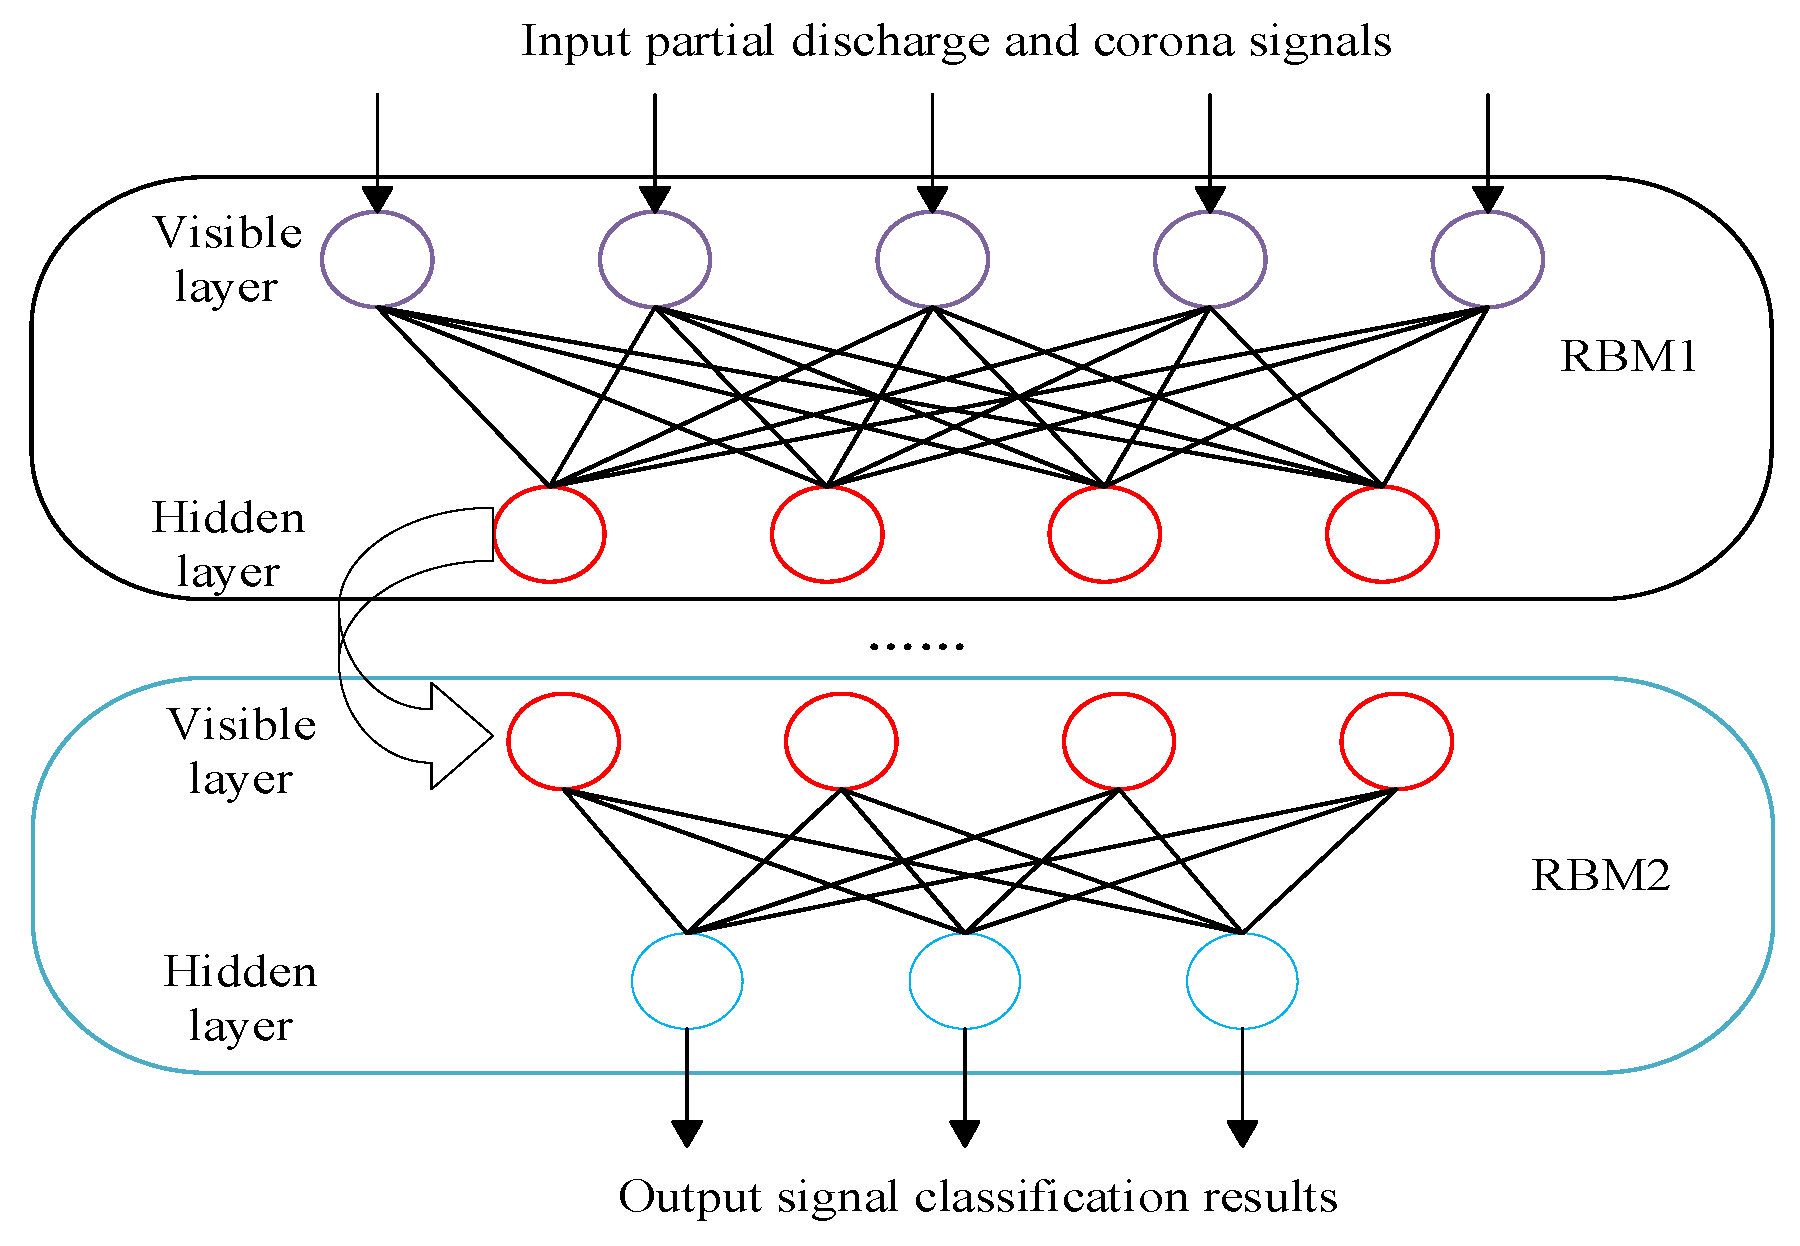
3.2. Deep Belief Network

Deep belief networks (DBNs) include multiple Restricted Boltzmann Machines (RBMs) used for unsupervised feature learning and generation tasks [77,78,79]. By sequentially training a DBN, the inferred representation of the hidden layer from the data vector in each step is utilized as the data vector input for the next layer in the network. The RBM is composed of observable neurons and latent neurons forming multiple layers of neurons, where visible neurons receive inputs and hidden neurons extract features.
The RBM incorporates weights denoted as w to signify the connection strength between interconnected neurons. Additionally, each neuron is assigned a bias coefficient to indicate its individual weight. Consequently, the energy of an RBM is formally articulated through the ensuing formula:
E v , h = i = 1 N v b i v i j = 1 N h c j h j i , j = 1 N v , N h W i j v i h j
The likelihood of hidden layer neuron activation in an RBM is as follows:
P h j v = σ ( b j + i W i , j x i )
Due to bidirectional connections, the neurons within the latent layer have the capability to stimulate neurons found in the visible layer:
P v i h = σ ( c i + j W i , j h j )
The independence of neurons within a given layer leads to their probability densities satisfying independence as well, thereby yielding the subsequent equation:
P h v = j = 1 N h P h j v
P v h = i = 1 N v P v i h
The preceding depiction shows the fundamental architecture of an RBM.
DBN can be viewed as a probabilistically derived model, establishing the distribution function from data to labels, allowing the neural network to train on the dataset with maximum probability, widely used in the data classification and feature recognition fields. In this study, DBN is utilized for the classification of partial discharge and corona discharge signals in cable termination. The schematic representation of the model can be observed in Figure 7.

3.3. WT-DBN Classification Steps

In response to the measured partial discharge and corona discharge, a classification process based on WT-DBN is proposed, as shown in the flowchart in Figure 8, and the prescribed steps are outlined as follows:
(1) Signal Acquisition. Partial discharge signals and corona discharge signals at vehicle-mounted cable termination are measured using the HFCT method.
(2) Signal Denoising. The detecting signals are denoised by employing a wavelet denoising technique grounded in the empirical Bayes method to eliminate white noise interference.
(3) Dataset Formation. Individual signals are extracted with 500 sampling points selected, resulting in a signal time length of 5 µs per individual signal, with 150 sets each for partial discharge and corona discharge signals.
(4) Data standardization. To simplify the dataset, address any existing outliers, speed up gradient descent for the most effective solutions, and improve model precision and convergence rate, the data from step (3) are standardized by formula (13):
Y i = y i y m i n y m a x y m i n
where y i is the original dataset, Y i is the standardized dataset, y m i n is the minimum of the dataset, and y m a x is the maximum of the dataset.
(5) DBN recognition and classification. The standardized results derived in step (4) serves as the input data for the DBN model, yielding classification outcomes following traversal through numerous visible and hidden layers.

4. Analysis of Classification Results

The binary classification issue addressed in this study can be categorized into the following four scenarios:
(1) True Partial Discharge (TPD): The truth is partial discharge signal, and the prognosis is correct.
(2) True Corona Discharge (TCD): The truth is corona discharge signal, and the prognosis is correct.
(3) False Partial Discharge (FPD): The truth is partial discharge signal, but the prognosis is wrong.
(4) False Corona Discharge (FCD): The truth is corona discharge signal, but the prognosis is incorrect.
Accuracy is selected as the evaluation metric, expressed as (14):
A C C = T P D + T C D T P D + T C D + F P D + F C D
This study employs softmax as the classifier, and thus the cross-entropy is employed as the loss function to delineate the dissimilarity between the probability distributions of anticipated values and the values corresponding to the labels, reflecting the model’s fitting extent [68], as shown in (15):
l o s s = 1 N n = 1 N i = 1 k y i ( n ) log ( p i ( n ) )
where y i represents the label value of sample i, and p i denotes the percentage of correctly predicting the sample i.

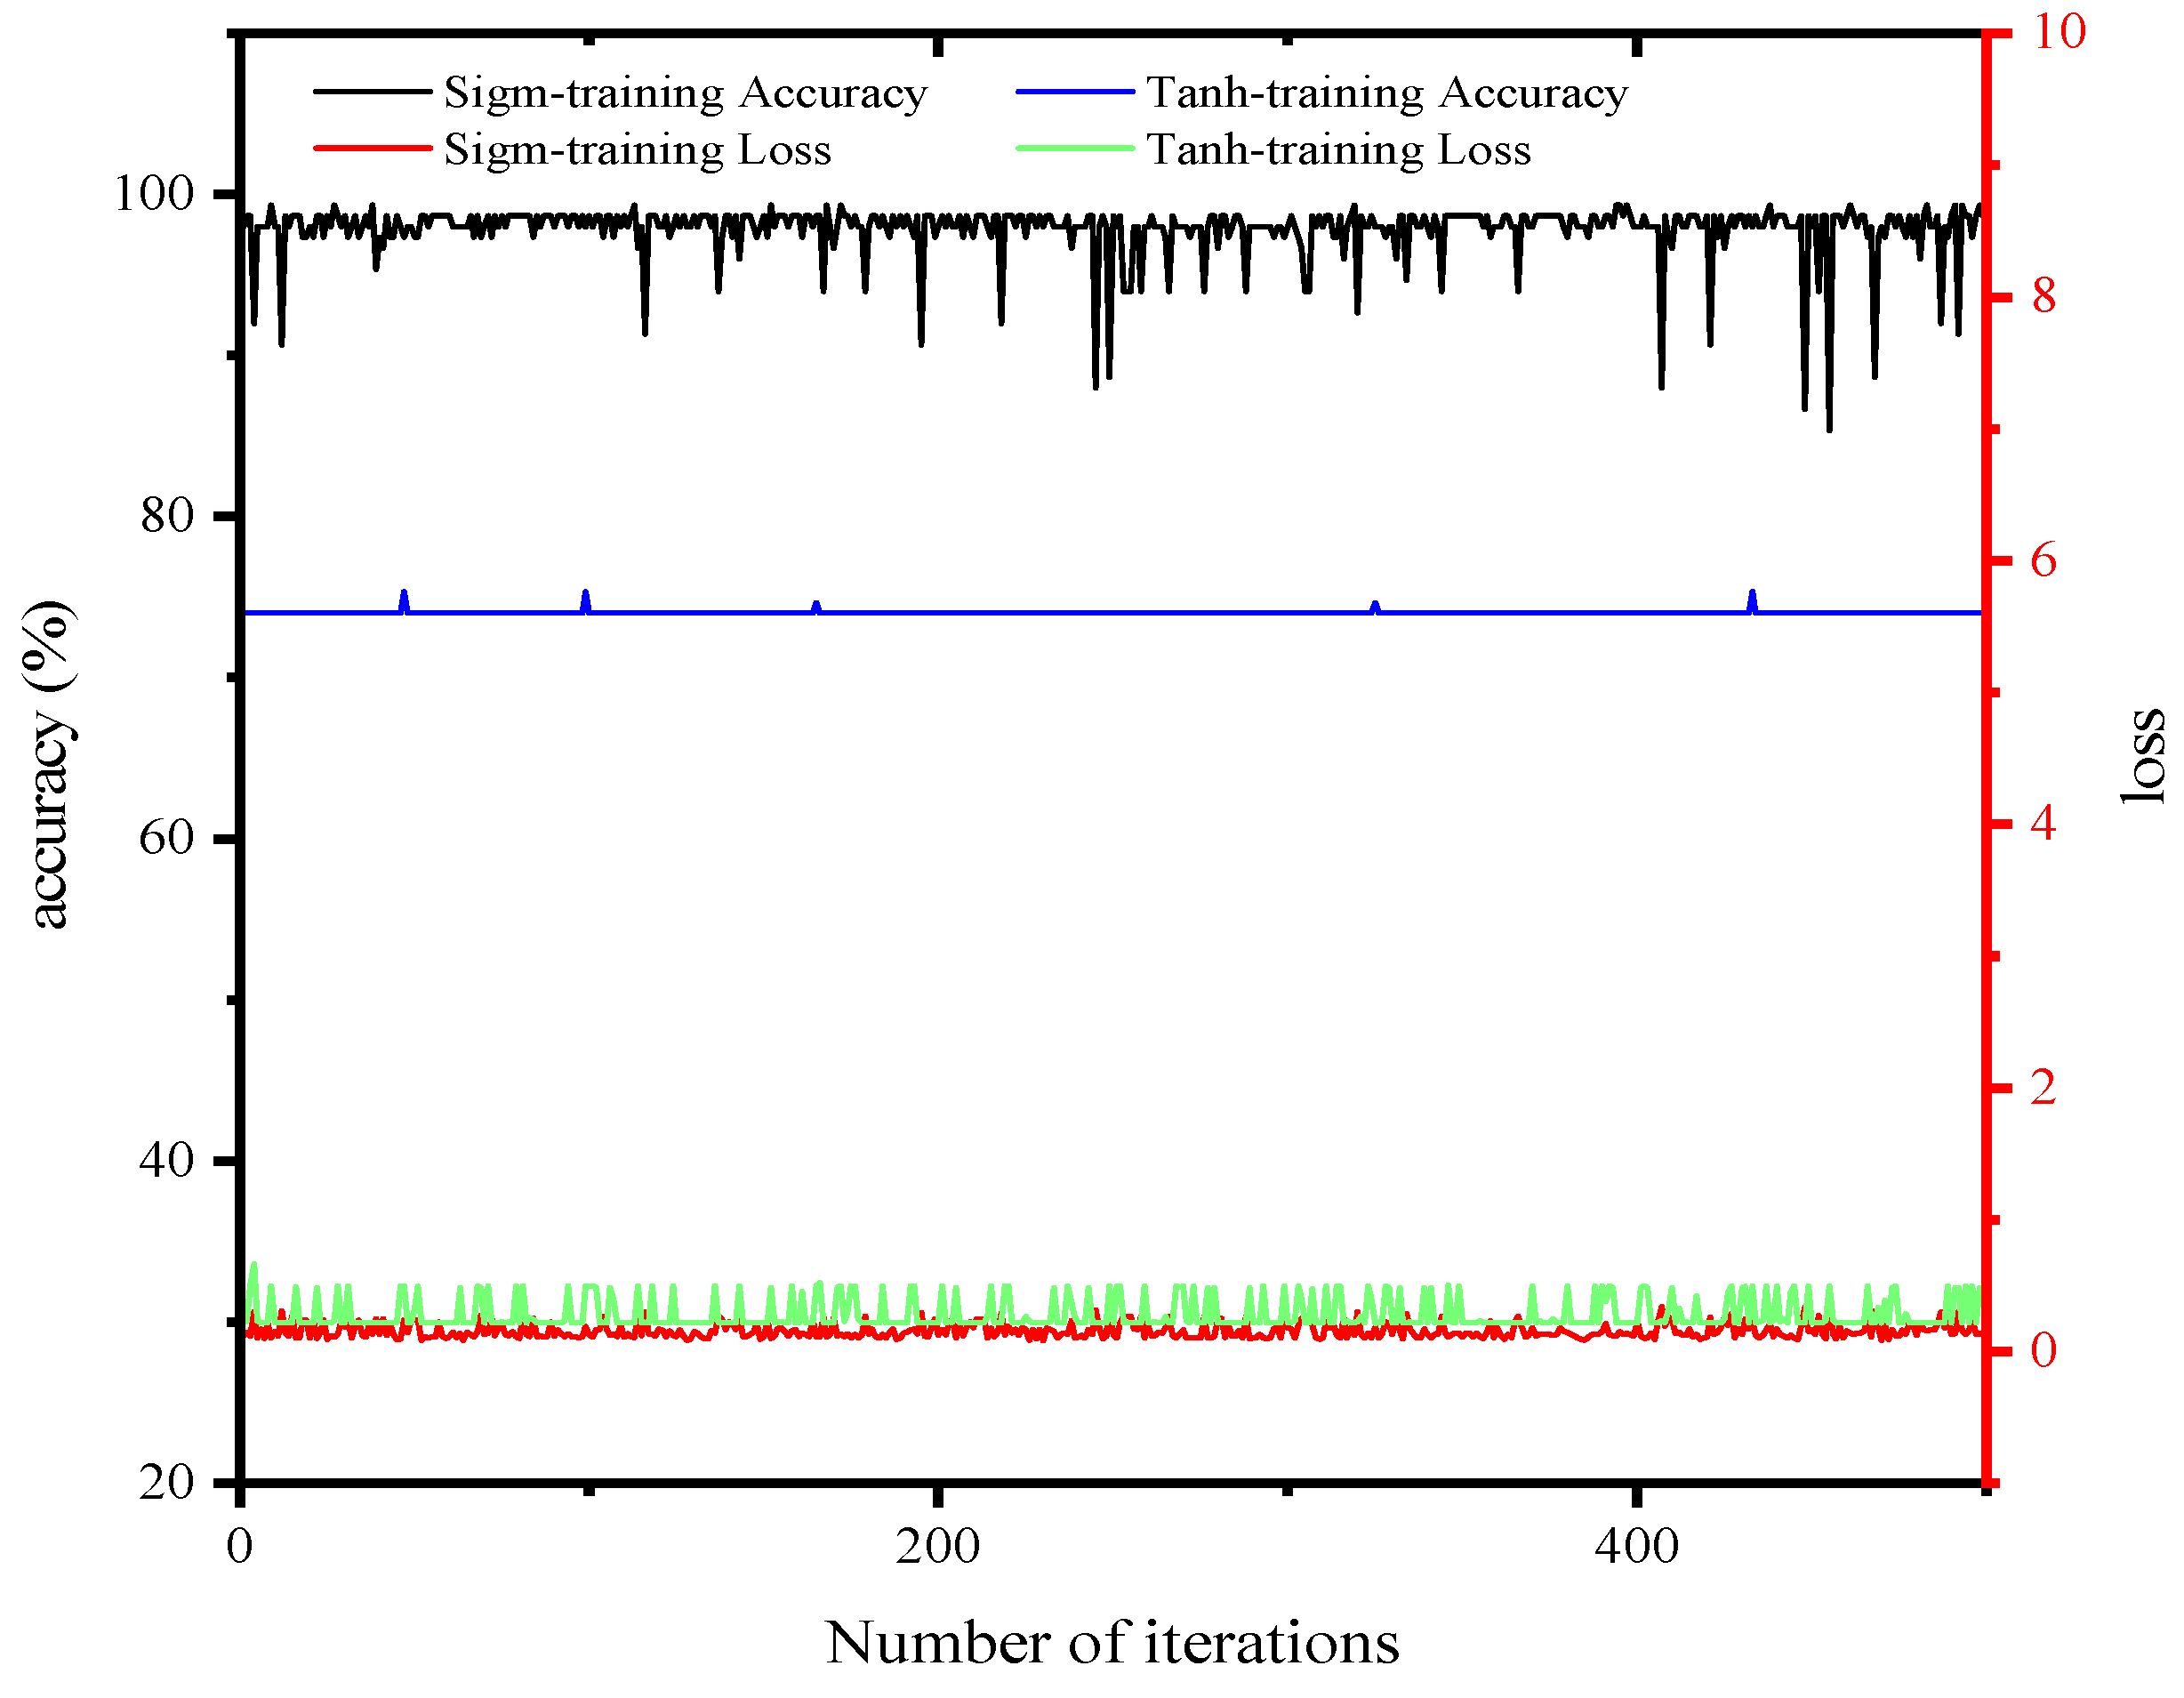
4.1. Influence of Different Stimulators on WT-DBN

To improve the accuracy of training and testing and reduce the model loss function, this study explores the impact of the sigmoid and tanh activation functions on the WT-DBN model. Half of the dataset is used to train model, while rest of the dataset is used for validating the model’s performance. The training accuracy and loss of the WT-DBN classification model based on the two activation functions during the iteration process are shown in Figure 9. The precision and loss metrics for the training sample, along with the forecasting accuracy, are displayed in Table 1.
Based on Figure 9, the training precision and loss arc of the WT-DBN sorting method founded on two types of activation functions can be observed during 500 iterations. The WT-DBN classification method founded on the sigmoid activation function exhibits higher classification accuracy and lower loss compared to the tanh activation function; although there is some minor random fluctuation during training, the overall classification accuracy exceeds 90%. As illustrated in Table 1, the average loss value for sigmoid is less than tanh during the training process, the average accuracy for sigmoid is greater than tanh, and the classification accuracy for sigmoid is also greater than tanh. The WT-DBN classification model based on the sigmoid activation function demonstrates better learning performance and training effects, attributed to the sigmoid function’s output ranging from 0 to 1, rendering it appropriate for binary classification problems. While the tanh function’s output range is between −1 and 1, its derivative approaches zero when the input is close to positive or negative limits, potentially resulting in the disappearing of gradient value. Taking the convergence of loss arc and training accuracy into consideration, this research selects sigmoid as the activator for WT-DBN.

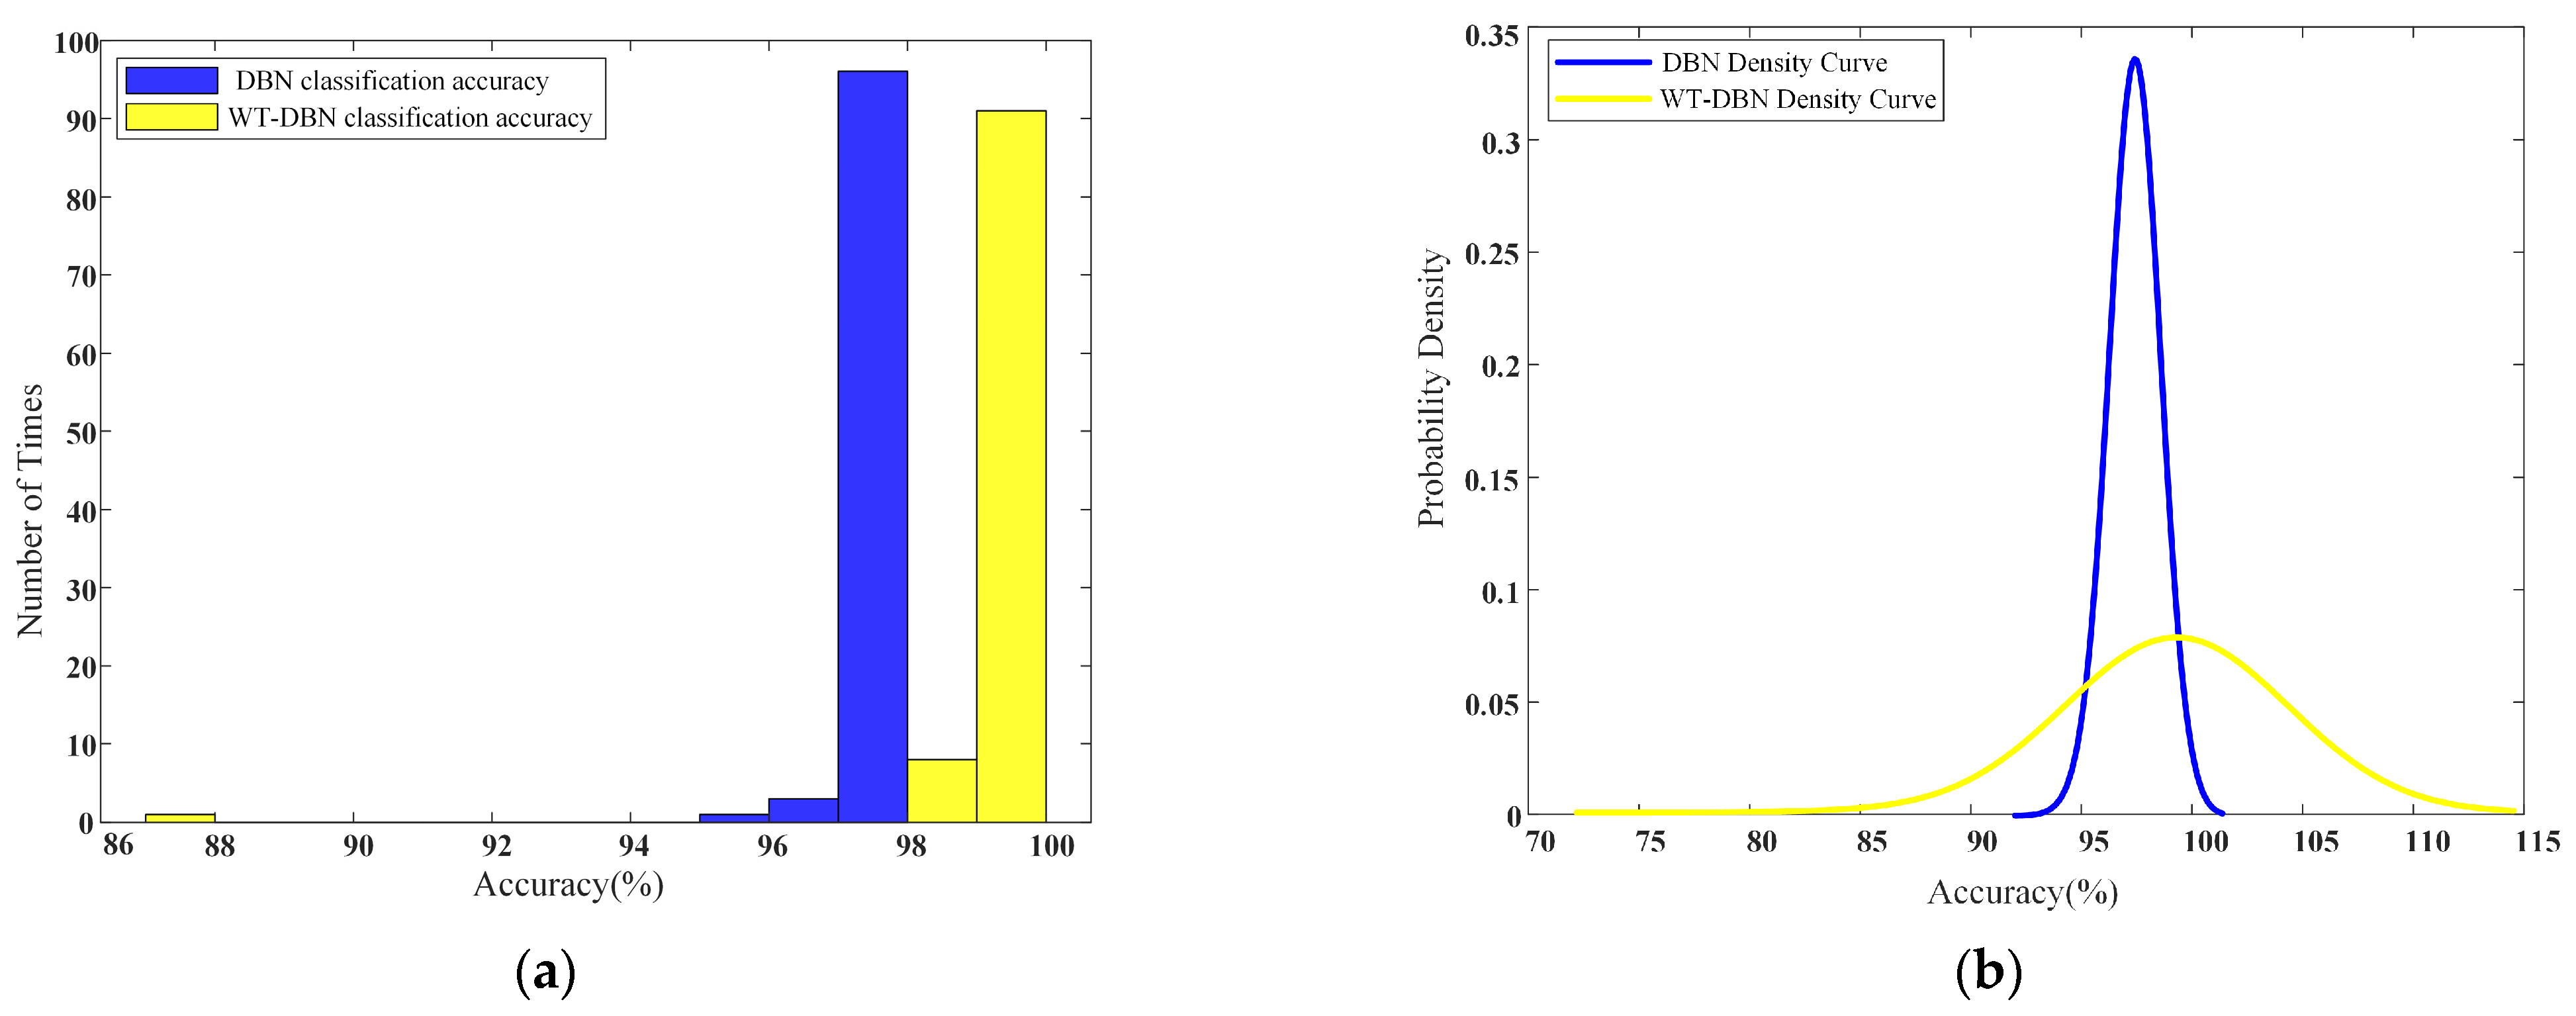
4.2. Influence of WT on DBN Classification

The detecting signals were interfered with by white background noise, causing changes in the raw waveform. To illustrate the effectiveness of employing wavelet transform denoising for DBN classification in this study, noise reduction was applied to partial discharge and corona discharge signals, effectively filtering out white noise and spikes, as shown in Figure 10. When observing the amplified signal after noise removal, it was found that the signal appeared as a smooth curve, with signal amplitudes closely matching the measured discharge signals.
The signals before and after denoising were used to create datasets with noise and noise-free data. Half of the dataset was utilized for model training, while the other half was employed to validate the classification performance. The precision of DBN and WT-DBN models underwent validation 100 times each. The results are presented in the form of a histogram as depicted in Figure 11.
As shown in Figure 11a, the accuracy of the DBN and WT-DBN models predominantly falls within the range of [95.3333%, 98.3333%]. Compared to DBN, the accuracy of WT-DBN is mainly distributed in the range of [98%, 99.3333%], indicating an improvement in classification accuracy with WT-DBN. Figure 11b illustrates that the introduction of WT shifts the density curve of accuracy distribution towards higher accuracy, further confirming that wavelet denoising enhances the overall classification accuracy of DBN. Analysis of Figure 10 reveals that due to waveform amplitude differences, white noise affects signals with high amplitudes less than those with low amplitudes. This impact reduces the similarity among signals of the same type, blurring the differences in low-amplitude signals of different types, making it challenging for DBN to extract signal features. The elimination of white noise interference from the raw signals by wavelet transform increases the deep belief network’s performance to recognize partial discharge and corona discharge.

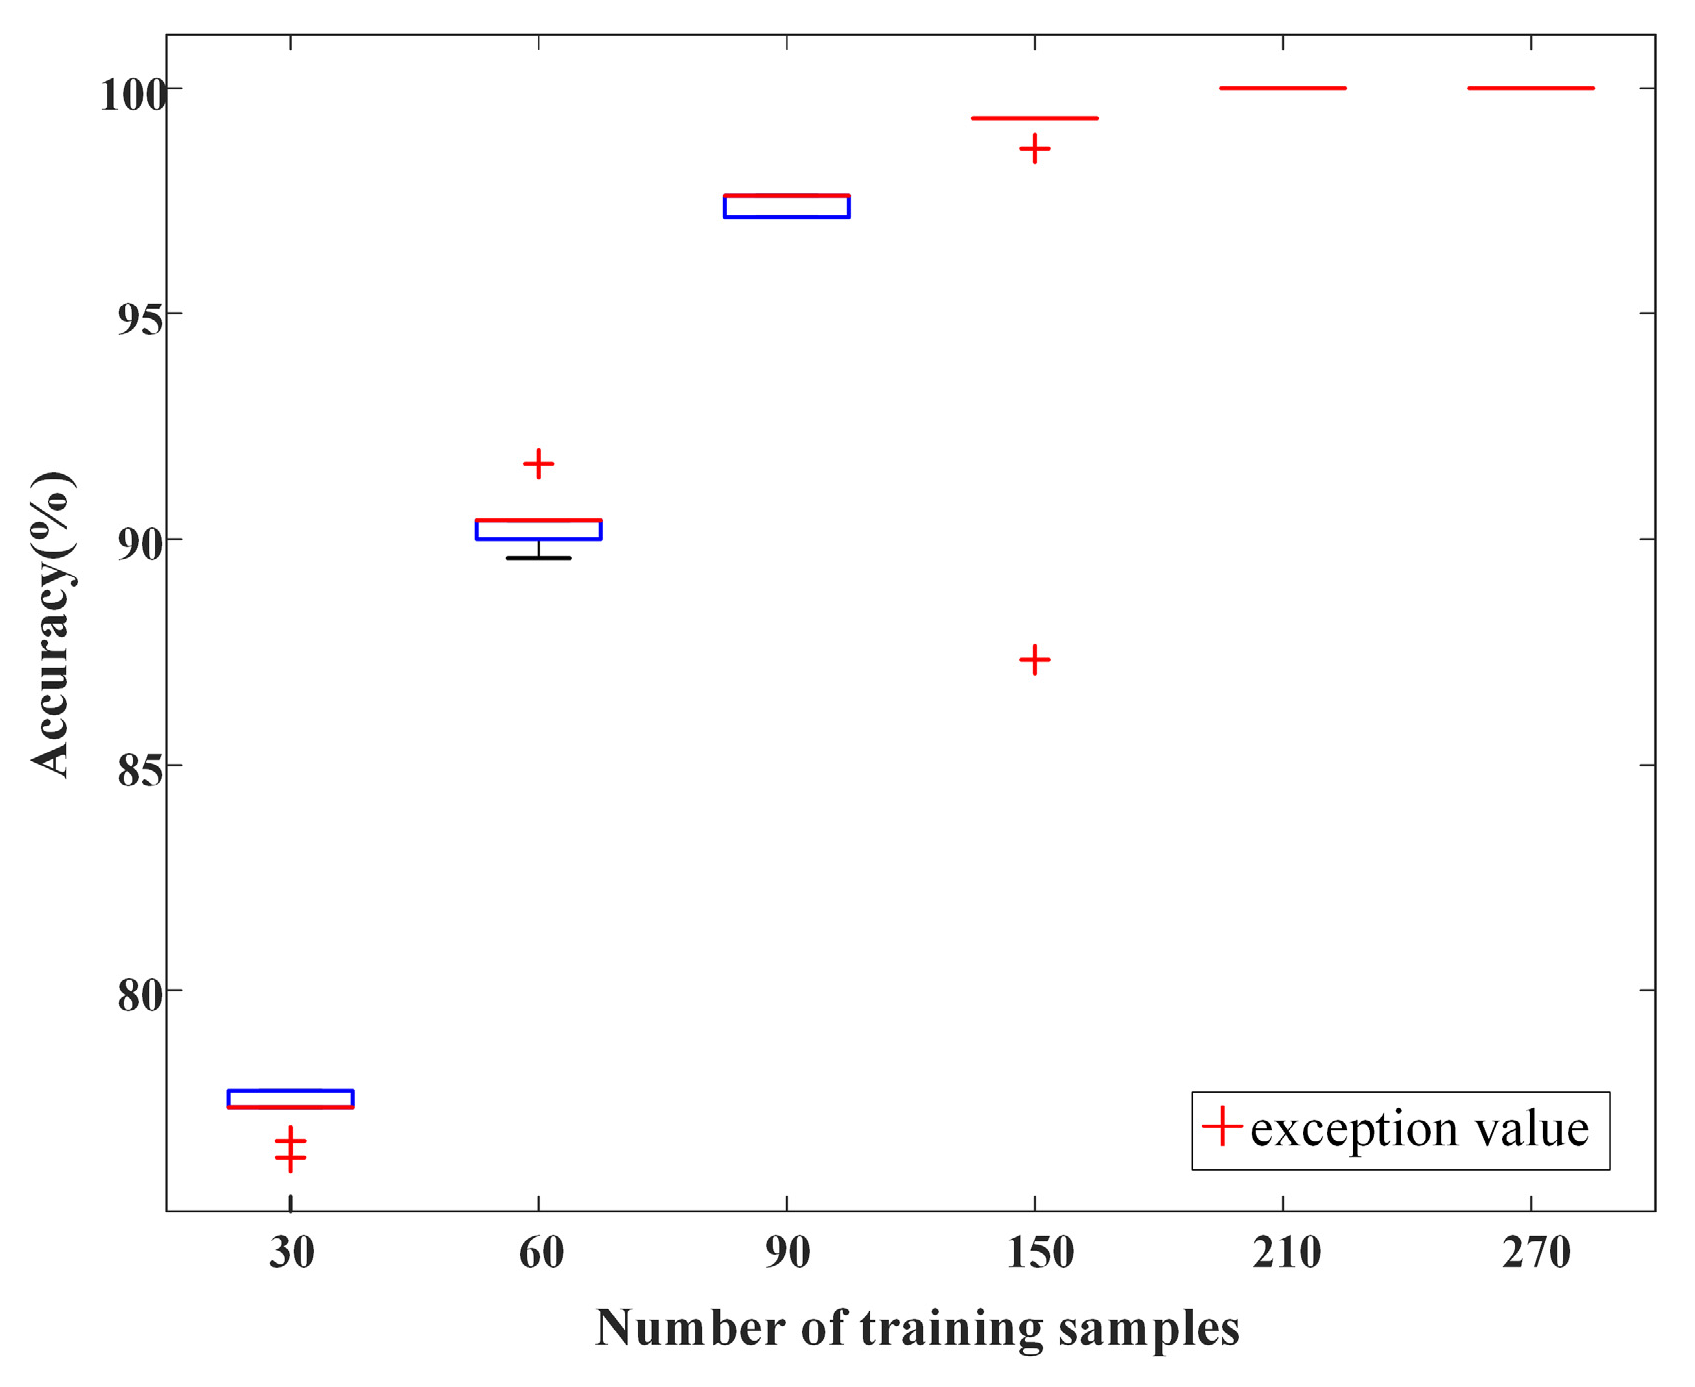
4.3. The Impact of Training Sample Size on the Classification Results

Investigating how different proportions of training data affect classification results, the dataset was divided into the first 10%, 20%, 30%, 50%, 70%, and 90% as training datasets, with the remaining data used as validation datasets. The dataset partitioning results are shown in Table 2. Each scenario underwent 100 validations, acquiring 100 classification precision each time, which are displayed in box plots as shown in Figure 12.
Based on Figure 12, excluding outliers, the accuracy ranges when 30 groups of data were used as training data were [76.2963%, 77.7778%]; when 60 groups were used, the accuracy range was [89.5833%, 91.6667%]; with 90 groups, the accuracy range was [97.1429%, 97.6191%]; with 150 groups as the training dataset, the accuracy range was 99.3333%; and with 210 and 270 groups as the training dataset, the accuracy reached 100% without any outliers, indicating more stable results. The findings demonstrate that increasing the training data can lead to better classification outcomes for WT-DBN, but it also increases training time. The proposed WT-DBN achieved an accuracy of over 76% with only 30 groups of training data, which increased to over 89% and 97% with 60 and 90 groups, respectively, indicating accurate classification with fewer training data. Therefore, this method provides the opportunity to utilize varying quantities of training datasets for signal classification and recognition, allowing for the determination of the appropriate training dataset quantities based on specific scenarios to balance classification effectiveness and training time requirements.

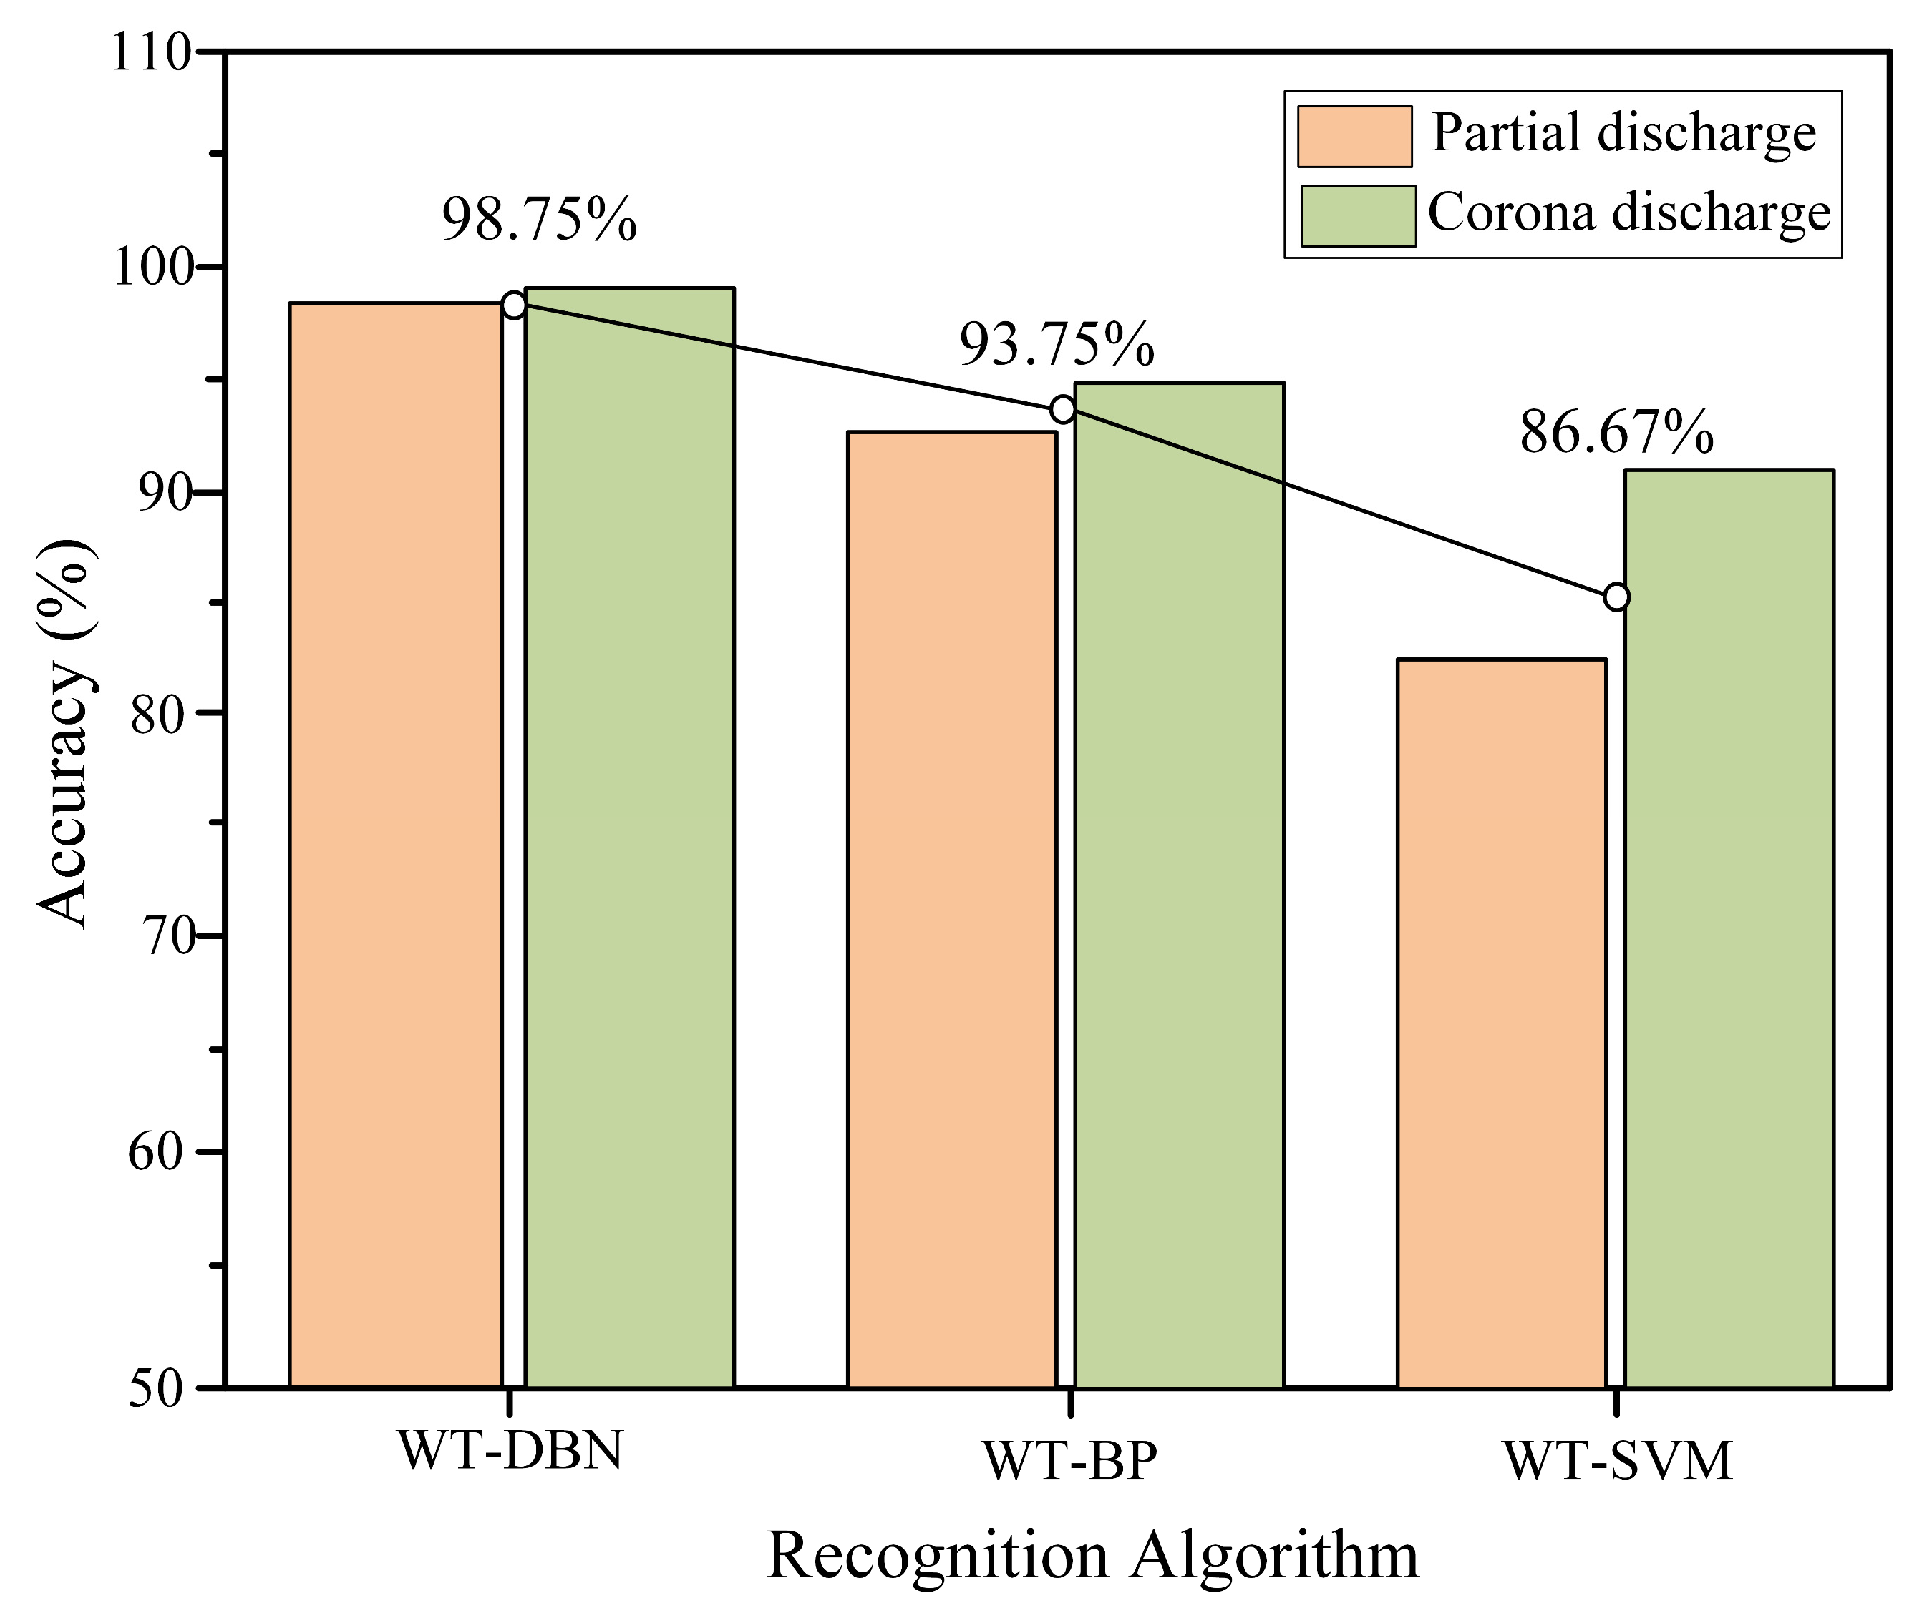
4.4. Comparison of Recognition Results Using Different Methods

To demonstrate the superiority of the proposed method in this chapter, WT-DBN was compared with WT-BP and WT-SVM, and the recognition accuracy of the three methods was obtained as shown in Figure 13 and Table 3.
From Figure 13 and Table 3, it can be observed that the recognition performance of WT-DBN is superior to WT-BP and WT-SVM, with a higher recognition accuracy for partial discharge and corona interference, reaching over 98%. The SVM transforms nonlinear problems into linear problems in high-dimensional space using kernel functions to process data classification. The SVM has certain non-linear modeling capabilities, but its training process is relatively simple and its classification accuracy is not as good as BP and 2DCNN. The BP neural network is a fully connected feedforward neural network trained through a backpropagation algorithm. In this signal recognition process, the recognition accuracy also reached 93.75%. But, the WT-DBN proposed in this article has more advantages in processing classification data because DBN can automatically learn the features of input data, has good extraction ability for hierarchical features of data, and has faster training speed and higher accuracy in processing large-scale datasets.

4.5. Validation of WT-DBN Model Utilizing Mixed Signals

The dependability of WT-DBN is being verified by selecting the WT-DBN model trained using the method outlined in Section 4.3 to identify the raw signals by conducting experiments with mixed signals containing corona discharge and partial discharge lasting up to 20 ms. The comparison of the before and after effects of noise reduction on raw signals is shown in Figure 14, while the identification results of the partial discharge signals disrupted by corona discharge are depicted in Figure 15.
From Figure 14, it can be seen that after filtering out the white noise signal at the end of the vehicle-mounted cable using the wavelet coefficient denoising method, the amplitude of the partial discharge signal, corona signal, and mixed signal did not change significantly, but the signal was smoother and more conducive to feature extraction by the DBN model. From Figure 15, it can be seen that the DBN classification model can accurately identify partial discharge signals and mixed signals containing partial discharge signals and remove the identified corona signals. The outcomes suggest that this approach is capable of accurately detecting partial discharge signals within a mix of signals containing corona discharge.

5. Conclusions

This paper presents a method for classifying discharge signals based on WT-DBN. A platform for detecting partial discharge in vehicle-mounted cable termination, based on the HFCT method, has been developed in the laboratory, employing the WT-DBN method presented in the text for classification. The study explores the impact of different optimizers, wavelet analysis denoising algorithms, and quantities of training datasets on model accuracy. The proposed method’s practicability is confirmed through the identification of raw signal detection in the field environment. The main points are summarized as follows:
  • When selecting the sigmoid function as the activator for training the model, the average loss is low, the average accuracy is higher, and the training model is much more stable.
  • The WT-DBN presented in this study is compared with DBN in terms of classification effect, where wavelet transform eliminates white noise interference from the raw signals.
  • The evaluation of WT-DBN’s classification effectiveness with varying quantities of training dataset shows that increased dataset for training improves classification precision. When the quantity of the training dataset amounts to 30 instances, the accuracy can reach over 94%. This enhances the usability of the input dataset, making the model more flexible for various situations.
  • By comparing the three methods of WT-DBN, WT-BP, and WT-SVM, the proposed WT-DBN achieves a recognition accuracy of 98.75% compared to the other methods.
  • By training the WT-DBN model with 150 sets of standard signals, the model is used to identify mixed signals, effectively recognizing partial discharge signals and partial discharge mixed with corona interference and removing corona discharge.
The method presented in the text circumvents the conventional process of manually extracting features in machine learning, achieving high accuracy in classifying partial discharge and corona discharge and can also classify incomplete signals with high accuracy. This forms the basis for eliminating impulsive jamming in the partial discharge signals of vehicle-mounted cable termination.

Author Contributions

Conceptualization, Z.L.; methodology, J.L.; software, T.Z.; validation, S.C., G.G. and G.W.; formal analysis, Y.-C.L.; investigation, C.S.; resources, K.L.; data curation, K.C. and D.X.; writing—original draft preparation, J.L.; writing—review and editing, Y.-C.L. and T.Z.; visualization, G.G.; supervision, G.W.; project administration, Z.L. All authors have read and agreed to the published version of the manuscript.

Funding

This research was funded by National Key Research and Development Program of China (2022YFB4301202-17), National Natural Science Foundation of China (U1966602, 52377161, 52007158), Excellent Young Scientists Fund of China (51922090), Southwest Jiaotong University New Interdisciplinary Cultivation Project (YH1500112432273 and YH15001124322105), and Fundamental Research Funds for the Central Universities (A0920502052301-170).

Institutional Review Board Statement

Not applicable.

Informed Consent Statement

Not applicable.

Data Availability Statement

The data presented in this study are available (subject to applicable restrictions) on request from the authors.

Conflicts of Interest

Zhengwei Liu is employed by CRRC Changchun Railway Vehicles Co., Ltd., and Chuanming Sun by CRRC Qingdao Sifang Co., Ltd. The other authors declare that the research was conducted in the absence of any commercial or financial relationships that could be construed as a potential conflict of interest.

References

  1. Xin, D.; Wu, G.; Chen, K.; Liu, K.; Xie, Y.; Gao, G.; Xiao, S.; Tang, Y.; Sun, C.; Lin, M. Research on the evolution characteristics of interfacial defect inside the vehicle-mounted high-voltage cable termination for high-speed trains. CSEE J. Power Energy Syst. 2023, 1–13. [Google Scholar] [CrossRef]
  2. Yang, Y.; Li, J.; Chen, Z.; Liu, Y.-C.; Chen, K.; Liu, K.; Xin, D.-L.; Gao, G.; Wu, G. Classification of partial discharge in vehicle-mounted cable termination of high-speed electric multiple unit: A machine learning-based approach. Electronics 2024, 13, 495. [Google Scholar] [CrossRef]
  3. Sun, C.; Wu, G.; Pan, G.; Zhang, T.; Li, J.; Jiao, S.; Liu, Y.-C.; Chen, K.; Liu, K.; Xin, D.; et al. Convolutional neural network-based pattern recognition of partial discharge in high-speed EMU cable termination. Sensors 2024, 24, 2660. [Google Scholar] [CrossRef] [PubMed]
  4. Li, C.; Tohid, S.; Mohamadreza, A.B.; Kerry, D.; Cao, Y.; Zhang, D. Understanding of DC partial discharge: Recent progress, challenges, and outlooks. CSEE J. Power Energy Syst. 2022, 3, 8. [Google Scholar]
  5. Tang, Y.; Gao, G.; Liu, K.; Chen, K.; Xie, Y.L.; Xin, D.L.; Zhou, S.Y.; Wu, G. Electric field distribution and performance optimization of high-speed train cable termination with internal defects. Eng. Fail. Anal. 2023, 151, 107360. [Google Scholar] [CrossRef]
  6. Zhou, L.; Bai, L.; Zhang, J.; Cao, W.; Xiang, E. Measurement and diagnosis of PD characteristics of industrial cable terminations in extreme cold environment. IEEE Trans. Instrum. Meas. 2021, 70, 1–11. [Google Scholar] [CrossRef]
  7. Wang, P.Y.; Ma, H.; Liu, G.; Han, Z.Z.; Guo, D.M.; Xu, T.; Kang, L.Y. Dynamic thermal analysis of high-voltage power cable insulation for cable dynamic thermal rating. IEEE Access 2019, 7, 56095–56106. [Google Scholar] [CrossRef]
  8. Li, S.; Cao, B.; Cui, Y.; Kang, Y.; Gao, S.; Li, H.; Dong, H. Terahertz-based insulation delamination defect inspection of vehicle cable terminals. IEEE Trans. Transp. Electrif. 2022, 9, 1765–1774. [Google Scholar] [CrossRef]
  9. Du, B.X.; Zhu, X.H.; Gu, L.; Liu, H.J. Effect of surface smoothness on tracking mechanism in XLPE-Si-rubber interfaces. IEEE Trans. Dielectr. Electr. Insul. 2011, 18, 176–181. [Google Scholar] [CrossRef]
  10. Chen, X.; Xu, Y.; Cao, X.; Gubanski, S.M. Electrical treeing behavior at high temperature in XLPE cable insulation samples. IEEE Trans. Dielectr. Electr. Insul. 2015, 22, 2841–2851. [Google Scholar] [CrossRef]
  11. Zhu, B.; Jia, Z.; Hu, H.; Ouyang, X.G.; Wang, X.L. Relationship between the interfacial ramped DC breakdown voltage and the morphology of the XLPE/SiR interface. IEEE Trans. Dielectr. Electr. Insul. 2019, 26, 689–697. [Google Scholar] [CrossRef]
  12. Gao, G.; Tang, Y.; Cao, H.; Xin, D.; Xie, Y.; Chen, K.; Liu, K.; Wu, G. Research on electric field characteristics under different length interface air gap defects in cable terminations of high-speed train. Measurement 2024, 228, 114397. [Google Scholar] [CrossRef]
  13. Wang, T.; Li, J.; Liu, K.; Yuan, D.; Gao, G.; Xin, D.; Wu, G. Effect of air gap defects on the electric field distribution and partial discharge characteristics of vehicle-mounted high-voltage cable terminals. In Proceedings of the 2023 Panda Forum on Power and Energy, Chengdu, China, 27–30 April 2023. [Google Scholar]
  14. Choudhary, M.; Shafiq, M.; Kiitam, I.; Palu, I.; Hassan, W.; Singh, P.P. Investigation of partial discharge characteristics in XLPE cable insulation under increasing electrical stress. Eng. Fail. Anal. 2024, 158, 108006. [Google Scholar] [CrossRef]
  15. Li, S.; Song, P.; Wei, Z.; Li, X.; Tang, Q.; Meng, Z.; Li, J.; Liu, S.T.; Wang, Y.H.; Li, J. Partial discharge detection and defect location method in GIS cable terminal. Energies 2022, 16, 413. [Google Scholar] [CrossRef]
  16. Blackburn, T.R.; Phung, B.T.; Hao, Z. On-line partial discharge monitoring for assessment of power cable insulation. In Proceedings of the 2005 International Symposium on Electrical Insulating Materials, Kitakyushu, Japan, 5–9 June 2005. [Google Scholar]
  17. Ma, G.-M.; Li, C.-R.; Chen, X.-W.; Jiang, J.; Ge, Z.-D.; Chang, W.-Z. Numerical sensor design for partial discharge detection on power cable joint. IEEE Trans. Dielectr. Electr. Insul. 2015, 22, 2311–2319. [Google Scholar] [CrossRef]
  18. Zhang, X.; Pang, B.; Liu, Y.; Liu, S.; Xu, P.; Li, Y.; Liu, Y.F.; Qi, L.J.; Xie, Q. Review on detection and analysis of partial discharge along power cables. Energies 2021, 14, 7692. [Google Scholar] [CrossRef]
  19. Bin, F.; Wang, F.; Sun, Q. Identification of ultra-high-frequency PD signals in gas-insulated switchgear based on moment features considering electromagnetic mode. High Volt. 2020, 5, 688–696. [Google Scholar] [CrossRef]
  20. Waqar, H.; Muhammad, S.; Amjad, G.H. Investigating the progression of insulation degradation in power cable based on partial discharge measurements. Electr. Power Syst. Res. 2023, 221, 109452. [Google Scholar]
  21. Miftahul, F.; Zulkurnain, M.A. Partial discharge diagnosis and remaining useful lifetime in XLPE extruded power cables under DC voltage: A review. Electr. Eng. 2023, 105, 4195–4212. [Google Scholar]
  22. Sheng, B.; Zhou, C.; Hepburn, D.M.; Dong, X.; Peers, G.; Zhou, W.; Tang, Z. Partial discharge pulse propagation in power cable and partial discharge monitoring system. IEEE Trans. Dielectr. Electr. Insul. 2014, 21, 948–956. [Google Scholar] [CrossRef]
  23. Zhong, J.; Bi, X.; Shu, Q.; Chen, M.; Zhou, D.; Zhang, D. Partial discharge signal denoising based on singular value decomposition and empirical wavelet transform. IEEE Trans. Instrum. Meas. 2020, 69, 8866–8873. [Google Scholar] [CrossRef]
  24. Zhou, K.; Li, M.; Li, Y.; Huang, Y. An improved denoising method for partial discharge signals contaminated by white noise based on adaptive short-time singular value decomposition. Energies 2019, 12, 3465. [Google Scholar] [CrossRef]
  25. Li, S.; Sun, S.; Shu, Q.; Chen, M.; Zhang, D.; Zhou, D. Partial discharge signal denoising method based on frequency spectrum clustering and local mean decomposition. IET Sci. Meas. Technol. 2020, 14, 853–861. [Google Scholar] [CrossRef]
  26. Tang, Y.; Tai, C.; Su, C.; Chen, C.Y.; Chen, J.F. A correlated empirical mode decomposition method for partial discharge signal denoising. Meas. Sci. Technol. 2010, 21, 1–11. [Google Scholar] [CrossRef]
  27. Gao, G.; Zhou, S.; Yang, S.; Chen, K.; Xin, D.; Tang, Y.; Liu, K.; Wu, G. Accurate identification partial discharge of cable termination for high-speed trains based on wavelet transform and convolutional neural network. Electr. Power Syst. Res. 2023, 225, 109838. [Google Scholar] [CrossRef]
  28. Lu, L.; Zhou, K.; Zhu, G.; Chen, B.; Yana, X. Partial discharge signal denoising with recursive continuous S-shaped algorithm in cables. IEEE Trans. Dielectr. Electr. Insul. 2021, 28, 1802–1809. [Google Scholar] [CrossRef]
  29. Long, J.; Wang, X.; Dai, D.; Tian, M.; Zhu, G.; Zhang, J. Denoising of UHF PD signals based on optimised VMD and wavelet transform. IET Sci. Meas. Technol. 2017, 11, 753–760. [Google Scholar] [CrossRef]
  30. Shams, M.A.; Anis, H.I.; El-Shahat, M. Denoising of heavily contaminated partial discharge signals in high-voltage cables using maximal overlap discrete wavelet transform. Energies 2021, 14, 6540. [Google Scholar] [CrossRef]
  31. Sun, K.; Zhang, J.; Shi, W.; Guo, J. Extraction of partial discharge pulses from the complex noisy signals of power cables based on CEEMDAN and wavelet packet. Energies 2019, 12, 3242. [Google Scholar] [CrossRef]
  32. Montanari, G.C.; Seri, P.; Ghosh, R.; Cirioni, L. Noise rejection and partial discharge source identification in insulation system under DC voltage supply. IEEE Trans. Dielectr. Electr. Insul. 2019, 26, 1894–1902. [Google Scholar] [CrossRef]
  33. Sun, K.; Li, R.; Zhao, L.; Li, Z. Feature extraction based on time-series topological analysis for the partial discharge pattern recognition of high-voltage power cables. Measurement 2023, 217, 113009. [Google Scholar] [CrossRef]
  34. Mishra, S.; Singh, P.P.; Kiitam, I.; Shafiq, M.; Palu, I.; Bordin, C. Diagnostics analysis of partial discharge events of the power cables at various voltage levels using ramping behavior analysis method. Electr. Power Syst. Res. 2024, 227, 4523468. [Google Scholar] [CrossRef]
  35. Zhao, Z.; Wu, J.; Li, T.; Sun, C.; Yan, R.; Chen, X. Challenges and opportunities of AI-enabled monitoring, diagnosis & prognosis: A review. Chin. J. Mech. Eng. 2021, 34, 56. [Google Scholar]
  36. Nor, A.K.M.; Pedapati, S.R.; Muhammad, M.; Leiva, V. Overview of explainable artificial intelligence for prognostic and health management of industrial assets based on preferred reporting items for systematic reviews and meta-analyses. Sensors 2021, 21, 8020. [Google Scholar] [CrossRef]
  37. Roumpakias, E.; Stamatelos, T. Health monitoring and fault detection in photovoltaic systems in central greece using artificial neural networks. Appl. Sci. 2022, 12, 12016. [Google Scholar] [CrossRef]
  38. Liu, Y.-C.; Laghrouche, S.; N’Diaye, A.; Narayan, S.; Cirrincione, G.; Cirrincione, M. Sensorless control of synchronous reluctance motor drives based on the TLS EXIN neuron. In Proceedings of the 2019 IEEE International Electric Machines & Drives Conference, San Diego, CA, USA, 12–15 May 2019. [Google Scholar]
  39. Zhang, S.; Zhang, S.; Wang, B.; Habetler, T.G. Deep learning algorithms for bearing fault diagnostics—A comprehensive review. IEEE Access 2020, 8, 29857–29881. [Google Scholar] [CrossRef]
  40. Liu, Y.-C.; Laghrouche, S.; N’Diaye, A.; Cirrincione, M. Hermite neural network-based second-order sliding-mode control of synchronous reluctance motor drive systems. J. Frankl. Inst. 2021, 385, 400–427. [Google Scholar] [CrossRef]
  41. Didier, F.; Liu, Y.-C.; Laghrouche, S.; Depernet, D. A comprehensive review on advanced control methods for floating offshore wind turbine systems above the rated wind speed. Energies 2024, 17, 2257. [Google Scholar] [CrossRef]
  42. Forootan, M.M.; Larki, I.; Zahedi, R.; Ahmadi, A. Machine learning and deep learning in energy systems: A review. Sustainability 2022, 14, 4832. [Google Scholar] [CrossRef]
  43. Zhang, B.; Ren, G. Li-ion battery state of charge prediction for electric vehicles based on improved regularized extreme learning machine. World Electr. Veh. J. 2023, 14, 202. [Google Scholar] [CrossRef]
  44. Guato Burgos, M.F.; Morato, J.; Vizcaino Imacaña, F.P. A Review of smart grid anomaly detection approaches pertaining to artificial intelligence. Appl. Sci. 2024, 14, 1194. [Google Scholar] [CrossRef]
  45. Ao, Y.; Liu, Y.-C.; Laghrouche, S.; Candusso, D. Dynamic fractional-order model of proton exchange membrane fuel cell system for sustainability improvement. Sustainability 2024, 16, 2939. [Google Scholar] [CrossRef]
  46. Wang, J.; Li, X.; Fei, J. Evaluation of interval type-2 fuzzy neural super-twisting control applied to single-phase active power filters. Appl. Sci. 2024, 14, 3271. [Google Scholar] [CrossRef]
  47. Zhu, Y.; Jia, Y.; Wang, L. Partial discharge pattern recognition method based on variable predictive model-based class discriminate and partial least squares regression. IET Sci. Meas. Technol. 2016, 10, 737–744. [Google Scholar] [CrossRef]
  48. Biswas, S.; Dey, D.; Chatterjee, B.; Chakravorti, S. An approach based on rough set theory for identification of single and multiple partial discharge source. Int. J. Electr. Power Energy Syst. 2013, 46, 163–174. [Google Scholar] [CrossRef]
  49. Hussain, M.R.; Refaat, S.S.; Abu-Rub, H. Overview and partial discharge analysis of power transformers: A literature review. IEEE Access 2021, 9, 64587–64605. [Google Scholar] [CrossRef]
  50. Gao, W.; Ding, D.; Liu, W. Research on the typical partial discharge using the UHF detection method for GIS. IEEE Trans. Power Deliv. 2011, 26, 2621–2629. [Google Scholar] [CrossRef]
  51. Pardauil, A.C.; Nascimento, T.P.; Siqueira, M.R.; Bezerra, U.H.; Oliveira, W.D. Combined approach using clustering-random forest to evaluate partial discharge patterns in hydro generators. Energies 2020, 13, 5992. [Google Scholar] [CrossRef]
  52. Basharan, V.; Maria, W.I.; Ramasamy, M. Recognition of multiple partial discharge patterns by multi-class support vector machine using fractal image processing technique. IET Sci. Meas. Technol. 2018, 12, 1031–1038. [Google Scholar] [CrossRef]
  53. Jineeth, J.; Mallepally, R.; Sindhu, T.K. Classification of partial discharge sources in XLPE cables by artificial neural networks and support vector machine. In Proceedings of the 2018 IEEE Electrical Insulation Conference, San Antonio, TX, USA, 17–20 June 2018. [Google Scholar]
  54. Sharkawy, R.M.; Mangoubi, R.S.; Abdel-Galil, T.K.; Salama, M.M.A.; Bartnikas, R. SVM classification of contaminating particles in liquid dielectrics using higher order statistics of electrical and acoustic PD measurements. IEEE Trans. Dielectr. Electr. Insul. 2007, 14, 669–678. [Google Scholar] [CrossRef]
  55. Behzad, M.; Asghari, K.; Eazi, M.; Palhang, M. Generalization performance of support vector machines and neural networks in runoff modeling. Expert Syst. Appl. 2009, 36, 7624–7629. [Google Scholar] [CrossRef]
  56. Jia, Y.; Zhu, Y. Partial discharge pattern recognition using variable predictive model-based class discrimination with kernel partial least squares regression. IET Sci. Meas. Technol. 2018, 12, 360–367. [Google Scholar] [CrossRef]
  57. Liu, T.; Yan, J.; Wang, Y.; Xu, Y.; Zhao, Y. GIS partial discharge pattern recognition based on a novel convolutional neural networks and long short-term memory. Entropy 2021, 23, 774. [Google Scholar] [CrossRef] [PubMed]
  58. Boczar, T.; Cichon, A.; Borucki, S. Diagnostic expert system of transformer insulation systems using the acoustic emission method. IEEE Trans. Dielectr. Electr. Insul. 2014, 21, 854–865. [Google Scholar] [CrossRef]
  59. Yu, Y.; Wang, Y.L.; Zhu, Y.B. Optimization of nesquehonite whisker preparation process based on BP neural network. China Powder Sci. Technol. 2024, 30, 103–113. [Google Scholar]
  60. Wang, Y.; Yan, J.; Yang, Z.; Zhao, Y.; Liu, T. GIS partial discharge pattern recognition via deep convolutional neural network under complex data source. IEEE Trans. Dielectr. Electr. Insul. 2018, 25, 678–685. [Google Scholar]
  61. Li, L.Q.; Wang, S.L. Neural network simulation of vibration mill’ s damper behavior. China Powder Sci. Technol. 2003, 4, 5–8. [Google Scholar]
  62. Chang, C.K.; Chang, H.H.; Boyanapalli, B.K. Application of pulse sequence partial discharge based convolutional neural network in pattern recognition for underground cable joint. IEEE Trans. Dielectr. Electr. Insul. 2022, 29, 1070–1078. [Google Scholar] [CrossRef]
  63. Xiao, S.; Liu, P.Y.; Chen, K.; Liu, K.; Gao, G.Q.; Wu, G.N. Battery state of health prediction based on voltage intervals BP neural network and genetic algorithm. Int. J. Green Energy 2024, 21, 1743–1756. [Google Scholar] [CrossRef]
  64. Peng, X.; Zhou, C.; Hepburn, D.M.; Judd, M.D.; Siew, W.H. Application of K-means method to pattern recognition in on-line cable partial discharge monitoring. IEEE Trans. Dielectr. Electr. Insul. 2013, 20, 754–761. [Google Scholar] [CrossRef]
  65. Alvarez, F.; Ortego, J.; Garnacho, F.; Sanchez-Uran, M.A. A clustering technique for partial discharge and noise sources identification in power cables by means of waveform parameters. IEEE Trans. Dielectr. Electr. Insul. 2016, 23, 469–481. [Google Scholar] [CrossRef]
  66. Wang, J.; Liu, B.; Zhang, C.; Yang, F.; Zhang, T.; Miao, X. GIS partial discharge type identification based on optimized support vector machine. In Proceedings of the 2019 IEEE 3rd International Electrical and Energy Conference, Beijing, China, 7–9 September 2019; pp. 516–520. [Google Scholar]
  67. Li, L.; Yuepeng, C.; Guang, Y.; Cuimin, M.; Huajun, Z. Type recognition of partial discharge source based on PCA and GWO-SVM. In Proceedings of the 33rd Chinese Control and Decision Conference, Kunming, China, 22–24 May 2021. [Google Scholar]
  68. Xue, L.; Li, X.F.; Ren, X.W.; Gou, J.J. Depression of narrowband periodic interference in PD signal of transformer based on mixed morphological filter. Transformer 2012, 49, 43–46. [Google Scholar]
  69. Karimi, M.; Majidi, M.; MirSaeedi, H.; Arefi, M.M.; Oskuoee, M. A novel application of deep belief networks in learning partial discharge patterns for classifying corona, surface, and internal discharges. IEEE Trans. Ind. Electron. 2020, 67, 3277–3287. [Google Scholar] [CrossRef]
  70. Peng, X.; Li, J.; Wang, G.; Wu, Y.; Li, L.; Li, Z.; Ashfaque, A.B.; Siew, W.H. Random forest based optimal feature selection for partial discharge pattern recognition in HV cables. IEEE Trans. Power Deliv. 2019, 34, 1715–1724. [Google Scholar] [CrossRef]
  71. Zhu, Z.-G.; Huang, C.; Mao, J. Partial discharge detection in 10kV cable based on pulse current method. Rest China Electr. Power 2014, 42, 1876–1881. [Google Scholar]
  72. Yang, T.D. Partial discharge signal denoising based on wavelet threshold adaptive. Electron. Test 2022, 36, 71–73. [Google Scholar]
  73. Ma, X.; Zhou, C.; Kemp, I.J. Interpretation of wavelet analysis and its application in partial discharge detection. IEEE Trans. Dielectr. Electr. Insul. 2002, 9, 446–457. [Google Scholar] [CrossRef]
  74. El Khadiri, K.; Elouaham, S.; Nassiri, B.; El Melhoaui, O.; Said, S.; El Kamoun, N.; Zougagh, H. A Comparison of the Denoising Performance Using Capon Time-Frequency and Empirical Wavelet Transform Applied on Biomedical Signal. Int. J. Eng. Appl. (IREA) 2023, 11, 358–365. [Google Scholar] [CrossRef]
  75. Samir, E.; Boujemaa, N.; Azzedine, D.; Hicham, Z.; Najib, E.K.; Khalid, E.K.; Sara, S. Combination time-frequency and empirical wavelet transform methods for removal of composite noise in EMG signals. TELKOMNIKA Telecommun. Comput. Electron. Control 2023, 21, 1373–1381. [Google Scholar]
  76. AbdurRahman, M.; Kaarmukilan, S.P. Ranking of hybrid algorithms for wavelet based denoising. In Proceedings of the Fourth International Conference on Signal Processing, Communication and Networking, Chennai, India, 16–18 March 2017; pp. 16–18. [Google Scholar]
  77. Yang, Y. Medical multimedia big data analysis modeling based on DBN algorithm. IEEE Access 2020, 8, 16350–16361. [Google Scholar] [CrossRef]
  78. Hinton, G.E. Deep belief networks. Scholarpedia 2009, 4, 5947. [Google Scholar] [CrossRef]
  79. Hua, Y.; Guo, J.; Zhao, H. Deep belief networks and deep learning. In Proceedings of the 2015 International Conference on Intelligent Computing and Internet of Things, Harbin, China, 17–18 January 2015; pp. 17–18. [Google Scholar]
Figure 1. Structure of vehicle-mounted cable termination.
Applsci 14 04743 g001
Figure 2. Physical image of vehicle-mounted cable termination.
Applsci 14 04743 g002
Figure 3. Circuit diagram of partial discharge testing platform.
Applsci 14 04743 g003
Figure 4. Waveform of single discharge signal. (a) Partial discharge. (b) Corona discharge.
Applsci 14 04743 g004
Figure 5. Waveform of mixed discharge signals. (a) Situation 1. (b) Situation 2.
Applsci 14 04743 g005
Figure 6. Flowchart of wavelet noise reduction.
Applsci 14 04743 g006
Figure 7. DBN model structure.
Applsci 14 04743 g007
Figure 8. Flowchart of signal classification based on WT-DBN.
Applsci 14 04743 g008
Figure 9. Training precision and loss.
Applsci 14 04743 g009
Figure 10. Comparison of denoising result before and after wavelet transformation: (a) undenoised partial discharge signal; (b) undenoised corona discharge signal; (c) wavelet denoising for partial discharge signal; (d) wavelet denoising for corona discharge signal.
Applsci 14 04743 g010aApplsci 14 04743 g010b
Figure 11. Distribution of classification accuracy based on DBN and WT-DBN: (a) Classification accuracy. (b) Density curve.
Applsci 14 04743 g011
Figure 12. Boxplot of classification accuracy based on different amounts of training data.
Applsci 14 04743 g012
Figure 13. Comparison of recognition accuracy of different algorithms.
Applsci 14 04743 g013
Figure 14. Noise reduction of the mixed signal.
Applsci 14 04743 g014
Figure 15. Raw signal recognition outcomes founded on WT-DBN.
Applsci 14 04743 g015
Table 1. Assessment of training and classification founded on two activation functions.
MetricSigmoidTanh
Average Loss0.16710.2847
Training Average Precision98.63%78.01%
Training Precision100%78%
Classification Precision97.17%74.01%
Table 2. Dataset partitioning results.
Training data306090150210270
Verifying data2702402101509030
Table 3. Recognition accuracy results of different algorithms.
Discharge TypeWT-DBNWT-BPWT-SVM
Accuracy (%)Average (%)Accuracy (%)Average (%)Accuracy (%)Average (%)
Partial discharge98.33%98.75%92.5%93.75%82.5%86.67%
Corona discharge99.17%95%90.83%
Time used23.45 s65.75 s34.69 s
Disclaimer/Publisher’s Note: The statements, opinions and data contained in all publications are solely those of the individual author(s) and contributor(s) and not of MDPI and/or the editor(s). MDPI and/or the editor(s) disclaim responsibility for any injury to people or property resulting from any ideas, methods, instructions or products referred to in the content.

