Article

Identification Model of Fault-Influencing Factors for Dam Concrete Production System Based on Grey Correlation Analysis

1
School of Civil Engineering, Architecture & Environment, Hubei University of Technology, Wuhan 430068, China
2
Key Laboratory of Intelligent Health Perception and Ecological Restoration of Rivers and Lakes, Ministry of Education, Hubei University of Technology, Wuhan 430068, China
3
SINOHYDRO BUREAU 3 Co., LTD POWERCHINA, Xi’an 710024, China
*
Author to whom correspondence should be addressed.
Appl. Sci. 2024, 14(11), 4745; https://doi.org/10.3390/app14114745
Submission received: 24 April 2024 / Revised: 26 May 2024 / Accepted: 28 May 2024 / Published: 30 May 2024
(This article belongs to the Section Civil Engineering)

Abstract

:
A concrete production system (CPS) fault in dam engineering is one of the important factors influencing dam construction quality, which may directly affect the concrete-pouring construction progress and construction efficiency of the dam, and can even cause construction quality defects in the dam body. Reasonable classification and identification are of great significance to ensure the construction progress and quality of concrete dams. In this study, based on the concrete production logs of multiple concrete dams and literature reviews, a fault classification system for a CPS is proposed by comprehensively considering its mechanical structure characteristics and operating characteristics. The faults of the CPS are divided into 4 large categories and 22 subcategories. Additionally, the causes of CPS faults are summarized as human factors, environmental factors, mechanical component service life factors, and other factors. Based on the grey correlation analysis (GCA) method, a fault identification model of the CPS is established. With the actual production system fault statistical data of Shatuo hydropower station, the correlation coefficients for the four types of faults and the four influencing factors are calculated to determine the key faults of the CPS. The research results of the case study show that the service life factors of mechanical components have the greatest impact on batching metering system faults and mixer faults, with high grey correlation degrees of 84.66% and 76.85%, respectively. Environmental factors have the greatest impact on material delivery system faults and pneumatic system faults, with high grey correlation degrees of 90.81% and 94.9%, respectively. This paper provides theoretical support for the realization of fault pattern recognition of CPSs and provides a guiding reference for targeted fault handling.

1. Introduction

The performance of a concrete production system (CPS) is greatly affected by environmental conditions such as temperature, pressure, rainfall, and lightning on a construction site. Due to factors such as materials, processes, the wear of metal parts, and non-metal aging, performance indicators such as power, economy, and reliability are degraded, and various faults are inevitable [1,2,3]. If the CPS fails and cannot be produced normally, concrete transport trucks will be queued in front of the mixing building for feeding, which will directly affect the concrete-pouring construction progress and construction efficiency of the dam. and can even cause construction quality defects in the dam body, affecting the temperature control effect and increasing the dam cracking risk [4,5,6,7]. Therefore, the faults of CPSs must be controlled in on-site construction management. However, the occurrence of faults in CPSs is uncertain. The fault category and identification should be specified first.
Typical equipment fault identification can be broadly classified into two categories, visual inspection and automatic fault analysis [8]. The first category is suitable for the routine inspection of small and simple equipment. However, for large and complex equipment, automatic fault analysis is clearly more popular based on data-driven methods. These data-driven methods can be performed with different techniques, such as statistical methods or machine learning technology (MLT) [9]. Compared to other techniques, MLT is competent and proficient at dealing with complex and non-linear problems [10]. MLTs applied to fault identification and classification consist of various methods, including support vector machines [11], fuzzy logic [12], artificial neural networks [13], and decision trees [14]. Additionally, the research results of equipment fault identification and classification based on MLT have been widely used in electronics [15,16], machinery [17,18,19,20], photovoltaics [21,22], and other fields [23,24], and outstanding results have been achieved. These studies indicate that MLT can effectively improve the accuracy and reliability of fault classification and diagnostic models.
In the field of water conservancy projects, scholars have conducted some research on the fault monitoring and classification of construction equipment. Based on data mining technology, signal analysis, and processing technology, considerable research has been carried out on the fault diagnosis of pumping device construction [25], the fault analysis of portal tower cranes [26,27], the fault diagnosis and prediction of hydroelectric generating units [28,29,30], and other issues. The research results are remarkable. However, due to the large and complex structure of CPSs in dam engineering, the harsh working environment, the high-intensity mode of operation, and other factors, it is difficult to obtain system condition monitoring data, and the above research methods are difficult to carry out. At present, there are few research results, such as the fault classification statistics of CPSs, the analysis of fault occurrence rules, and the identification of fault-influencing factors.
Zhou et al. [31] took a roller-compacted concrete dam engineering production system as an example to discuss the statistical regularity of the fault probability of concrete dam production systems. They proved that different types of production system faults had different effects on the concrete dam construction schedule, mechanical utilization rate, and monthly pouring strength by combining the construction process simulation technology. However, the authors found that the comprehensiveness of the classification of the production system faults and the sample size of the fault statistics directly affected the depth of the understanding of the CPS faults and the identification of the critical fault factors in the study. For a large and complex CPS, it is of great significance to clarify the fault identification and the correlation between the fault factors to master the influence degree of the CPS fault and create a maintenance plan for different parts. At present, the classifications of CPS faults are not comprehensive, the fault statistical sample data are sparse, and there are no research results on the influencing factors of a production system fault.
Therefore, determining how to identify the key influencing factors of a CPS fault, take targeted protection or preventive measures, prevent and reduce the occurrence of faults effectively, improve the utilization efficiency of production systems, and ensure the construction progress and construction quality of concrete dams is important. Based on the literature reviews and actual engineering CPS fault statistics of Shatuo hydropower station, and considering mechanical structure characteristics and operation characteristics, this study proposes a fault classification system for a concrete dam production system and summarizes the root causes of faults in CPSs by taking a concrete dam production system as the research object. In addition, a fault identification model of the CPS is established, a correlation analysis of the fault statistical sample data is carried out, and the key influencing factors of the CPS fault are determined. The research results of the case study show that the service life factors of mechanical components have the greatest impact on batching metering system faults and mixer faults. Environmental factors have the greatest impact on material delivery system faults and pneumatic system faults. The main contribution of the study is the realization of fault pattern recognition of CPSs in dam engineering, and it provides a guiding reference for targeted fault handling.
The remainder of the paper is organized as follows. Section 2 introduces the component and process flow of a CPS in dam engineering. Section 3 presents the fault classification results for the CPS. Section 4 presents a fault identification model of the CPS based on the grey relational analysis method. Section 5 introduces the application results of the proposed model to a concrete dam project.

2. Component of a CPS

Concrete preparation is the key operation for ensuring the quality of concrete dam construction, and mixing equipment is the main means to ensure the quality of concrete production. A CPS generally determines the production scale according to the pouring strength and sets the mixing station and/or the mixing building according to the concentration of the materials used. Due to the high productivity, equipment, convenient management, reliable operation, and small footprint of mixing plants, most concrete dam projects with concentrated materials are equipped with mixing buildings.
A mixing building is a centralized concrete factory that is often arranged in layers according to the processes. A mixing building is divided into five layers: feeding, storage, batching, mixing, and discharging. The batching layer is the control center of the whole building, and it has a main console, as shown in Figure 1.
The basic process of concrete preparation is as follows: the aggregate and the cement are sent to the compartment of the storage layer by the belt conveyor and the hoist, respectively. The silo has 5–6 grids of aggregate and 2–3 grids of cement and admixture. Each batch of silos is equipped with a batching bucket and an automatic scale. The various materials are put into the collecting hopper and then sent to the mixing machine to be fed by the rotary feeder. After the mixing water is used by the automatic water-measuring device, the materials are directly injected into the mixer. The mixed concrete is discharged into the hopper of the discharge layer. After the transportation vehicle is in place, the pneumatic arc door is opened for discharge. Each layer of equipment can be operated by an electronic transmission system.

3. Fault Classification for CPSs

The authors found that engineers have analyzed and summarized the fault manifestations and troubleshooting methods of different types of CPSs used in different projects and different industries [32,33,34,35,36], which has a certain reference significance for similar system troubleshooting. However, there are many types of faults in CPSs, and there are no clear classification standards.
This section discusses the division of the main faults of a CPS into the four categories of material conveying system faults, batch metering system faults, pneumatic system faults, and mixer faults, depending on the fault location. According to the specific manifestation of various faults, the mechanical structure characteristics and operational characteristics are comprehensively considered and the CPS faults are further subdivided into 22 sub-categories. The detailed classification is shown in Table 1.
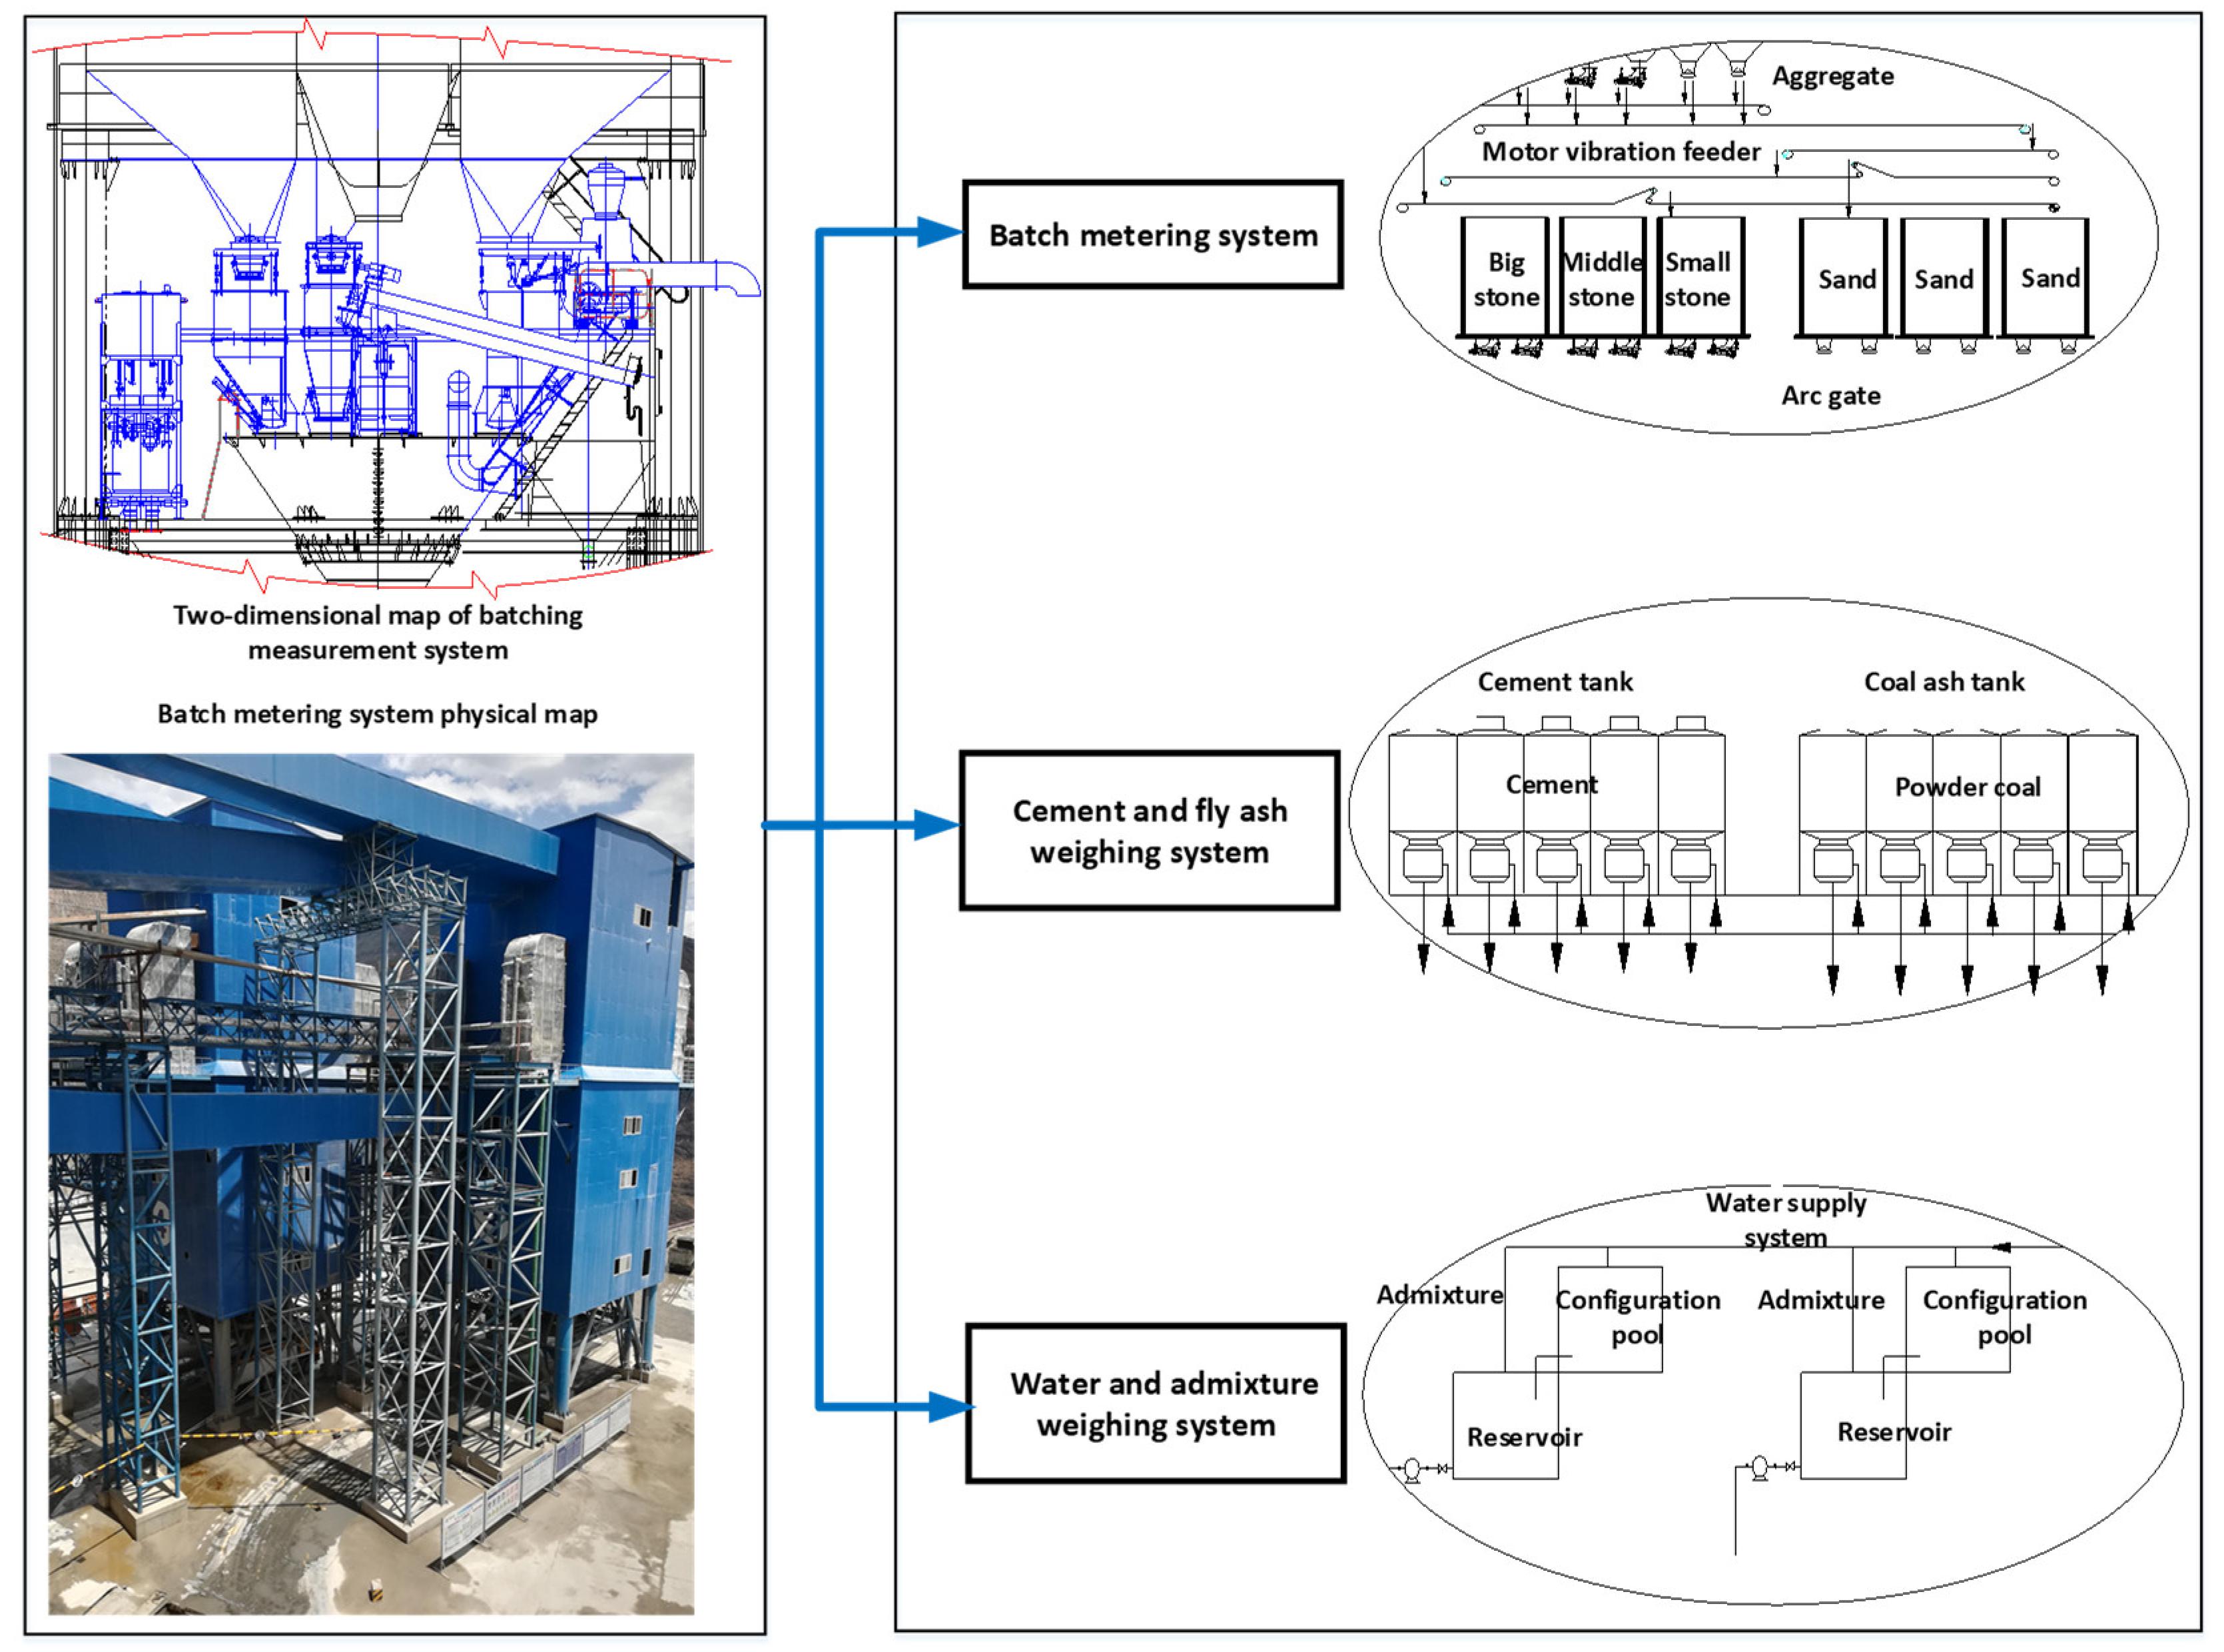
  • Class A: Material handling system faults
The transportation of materials in the CPS mainly includes the transportation of aggregates and powders. In the construction of concrete dams, belt conveyors are often used for the transportation of aggregates. The transportation of cement and admixtures is often carried out with screw conveyors and pneumatic conveying. The basic structure of the material conveying system is shown in Figure 2.
  • Class B: Batch metering system faults
The metering system includes aggregate metering and powder (cement and admixture) metering, as well as water and liquid admixture metering. The metering system is one of the most critical parts of the CPS. The batching electronic scale is the main component of the concrete batching metering system. The electronic scale of each ingredient is composed of a batching bin (body), load cell, junction box, digital weighing instrument, and connecting line. In the aggregate metering system, after the aggregate is transported into position, the material is distributed by the motor vibrating feeder, and the arc door feeder is installed in the lower part of each aggregate silo. The arc gate controls the cylinder through a microcomputer system to complete the opening and closing of the aggregate silo to complete the precise dosing task. The aggregate metering and discharging are controlled by the control system, and the accurate measurement of each aggregate is achieved by the sensor arrangement on the weighing hopper. In contrast to the aggregate metering system, a metering system such as cement and fly ash adopts a full sealing device. Multiple sensors are arranged on the weighing bucket to complete the accurate measurement of the pneumatic butterfly valve discharge. Metering systems such as water and liquid admixtures generally use a control system to control the pump, discharge water, and admixtures, and these systems use sensors to accurately measure liquid materials such as water and admixtures.
In summary, each metering system is controlled by the microcomputer control system, which controls the arc door, cylinder, pump, and other components. The microcomputer control system also meters each material by the sensor.
In the process of batching and metering, the electrical system is prone to problems such as line faults and power supply instabilities. The sensor is prone to problems such as damage and poor contact. The door is prone to problems such as opening and closing problems and control unit faults. The pump is prone to problems such as valve and solenoid valve faults.
Common fault manifestations mainly include ➀ load cell faults, ➁ line faults, ➂ power supply voltage fluctuations or poor grounding, ➃ digital weighing instrument faults, ➄ metering bin doors becoming stuck, and ➅ material door solenoid valve faults. The basic structure of the batching metering system is shown in Figure 3.
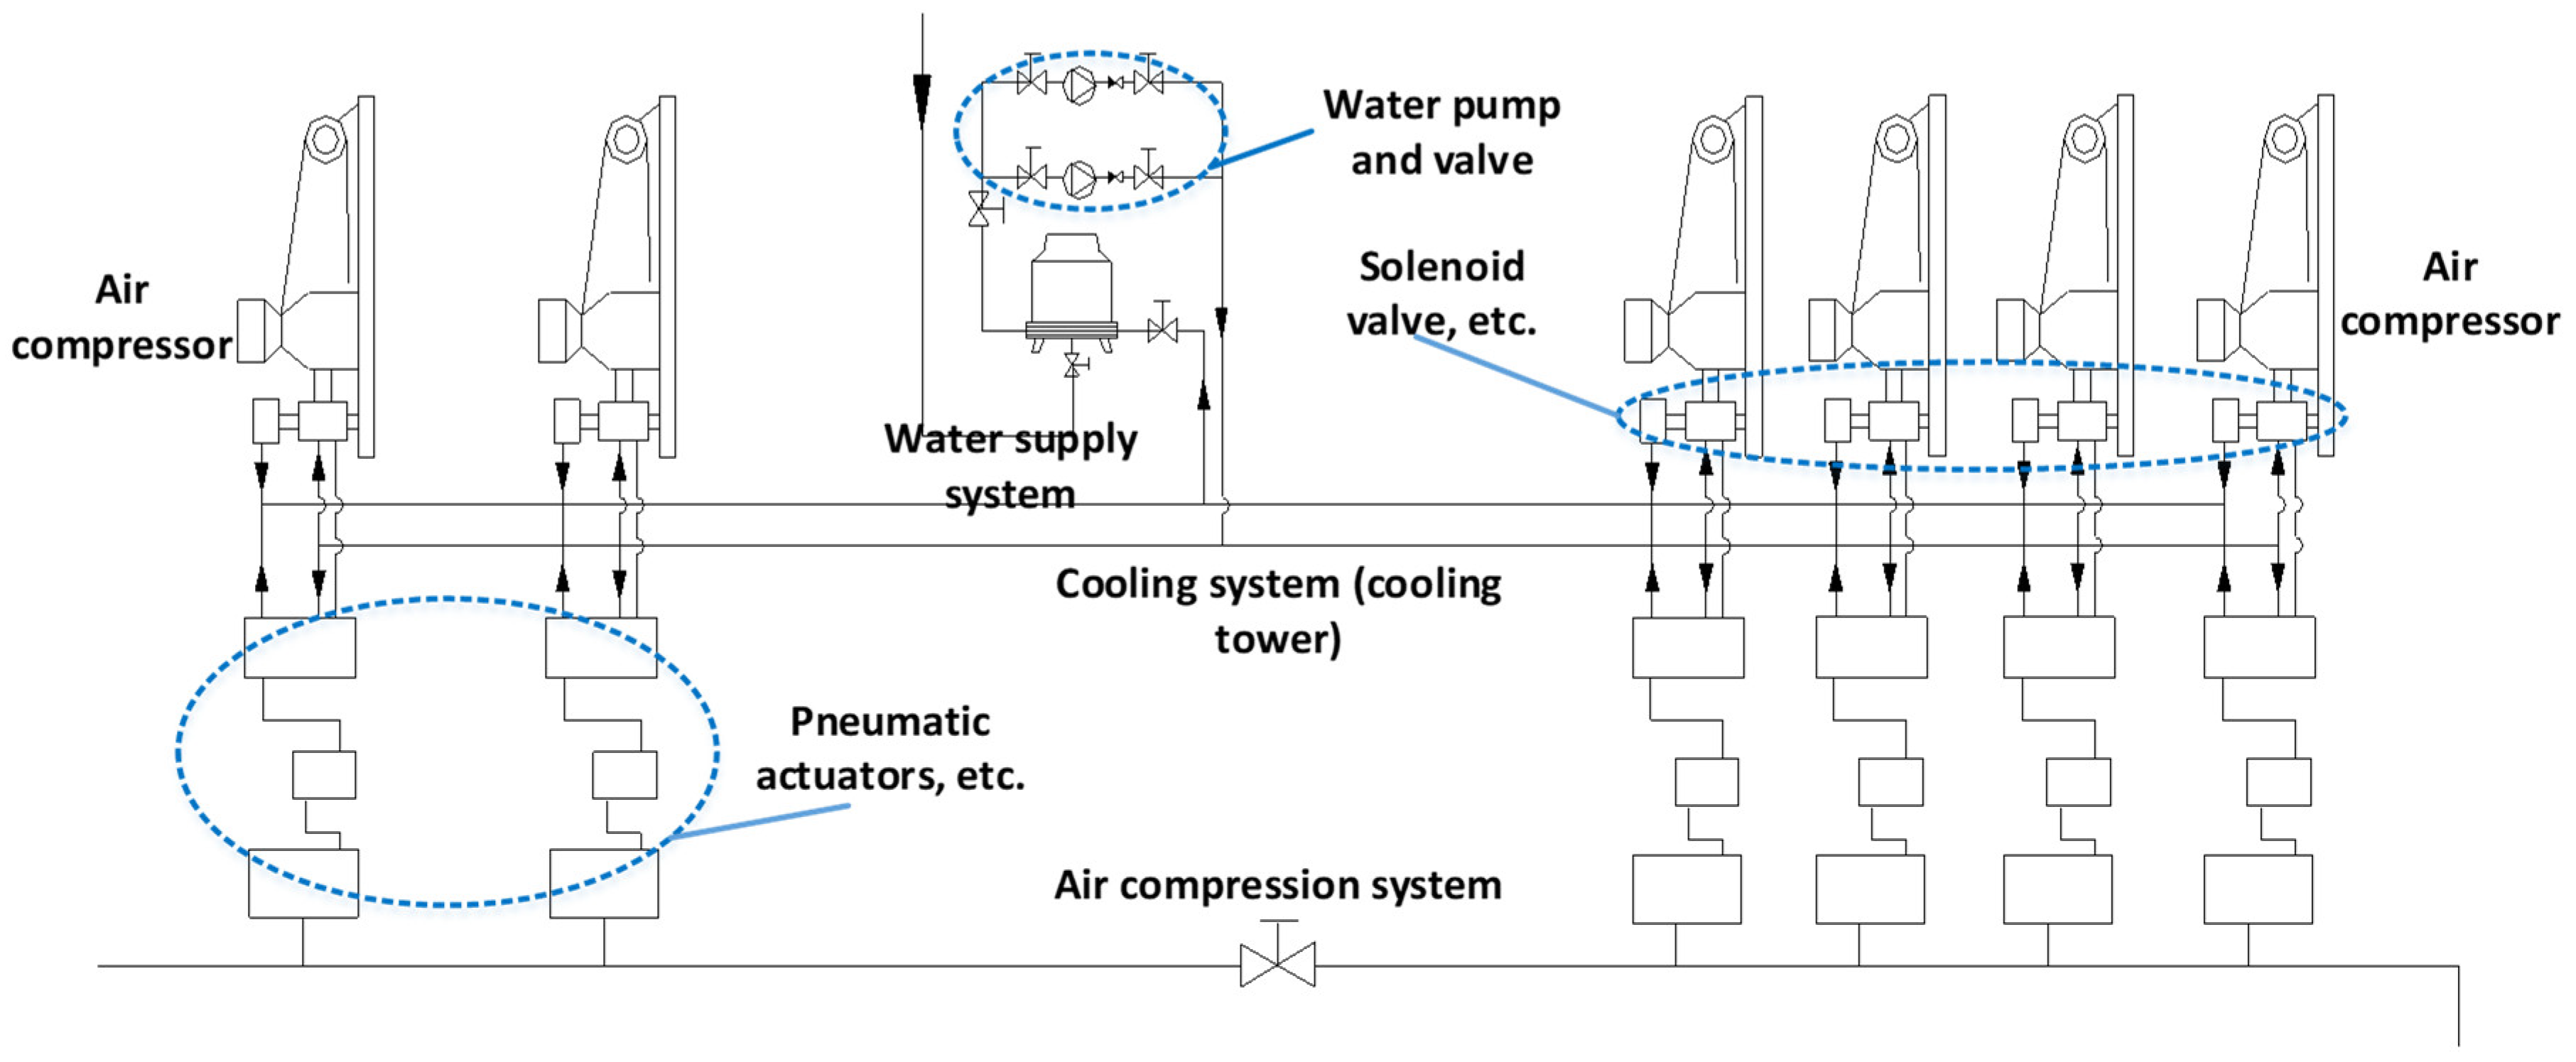
  • Class C: Pneumatic system fault
Most of the mechanisms in the CPS are driven by air pressure, and the air pressure drive has the characteristics of being low cost and producing no pollution. The automatic control system of the concrete mixing building uses a programmable controller to issue control commands to control the relay action, the relay controls the action of each electromagnetic reversing valve, and the electromagnetic reversing valve controls the movement of each cylinder and gas valve of the executing component. Thus, the CPS completes the automatic metering, automatic transmitting, and automatic feeding of the finished material in the concrete mixing building.
The pneumatic system plays an important role in the entire automatic cycle, and its structure is shown in Figure 4. Common fault manifestations mainly include ➀ air source faults (such as air compressor faults, pressure relief valve faults, and pipeline faults), ➁ the pneumatic execution of the original (cylinder) faults, ➂ reversing valve faults, ➃ pneumatic auxiliary original (such as oil mist and muffler) faults, and ➄ mechanical faults (such as the cylinder-driven shaft door becoming stuck and the cylinder-driven flap butterfly becoming stuck).
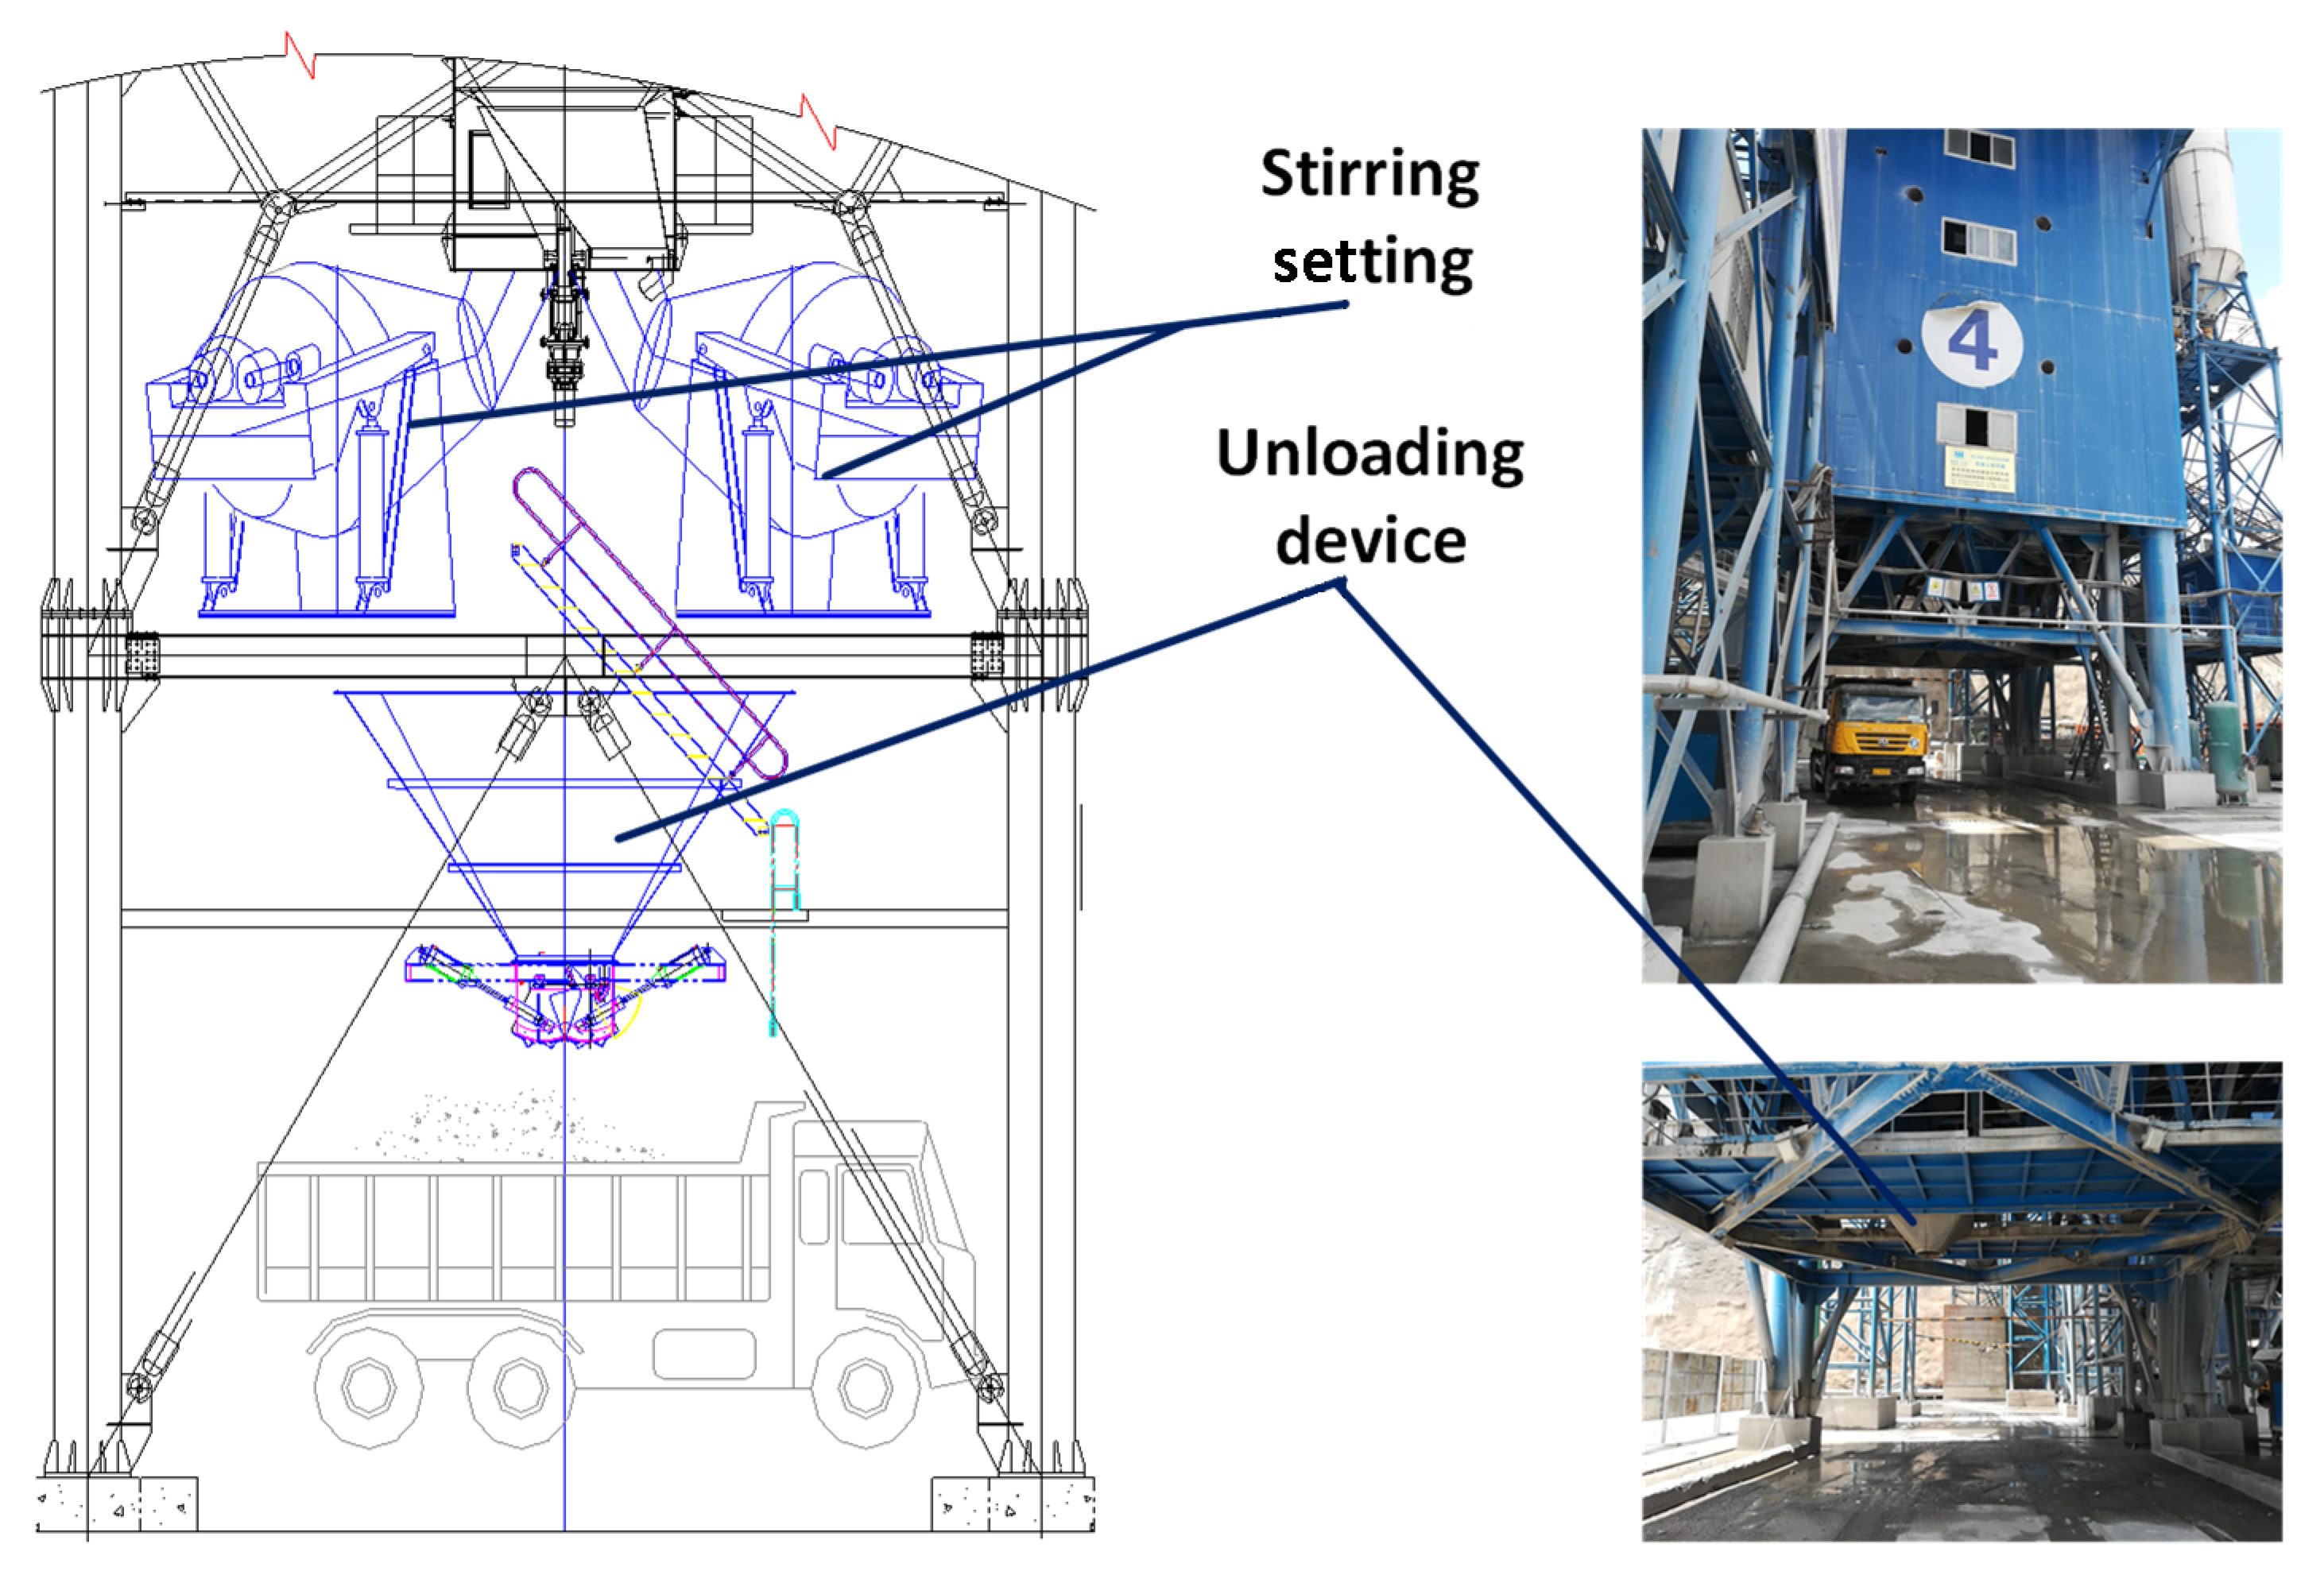
  • Class D: Mixer fault
A concrete mixer is the main piece of equipment for the preparation of concrete. Raw materials such as sand, cement, water, and admixture can be uniformly stirred in the mixer to form finished concrete with a good construction performance (workability) and specified strength requirements. Concrete is mixed in two ways. One mixing method is to use the fixed vane on the rotatable mixing drum to bring the concrete material to the top of the cylinder for free-fall mixing. In the other mixing method, the charging drum does not rotate, and the rotation of the blade fixed on the shaft drives the concrete material to be mixed.
The former method is widely used to mix concrete with a certain degree of slump; the latter method is used to mix dry and hard concrete. The main performance indicator of the mixer is its working capacity in L or m3.
Common fault manifestations of the mixer mainly include ➀ the jamming door becoming stuck, ➁ the mixer feed port being blocked, ➂ gearbox mechanical faults, ➃ mixer waste agglomeration, and ➄ the mixer boring machine tripping. The structure of the mixer is shown in Figure 5.
Combined with a literature review, engineering research, and expert consultation results, the root causes of CPS faults are summarized into the following four types:
(1)
Human factors.
In the operation process of the CPS, faults that result from the operation errors of the operators, subjective judgment errors, or multi-person coordination errors are defined as faults of the CPS caused by human factors in this research.
(2)
Environmental factors.
The construction period of the concrete dam project is long, and the construction environment is harsh. The operation of the CPS runs through the entire pouring construction process of the concrete dam. The CPS is exposed to the complicated and varied external environment all year round, which greatly affects it.
In this study, various faults (such as motor faults, pneumatic component faults, and damage to key components) caused by external factors such as ambient temperature, humidity, rainfall, and lightning are defined as faults of the CPS caused by environmental factors.
(3)
Service life factors of mechanical parts.
The CPS is a complex mechanical device. Under the conditions of a high strength, long period, and continuous operation, various mechanical parts often have different degrees of fatigue damage and even damage and breakage due to the limitations of a normal service life. This causes the entire CPS to not work properly.
In this study, faults of the mechanical parts of the CPS due to fatigue damage are defined as faults of the CPS caused by the service life factor of mechanical parts.
Obviously, the service lives of mechanical parts will also be affected by many factors, such as man-made and environmental factors. In this study, the statistics highlight the root causes and do not consider the interactions between these factors.
(4)
Other factors.
To facilitate the investigation and statistics, other reasons that cause faults of the CPS aside from the three listed above are defined as other factors. The influences of different influencing factors on faults of different types are not the same. For example, the service life factor of mechanical parts may be the main cause of a fault in the material handling system. However, environmental factors may be the main cause of a fault in the batching measurement system. Obviously, the influences of various factors on the faults of the CPS are ambiguous and uncertain.

4. A Fault Identification Model for a CPS Based on Grey Relational Analysis

The grey system theory was founded in 1982 by Chinese scholar Deng Julong. It is a method used to study the problem of a small amount of data and poor information uncertainty [37,38,39]. The so-called grey system refers to a system in which part of the information is known and part of the information is unknown. The grey system theory is used to examine and study uncertain systems with incomplete information. By analyzing some known information, valuable information is extracted to achieve the purpose of understanding the entire system [39,40]. The three main data-mining methods of the grey system theory include the grey prediction model, the grey relational analysis method, and the grey comprehensive evaluation method [37]. The basic idea of grey relational analysis is to measure the degree of correlation between factors based on the similarity and dissimilarity between the various factors within the system [41,42].

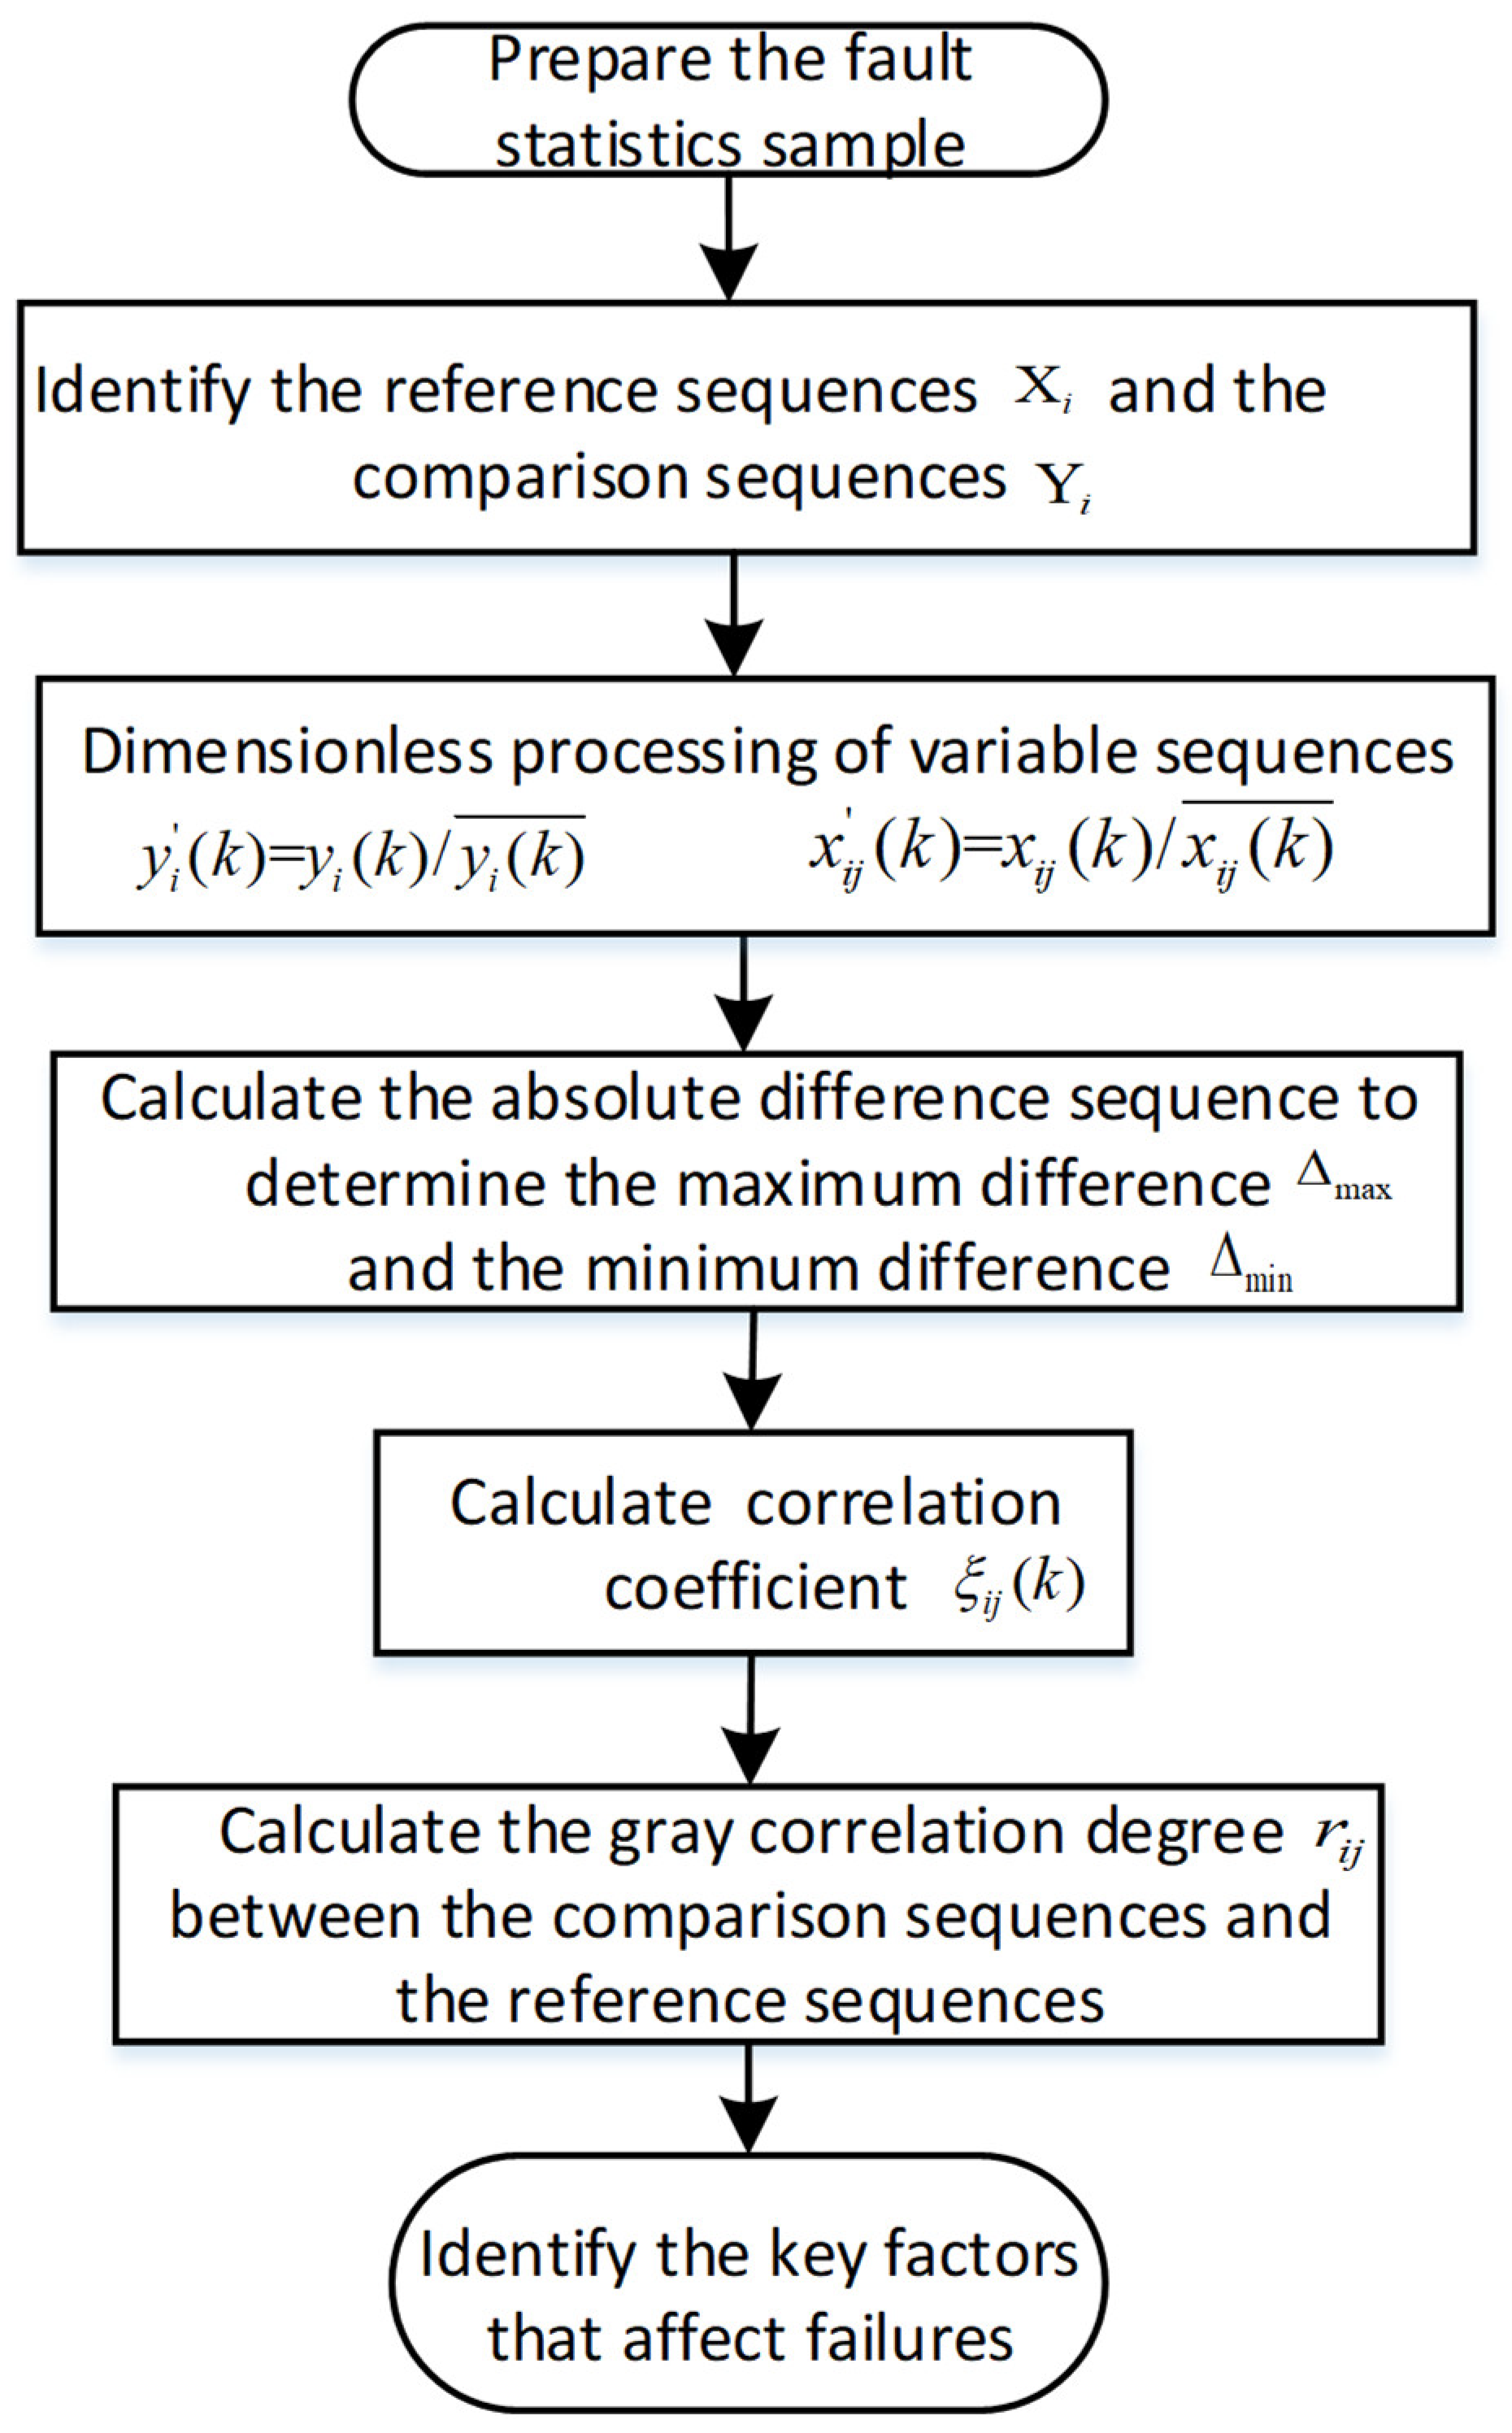
4.1. Basic Theory of Grey Relational Analysis

It is determined whether the relationship between factors is close based on the similarity between the factor curve and the resulting curve geometry; the greater the similarity, the greater the degree of correlation between the factors, and vice versa. This overcomes the shortcomings in the correlation analysis of traditional systems and is not limited by variables and typical distribution.

4.2. Establishment of an Identification Model for Fault-Influencing Factors
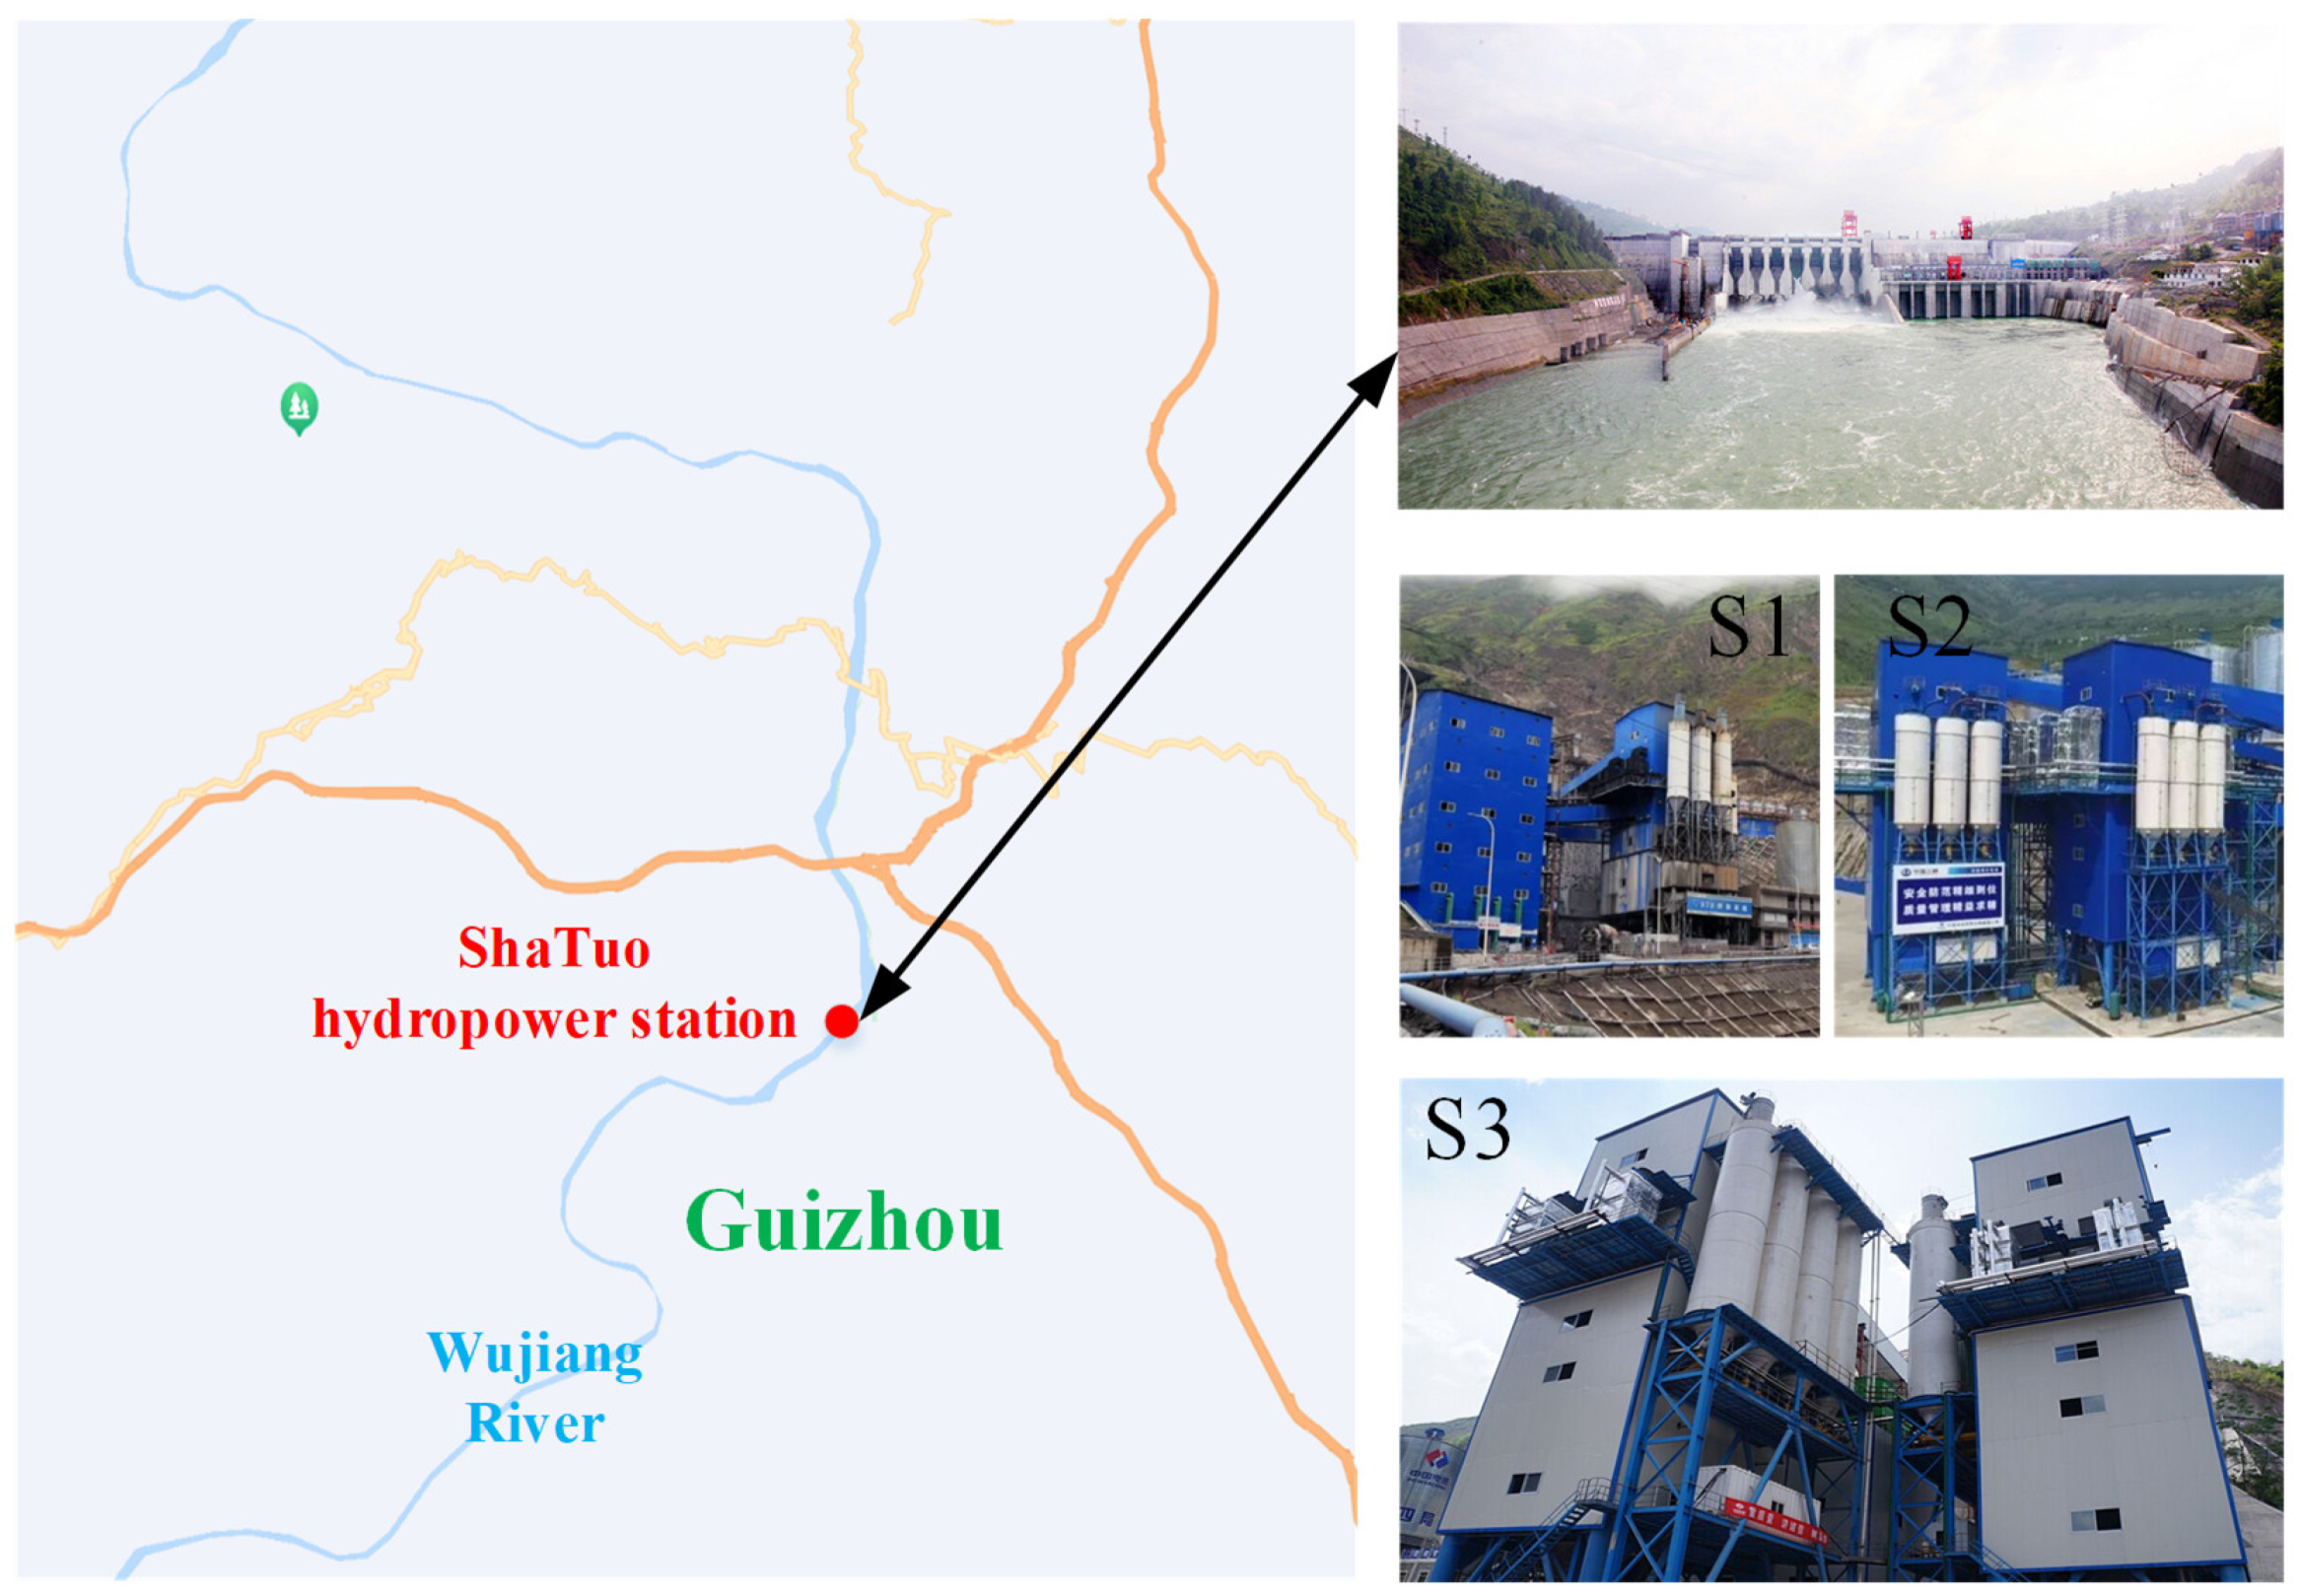
According to the basic principle of grey correlation quantization proposed by Professor Deng Julong [37,38,39], it is necessary to determine the reference sequence and the comparison sequence before calculating the grey correlation degree.
The reference consists of one or more data sequences that reflect the fault characteristics of the CPS. It can be composed of statistical data that characterize the fault characteristics of the CPS. Each set of data can reflect the changes in the fault of the CPS.
The reference sequence of the identification model for the influencing factors of the CPS can be expressed as follows:
Y i = y i ( 1 ) y i ( 2 ) y i ( k ) y i ( n )
where Y i   is the ith reference sequence in the grey relational analysis model of the influencing factors of the CPS fault. i = 1,2 , , I ; y i ( 1 ) y i ( 2 ) y i ( k ) y i ( n ) are the specific expressions of the i th reference sequence in the grey relational analysis model for the influencing factors of the CPS fault and reflect the changing law of Y i . n is the number of working conditions studied. This is the number of CPSs studied in this research.
The comparison sequence consists of data characterizing the influencing factors of the CPS fault. There are m influencing factors of the fault of the CPS being studied. The vector matrix of the factors affecting the fault under n conditions is as follows:
X i = x i 1 x i 2 x i m x i 1 ( 1 ) x i 1 ( 2 ) x i 1 ( n ) x i 2 ( 1 ) x i 2 ( 2 ) x i 2 ( n ) x i m ( 1 ) x i m ( 2 ) x i m ( n )
where X i   is the comparison sequence corresponding to the reference sequence Y i in the grey correlation analysis model for the influencing factors of the CPS fault. The sequence matrix contains m vectors of influencing factors, where the jth term in the kth condition is x i j ( k ) , j = 1,2 , , m , and k = 1,2 , , n .
Since the physical meanings or the initial values of the data sequences are different, to increase the comparability of the data and reduce the errors caused by the physical meaning and difference of the research factors, it is necessary to perform dimensionless processing on the above sequences. Commonly used dimensionless methods include data initialization, data averaging, and data minimization [40]. In this study, the data averaging method is used to carry out the dimensionless processing of the raw data of the reference sequence and the comparison sequence in a fault classification system for a concrete dam production system.
For the raw data of the reference sequence, the dimensionless formula can be expressed as follows ( y i ( k ) ¯ is the average value of the data):
y i k = y i ( k ) y i ( k ) ¯
For the raw data of the comparison sequence, the dimensionless formula can be expressed as follows ( x i j ( k ) ¯ is the average value of the data):
x i j k = x i j ( k ) x i j ( k ) ¯
The goal of a correlation analysis is to determine the degree of association between the comparison sequence and the reference sequence for each factor. The greater the correlation, the greater the contribution of these factors to the corresponding category production system faults. The smaller the correlation, the smaller the contribution of these factors to the corresponding category production system faults. The formula for calculating the grey correlation degree is as follows:
r i j = 1 n k = 1 n r ( y j k , x i j k ) = 1 n k = 1 n ξ i j ( k )
where   ξ i j k   ( j = 1,2 , , m ; k = 1,2 , , n ) is the corresponding data point of the comparison sequence X i   and the reference sequence Y i in the identification model for the influencing factors of the CPS fault. This can represent the difference between the sequences in a geometric sense. The formula is as follows:
ξ i j k = min j min k y i k x i j k + ρ   max j max k y i k x i j k y j k x i j k + ρ   max j max k y j k x i j k
Δ m a x = max j max k y j k x i j k
Δ m i n = min j min k y j k x i j k
Δ i j ( k ) = y j k x i j k
where ρ is the resolution coefficient of the grey correlation model, Δ m a x is the maximum absolute value of the difference between all data points of all sequences and the reference sequence corresponding data points, and Δ m i n is the minimum absolute value of the difference between all data points of all sequences and the corresponding data points for the reference sequence. Δ i j ( k ) represents the absolute difference between the kth point and the comparison sequence of the factors in the reference sequence of the identification model for the influencing factors of the CPS fault.
Then, Equation (6) can be transformed into:
ξ i j k = Δ m i n + ρ Δ m a x Δ i j k + ρ Δ m a x
The resolution coefficient ρ is essentially the weight of the largest absolute difference, generally taking values between 0 and 1, and the value should satisfy the integrity and anti-interference of the correlation degree in the identification model for the influencing factors of the CPS fault. If the value is too large or too small, it cannot correctly reflect the correlation between the research objects. In this study, the following method [41] is used to determine the value of the resolution coefficient ρ.
(1) The mean of all absolute differences Δ ¯ is calculated as follows:
Δ = 1n·mj = 1mk = 1nyjkxijk
(2) According to the ratio of the absolute difference mean Δ ¯ to the maximum difference Δ m a x , the ratio can be denoted as E Δ = Δ ¯ / Δ m a x . Then, the value interval of ρ is determined to be Δ ¯ ρ 2 Δ ¯ .
When Δ m a x > 3 Δ ¯ , it means that the data of the reference sequence and the comparison sequence in the identification model for the influencing factors of the CPS fault are abnormal. Then, the value interval of ρ is given by:
E Δ ρ 1.5 E Δ
When Δ m a x 3 Δ ¯ , it means that the data for the reference sequence and the comparison sequence in the identification model for the influencing factors of the CPS fault are normal. Then, the value interval of ρ is given by:
1.5 E Δ ρ 2 E Δ
According to the above analysis ideas and calculation principles, the identification process for the influencing factors of concrete dam production system faults is as shown in Figure 6.

5. Case Study

5.1. Fault Classification Statistics

Through an investigation of the construction site, the author obtained the concrete production logs of several concrete dams during the construction period and collected and classified the faults in three production systems. In this paper, S1, S2, and S3 are used to represent these three CPSs, respectively, as shown in Figure 7. The mechanical structure characteristics and operating characteristics of these three CPSs are similar, but there are differences in their production capacity. The production capacities of these three CPSs are 200 m3/h, 330 m3/h, and 350 m3/h, respectively. There are 839 cases of CPS faults. Among them, there are 298 fault cases in the statistical sample S1, and there are 154 material delivery system faults, 28 batch metering system faults, 50 pneumatic system faults, and 66 mixer faults. The numbers of faults caused by human factors, environmental factors, mechanical component life factors, and other factors are 104, 30, 98, and 66. There are 287 fault cases in statistical sample S2, and the numbers of cases of the four types of faults are 66, 75, 116, and 30. The numbers of faults caused by human factors, environmental factors, mechanical component life factors, and other factors are 97, 57, 75, and 58. There are 254 fault cases in statistical sample S3, and the numbers of cases of the four types of faults are 66, 75, 116, and 30. The numbers of faults caused by human factors, environmental factors, mechanical component life factors, and other factors are 97, 57, 75, and 58.
Because each system is affected by its own performance, operating environment, and the technical level of its equipment operators, the proportions of the same types of faults in different production systems are different, and the influences of different factors on the faults of different types of production systems are not the same. The details of the collected faults in the three production systems are shown in Table 2 and Table 3.
In the tables, A, B, C, and D represent the four types of faults: material delivery system faults, batch metering system faults, pneumatic system faults, and mixer faults; and P, E, M, and O represent the four types of factors: human factors, environmental factors, mechanical component life factors, and other factors.

5.2. Identification and Calculation of Various Fault Factors

According to the obtained classification statistics of production system faults, as well as the identification method of the influencing factors of the concrete dam production system fault rate proposed in Section 4.2, combined with the actual engineering production system fault classification statistics, the class A fault number, class B fault number, class C fault number, and class D fault number are selected as reference sequences and denoted as y 1 ,   y 2 ,   y 3 , and   y 4 , respectively. Then, the reference sequence matrix is given by:
Y i = y 1 y 2 y 3 y 4 = 154 66 101 28 75 46 50 116 80 66 30 27
There are four factors affecting the fault of the CPS studied in this research: human factors, environmental factors, mechanical component service life factors, and other factors. The sequence consisting of the four types of fault factors is taken as the comparison sequence, which is recorded as x 1 ,   x 2 ,   x 3 , and   x 4 , and the comparison sequence matrix is given by:
X i = x 1 x 2 x 3 x 4 = 104 97 67 30 57 45 98 75 69 66 58 73
After the dimensionlessization using Equations (3) and (4), the coefficient matrix is obtained, as follows:
y 1 y 2 y 3 y 4 x 1 x 2 x 3 x 4 = 1.4393 0.6168 0.9439 0.5638 1.5101 0.9262 0.6098 1.4146 0.9756 1.6098 0.7317 0.6585 1.1642 1.0858 0.7500 0.6818 1.2955 1.0227 1.2149 0.9298 0.8554 1.0051 0.8832 1.1117
To determine the degree of the faults of different types of production systems, it is necessary to use the faults in a single category as a reference sequence to calculate the factors and their correlations. Therefore, the key influencing factors of each category fault can be identified.
(1) The influence degrees of the four kinds of influencing factors on the class A faults are studied. For material conveying system faults, the reference sequence is y 1 and the comparison sequences are x 1 ,   x 2 ,   x 3 , and   x 4 . The coefficient matrix is given by:
y 1 x 1 x 2 x 3 x 4 = 1.4393 0.6168 0.9439 1.1642 1.0858 0.7500 0.6818 1.2955 1.0227 1.2149 0.9298 0.8554 1.0051 0.8832 1.1117
Substituting the coefficient matrix into Equation (9), the absolute difference matrix is obtained as follows:
11 12 13 14 = 0.2751 0.4690 0.1939 0.7574 0.6786 0.0788 0.2244 0.3129 0.0886 0.4342 0.2664 0.1677
According to Equations (7) and (8), it is found that Δ m i n   = 0.0788 and Δ m a x   = 0.7574.
Substituting the above absolute difference matrix into Equation (10), the mean of all absolute differences Δ ¯ can be obtained. Δ ¯ = 1 3 × 4 j = 1 4 k = 1 3 y 1 k x j ( k ) = 0.3289, E Δ = Δ ¯ / Δ m a x   = 0.4343, and since Δ m i n < 3 Δ ¯ = 0.9868, the data sequence is normal. Then, the range of the resolution coefficient can be determined as 1.5 E Δ ρ 2 E Δ , that is, 0.6514 ≤ ρ ≤ 0.8685. In this research, ρ = 1.75 and E Δ   = 0.7600.
Substituting the above results into Equation (10), the grey correlation coefficient matrix for each influencing factor can be obtained as follows:
ξ 11 ξ 12 ξ 13 ξ 14 = 0.7693 0.6265 0.8504 0.4909 0.5218 1.0000 0.8180 0.7365 0.9853 0.6481 0.7772 0.8803
Substituting the above grey correlation coefficient matrix into Equation (5), the correlation coefficient r 1 j of the human factor P, environmental factor E, mechanical component life factor M, and other factors O for a class A fault, i.e., a material conveying system fault, can be obtained. j = 1,2 , 3,4 , r 1 = r 11 , r 12 , r 13 , r 14 = [0.7487,0.6709,0.8466,0.7685]. It is obvious that r 13 > r 14 > r 11 > r 12 . Therefore, the relationship between the mechanical component life factor M and class A faults is large. It is indicated that class A faults are greatly affected by the mechanical component life factor. Corresponding measures should be taken to prevent the occurrence of a class A fault in the material conveying system.
(2) The influence degrees of the four kinds of influencing factors on a class B fault, i.e., a batch metering system fault, are studied. The reference sequence is y 2 and the comparison sequences are x 1 ,   x 2 ,   x 3 , and   x 4 . The coefficient matrix is given by:
y 2 x 1 x 2 x 3 x 4 = 0.5638 1.5101 0.9262 1.1642 1.0858 0.7500 0.6818 1.2955 1.0227 1.2149 0.9298 0.8554 1.0051 0.8832 1.1117
Substituting the coefficient matrix into Equation (9), the absolute difference matrix is obtained as follows:
21 22 23 24 = 0.6004 0.4242 0.1762 0.1181 0.2146 0.0966 0.6511 0.5803 0.0708 0.4413 0.6268 0.1855
According to Equations (7) and (8), it is found that Δ m i n   = 0.0708 and Δ m a x   = 0.6511.
Substituting the above absolute difference matrix into Equation (10), the mean of all absolute differences Δ ¯ can be obtained. Δ ¯ = 1 3 × 4 j = 1 4 k = 1 3 y 2 k x j ( k ) = 0.3488, E Δ = Δ ¯ / Δ m a x   = 0.4986, and since Δ m i n < 3 Δ ¯ = 0.9051, the data sequence is normal. Then, the range of the resolution coefficient can be determined as 1.5 E Δ ρ 2 E Δ , that is, 0.8036   ρ 1.0715. In this research, ρ = 1.75 and E Δ = 0.9375.
Substituting the above results into Equation (10), the grey correlation coefficient matrix for each influencing factor can be obtained, as follows:
ξ 21 ξ 22 ξ 23 ξ 24 = 0.5626 0.6584 0.8660 0.9351 0.8257 0.9363 0.5400 0.5721 1.0000 0.6477 0.5506 0.8559
Substituting the above grey correlation coefficient matrix into Equation (5), the correlation coefficient r 2 j of the human factor P, environmental factor E, mechanical component life factor M, and other factors O for a class B batch metering system fault can be obtained. j = 1,2 , 3,4 , and r 1 = r 21 , r 22 , r 23 , r 24 = [0.6957,0.9081,0.7040,0.6847]. It is obvious that r 22 > r 23 > r 21 > r 24 . Therefore, the relationship between the environmental factor E and class B faults is large. It is indicated that class B faults are greatly affected by environmental factors. Corresponding measures should be taken to prevent the occurrence of a class B fault in the batch metering system.
(3) The influence degrees of the four kinds of influencing factors on a class C fault, i.e., a pneumatic system fault, are studied. The reference sequence is y 3 and the comparison sequences are x 1 ,   x 2 ,   x 3 , and   x 4 . The coefficient matrix is given by:
y 3 x 1 x 2 x 3 x 4 = 0.6098 1.4146 0.9756 1.1642 1.0858 0.7500 0.6818 1.2955 1.0227 1.2149 0.9298 0.8554 1.0051 0.8832 1.1117
Substituting the coefficient matrix into Equation (9), the absolute difference matrix is obtained as follows:
31 32 33 34 = 0.5544 0.3288 0.2256 0.0721 0.1192 0.0471 0.6051 0.4849 0.1202 0.3953 0.5314 0.1361
According to Equations (7) and (8), it is found that Δ m i n   = 0.0471 and Δ m a x   = 0.6051.
Substituting the above absolute difference matrix into Equation (10), the mean of all absolute differences Δ ¯ can be obtained.
Substituting the above results into Equation (10), the grey correlation coefficient matrix for each influencing factor can be obtained, as follows:
ξ 31 ξ 32 ξ 33 ξ 34 = 0.5313 0.6712 0.7631 0.9584 0.8886 1.0000 0.5075 0.5678 0.8872 0.6229 0.5429 0.8660
Substituting the above grey correlation coefficient matrix into Equation (5), the correlation coefficient r 3 j of the human factor P, environmental factor E, mechanical component life factor M, and other factors O for a class C fault, i.e., a pneumatic system fault, can be obtained. j = 1,2 , 3,4 , and   r 1 = r 31 , r 32 , r 33 , r 34 = [0.6552,0.9490,0.6542,0.6773]. It is obvious that r 32 > r 34 > r 31 > r 33 . Therefore, the relationship between the environmental factor E and class C faults is large. It is indicated that class C faults are greatly affected by environmental factors. Corresponding measures should be taken to prevent the occurrence of a class C fault in the pneumatic system.
(4) The influence degrees of the four kinds of influencing factors on a class D fault are studied. For blender malfunction faults, the reference sequence is y 4 and the comparison sequences are x 1 ,   x 2 ,   x 3 , and   x 4 . The coefficient matrix is given by:
y 4 x 1 x 2 x 3 x 4 = 1.6098 0.7317 0.6585 1.1642 1.0858 0.7500 0.6818 1.2955 1.0227 1.2149 0.9298 0.8554 1.0051 0.8832 1.1117
Substituting the coefficient matrix into Equation (9), the absolute difference matrix is obtained as follows:
41 42 43 44 = 0.4456 0.3541 0.0915 0.9279 0.5637 0.3642 0.3949 0.1980 0.1968 0.6047 0.1515 0.4531
According to Equations (7) and (8), it is found that Δ m i n = 0.0915 and Δ m a x   = 0.9279.
Substituting the above absolute difference matrix into Equation (10), the mean of all absolute differences Δ ¯ can be obtained. Δ ¯ = 1 3 × 4 j = 1 4 k = 1 3 y 1 k x j ( k ) = 0.3955, E Δ = Δ ¯ / Δ m a x   = 0.4262, and since Δ m i n < 3 Δ ¯   = 1.1865, the data sequence is normal. Then, the range of the resolution coefficient can be determined as 1.5 E Δ ρ 2 E Δ , that is, 0.6393   ρ 0.8525. In this study, ρ = 1.75 and E Δ = 0.7459.
Substituting the above results into Equation (10), the grey correlation coefficient matrix for each influencing factor can be obtained, as follows:
ξ 41 ξ 42 ξ 43 ξ 44 = 0.6888 0.7490 1.0000 0.4837 0.6239 0.7418 0.7209 0.8803 0.8815 0.6043 0.9288 0.6842
Substituting the above grey correlation coefficient matrix into Equation (5), the correlation coefficient r 4 j of the human factor P, environmental factor E, mechanical component life factor M, and other factors O for a class D fault, i.e., a blender malfunction fault, can be obtained. j = 1,2 , 3,4 , and r 4 = r 41 , r 42 , r 43 , r 44 = [0.8126,0.6165,0.8275,0.7391]. It is obvious that r 43 > r 41 > r 44 > r 42 . Therefore, the relationship between the mechanical component life factor M and class D faults is large. It is indicated that class D faults are greatly affected by the mechanical component life factor. Corresponding measures should be taken to prevent the occurrence of a class D fault in the blender malfunction.
Figure 8 shows the comparison results of the grey correlation degrees r 11 , r 12 , r 13 , r 14 , r 21 , r 22 , r 23 , r 24 , r 31 , r 32 , r 33 , r 34 , r 41 , r 42 , r 43 , r 44 for the above four reference sequences. The size relationship is as follows:
r 32 > r 22 > r 13 > r 43 > r 41 > r 14 > r 11 > r 44 > r 23 > r 21 > r 24 > r 34 > r 12 > r 31 > r 33 > r 42 .
It can be seen from Figure 8 that the grey correlation degree of the factors affecting concrete dam production system faults for different reference sequences can be divided into three categories: (1) the grey correlation degree is greater than 0.9000. This mainly includes the correlation degrees   r 32 and r 22 of the environment factor E to class C and class B faults. (2) The grey correlation degree is in the range of 0.7000–0.9000. This mainly includes the correlation degrees r 11 and r 41 of the human factor P to class A and class D faults, the correlation degrees r 13 ,   r 23 , and r 43 of the mechanical component life factor M to class A, class B, and class D faults, and the correlation degrees r 14 and r 44 of the other factors O to class A and class D faults. (3) The grey correlation degree is less than 0.7000. This mainly includes the correlation degrees r 21 and r 31 of the human factor P to class B and class C faults, the correlation degrees r 12 and r 42 of the environment factor E to class A and class D faults, the correlation degree r 33 of the mechanical component life factor M to class C, and the correlation degrees r 24 and r 34 of the other factors O to class B and class C faults.

6. Discussion and Conclusions

This paper aimed to propose a fault classification method and fault identification model for CPSs in dam engineering, which is of great significance for mastering the influence degree of CPS faults and creating a maintenance plan for different parts. An on-site investigation of production system faults in a concrete dam project under construction was conducted. Combining production system fault data and dam-pouring information, the influence law of production system faults on the dam-pouring construction progress, quality, and efficiency was discussed. Based on the concrete production logs of multiple concrete dams and a literature review, a fault classification system for a concrete dam production system was proposed by comprehensively considering the mechanical structure characteristics and operating characteristics. The problem of the classification of faults not being clear and restricting the further study of the impact law of faults is solved. Based on the GCA method, a fault identification model of the CPS was established. The correlation of the fault statistical sample data was analyzed. The identification of key influencing factors of various faults was realized.
(1) Based on the literature data and actual engineering CPS fault statistics, according to the location of a fault, the faults of CPSs were divided into four categories: batch metering system faults, material transport system faults, pneumatic system faults, and mixer faults. According to the specific manifestation of faults, comprehensively considering the mechanical structure characteristics and operational characteristics, the faults were subdivided into 22 sub-categories.
(2) Through a literature review, engineering research, and expert consultation, the root causes of the faults of CPSs were categorized into four factors: human factors, environmental factors, mechanical component life factors, and other factors. Using the advantages of the small sample modeling GCA method, an identification model for the influencing factors of the faults of the CPS was established.
(3) Based on the actual CPS fault statistics, the correlations between the four types of faults and the four influencing factors were analyzed, and the key influencing factors of the various faults in CPSs were obtained. The research results showed that fault A of the batching metering system and fault D of the mixer were most affected by the service life factor of the mechanical parts. Fault B of the material conveying system and fault C of the pneumatic system were most affected by environmental factors.
(4) The research results solve the problem of fault classification being unclear, aid with further in-depth studies on the fault influence law, and realize the identification of the key influencing factors of various faults. However, the limitation of this study lies in the lack of comparison with other methods. We will consider this in future research.
(5) The real case applied in this paper was mainly used to verify the feasibility of the model. In fact, there are differences in the geographical location, climate conditions, personnel quality, CPS configuration, and organizational management level among different dam projects, and the patterns of CPS faults in different dam projects are inevitably different. However, due to the small differences in the mechanical structure characteristics and operating characteristics of CPSs, the types of production system faults and influencing factors in different projects are similar, and the identification results of key faults will vary. This is determined by the fault data obtained in a real case and has nothing to do with the model itself. Before the construction of a similar dam project, the suggestions proposed in this article can serve as a reference for engineers to make an initial maintenance plan. During the construction process, the identification results of key faults can be dynamically updated based on continuously updated measured fault data, which can guide the development of a maintenance plan for the CPS in the next stage. If more CPS fault data of dam projects can be obtained, we can also explore the distribution patterns of key faults, which is also our future research direction.

Author Contributions

Conceptualization, C.Z.; Conceptualization, Y.Z.; methodology, H.Z.; validation, H.Z.; investigation, Z.L.; writing—original draft, T.M.; writing—review and editing, Z.L.; writing—review and editing, F.W.; project administration, T.F. All authors have read and agreed to the published version of the manuscript.

Funding

This research work was supported by the Youth Fund project of the National Natural Science Foundation of China (No. 52109157).

Data Availability Statement

The raw data supporting the conclusions of this article will be made available by the authors on request.

Acknowledgments

The authors thank the reviewers and editors for useful comments and suggestions that assisted to improve the paper.

Conflicts of Interest

Author Tao Fang was employed by the company SINOHYDRO BUREAU 3 Co., LTD POWERCHINA. The remaining authors declare that the research was conducted in the absence of any commercial or financial relationships that could be construed as a potential conflict of interest.

References

  1. Giovanni, B.; Fan, Q.X.; Peng, L. Introduction to the Special Issue “Super High Arch Dams and Underground Caverns in China”. Rock Mech. Rock Eng. 2018, 51, 2447–2450. [Google Scholar] [CrossRef]
  2. Jiang, H.C.; Peng, L.; Fan, Q.X.; Qiang, M.S. Real-Time Safety Risk Assessment Based on a Real-Time Location System for Hydropower Construction Sites. Sci. World J. 2014, 2014, 1–14. [Google Scholar] [CrossRef] [PubMed]
  3. Fan, Q.X.; Zhang, C.R.; Chen, W.B.; Zhang, G.X.; Zhou, S.W.; Wang, Z.L.; Yang, Z.L.; Li, W.W.; Peng, H.; Chen, W.F.; et al. Key technologies of intelligent construction of Wudongde and Baihetan super high arch dams. J. Hydroelectr. Eng. 2019, 38, 22–35. [Google Scholar]
  4. Matallah, M.; Taibi, A.; Chimoto, T.T.; Maradzika, F.K. Mesoscale investigation of mass concrete temperature control systems and their consequences on concrete mechanical behaviour. Frat. Integrità Strutt. 2022, 16, 416–437. [Google Scholar] [CrossRef]
  5. Deligiannis, V.; Manesis, S. Concrete batching and mixing plants: A new modeling and control approach based on global automata. Autom. Constr. 2008, 17, 368–376. [Google Scholar] [CrossRef]
  6. Fan, Q.X.; Peng, L.; Wei, P.C.; Ning, Z.Y.; Li, G. Closed-loop control theory of intelligent construction. J. Tsinghua Univ. Sci. Tech. 2021, 61, 660–670. [Google Scholar] [CrossRef]
  7. Ghasri, M.; Maghrebi, M.; Rashidi, T.H.; Waller, S.T. Hazard-based model for concrete pouring duration using construction site and supply chain parameters. Autom. Constr. 2016, 71, 283–293. [Google Scholar] [CrossRef]
  8. Li, B.; Delpha, C.; Diallo, D.; Migan-Dubois, A. Application of Artificial Neural Networks to photovoltaic fault detection and diagnosis: A review. Renew. Sustain. Energy Rev. 2021, 138, 110512. [Google Scholar] [CrossRef]
  9. Ahmad, J.; Kontoleon, K.J.; Majdi, A.; Naqash, M.T.; Deifalla, A.F.; Ben Kahla, N.; Isleem, H.F.; Qaidi, S.M.A. A Comprehensive Review on the Ground Granulated Blast Furnace Slag (GGBS) in Concrete Production. Sustainability 2022, 14, 8783. [Google Scholar] [CrossRef]
  10. Livera, A.; Theristis, M.; Makrides, G.; Georghiou, G.E. Recent advances in failure diagnosis techniques based on performance data analysis for grid-connected photovoltaic systems. Renew. Energy 2019, 133, 126–143. [Google Scholar] [CrossRef]
  11. Harrou, F.; Dairi, A.; Taghezouit, B.; Sun, Y. An unsupervised monitoring procedure for detecting anomalies in photovoltaic systems using a one-class Support Vector Machine. Sol. Energy 2019, 179, 48–58. [Google Scholar] [CrossRef]
  12. Kumawat, A.; Panda, S. A robust edge detection algorithm based on feature-based image registration (FBIR) using improved canny with fuzzy logic (ICWFL). Vis. Comput. 2022, 38, 3681–3702. [Google Scholar] [CrossRef]
  13. Idrissi, A.E.; Derouich, A.; Mahfoud, S.; Ouanjli, N.E.; Chantoufi, A.; Al-Sumaiti, A.S.; Mossa, M.A. Bearing Fault Diagnosis for an Induction Motor Controlled by an Artificial Neural Network—Direct Torque Control Using the Hilbert Transform. Mathematics 2022, 10, 4258. [Google Scholar] [CrossRef]
  14. Demetgul, M. Fault diagnosis on production systems with support vector machine and decision trees algorithms. Int. J. Adv. Manuf. Technol. 2013, 67, 2183–2194. [Google Scholar] [CrossRef]
  15. Jamil, M.; Sharma, S.K.; Singh, R. Fault detectionn and classification in electrical power transmission system using artificial neural network. SpringerPlus 2015, 4, 334. [Google Scholar] [CrossRef] [PubMed]
  16. Heo, S.; Lee, J.H. Fault detection and classification using artificial neural networks. IFAC-PapersOnLine 2018, 51, 470–475. [Google Scholar] [CrossRef]
  17. Okwuosa, C.N.; Hur, J. A Filter-Based Feature-Engineering-Assisted SVC Fault Classification for SCIM at Minor-Load Conditions. Energies 2022, 15, 7597. [Google Scholar] [CrossRef]
  18. Gupta, M.; Wadhvani, R.; Rasool, A. A real-time adaptive model for bearing fault classification and remaining useful life estimation using deep neural network. Knowl. Based Syst. 2023, 259, 110070. [Google Scholar] [CrossRef]
  19. Casoli, P.; Pastori, M.; Scolari, F.; Rundo, M. A Vibration Signal-Based Method for Fault Identification and Classification in Hydraulic Axial Piston Pumps. Energies 2019, 12, 953. [Google Scholar] [CrossRef]
  20. Calabrese, F.; Regattieri, A.; Bortolini, M.; Galicia, F.G.; Visentini, L. Feature-Based Multi-Class Classification and Novelty Detection for Fault Diagnosis of Industrial Machinery. Appl. Sci. 2021, 11, 9580. [Google Scholar] [CrossRef]
  21. Youssef, A.; El-Telbany, M.; Zekry, A. The role of artificial intelligence in photo-voltaic systems design and control: A review. Renew. Sustain. Energy Rev. 2017, 78, 72–79. [Google Scholar] [CrossRef]
  22. Heinrich, M.; Meunier, S.; Samé, A.; Quéval, L.; Darga, A.; Oukhellou, L.; Multon, B. Detection of cleaning interventions on photovoltaic modules with machine learning. Appl. Energy 2020, 263, 114642. [Google Scholar] [CrossRef]
  23. Choi, J.; Edwards, P.; Ko, K.; Kim, Y. Definition and classification of fault damage zones: A review and a new methodological approach. Earth-Sci. Rev. 2016, 152, 70–87. [Google Scholar] [CrossRef]
  24. Chen, K.; Huang, C.; He, J. Fault detection, classification and location for transmission lines and distribution systems: A review on the methods. High Volt. 2016, 1, 25–33. [Google Scholar] [CrossRef]
  25. Bellanco, I.; Fuentes, E.; Vallès, M.; Salom, J. A review of the fault behavior of heat pumps and measurements, detection and diagnosis methods including virtual sensors. J. Build. Eng. 2021, 39, 102254. [Google Scholar] [CrossRef]
  26. Liu, R.; Yang, B.; Zio, E.; Chen, X. Artificial intelligence for fault diagnosis of rotating machinery: A review. Mech. Syst. Signal Process. 2018, 108, 33–47. [Google Scholar] [CrossRef]
  27. Zhang, H.; Bai, Y. A smart diagnosis system based on automatic recognition of multiple rotor faults. Adv. Mech. Eng. 2017, 9, 755–764. [Google Scholar] [CrossRef]
  28. Cheng, J.T.; Li, A.; Duan, Z.M.; Yan, X. Fault Classification of Hydroelectric Generating Unit Based on Improved Evidence Theory. Open Fuels Energy Sci. J. 2014, 7, 78–83. [Google Scholar] [CrossRef]
  29. Cheng, J.T.; Lei, W.; Yan, X. An improved cuckoo search algorithm and its application in vibration fault diagnosis for a hydroelectric generating unit. Eng. Optim. 2018, 50, 1593–1608. [Google Scholar] [CrossRef]
  30. Cheng, J.; Wang, L.; Xiong, Y. Cuckoo search algorithm with memory and the vibrant fault diagnosis for hydroelectric generating unit. Eng. Comput. 2019, 35, 687–702. [Google Scholar] [CrossRef]
  31. Zhou, H.W.; Zhou, Y.H.; Zhao, C.J. Fault-Response Mechanism of Production System in Concrete-Dam-Construction Simulation. J. Constr. Eng. Manag. 2016, 142, 04016065. [Google Scholar] [CrossRef]
  32. Liew, K.M.; Sojobi, A.O.; Zhang, L.W. Green concrete: Prospects and challenges. Constr. Build. Mater. 2017, 156, 1063–1095. [Google Scholar] [CrossRef]
  33. Majid, E.S.; Mohammad, H.; Jamie, E.P.; Gencturk, B. Probabilistic analysis of vertical concrete dry casks subjected to tip-over and aging effects. Nucl. Eng. Des. 2019, 343, 232–247. [Google Scholar] [CrossRef]
  34. Cazacliu, B.; Lê, N.D.; de Larrard, F. New methods for accurate water dosage in concrete central mix plants. Mater. Struct. 2008, 41, 1681–1696. [Google Scholar] [CrossRef]
  35. Sivilevičius, H.; Skrickij, V.; Skačkauskas, P. The Correlation between the Number of Asphalt Mixing Plants and the Production of Asphalt Mixtures in European Countries and the Baltic States. Appl. Sci. 2021, 11, 9375. [Google Scholar] [CrossRef]
  36. Sinenko, S.; Zhadanovskiy, B.; Pakhomova, L. Assessment of Complex Technological Processes of Concrete Mixes Preparation With on-Site Automated Concrete Mixing Plants, IOP conference series. Mater. Sci. Eng. 2018, 463, 32032. [Google Scholar] [CrossRef]
  37. Deng, J.L. The grey control system. J. Huanzhong Univ. Sci. Tech. 1982, 10, 9–18. [Google Scholar] [CrossRef]
  38. Deng, J.L. Control problems of grey systems. Syst. Control Lett. 1982, 1, 288–294. [Google Scholar] [CrossRef]
  39. Deng, J.L.; Zhou, C.S. Sufficient conditions for the stability of a class of interconnected dynamic systems. Syst. Control Lett. 1986, 7, 105–108. [Google Scholar] [CrossRef]
  40. Darong, H.; Jianping, T.; Ling, Z. A Fault Diagnosis Method of Power Systems Based on Grey System Theory. Math. Probl. Eng. 2015, 2015, 971257. [Google Scholar] [CrossRef]
  41. Ma, T.; Hu, Z.; Xu, Y.; Dong, H. Fault Location Based on Comprehensive Grey Correlation Degree Analysis for Flexible DC Distribution Network. Energies 2022, 15, 7820. [Google Scholar] [CrossRef]
  42. Shen, X.; Ren, Y.; Chai, L.; Wang, L.; Zhang, D.; Gao, F. Method of Evaluation for the Construction Geology of Transmission Line Based on Grey System Theory. IOP Conf. Ser. Earth Environ. Sci. 2019, 358, 42046. [Google Scholar] [CrossRef]
Figure 1. Concrete mixing building.
Applsci 14 04745 g001
Figure 2. Material handling system structure.
Applsci 14 04745 g002
Figure 3. Batch metering system structure diagram.
Applsci 14 04745 g003
Figure 4. Pneumatic system structure.
Applsci 14 04745 g004
Figure 5. Mixer structure.
Applsci 14 04745 g005
Figure 6. Identification process of the influencing factors of the concrete dam production system fault.
Applsci 14 04745 g006
Figure 7. Case study—sample of CPS fault.
Applsci 14 04745 g007
Figure 8. Comparison of the grey correlation degree of the influencing factors of the CPS fault.
Applsci 14 04745 g008
Table 1. Main fault classification of CPS.
Fault CategoryCategory NumberFault ManifestationCorresponding Number
Material handling system faultABelt conveyor bearing damageA1
Pipe pump faultA2
Belt breakA3
Roller wear throughA4
Belt deviationA5
Belt conveyor crushedA6
Batch metering system faultBLoad cell faultB1
Line faultB2
Power supply voltage fluctuation or poor groundingB3
Digital weighing instrument faultB4
Measuring bin door is stuckB5
Door solenoid valve faultB6
Pneumatic system faultCGas source faultC1
Pneumatic execution of the original (cylinder) faultC2
Reversing valve faultC3
Pneumatic auxiliary original faultC4
Mechanical faultC5
Stirring system faultDThe discharge door is stuckD1
Mixer inlet blockedD2
Gearbox mechanical faultD3
Mixer slag agglomerationD4
Mixer boring machine tripD5
Table 2. Statistics on the production system faults of concrete dam engineering.
Fault CategoryFault ManifestationStatistical Sample Number S1Statistical Sample Number S2Statistical Sample Number S3
Number of FaultsProportionNumber of CasesProportionNumber of CasesProportion
AA13751.68%814.29%2939.76%
A2221414
A361111
A4591432
A51898
A612107
BB198.05%1926.13%1118.11%
B25168
B33117
B4136
B56195
B6479
CC11616.78%1438.68%531.50%
C284031
C3143123
C492519
C5362
DD11522.15%720.91%510.63%
D21151
D31743
D4141113
D5935
Sum298-287-254-
Table 3. Statistics of fault cases for multi-factors of CPS.
FaultsNumber of Faults of Corresponding Types of FaultsNumber of Faults Caused by Various Influencing Factors
Quantity ABCDPEMO
S1154285066104309866
S266751163097577558
S310146802767456973
Disclaimer/Publisher’s Note: The statements, opinions and data contained in all publications are solely those of the individual author(s) and contributor(s) and not of MDPI and/or the editor(s). MDPI and/or the editor(s) disclaim responsibility for any injury to people or property resulting from any ideas, methods, instructions or products referred to in the content.

