Article

Differences in the Lateral and Vertical Jump Performances of Elite Male Basketball Players—An Axial Stabilization Training Program

1
Center of General Education, National Taiwan College of Performing Arts, Taipei 11464, Taiwan
2
Master’s Program in Sports and Leisure Management, National Cheng Kung University, Tainan 70101, Taiwan
3
Office of Physical Education, Tamkang University, No. 151, Ying-Zhuan Rd., Tamshui, New Taipei City 251301, Taiwan
*
Author to whom correspondence should be addressed.
Appl. Sci. 2024, 14(11), 4832; https://doi.org/10.3390/app14114832
Submission received: 14 April 2024 / Revised: 27 May 2024 / Accepted: 28 May 2024 / Published: 3 June 2024
(This article belongs to the Special Issue Exercise Physiology and Biomechanics in Human Health)

Abstract

:
This study aimed to conduct a kinetic analysis of the lateral and vertical jumps of elite male basketball players through a 12-week axial stability training program to improve sports performance. Thirty elite Taiwanese male basketball players were openly recruited and divided into experimental groups and control groups. The experimental group conducted the test twice a week, a 12-week (24-session) axial stability training program intervention in total, and the control group only received general basketball training. A double-track force plate was used to measure lateral and vertical jumps in order to understand their dynamic parameters. Finally, a difference analysis between the post-test of lateral and vertical jumps was conducted. The results show that the axial stability training program affected the activation of the abdominal and lower limb extensor muscles and had a stabilizing effect on the muscles of the experimental group. When the participants conducted a lateral jump, they were able to stand firm within 1 s and take off instantly. The θ value of the T-PRF ranged from 60.7° to 68.6°. The post-test of the participants’ vertical jump showed that the kurtosis of the RFD was steeper, the time required for the RFD was shorter, the GRF and the duration of passage increased, and the experimental group was better than the control group in all post-tests. By comparing the two types of jumps, it was found that they had the vertical force in common. The main differences were in the reaction force of the leg strength, the jump distance and height, and the take-off angle.

1. Introduction

In most individual or team competitive sports, athletes are required to sprint short or long distances, change direction quickly, or jump up to a maximum height or distance. Both male and female athletes should use strength training to strengthen their bodies, increase muscle explosiveness, improve their appearance, and promote the development of their physical strength [1,2]. In basketball, jumping is one of the core tasks, and strong and explosive movements of the lower body are crucial on both the offensive and defensive ends of the game [3,4]. Jump assessments are usually divided into vertical and lateral jump assessments. Studies have shown that basketball involves high-intensity and moderate-intensity jumping in many directions, with 20% of movement occurring in lateral jumps [5]. Therefore, basketball players must bear the power required for vertical and lateral jumps, and kinetic evaluations of vertical and lateral jumps may indicate differences, which was the primary motivation for this study.
Basketball players must have excellent physical fitness. Athletes of the same specialty still have high and low qualities. In addition to a technical level, the level of muscle is also examined, because muscles are the source of power for competitive athletes [6]. This study applies Panjabi’s concept of axial stability and the spinal peripheral muscle system as its basis [7] because the spinal peripheral muscle system is the active subsystem used by the body to generate force. These muscle structures are commonly classified into action muscles and stabilizer muscles, superficial muscles and deep muscles, broad muscle groups, and small muscle groups [7]. Panjabi pointed out that the stability of dynamic movements relies on the strength of the muscle groups around the lumbar spine and trunk [8], and that it supports the muscle strength, control, and stability of the limbs [9]. These muscle groups include the back muscles, psoas muscles, and the gluteal muscles on the back of the body; additionally, it also relies on the strength of the abdominal core muscles on the front of the body to support the maximum power of distal upper and lower limb movements [10,11,12]. Based on the above reasons, this study designed an axial stability training program (ASTP) to enhance the axial muscle group (including back muscles, psoas muscles, gluteal muscles, and the abdomen) to benefit basketball players’ distal lower limb lateral jump and vertical jump strength.
Indicators of basketball lower limb dynamics include the ground reaction force of instant take-off; the rate of force development (RFD); the time of force development; and the duration of passage height [13], which is the lower limb power calculated as the product of the vertical ground reaction force and the lower limb extension movement velocity. When the RFD of the maximum force generated by the reaction force specifically showed the value of the slope, it was found to be an important indicator of explosive power [14]. The RFD can be viewed as the slope (r) of force versus time. When the slope presents a centripetal force output curve that is steep (a pointy kurtosis), it indicates that an excellent RFD can be produced [15]. The so-called duration of passage refers to the total time that an athlete spends in the air during a jump, which is the process from leaving the ground to the first time that they touch the ground when they land [16]. Lower limb power affects the duration of passage because of the eccentric and concentric phases of the stretch-shortening cycle of the lower limb, muscle extension, and stretch reflexes that generate force [17]. Jumping height mainly depends on leg strength, waist and abdominal strength, and running speed [18]. However, the biggest difference between vertical and lateral jumps is the difference in the take-off angle [19]. Therefore, this study used central axial stabilization training to understand the differences in the dynamic parameters of basketball players’ lateral and vertical jumps.
According to the above literature, there are currently only a few studies on elite basketball players using an ASTP and on kinetic analyses of lateral and vertical jumps. Therefore, the purpose of this study was to determine whether an ASTP can improve the lateral and vertical jumping performance of elite male basketball players’ lower limbs. The hypotheses of this study are as follows:
Hypothesis 1.
A 12-week ASTP can improve the lateral jumping ability of elite basketball players.
Hypothesis 2.
A 12-week ASTP can improve the vertical explosive power of basketball players.
Hypothesis 3.
A 12-week ASTP causes significant differences in the lateral and vertical jumps of elite basketball players.

2. Materials and Methods

The participants in this study were sampled from a specific group of elite, Taiwanese, male basketball players. A pre-test was conducted under a natural situation, the experimental group received ASTP intervention, and, after the experiment, both groups took a post-test. A statistical analysis was conducted based on the data from the pre-test and the post-test. This research had a quasi-experimental design [20].

2.1. Participants

Taiwan’s elite male basketball players participated in a total of 12 teams in the first-level competition (teams that had been promoted in the previous year), with a total number of about 144 as the population of players. According to Gay’s narrative statistical analysis, the sample number should basically account for 10% of the population [21]. Therefore, there was an open recruitment for 30 people. Recruited participants were first tested on background variables, including their health information, age, height, weight, and basketball experience. The 30 people were divided equally into the experimental group and the control group, and a homogeneity test was conducted based on age, height, weight, and basketball experience. All participants signed an informed consent form based on and compiled with scientific and ethical principles (the forms’ contents included the presence of no orthopedic disease or heart disease, the ability to perform daily activities without assistance, and the willingness to refrain from taking supplements that may increase muscle gain during the study). This study was approved by the Human Trials Review Meeting at Tri-Service General Hospital, National Defense Medical College, approval number C202305014.

2.2. Research Materials

Referring to Sasaki et al.’s study on axial stability including the muscle groups of the shoulders, abdomen, waist, and hips [22], the axial stability training program (ASTP) of this study was developed. The experimental group received the ASTP twice weekly for 12 weeks (24 sessions). The main movements included vertical and horizontal jumping. In this study, exercise intensity was based on heart rate as a reference indicator, and each participant wore a heart rate wearable device. When operating the ASTP, the exercise intensity was set to be between 70% and 80% of the maximum heart rate (maximum heart rate = 220 − current age). The body would thus obviously feel out of breath and tired after each training session [23]. After completing each operation, 10–30 s of rest was allowed. All items were completed in one cycle, followed by a rest for 3–5 min. A total of three cycles were required. The 12 weeks were divided into three phases of different intensities. The training intensity in each phase increased, but the number of repetitions decreased, as shown in Table 1.

2.3. Detection Method

This research used PASCO Scientific equipment, the manufacturer of which is in Roseville, CA, USA. PASCO Scientific is a voltage-sensing force plate, and this device can be used in the laboratory and remotely (with Bluetooth and a tablet connection). Using a biaxial force plate, it is adjusted to perform lateral and vertical jump analyses. When evaluating the load capacity of the force plate for human movement, it is necessary to withstand the landing of the heaviest person from significant heights after they jump [24]. The sampling frequency of this equipment was set to 1000 Hz (or 1 kHz) so that 1000 force measurements were generated per second.

2.3.1. Lateral Jump Detection

The participants first practiced left and right side jumps on flat ground and, at the same time, found the best left and right distances for exerting force. Before each subject took the test, the distance between the left and right force plates was adjusted [25]. The participant jumped sideways from one foot and landed steadily on the other force plate. Arm swinging was allowed. The subject followed the pace of a metronome and repeated four jumps on each left and right foot. The whole jump started with one foot, and the other foot was used to land on the ground. The larger the jumping distance, the better, but the landing on one foot must be stable (this was the maximum reasonable distance for the subject) and completed within 15 s.
The lateral jump distance was measured using a tape measure. The subject’s feet were rubbed with a small amount of white powder. After the measurement was completed, the distance between the inner edges of the two force plates was measured with the tape measure, accurate to 0.01 m. The parameters used by the force plates to detect lateral jumps included the jump distance, the ground reaction force of the left and right foot (GRF of left and right), the vertical ground reaction force (V-GRF), the resultant ground reaction force (R-GRF), and the trajectory at the peak resultant force (T-PRF) [26].
Among them is the trajectory at the peak resultant force (deg.), which allows for a lateral jump dynamics analysis, where the subject jumps in a curved path affected by gravity. Also included are vertical (y) and horizontal (x) position components. The following is the trajectory formula of the human body’s lateral jump:
y = x tanθ − gx 2/2v 2 cos 2θ
  • y is the horizontal component;
  • x is the vertical component;
  • θ is the angle of the subject’s lateral jump;
  • g is a constant called the acceleration due to gravity;
  • v is the initial velocity of the projectile.

2.3.2. Vertical Jump Detection

The participant stood upright on the force plate and remained stationary with their weight evenly distributed on both feet. After getting ready, the subject quickly squatted and swung his arms (CMJ), quickly jumped vertically with both arms and legs, landed on both feet at the same time, and returned to the original standing position. Each subject had five separate maximum-effort vertical jumps, with 10 s of rest between each jump, and the three best jumps were recorded and averaged to obtain a final score [27,28].
The parameters used by the force plate to detect vertical jumps included the rate of force development (RFD), the time of RFD, the ground reaction force (GRF) (N), the duration of passage (s), and the jump height (m). The following is the calculation formula for the average RFD and GRF (the ground reaction force is affected by the acceleration of gravity [called g, and equal to 9.81 m/s2]):
Average RFD = [N/s] = Peak Force [N]/Time to achieve peak force [s]
Force = body mass × acceleration due to gravity (F = m·g)

2.4. Control Variable

Taiwan’s first-level college male basketball players were openly recruited. The background variables of these participants included their age, weight, height, and basketball experience. There may be some unconsidered factors or potentially influencing variables in this study. For example, basketball players have different exclusive attack positions, required body shapes, and footsteps, resulting in differences in muscle development; these were the control variables of this study. In addition, all participants needed to practice their basketball skills daily. Many athletes take high-protein supplements to improve muscle strength. This study prohibited the use of high-protein supplements for 12 weeks, and this was another control variable.

2.5. Statistical Analysis

This study used SPSS 28.0 software (IBM®, Armonk, NY, USA) for statistical analysis. First, a t-test for homogeneity was conducted based on the age, height, weight, and basketball experience of the experimental group and the control group. The original data of the pre-test and post-test were obtained and are presented as the standard deviation (SD) and mean (mean). The two groups’ pre- and post-test differences were compared using the F-test of a two-way mixed ANOVA, and the overall significance level was set to p < 0.05.

3. Results

3.1. Analysis of Participants’ Background Variables

Before the experiment, the participants completed a questionnaire regarding their health information, age, height, weight, and basketball experience. All players started participating in regular basketball games when they were 12–14 years old. The two groups conducted a homogeneity test before the experiment. The results showed that there was no significant difference in age, height, weight and basketball experience between the participants in the experimental group and the control group, confirming that the participants in the two groups were homogeneous, as shown in Table 2.

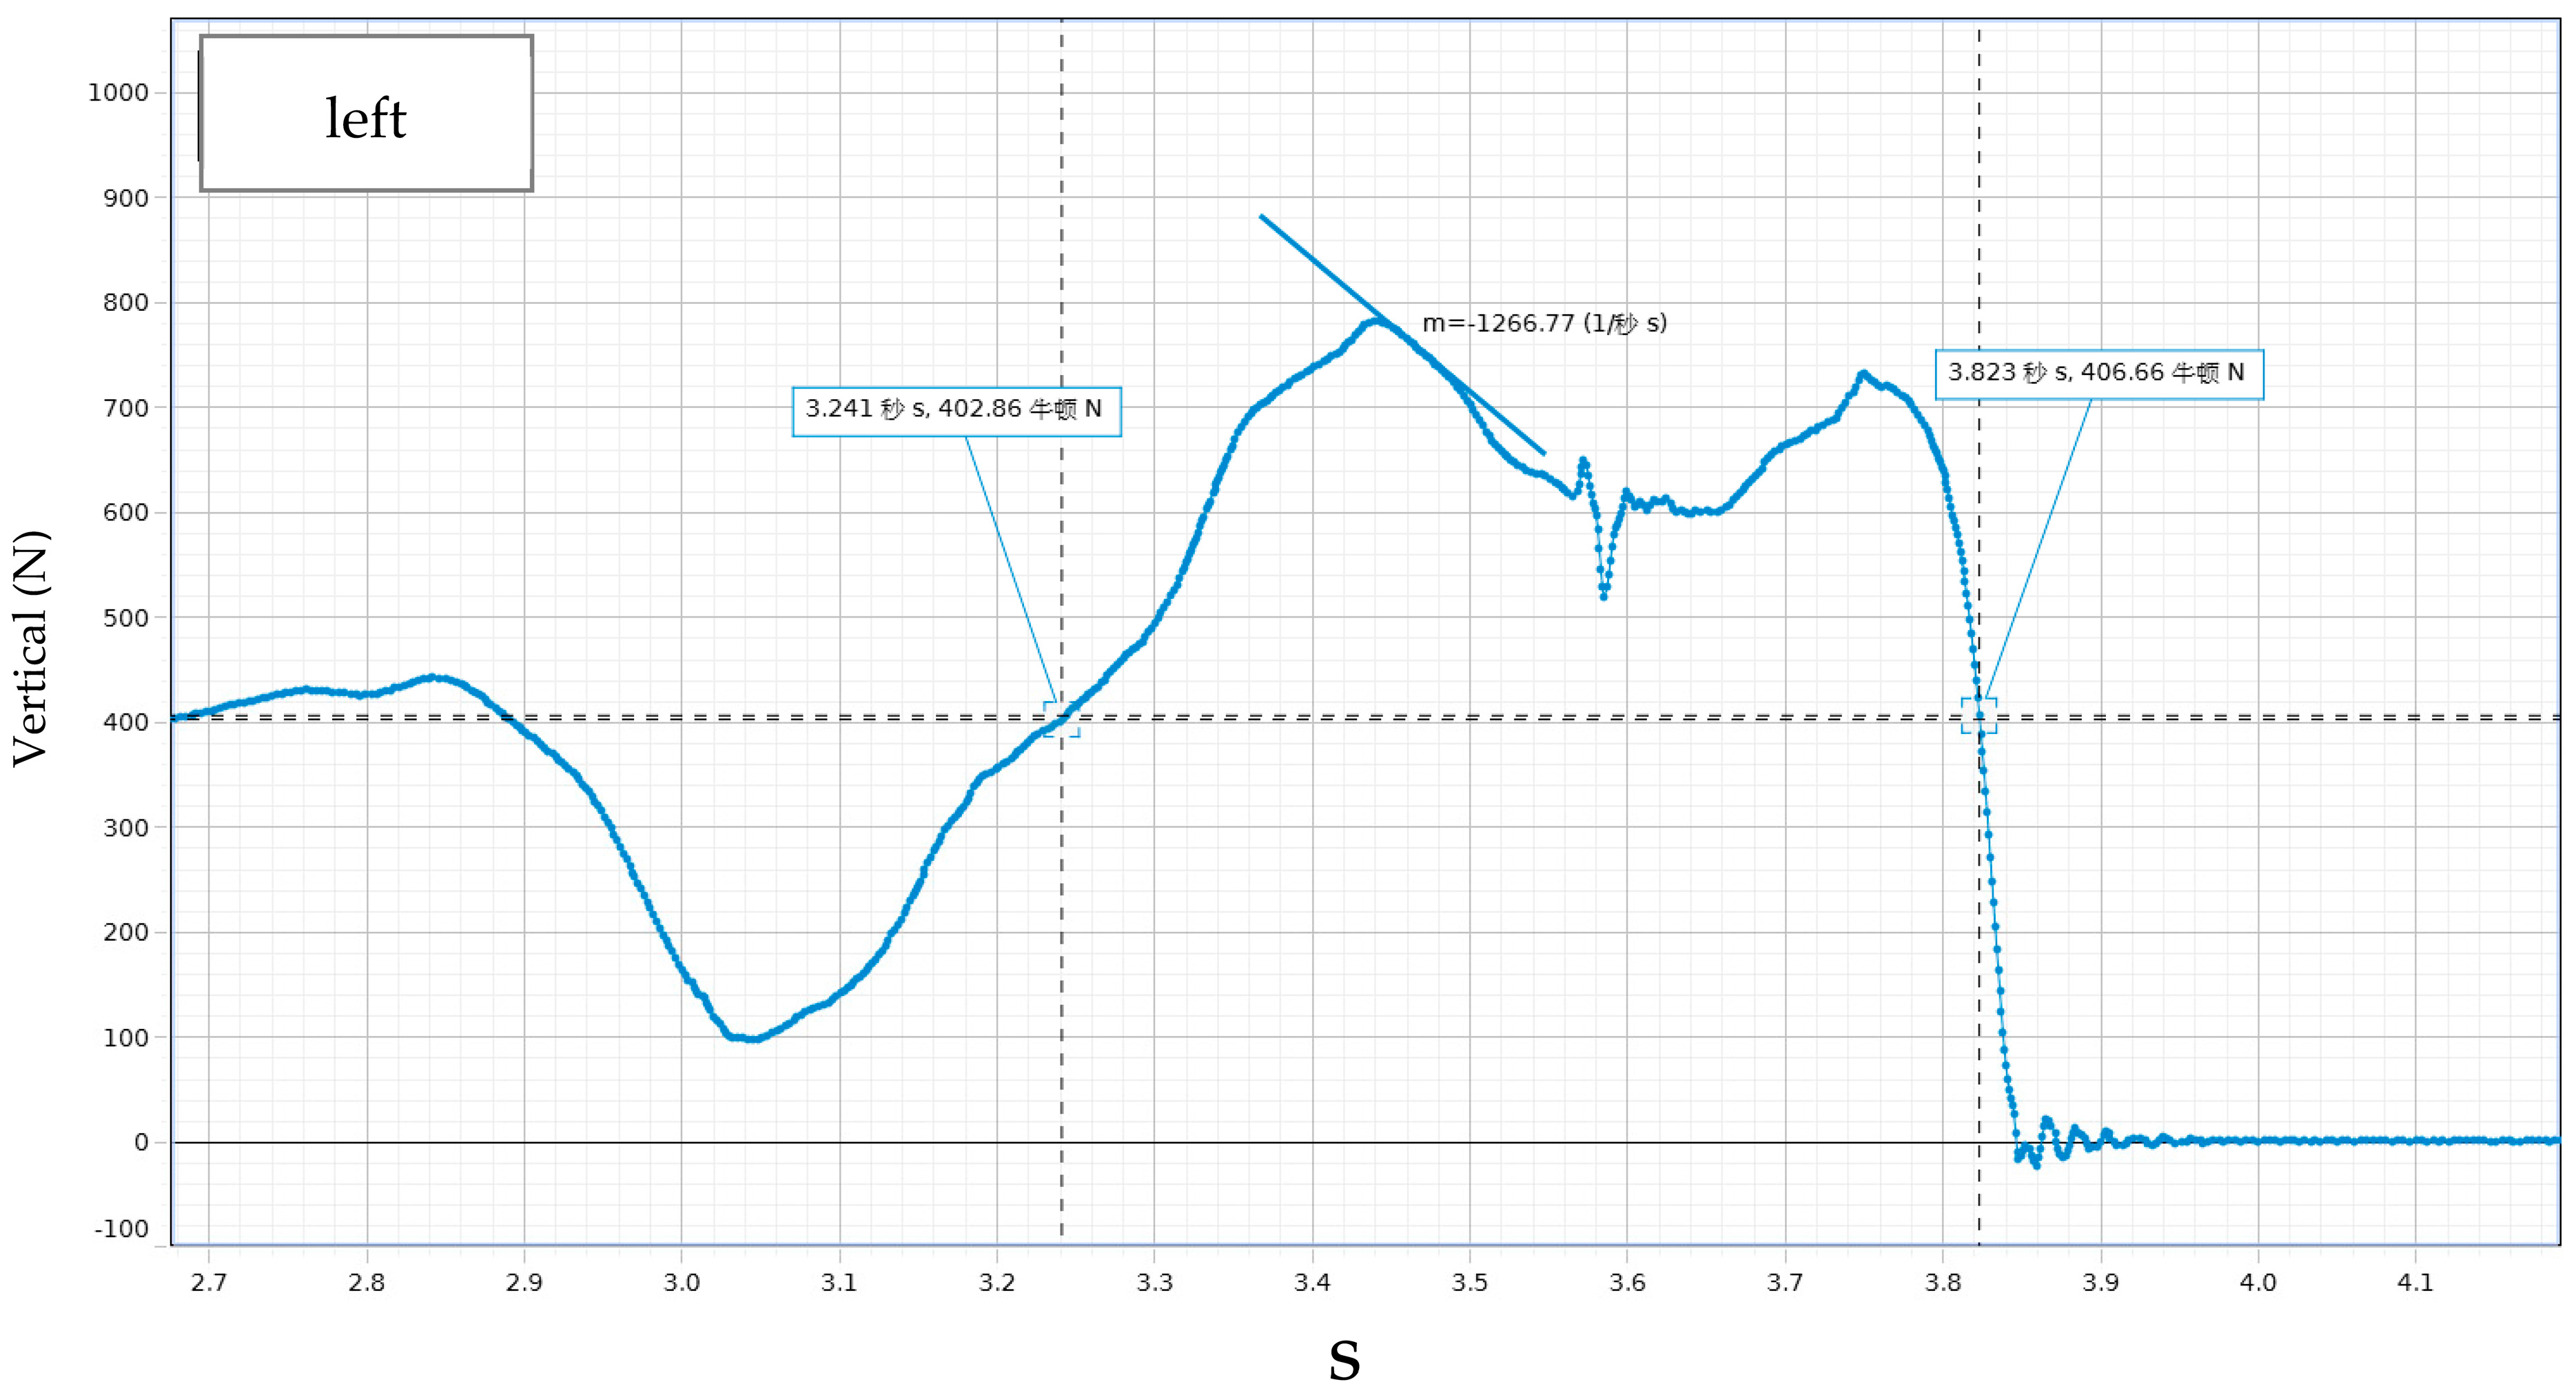
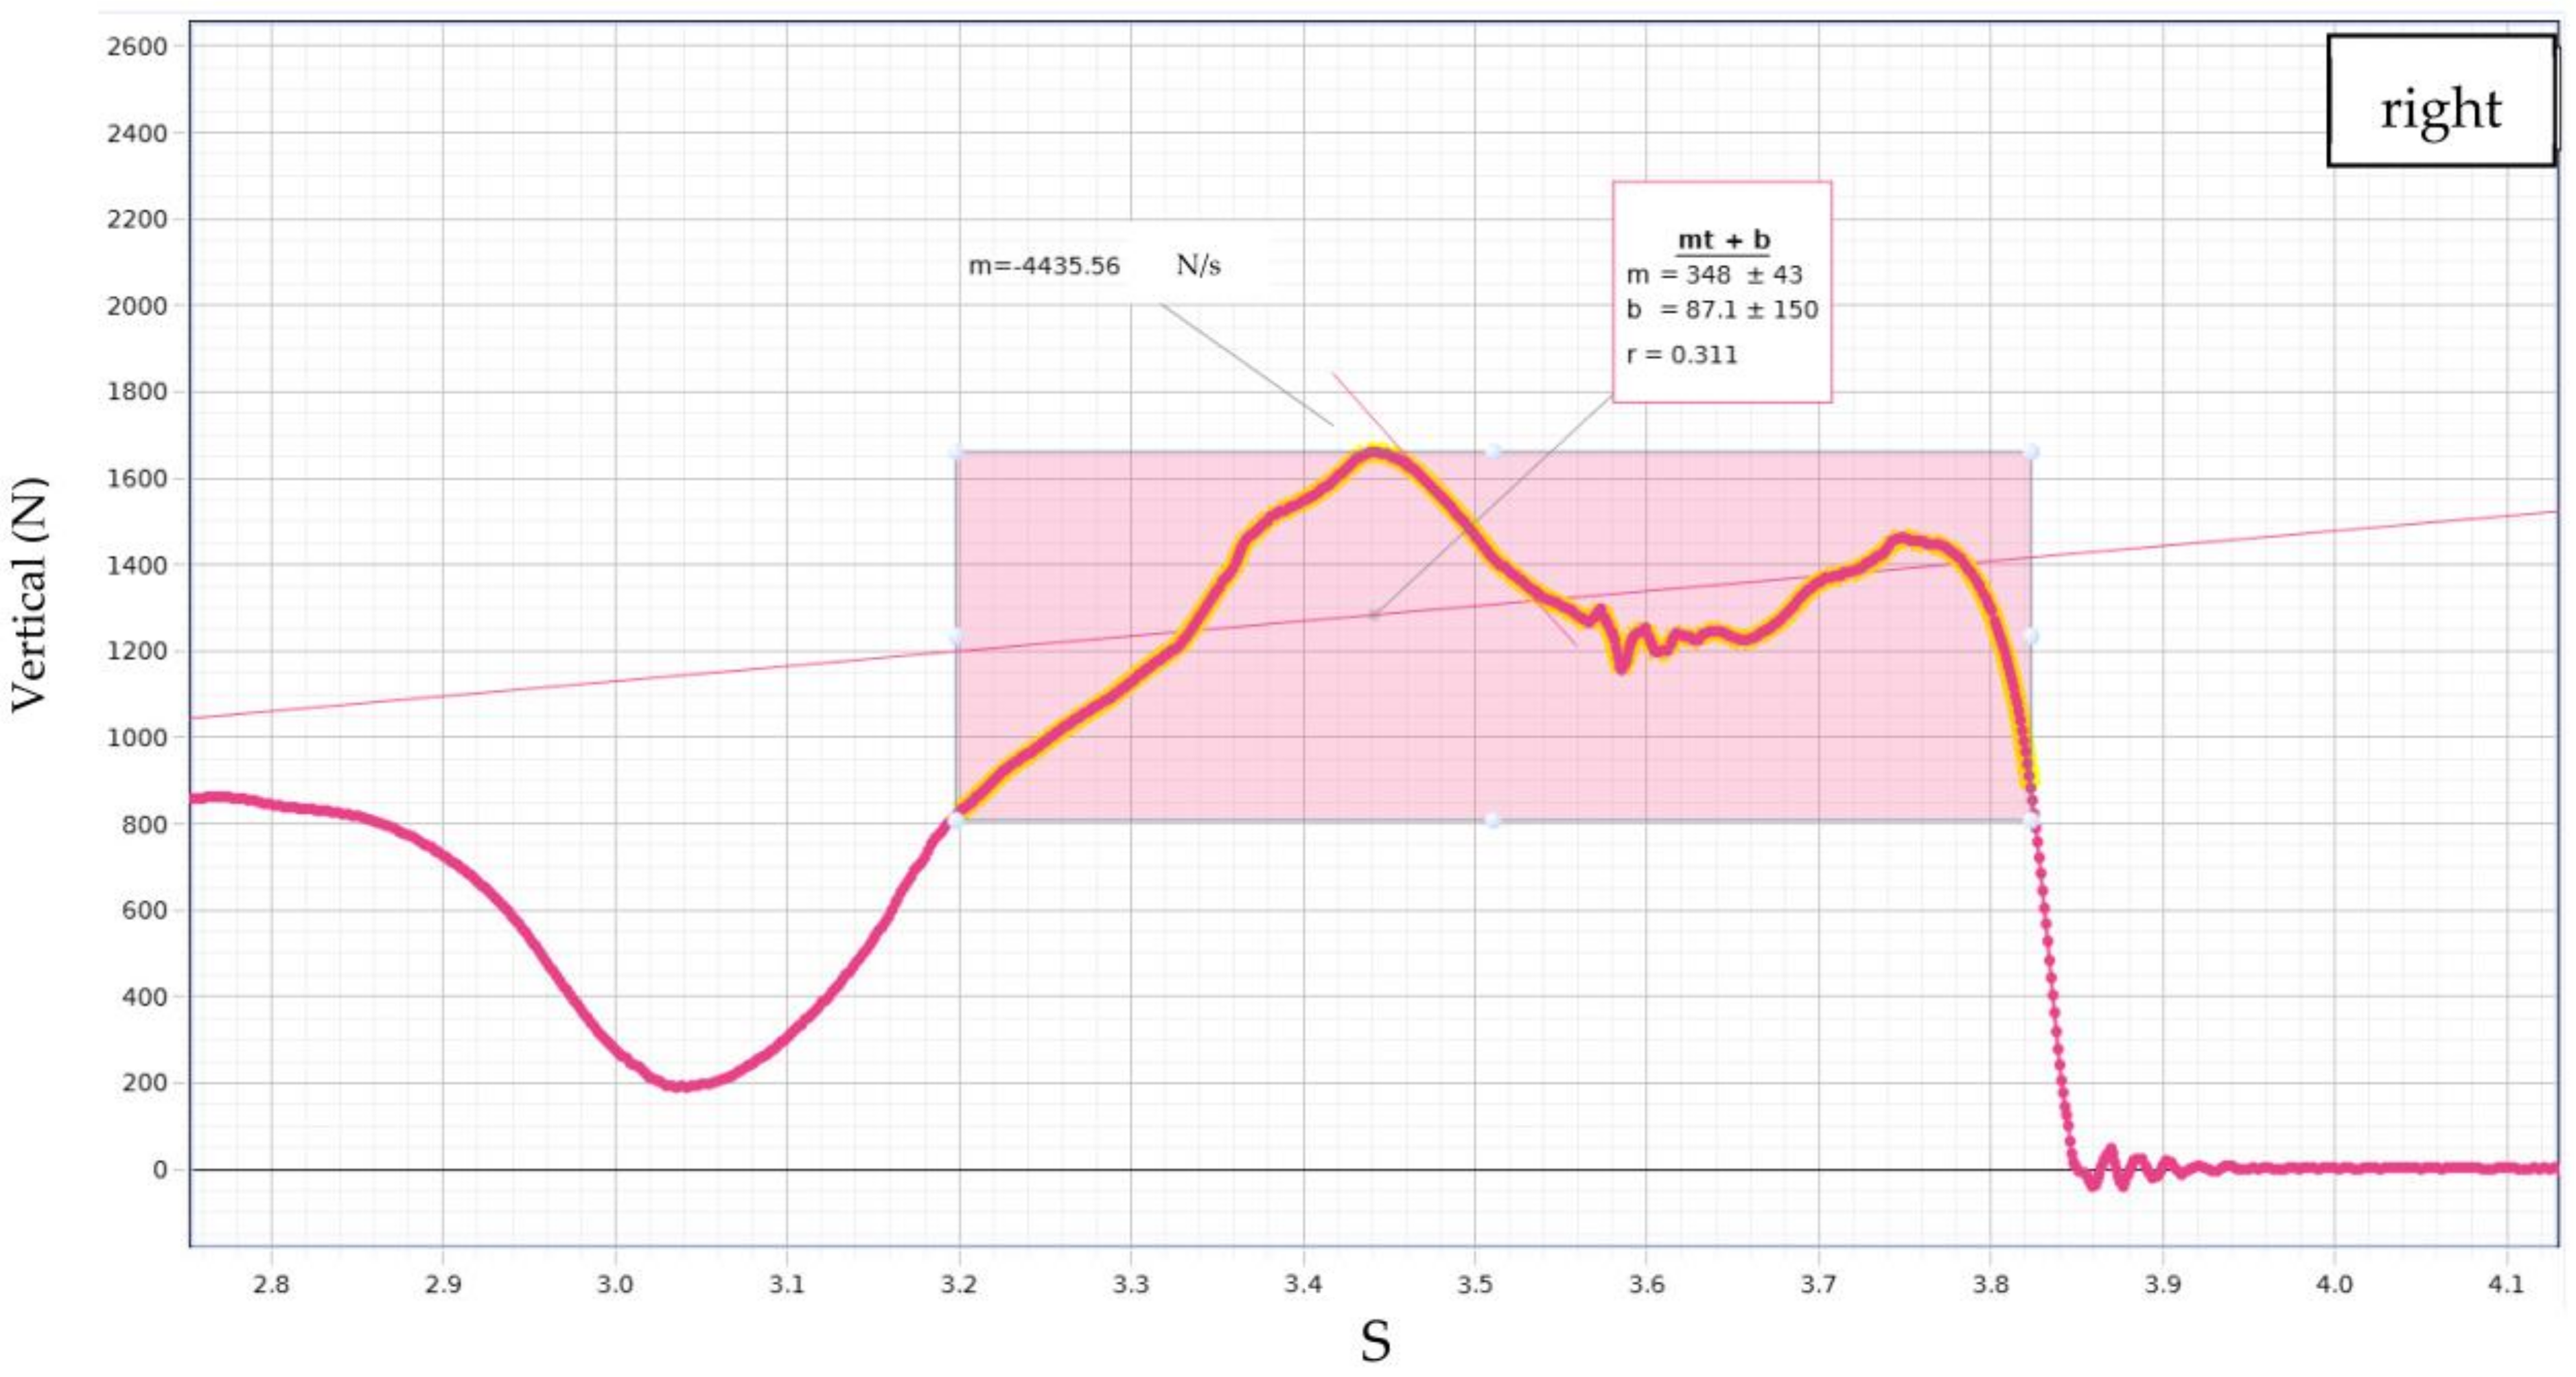
3.2. Dynamic Analysis of Lateral Jump

An analysis was conducted on the kinetic parameters of the lateral jumps in the pre-test and post-test, including the jump distance, the ground reaction force of the left and right foot (GRF of left and right), the vertical ground reaction force (V-GRF), the resultant ground reaction force (R-GRF), and the trajectory at the peak resultant force (T-PRF). After 12 weeks of the ASTP, the post-test results of all parameters of the experimental group were better than the pre-test results of the experimental group and the pre-test results of the control group, and the two-factor mixed variance analysis results showed that the F-values of each parameter were significantly different (p < 0.05), as shown in Table 3. Lateral jumps were detected four times, as shown in Figure 1. Each time a participant jumped, from take-off to landing and from landing to take-off, it took about 1 s. As shown in Figure 2, for list No. 7 of the participants of the experimental group, the time from the third landing of the right foot to take-off was 0.98 s (7.363 s to 8.343 s), with a total energy conversion of 4658.84 N, and angle of the T-PRF was 62.4°.
The V-GRF on the back of the participants was lower than the R-GRF, indicating that the participants distributed force into a horizontal force. The T-PRF angle was between 60.7° and 68.6°. For example, experimental group member No. 7’s right foot jumped 60.7° laterally and showed the best jumping distance (1.78 m). In addition, the comparison of the V-GRF and R-GRF between the experimental group and the control group shows that during a lateral jump, the vertical component force required was higher than the lateral component force. The above results confirm that 12 weeks of the ASTP significantly improved the lateral jumping ability of the experimental group of elite male basketball players. This confirms Hypothesis 1: 12 weeks of an ASTP can improve the lateral jumping ability of elite basketball players.

3.3. Dynamic Analysis of Vertical Jump

An analysis was conducted on the kinetic parameters of the vertical jumps in the pre-test and post-test, including the RFD, the time of the RFD, the instantaneous take-off GRF, the duration of passage, and the jump height. After 12 weeks of the ASTP, the post-test results of all parameters of the experimental group were better than the pre-test results of the experimental group and the pre-test results of the control group, and the two-way mixed ANOVA results showed that the F-values of each parameter were significantly different (p < 0.05), as shown in Table 4. This article only lists the specific results of experimental group member 7, as shown in Figure 3 and Figure 4.
The number of seconds from the moment all participants’ feet touched the ground to the moment when their feet left the ground and took off refers to the time spent on the RFD. It was found that the experimental group spent fewer seconds on this in the post-test, indicating a faster take-off speed. In terms of the GRF of instant take-off, due to the different weights and muscle strengths of the participants, the GRF generated was very different. Generally, those who were heavier had a larger GRF. In terms of the duration of passage, the participants released the maximum force from the rapid squat movement (the reaction force generated by instant knee-bending, arm-swinging, and take-off). The body was upright (the lower limbs were not bent) both in the air and at the moment of landing. Group member number 7 had the longest duration of passage. In terms of jump height, the average jump height of the experimental group in the post-test was better than that of the experimental group in the pre-test and the control group. Among them, No. 7 was the most outstanding, jumping on the spot to a height of 0.629 m. The above results confirm Hypothesis 2: a 12-week ASTP can improve the vertical explosive power of elite basketball players.

3.4. Analysis of the Difference between Horizontal and Vertical Jumps

This study analyzed the difference between horizontal and vertical jumps, including comparisons of the GRF, jump distance and height, and jump angle. The results showed that all related parameters reached significant differences. This study only lists the post-test results of the experimental group for analysis, as shown in Table 5. The GRF of a participant’s vertical jump was higher than that of their lateral jump, and the lateral jump distance was higher than the vertical jump height. However, the vertical jump was based on a 90-degree angle, and the horizontal jump was based on the optimal jump range of 60.8–68.6 degrees for the take-off foot.

4. Discussion

The axial stability training program (ASTP) is a training method widely used to improve core strength and help develop distal limb strength [29]. The purpose of this study was to use 12 weeks of the ASTP to conduct a kinetic analysis of the lateral and vertical jumps of college basketball players and to determine the differences between the two types of jumps. The use of dual-track force measuring plates allowed for a clear understanding of the RFD of the left and the right foot, the relationship between force and time, the duration of passage, and the lateral jump distance. With the use of dual-track force plates, it was found that lateral and vertical jumps are of great significance in the assessment of athletic performance.
First, this study used a 12-week ASTP intervention, which was found to be of great significance for training and evaluating the axial core and stabilizing the muscle groups of male college basketball players. The post-test data of lateral and vertical jumps in this study showed that the ASTP affected the activation of the abdominal and lower limb extensor muscles [30]. Moreover, the ASTP had a stabilizing effect on the muscles. This stability was produced by the activation of many highly coordinated muscles, as different jumping methods recruit different numbers of muscles [31]. A curve graph of the force plate results showed that the muscle strength of the participants’ lower limbs increased, the force exerted on the ground by jumping with the left and the right foot increased, and the reaction force obtained by both feet could instantly maintain stability and allow for the next jump to be continued. This study found that the ASTP was more effective for single-footed jumps. The lower limb muscle strength performance in lateral jumping was found to be of great significance in potentially enhancing the stability of the participants. This result is similar to that in some of the literature [25,26,31].
Various test data were found to be correlated through a dynamic analysis of the force plate evaluation of lateral jumps; the distance of stable jumps; and the V-GRF, R-GRF, and T-PRF of lateral jumps. This research found that the best lateral jump occurred at about a 61-degree angle, which could also achieve the best distance. In addition, the higher the V-GRF of the lateral jump, the greater the T-PRF of the take-off foot, but the shorter the jump distance. There was a negative correlation between the two, and this result is supported [5,32]. The θ value of the lateral T-PRF angle in this study ranged from 60.7° to 68.6°. Using the trigonometric function, it was found that the V-GRF output of all participants was greater than the lateral parallel force output, which provides the ideal ratio of vertical and lateral force generation; an angle closer to 60° helped to optimize jump distance, a result consistent with that of previous scholars’ research [33]. This analysis showed that, when dribbling quickly and moving one foot quickly left and right, if the angle of the left and the right foot is quickly changed to a small angle, a large lateral movement can be achieved to get rid of the opponent. However, when the angle of the force of the jumping foot is larger, that is, when the angle is closer to 90°, the take-off distance is smaller; this phenomenon is like that of a layup or grabbing a rebound. At this time, the distance to the left, right, or front is very small [34]. Muscle strength affects the distance and time required to produce GRF for jumping, and it also affects the stability of landing [35]. The research results show that the reaction forces of the left and the right foot were very similar regardless of the pre-test or post-test results, which may be due to the coordination of the hands and feet caused by the body’s arm swinging [36,37]. The lateral jump’s R-GRF had a direct relationship with the θ value. When the θ value was between 60.7° and 67.2°, the best lateral jump distance could be achieved [5,38,39]. In addition, an athlete’s weight and height may indirectly affect their jumping distance.
The results of the force plate evaluation revealed that the ASTP increased the participants’ ability to produce greater force when taking off, and the reaction force of the lower limbs on the ground increased significantly. The slope of the vertical jumps in the post-test ranged from −0.815 to −0.962; thus, the slope of all participants was steep and produced a centripetal output curve. This phenomenon also showed that there was a highly linear relationship between the changes in force and speed during jumping [40]. The time required by the participants in this study to produce force ranged from 0.116 to 0.220 s. These players could be called athletes with excellent explosive power. According to research by McMahon et al., it only takes 0.1 to 0.2 s for excellent athletes to generate an explosive force from the moment that their jumping foot touches the ground to the moment that their jumping foot leaves the ground [41]. Similar studies have also pointed out that there are better RFDs that can allow for faster and more explosive movements [14,42,43].
This study found that some participants’ GRF and RFD showed reverse linearity. This phenomenon shows that these three basketball players belong to the middle peak body, and their body weight and muscle mass were higher than those of the other participants. Their body weight affected the depth of their hip and knee joint squats and the vertical impulse when taking off; thus, they required more time to generate force, resulting in a decrease in the RFD [44]. Similarly, some studies have confirmed that the RFD is indicated by the slope of the force–time curve. The lower limbs could exert a greater force in a shorter period of time, which also shows that the number of muscle fibers determines the amount of force generated [45,46,47]. Some studies have pointed out that an excellent vertical jump is dominated by the hip joint. The muscle strength required by the hip joint was also the focus of the ASTP training in this study, because the hip extensor muscles have a higher correlation with the improvement of the vertical jump height than the knee extensor muscles [48]. In addition, the relationship between the RFD and explosive power will confuse players. The basis of explosive power is muscle strength, and explosive power is a manifestation of the RFD [14]. Explosive power is the ability to generate the most force in the shortest amount of time possible. From a biological perspective, the more fast-twitch muscle fibers there are and the thicker the cross-sectional area, the greater the speed force [6]. The formula is explosive power (P) = strength (F) × speed (V). In short, the RFD is related to instantaneous time, and explosive power is related to speed, so there is a gap between the two, and many scholars also hold the same view [9,42,49]. Although there is a gap between the two, according to the formula comparison, if the two run a 100 m race, the faster one takes less time, which proves that speed is inversely proportional to time. Therefore, there is a high correlation between the force generation rate (RFD = F ÷ time) and explosive power (P = F × V) [42]. Therefore, the RFD is often called explosive power, and the better the RFD, the steeper the kurtosis.
According to previous research, the average person’s muscle contraction takes about 1/2 s (0.5 s = 500 milliseconds) to reach the maximum RFD if the ground contact time of running is completed within 1/5 s (0.20 s = 200 milliseconds) [49]. Buckthorpe and Roi confirmed that the faster the speed, the shorter the ground contact time and the greater the force required. Therefore, the shorter the time required for the lower limbs to generate the RFD, the stronger the explosive power [50]. Number 7’s duration of passage reached 0.615 s, and his jump height reached 0.629 m. He performed best among all the participants, showing that the ASTP had some positive effects on improving explosive power. Because jumping movements rely on skeletal muscles such as those of the waist, hips, knees, and ankles to generate force [51], these muscle groups were also affected by the ASTP intervention in this study. Blache and Monteil’s research pointed out that the spine flexes when squatting, then the erector spinae muscles stretch during jumping, and the hip extensor muscles (the gluteus maximus, hamstrings, and adductors) separate the trunk and the thighs. The trunk is pushed upward and backward. At the same time, the knee extensor muscles (quadriceps) contract to extend the knee joint, and the calf muscles contract to move the tibia backward in the vertical direction [52,53]. These are the most important muscles when jumping, and they were also the muscle groups trained by the ASTP. Some believed that the exercise was dominated by the glutes and quadriceps, while others believed the hamstrings, quadriceps, and calf muscles were key. However, the results of the ASTP training showed the strengthening of the muscle groups around the spine [54], especially the hip extensors, which are important muscle groups for improving vertical jump height. The ASTP results in this study show that, during training, the required motor units were recruited, and the activity of the motor nerves was stimulated to quickly reach the maximum force and enhance the RFD, the duration of passage, and the jump height of the bounce. This phenomenon could be explained by the fact that the muscle contraction before take-off allows the muscles to generate the energy required for movement. This energy is temporarily stored in the molecules of muscle cells with continuous elasticity. The speed and time of muscle contraction determine the amount of movement produced. The strength will make the muscles more explosive [42,55]. Muscle contraction is due to the rapid reflex action of the spinal nerves, which results in muscle stimulation, increasing contraction to generate force and obtain a better jumping height [56].
By comparing the experimental results of the lateral and vertical jumps, it was found that the commonality was vertical force. The main differences were in the quality of the leg reaction force, the jump distance and height, the angle of take-off, etc. The data showed that the reaction force was positively correlated with the take-off angle and that the jump distance was negatively correlated with the take-off angle. Moreover, the peak ground reaction forces of the lateral and vertical jumps were important predictors of jump distance and height [5,13]. This study determined the angle between the jump and the ground reaction force, which can be used to monitor an athlete’s take-off point and jump distance. It also emphasizes the importance of using dual-track force plates to evaluate basketball players’ performance. In addition, the ASTP method includes the upper back muscles, abdominal muscles, and hip muscles, and these belong to the muscle groups around the spine. Therefore, these muscle groups were strengthened and contributed to spinal stability. This result has also been confirmed by previous studies. Core stabilization exercises could strengthen muscle tissue, provide stability to the spine, and result in good sports performance [57]. The results of this study show that the jump height of the elite athletes increased. It is possible that the ASTP method helps to improve the hip muscle groups; indirectly affects the use of lower limb muscle strength; and directly affects the lean mass of the upper back, abdominal, and buttocks muscles. In addition, these muscles, which are connected around the spine, could stabilize the spine and help generate force in the distal limbs during exercise.
This study had the following limitations: The study participants consisted of elite male basketball players from a single institution, so our results may not be generalizable to all sports and athletic levels. In addition, factors such as the lateral jump distance and height, participant leg length, and flexibility may have potentially increased the participants’ jump distance, and the height and weight of the participants affected the performance of the take-off force rate or sharpness, which then affected the output of the jump force and height. When the participants performed a vertical jump from a force plate, both feet had to be straight when the vertical jump was in the air. If the knees were bent in the air, the time in the air would have been overestimated. Finally, further research should revise the ASTP strategy based on the characteristics of the different positions of basketball players (guard, forward, and center) to better suit them, strengthen specific muscle groups, and help achieve optimized lateral and vertical jump abilities.

5. Conclusions

This study draws the following conclusions: An ASTP is helpful in improving the physical fitness, lateral jump distance, lower limb lateral jump stability, vertical jump height, and lower limb vertical rate of force development of elite male basketball players. Moreover, basketball skills include the explosive power of dribbling the ball quickly left and right and jumping vertically in an instant. However, an ASTP can increase the strength of the axial muscle group, which helps the distal limbs to develop force and movement stability. When the core muscle mass increases, this can increase the lateral jump distance and the stability of instantaneous lateral movement, increase the vertical take-off force rate, and shorten bounce time, thereby enhancing explosive power. This study used an ASTP with changes in exercise intensity and focused on innovative training methods for healthy, male, elite athletes. In fact, the changing exercise intensity of an ASTP may help provide positive effects for adults, older adults, females, individuals undergoing medical rehabilitation, etc.; thus, ASTPs are worthy of subsequent clinical applications.

Author Contributions

Conceptualization, W.-Y.H., H.H. and C.-E.W.; methodology, W.-Y.H.; software, C.-E.W.; validation, H.H. and W.-Y.H.; formal analysis, W.-Y.H.; investigation, C.-E.W.; resources, W.-Y.H.; data curation, C.-E.W.; writing—original draft preparation, H.H. and W.-Y.H.; writing—review and editing, W.-Y.H. and C.-E.W.; supervision, H.H. and W.-Y.H.; project administration, W.-Y.H. and H.H. All authors have read and agreed to the published version of the manuscript.

Funding

The authors received no funding for any of the research relevant to the present study.

Institutional Review Board Statement

This study was conducted according to the guidelines of the Declaration of Helsinki and approved by a local Institutional Review Board (protocol code: C202305014).

Informed Consent Statement

Informed consent was obtained from all the participants in the study.

Data Availability Statement

Data on study participants were obtained before and after training. All authors confirm the authenticity and availability of the data. All datasets on which the paper’s conclusions are made are available to editors, reviewers, and readers.

Acknowledgments

The authors appreciate the fitness center of the National Taiwan College of Performing Arts for providing us with the opportunity and facility to investigate the research topic. Moreover, we thank all participants for actively participating in the experimental courses and following the independent exercises, and for reviewing the ethics-related details of this study at the Human Trials Review Meeting at Tri-Service General Hospital, National Defense Medical College.

Conflicts of Interest

The authors declare no conflicts of interest.

References

  1. Barbieri, D.; Zaccagni, L.; Babić, V.; Rakovac, M.; Mišigoj-Duraković, M.; Gualdi, E. Body composition and size in sprint athletes. J. Sports Med. Phys. Fit. 2017, 57, 1142–1146. [Google Scholar] [CrossRef]
  2. Franchini, E.; Cormack, S.; Takito, M.Y. Effects of High-Intensity Interval Training on Olympic Combat Sports Athletes’ Performance and Physiological Adaptation: A Systematic Review. J. Strength Cond. Res. 2019, 33, 242–252. [Google Scholar] [CrossRef]
  3. Ramirez-Campillo, R.; Garcia de Alcaraz, A.; Chaabene, H.; Moran, J.; Negra, Y.; Granacher, U. Effects of Plyometric Jump Training on Physical Fitness in Amateur and Professional Volleyball: A Meta-Analysis. Front. Physiol. 2021, 12, 636140. [Google Scholar] [CrossRef]
  4. Sáez de Villarreal, E.; Molina, J.G.; de Castro-Maqueda, G.; Gutiérrez-Manzanedo, J.V. Effects of Plyometric, Strength and Change of Direction Training on High-School Basketball Player’s Physical Fitness. J. Hum. Kinet. 2021, 78, 175–186. [Google Scholar] [CrossRef]
  5. Reiter, C.R.; Killelea, C.; Faherty, M.S.; Zerega, R.J.; Westwood, C.; Sell, T.C. Force-plate derived predictors of lateral jump performance in NCAA Division-I men’s basketball players. PLoS ONE 2023, 18, e0284883. [Google Scholar] [CrossRef]
  6. Aksović, N.; Bjelica, B.; Milanović, F.; Milanović Lalović, L.; Jovanović, N. Development of Explosive Power in Basketball Players. Turk. J. Kinesiol. 2021, 7, 44–52. [Google Scholar] [CrossRef]
  7. Panjabi, M.M. The stabilizing system of the spine. Part I. Function, dysfunction, adaptation, and enhancement. J. Spinal Disord. 1992, 5, 383–389; discussion 397. [Google Scholar] [CrossRef]
  8. Panjabi, M.M. Clinical spinal instability and low back pain. J. Electromyogr. Kinesiol. 2003, 13, 371–379. [Google Scholar] [CrossRef]
  9. Zemková, E. Strength and Power-Related Measures in Assessing Core Muscle Performance in Sport and Rehabilitation. Front. Physiol. 2022, 13, 861582. [Google Scholar] [CrossRef]
  10. Lee, B.; McGill, S. The effect of core training on distal limb performance during ballistic strike manoeuvres. J. Sports Sci. 2017, 35, 1768–1780. [Google Scholar] [CrossRef]
  11. Arora, C.; Singh, P.; Varghese, V. Biomechanics of core musculature on upper extremity performance in basketball players. J. Bodyw. Mov. Ther. 2021, 27, 127–133. [Google Scholar] [CrossRef]
  12. Luo, S.; Soh, K.G.; Soh, K.L.; Sun, H.; Nasiruddin, N.J.M.; Du, C.; Zhai, X. Effect of Core Training on Skill Performance Among Athletes: A Systematic Review. Front. Physiol. 2022, 13, 915259. [Google Scholar] [CrossRef]
  13. Donahue, P.T.; Wilson, S.J.; Williams, C.C.; Hill, C.M.; Garner, J.C. Comparison of Countermovement and Squat Jumps Performance in Recreationally Trained Males. Int. J. Exerc. Sci. 2021, 14, 462–472. [Google Scholar]
  14. Sugiyama, K.; Fuchioka, S.; Kimura, Y.; Iwata, A.; Nakata, K.; Mae, T. The ability to produce a timely explosive force may affect loading rate at landing. Sport Sci. Health 2023, 19, 1163–1168. [Google Scholar] [CrossRef]
  15. van Lopik, K.; Philpott, L.; Forrester, S.; Hayward, S.; West, A.; Conway, P. Countermovement jump performance in elite male and female sprinters and high jumpers. Proc. Inst. Mech. Eng. Part P J. Sports Eng. Technol. 2020, 235, 131–138. [Google Scholar] [CrossRef]
  16. Molla, R.Y.; Fatahi, A.; Khezri, D.; Ceylan, H.I.; Nobari, H. Relationship between impulse and kinetic variables during jumping and landing in volleyball players. BMC Musculoskelet. Disord. 2023, 24, 619. [Google Scholar] [CrossRef]
  17. Moeskops, S.; Pedley, J.S.; Oliver, J.L.; Lloyd, R.S. The Influence of Competitive Level on Stretch-Shortening Cycle Function in Young Female Gymnasts. Sports 2022, 10, 107. [Google Scholar] [CrossRef]
  18. Petrigna, L.; Karsten, B.; Marcolin, G.; Paoli, A.; D’Antona, G.; Palma, A.; Bianco, A. A Review of Countermovement and Squat Jump Testing Methods in the Context of Public Health Examination in Adolescence: Reliability and Feasibility of Current Testing Procedures. Front. Physiol. 2019, 10, 1384. [Google Scholar] [CrossRef]
  19. Jimenez-Reyes, P.; Samozino, P.; García Ramos, A.; Cuadrado, V.; Brughelli, M.; Morin, J.-B. Relationship between vertical and horizontal force-velocity-power profiles in various sports and levels of practice. PeerJ 2018, 6, e5937. [Google Scholar] [CrossRef]
  20. Reichardt, C.S.; Little, T.D. Quasi-Experimentation: A Guide to Design and Analysis; The Guilford Press: New York, NY, USA, 2019. [Google Scholar]
  21. Gay, L.R. Educational Research Competencies for Analysis and Application; Macmillan: New York, NY, USA, 1992. [Google Scholar]
  22. Sasaki, S.; Tsuda, E.; Yamamoto, Y.; Maeda, S.; Kimura, Y.; Fujita, Y.; Ishibashi, Y. Core-Muscle Training and Neuromuscular Control of the Lower Limb and Trunk. J. Athl. Train. 2019, 54, 959–969. [Google Scholar] [CrossRef]
  23. Li, K.; Cardoso, C.; Moctezuma-Ramirez, A.; Elgalad, A.; Perin, E. Heart Rate Variability Measurement through a Smart Wearable Device: Another Breakthrough for Personal Health Monitoring? Int. J. Environ. Res. Public Health 2023, 20, 7146. [Google Scholar] [CrossRef]
  24. Lee, C.H.; Sun, T.L. Evaluation of postural stability based on a force plate and inertial sensor during static balance measurements. J. Physiol. Anthropol. 2018, 37, 27. [Google Scholar] [CrossRef]
  25. Sannicandro, I.; Cofano, G.; Piccinno, A. Can the Core Stability Training Influences Sprint and Jump Performances in Young Basketball Players? Adv. Phys. Educ. 2020, 10, 196–206. [Google Scholar] [CrossRef]
  26. Fatahi, F.; Ghasemi, G.; Karimi, M.; Beyranvand, R. The effect of eight weeks of core stability training on the lower extremity joints moment during single-leg drop landing article. Balt. J. Health Phys. Act. 2019, 11, 34–44. [Google Scholar] [CrossRef]
  27. Ardakani, M.K.; Wikstrom, E.A.; Minoonejad, H.; Rajabi, R.; Sharifnezhad, A. Hop-Stabilization Training and Landing Biomechanics in Athletes With Chronic Ankle Instability: A Randomized Controlled Trial. J. Athl. Train. 2019, 54, 1296–1303. [Google Scholar] [CrossRef]
  28. Lee, J.; Wang, L.; Zhang, X. Exploring the relationship between core stability and vertical jump in recreationally active male college students based on a suite of novel core stability assessments. Heliyon 2024, 10, e25236. [Google Scholar] [CrossRef]
  29. Jha, P.; Nuhmani, S.; Kapoor, G.; Al Muslem, W.H.; Joseph, R.; Kachanathu, S.J.; Alsaadi, S.M. Efficacy of core stability training on upper extremity performance in collegiate athletes. J. Musculoskelet. Neuronal Interact. 2022, 22, 498–503. [Google Scholar]
  30. Quirk, D.A.; Trudel, R.D.; Hubley-Kozey, C.L. Trunk Muscle Activation Patterns Differ Between Those With Low and High Back Extensor Strength During a Controlled Dynamic Task. Front. Sports Act Living 2019, 1, 67. [Google Scholar] [CrossRef]
  31. Gaamouri, N.; Hammami, M.; Cherni, Y.; Oranchuk, D.J.; Bragazzi, N.; Knechtle, B.; Chelly, M.S.; van den Tillaar, R. The effects of upper and lower limb elastic band training on the change of direction, jump, power, strength and repeated sprint ability performance in adolescent female handball players. Front Sports Act. Living 2023, 5, 1021757. [Google Scholar] [CrossRef]
  32. Pilanthananond, M.; Tharawadeepimuk, K.; Saengsirisuwan, V.; Limroongreungrat, W. Muscle Activation and Ground Reaction Force between Single-Leg Drop Landing and Jump Landing among Young Females during Weight-Acceptance Phase. Sports 2023, 11, 185. [Google Scholar] [CrossRef]
  33. Fitzpatrick, D.A.; Cimadoro, G.; Cleather, D.J. The Magical Horizontal Force Muscle? A Preliminary Study Examining the “Force-Vector” Theory. Sports 2019, 7, 30. [Google Scholar] [CrossRef]
  34. Pérez-Castilla, A.; Rojas, F.J.; Gómez-Martínez, F.; García-Ramos, A. Vertical jump performance is affected by the velocity and depth of the countermovement. Sports Biomech. 2021, 20, 1015–1030. [Google Scholar] [CrossRef]
  35. Ignatjeva, A. Effect of training load on lower limb power and jumping ability of professional soccer players. World J. Adv. Res. Rev. 2023, 20, 1376–1386. [Google Scholar] [CrossRef]
  36. Ashby, B.M.; Sohel, A.A.; Alderink, G.J. Effect of arm motion on standing lateral jumps. J. Biomech. 2019, 96, 109339. [Google Scholar] [CrossRef]
  37. Lee, J.; Lee, Y. Biomechanical Analysis of the Coordinated Movements of the Therapist’s Hands and Feet during Lumbopelvic Manipulation: A Preliminary Study. Healthcare 2023, 11, 3023. [Google Scholar] [CrossRef]
  38. Aizawa, J.; Ohji, S.; Koga, H.; Masuda, T.; Yagishita, K. Correlations between sagittal plane kinematics and landing impact force during single-leg lateral jump-landings. J. Phys. Ther. Sci. 2016, 28, 2316–2321. [Google Scholar] [CrossRef]
  39. Hung, C.L.; Hung, M.H.; Chang, C.Y.; Wang, H.H.; Ho, C.S.; Lin, K.C. Influences of Lateral Jump Smash Actions in Different Situations on the Lower Extremity Load of Badminton Players. J. Sports Sci. Med. 2020, 19, 264–270. [Google Scholar]
  40. García-Ramos, A.; Feriche, B.; Pérez-Castilla, A.; Padial, P.; Jaric, S. Assessment of leg muscles mechanical capacities: Which jump, loading, and variable type provide the most reliable outcomes? Eur. J. Sport Sci. 2017, 17, 690–698. [Google Scholar] [CrossRef]
  41. McMahon, J.; Suchomel, T.; Lake, J.; Comfort, P. Understanding the Key Phases of the Countermovement Jump Force-Time Curve. Strength Cond. J. 2018, 40, 96–106. [Google Scholar] [CrossRef]
  42. Maffiuletti, N.A.; Aagaard, P.; Blazevich, A.J.; Folland, J.; Tillin, N.; Duchateau, J. Rate of force development: Physiological and methodological considerations. Eur. J. Appl. Physiol. 2016, 116, 1091–1116. [Google Scholar] [CrossRef]
  43. Vural, F.; Erman, B.; Ozkol, M.; Akşit, T. The Relationship Between the Force Production in the Isometric Squat and Bench Press Exercises and the Lower and Upper Body Anaerobic Power Parameters. Spor Bilim. Araştırmaları Derg. 2023, 8, 293–305. [Google Scholar] [CrossRef]
  44. Matijevich, E.S.; Branscombe, L.M.; Scott, L.R.; Zelik, K.E. Ground reaction force metrics are not strongly correlated with tibial bone load when running across speeds and slopes: Implications for science, sport and wearable tech. PLoS ONE 2019, 14, e0210000. [Google Scholar] [CrossRef]
  45. Weidmann, A.; Taetz, B.; Andres, M.; Laufer, F.; Bleser, G. Force Shadows: An Online Method to Estimate and Distribute Vertical Ground Reaction Forces from Kinematic Data. Sensors 2020, 20, 5709. [Google Scholar] [CrossRef]
  46. Leblanc, M.; Burdullis, A.; McKinnon, M.; Hawkins, S. Relationship Between Ground Reaction Force Characteristics and Bone Mineral Density of the Hip and Spine in Male Runners. Int. J. Exerc. Sci. 2022, 15, 655–666. [Google Scholar]
  47. Makino, A.; Yamaguchi, K.; Sumi, D.; Ichikawa, M.; Ohno, M.; Nagano, A.; Goto, K. Ground reaction force and electromyograms of lower limb muscles during fast walking. Front. Sports Act. Living 2022, 4, 1055302. [Google Scholar] [CrossRef]
  48. Seki, K.; Nagano, T.; Aoyama, K.; Morioka, Y. Squat and Countermovement Vertical Jump Dynamics Using Knee Dominant or Hip Dominant Strategies. J. Hum. Kinet. 2023, 86, 63–71. [Google Scholar] [CrossRef]
  49. Ide, B.; Silvatti, A.; Staunton, C.; Marocolo, M.; Oranchuk, D.; Mota, G.; Ide; Silvatti, A.; Staunton, C. Explosive is not a Term Defined in the International System of Units and Should not be Used to Describe Neuromuscular Performance. Int. J. Strength Cond. 2023, 3, 1. [Google Scholar] [CrossRef]
  50. Buckthorpe, M.; Roi, G.S. The time has come to incorporate a greater focus on rate of force development training in the sports injury rehabilitation process. Muscles Ligaments Tendons J. 2017, 7, 435–441. [Google Scholar] [CrossRef]
  51. Farris, D.; Lichtwark, G.; Brown, N.; Cresswell, A. The role of human ankle plantar flexor muscle-tendon interaction & architecture in maximal vertical jumping examined in vivo. J. Exp. Biol. 2015, 219, 528–534. [Google Scholar] [CrossRef]
  52. Blache, Y.; Monteil, K. Influence of lumbar spine extension on vertical jump height during maximal squat jumping. J. Sports Sci. 2014, 32, 642–651. [Google Scholar] [CrossRef]
  53. Blache, Y.; Monteil, K. Effects of spine flexion and erector spinae maximal force on vertical squat jump height: A computational simulation study. Sports Biomech. 2015, 14, 81–94. [Google Scholar] [CrossRef] [PubMed]
  54. Gallego-Izquierdo, T.; Vidal-Aragón, G.; Calderón-Corrales, P.; Acuña, Á.; Achalandabaso, A.; Aibar, A.; Martínez-Amat, A.; Pecos-Martin, D. Effects of a Gluteal Muscles Specific Exercise Program on the Vertical Jump. Int. J. Environ. Res. Public Health 2020, 17, 5383. [Google Scholar] [CrossRef] [PubMed]
  55. Van Hooren, B.; Zolotarjova, J. The Difference Between Countermovement and Squat Jump Performances: A Review of Underlying Mechanisms With Practical Applications. J. Strength Cond. Res. 2017, 31, 2011–2020. [Google Scholar] [CrossRef] [PubMed]
  56. Min, K.E.; Lee, Y.; Park, J. Changes in Spinal-Reflex Excitability during Static Stretch and/or Explosive Contraction. Appl. Sci. 2021, 11, 2830. [Google Scholar] [CrossRef]
  57. Smrcina, Z.; Woelfel, S.; Burcal, C. A Systematic Review of the Effectiveness of Core Stability Exercises in Patients with Non-Specific Low Back Pain. Int. J. Sports Phys. Ther. 2022, 17, 766–774. [Google Scholar] [CrossRef]
Figure 1. The GRF of lateral jumps with the left and the right foot. Note: The picture above shows the left foot (the take−off foot), the picture below shows the right foot. The vertical axis shows the ground reaction force (GRF), and the horizontal axis shows the seconds.
Applsci 14 04832 g001
Figure 2. A GRF diagram of a horizontal jump off the right foot. Note: Continuous horizontal jumps from the left and the right foot, from the third time the right foot lands on the ground to take-off, took 7.363 s to 8.343 s.
Applsci 14 04832 g002
Figure 3. The left foot and GRF of No. 7. (pre-test).
Applsci 14 04832 g003
Figure 4. The right foot and GRF of No. 7 (post-test).
Applsci 14 04832 g004
Table 1. The ASTP administered to participants.
CourseReps/RoundTraining Focus
Warm-up-Warm up with 10 min of aerobic exercise.
V crunch10/16/21–3/3Slowly lift your legs to an extended position at a 45-degree angle with your torso. Hold this V-shaped position for 1 min to begin.
Hyperextension10/16/21–3/3Setup in a hyperextension machine with your feet anchored and torso roughly perpendicular to your legs at a 45-degree angle. Begin in a hinged position with your arms crossed and initiate the movement by flexing your glutes. Extend the hips and finish with your body in a straight line. Repeat for the desired number of repetitions.
Bent over dumbbell reverse fly 10/16/21–3/3Stand with feet shoulder-width apart, holding dumbbells at your sides. Press the hips back in a hinge motion, bringing your chest forward and almost parallel to the floor. Let the weights hang straight down (palms facing each other) while maintaining a tight core, straight back, and slight knee bend.
Contralateral superman10/16/21–3/3Raise your left arm and shoulder and right leg off the floor. Lower your arm, shoulder, and leg to the floor. Repeat by raising and lowering the right arm, shoulder, and left leg. Repeat by alternating between opposite sides.
Bird dog10/16/21–3/3With your hands under your shoulders and knees under your hips, extend your right leg behind you. At the same time, reach your left arm out in front, parallel to the ground. Hold for one minute, then repeat on the other side.
Deadlift10/16/21–3/3Lift the weight from the ground to thigh level using primarily your leg and hip muscles.
Seated cable row10/16/21–3/3The seated cable row develops the muscles of the back and the forearms. The pulldown exercise works the back muscles.
Triceps pushdown10/16/21–3/3The triceps pushdown is one of the best exercises for the triceps’ development.
Lat pulldown10/16/21–3/3The pulldown exercise works the back muscles.
Overhead press10/16/21–3/3It can be done in either a sitting or a standing position, and with dumbbells held horizontally at the shoulders or rotated in a hammer grip (8 kg, 10 kg, 12 kg).
Kettlebell walk3/12/21/3Hold a kettlebell in each hand and walk 10 m back and forth (8 kg, 10 kg, 12 kg).
Cool-down- Muscle relaxation can use roller stretching or static stretching.
The first round was at 70% strength, the second round was 80% strength, and the third round was at the personal maximum strength or 100% strength. The denominator represents the round, and the numerator represents the repetition.
Table 2. Participant homogeneity analysis.
VariableEG (n = 15)
M ± SD
CG (n = 15)
M ± SD
t-Valuep-Value
Age (years)22.68 ± 1.1922.63 ± 1.510.1820.858
Height (cm)188.09 ± 6.64188.14 ± 6.54−0.0560.956
Weight (kg)85.68 ± 9.1385.74 ± 7.70−0.0640.950
Basketball experience (years)10.31 ± 1.4510.35 ± 1.47−0.0950.926
EG means experimental group, CG means control group. Means ± standard deviations were presented as M ± SD. t-test value was presented as t-value (p-value). p < 0.05.
Table 3. Analysis of the dynamic parameters of lateral jumps.
ParametersEG (n = 15)
M ± SD
CG (n = 15)
M ± SD
F-Valuep-Value
JD (m)
Pre1.455 ± 0.1331.455 ± 0.1072403.13 *0.000
Post1.524 ± 0.1391.457 ± 0.099
AVG. GRF (N)
L-Pre3572 ± 371743 ± 98919.26 *0.000
L-Post740 ± 93740 ± 90
R-Pre788 ± 105745 ± 96958.07 *0.000
R-Post789 ± 103742 ± 85
AVG. V-GRF (N)
Pre3296 ± 3823286 ± 3641178.21 *0.000
Post3410 ± 4333295 ± 341
AVG. R-GRF (N)
Pre3571 ± 4013567 ± 3751269.43 *0.000
Post3690 ± 4363571 ± 363
AVG. T-PRF (θ)
L-Pre66.78 ± 2.0966.74 ± 2.1248,732.10 *0.000
L-Post66.77 ± 2.0866.79 ± 2.34
R-Pre65.51 ± 2.2266.29 ± 1.7544,547.81 *0.000
R-Post64.90 ± 2.1966.76 ± 2.12
EG means experimental group, CG means control group. Jump distance (m) abbreviation: JD (m), average ground reaction force of the left and the right foot (N) abbreviation: AVG. GRF of left and right (N), average vertical ground reaction force (N) abbreviation: AVG. V-GRF (N), average resultant ground reaction force (N) abbreviation: AVG. R-GRF (N), average trajectory at peak resultant force (Deg.) abbreviation: AVG. T-PRF (θ). Means ± standard deviations are presented as M ± SD. F-test values are presented as F-values (p-value). * p < 0.05.
Table 4. Analysis of the kinetic parameters of vertical jumps.
ParametersEG (n = 15)
M ± SD
CG (n = 15)
M ± SD
F-Valuep-Value
RFD(r)
Pre−0.884 ± 0.060−0.884 ± 0.05154002.18 *0.000
Post−0.907 ± 0.049−0.883 ± 0.0582
RFD(s)
Pre0.177 ± 0.0420.176 ± 0.041295.14 *0.000
Post0.163 ± 0.0400.175 ± 0.037
GRF of moment jump (N)
Pre1676 ± 1951676 ± 1741087.93 *0.000
Post1771 ± 2681672 ± 168
Duration of passage (s)
Pre0.529 ± 0.0550.406 ± 0.0871583.19 *0.000
Post0.571 ± 0.0530.528 ± 0.054
Jump height (m)
Pre0.405 ± 0.0870.404 ± 0.090327.21 *0.000
Post0.453 ± 0.0910.451 ± 0.086
EG means experimental group, CG means control group. The rate of force development, referred to as RFD (r), the ground reaction forces, referred to as GRFs (N), and the duration of passage (the unit second symbol is sec). Means ± standard deviations are presented as M ± SD. F-test values are presented as F-values (p-value). * p < 0.05.
Table 5. Analysis of the differences between lateral and vertical jumps.
nLateral JumpVertical JumpLateral JumpVertical JumpLateral JumpVertical Jump
GRF (N)GRF (N)Jump DistanceJump HeightAVG. (θ)(θ)
1143116141.450.48965.190
2164417061.480.47966.690
3158116631.460.50666.890
4141015911.450.55765.890
5158716751.550.45765.790
6175718531.720.48261.290
7170118121.780.62960.890
8152816241.580.51166.690
9133615651.570.46466.790
10133215541.760.50167.390
11187122691.440.36464.190
12184721171.410.31363.890
13192423731.380.29568.690
14134415791.310.30165.290
15137115781.520.45364.290
t = −6.554 * (0.000)t = 41.692 * (0.000)t = −44.574 * (0.000)
The GRF of the lateral jump is the sum of the reaction forces of the left and the right foot. AVG. θ. is the average angle of the lateral jump of the left and the right foot (post). The t-test value is presented as a t-value (p-value). * p < 0.05.
Disclaimer/Publisher’s Note: The statements, opinions and data contained in all publications are solely those of the individual author(s) and contributor(s) and not of MDPI and/or the editor(s). MDPI and/or the editor(s) disclaim responsibility for any injury to people or property resulting from any ideas, methods, instructions or products referred to in the content.

