Article

Enhancing Clay Soil’s Geotechnical Properties Utilizing Sintered Gypsum and Glass Powder

1
Civil Engineering Department, Near East University, Mersin 10, Lefkosa 99138, Turkey
2
Civil Engineering Program, Middle East Technical University Northern Cyprus Campus, Mersin 10, Guzelyurt 99738, Turkey
3
Civil Engineering Department, Aalto University, 02150 Espoo, Finland
4
Electrical and Electronic Engineering Department, Middle East Technical University Northern Cyprus Campus, Mersin 10, Kalkanli, Guzelyurt 99738, Turkey
*
Author to whom correspondence should be addressed.
Appl. Sci. 2024, 14(12), 4961; https://doi.org/10.3390/app14124961
Submission received: 27 April 2024 / Revised: 31 May 2024 / Accepted: 4 June 2024 / Published: 7 June 2024
(This article belongs to the Section Civil Engineering)

Abstract

:
The growing number of end-of-life (EoL) photovoltaic (PV) panels as waste materials is forcing many countries to face the challenge of addressing this issue. The presented research explores the utilization of a by-product of this waste material, namely glass powder, with gypsum in geotechnical engineering to improve clay-soil properties. The approach is to integrate these materials to address the sustainable management of EoL PV panels, an underutilized resource in geotechnical applications. Furthermore, the study extensively examines the physical properties of clay soil, gypsum, and glass powder. Composite samples are created by adjusting the proportions of gypsum (0%, 5%, 10%, and 15%) and glass powder (0%, 4%, 8%, and 12%) relative to the soil’s dry mass. Compaction processes are performed at dry densities of 1500 and 1700 kg/m3, with 7, 28, and 56 days of curing duration. Various tests, including ultrasonic pulse velocity (UPV), unconfined compressive strength (UCS), assessments of wet and dry cycle durability, scanning electron microscope (SEM) analyses, and X-ray diffraction (XRD) analyses, are conducted. The results reveal that gypsum consistently improves the soil’s strength and stiffness features, while initially adding glass powder reduces these properties before showing improvement at a 12% content. Correlations have been proposed to determine the unconfined compressive strength (qu), initial shear modulus (G0), and modulus of elasticity (E) to be acquired utilizing just a single test. Moreover, a correlation has been developed to predict the unconfined compressive strength and elastic modulus of any specimen through non-destructive testing. Additionally, microstructural analyses unveil intricate interactions, showcasing the progress of pozzolanic reactions, identifying silicon-rich compounds from glass powder, and elucidating how additives transform soil structure.

1. Introduction

The continuous surge in solid-waste generation, driven by population expansion, urbanization, and economic growth, poses a mounting challenge regarding landfill management and recycling efforts. Indeed, waste management has become a paramount concern for researchers committed to sustainable environmental practices. In recent decades, geotechnical scientists have embarked on extensive investigations to restrain the production of diverse waste materials across the globe by integrating them into geotechnical applications, including pavement construction, retaining walls, and foundation structures. Among these increasing waste concerns is the disposal of PV panels at the end of their life cycle.
PV panels, widely renowned for their role in electricity generation and sustainable energy production, paradoxically contribute to the growing solid-waste issue upon reaching their end-of-life stage, often due to malfunctions or inefficacy [1]. Projections indicate that, by 2050, there will be a significant amount of PV-panel waste, estimated to be about 60 to 70 million tons [2,3]. These PV panels are primarily constructed from materials, such as silicon, glass, and metal, that possess recyclable attributes, albeit hindered by the limited global availability of a recycling infrastructure. Furthermore, PV panels consist of dangerous substances, posing significant threats to both human well-being and the natural surroundings [4,5,6,7,8]. These hazardous components, including selenide (Se), copper indium gallium selenide (CIGS) with cadmium (Cd), lead (Pb), crystalline silicon (c-Si) with Pb, and cadmium telluride (CdTe) featuring Cd and Pb [9,10,11], have prompted extensive research to mitigate the production of PV-panel waste materials.
In response to more than two decades of large-scale PV panel deployment in various countries, particularly the United States and China, researchers have sought innovative solutions to decrease the environmental impact of PV-panel waste. This involves extending the longevity and resilience of PV panels through improved design and durability and enhancing the recycling processes to make them more accessible and cost-effective [12,13]. Notably, one critical facet of EoL PV panels is their glass shields, which have motivated the present study’s application of glass powder and sintered gypsum to improve the geotechnical properties of clay soil.
Gypsum, or calcium sulfate dihydrate (CaSO4·2H2O), enhances the unconfined compressive strength (UCS) of clay soils through chemical interactions that create cementitious bonds. However, its efficacy can vary in gypseous soils due to potential volumetric fluctuations from hydration and dehydration processes [14]. Additionally, sintered gypsum, produced by heating gypsum, exhibits pozzolanic properties that react with calcium hydroxide, Ca(OH)2, to form cement-like compounds, improving soil strength. Combining sintered gypsum with cement enhances the strength and stiffness features of stabilized clayey soil, and improvements in sulfate-rich soils are observed when cement and lime are used, benefiting from gypsum’s pozzolanic reactions. Effective soil stabilization with gypsum requires understanding its interactions with each soil type [15].
Recent decades have witnessed a surge in research focusing on the integration of modern waste materials, including glass powder, plastics, and electronic waste, into soil-enhancement strategies. Glass powder, a significant global waste commodity, is exemplified by India’s production of 2.48 million tons in 2019 alone [16]. This mechanical stabilization approach distinguishes itself from resource-intensive laboratory testing. Additionally, this method avoids environmental threats and inherently embodies sustainable waste management, offering an eco-friendly alternative to conventional landfill practices [17].
Incorporating waste materials into expansive soils has been the subject of numerous research projects that aim to enhance the expansive soil’s engineering properties while addressing their environmental impacts. These efforts have highlighted waste glass as a promising component for soil stabilization [18,19,20,21,22,23]. For instance, Canakci et al. [24] employed waste soda lime glass powder (WSLGP) to enhance clay soil across various concentrations (3%, 6%, 9%, and 12%), revealing an increase in UCS within the 3% to 6% range but a decline from 6% to 12%. Similarly, Hassnawi et al. [25] explored the impact of waste glass powder (at concentrations of 3%, 5%, 7%, and 9% by dry soil weight), concluding that 7% waste glass powder yielded the optimal results in CBR and UCS tests. The engineering properties of black cotton soil were studied by [26]. They found that adding 4% waste glass powder improved the UCS and CBR values, which indicate improved bearing capacity. Other percentages tested were 2%, 6%, and 8% by dry soil weight.
Noteworthy is the contrast with previous studies, which primarily focused on RG (recycled glass) powder at concentrations of up to 10%. In the current investigation, the study offered to incorporate sand-size particles and elevate RG content to 40%, yielding a 30% reduction in the plasticity of mixtures. Furthermore, adding 25% RG led to a remarkable 45% increase in strength and an astonishing 130% surge in bearing capacity. In stark contrast, a mere 6% glass powder yielded a striking 100% strength enhancement and an impressive 200% boost in bearing capacity [27]. In addition, Ibrahim et al. [28] utilized glass powder for expansive clay soil, varying the concentrations (6%, 12%, 18%, 27%, and 36% of dry soil weight) and achieving a notable enhancement in UCS of up to 27% waste glass powder incorporation, subsequently reduced at 36%.
This study aims to explore additional applications of glass powder in geotechnical engineering. However, combining glass powder and sintered gypsum to enhance clay soil has barely been attempted. Moreover, the tempered glass from PV panels remains scarcely utilized within geotechnical engineering practices.
An innovative aspect of this investigation involves the utilization of EoL PV panels in geotechnical applications. This approach presents a novel idea that could address the disposal issue of EoL PV panels and their sustainable management.

2. Experiment Program

The experimental procedures commenced with a sieve analysis and an assessment of the physical characteristics of clay soil, gypsum, and glass powder. Examining the physical characteristics involved forming composite samples by incorporating gypsum at varying proportions (0%, 5%, 10%, and 15%) and glass powder at different ratios (0%, 4%, 8%, and 12%). These percentages were determined concerning the dry mass of the soil.
The compaction process for the samples entailed dry densities of 1500 and 1700 kg/m3, with 1700 kg/m3 representing the maximum dry density. The two intended dry densities were adopted to evaluate the effect of compaction on different blends. The samples were cured for 7, 28, and 56 days. In order to determine the specimens’ strength, initial shear modulus (G0), durability, uniaxial compression strength (UCS), ultrasonic pulse velocity (UPV), and wetting–drying cycle, durability tests were carried out. X-ray diffraction (XRD) analyses and scanning electron microscopy (SEM) were also performed to determine the microstructural transformations. Table 1 provides a comprehensive overview of the physical characteristics of clay soil, gypsum, and glass powder (GP) as essential additives in the experimental program.

2.1. Materials

2.1.1. Clay Soil

This investigation’s clay soil came from a 2 m deep hole dug in the northern part of Nicosia, in the center region of Cyprus. The chosen site lies within a river basin characterized by alluvial deposits. Prior to utilization, the collected soil underwent a drying process at 105 °C. To evaluate the soil’s physical characteristics, a series of laboratory tests were conducted, encompassing Atterberg limits [29], sieve analysis [30], and specific gravity measurements [31]. By the Unified Soil Classification System (USCS) [29], the tested soil was classified as non-organic clay with low plasticity (CL). Furthermore, the specific gravity was found to be 2.66. The grain size distribution of the studied sample is illustrated in Figure 1.

2.1.2. Glass Powder

The glass material employed in this investigation was obtained from discarded solar panels, known for their challenging disassembly due to their firm adherence to the solar cells. A chopper machine was employed to facilitate the separation process and overcome this challenge. Afterward, the glass pieces were further crushed within a metallic cylinder using a hammer. The crushed glass was sieved through sieve number 230 with a 0.045 mm opening to obtain the required glass powder.

2.1.3. Sintered Gypsum

For this study, gypsum rock was obtained from a field as raw material and was crushed using the Los Angeles apparatus. Subsequently, the material was passed through sieve number 120, which allows only particles smaller than 0.125 mm. The prepared gypsum was then subjected to a sintering process in an oven, conducted at 1050 degrees Celsius for 24 h. After the sintering process, the material underwent an additional sieving to separate any undesirable particles that may have accumulated in the gypsum during the sintering operation.

2.2. Method

2.2.1. Molding Specimens and Curing Procedure

To conduct UCS testing, precise cylindrical specimens were carefully crafted to possess a diameter of 50 mm and a height of 100 mm, adhering to the guidelines outlined in (ASTM C39/C39M-20) [33]. Initially, specific dry densities were targeted for the specimens. In this study, two target densities were selected, namely 1500 and 1700 kg/m3, aligning with the maximum dry density of the clay at its optimal moisture content (17%). To accomplish this, the soil samples were first dehydrated in an oven at a temperature of 105 degrees Celsius for 24 h. It was followed by the process of pulverization using the Los Angeles apparatus. Subsequently, the clay material was passed through sieve number 18 (with an opening of 1 mm).
Adhering to the predetermined density requirements, the proportions of clay, glass powder, and sintered gypsum were then accurately considered. The specified quantities of dry materials were blended in a moisture-free environment until a consistent dispersion was attained, which usually required at least 5 min. After this, a predetermined quantity of water was incrementally added and mixed with the binder materials until a uniform blend was achieved. The amount of water used was based on the clay’s compression curve, which showed two different densities: the highest density (1700 kg/m3) and a lower density (1500 kg/m3). Three samples were prepared for each mixture. Two of them were subjected to the UCS test, while one was tested for the determination of the initial shear modulus (G0).
The blend was later divided into three equal layers and compacted using a split mold to reach the pre-determined density, following the compaction procedure proposed by Selig and Ladd [34]. After molding, the sample was delicately removed from the mold, and its dimensions were gauged. Following this, the specimens underwent a curing process by (ASTM C0511-19) [35] for different durations of 7, 28, and 56 days.
After the curing process, each sample was submerged in water for 24 h, ensuring the highest degree of saturation and assessing its capacity to withstand this long immersion without failure. The table expressed detailed information regarding specimen preparation, the additive contents, and the tests conducted.

2.2.2. Unconfined Compressive Strength (UCS)

UCS Methods based on (ASTM D1632-17) were employed to evaluate the effects of the additives on the clay’s compressive strength, maintaining a constant strain rate of 1 mm/min by the specifications detailed in the (ASTM D1632-17) standard [36].
Before conducting the tests, each sample was fully saturated by immersion in water maintained at room temperature for 24 h. After removing the specimens from the water, their dimensions and weights were measured prior to commencing the testing process. Vertical displacement and load data were inspected to ascertain the strength values after finishing the test. Furthermore, E was derived for all the tested specimens through the elastic segment of the stress–strain graphs using Equation (1).
E = Δ σ Δ ε
In this equation, Δσ represents the difference in UCS in the vertical stress, while Δε signifies the axial displacement.

2.2.3. Ultrasonic Pulse-Velocity Tests

Initially, the UPV tests were accomplished on all specimens to evaluate their shear modulus before the UCS tests, following the guidelines of the (ASTM C597-02) [37] standard. A MATEST Ultrasonic Tester Model C368 was employed for these tests. The shear waves’ recorded velocity (Vs) considered the sample’s length as the travel distance [38]. Equation (2) was employed to derive the maximal shear modulus (G0) from the sample’s density ( ρ ).
G 0 = ρ × V s 2

2.2.4. Durability Test (Wetting–Drying Cycles)

The durability performance of the blends was assessed by subjecting the samples to a maximum of 12 wetting–drying cycles based on the guidelines outlined in the (ASTM D559) [39] standard. Following the curing process, the specimens were initially immersed in water for 6 h. Subsequently, they underwent a drying phase in an oven at 74 °C ± 2 °C for 42 h. After each wetting–drying cycle, the surfaces of the specimens were brushed with a force equivalent to 15 N. After each cycle, the masses of the samples were recorded, allowing for the calculation of the loss of mass for each cycle and ultimately determining the accumulated loss of mass (ALM) after the maximum of the twelfth cycle.

2.2.5. Microstructural Tests

The pozzolanic response between soil additives and soil was studied by microstructural testing, focusing on the interaction between clay soil and sintered gypsum in a water-containing environment. These investigations involved techniques including XRD and SEM. A field-emission scanning electron microscope (QUANTA 400F) was used for SEM testing. Sample pieces, approximately 10 mm in size, were mounted on aluminum stubs. Under the electron beam, a thin layer of gold was placed to reduce the impact of the charges. From 1 K to 10 K, various magnification levels were used to capture SEM pictures. An X-ray powder diffractometer (XRD) equipped with a Bruker AXS D8 Advance Model X-ray Diffractometer was utilized. The device utilized a high-speed PSD: a Vantec-1 detector and a Cu-Kα X-ray source. Scans were conducted in a 2-theta range of 2–90 degrees at a rate of 2 degrees per minute, with step intervals of 0.02 degrees, operating at 40 kV and 30 mA. In order to identify peaks, the International Center for Diffraction Data’s (ICDD) database was queried, utilizing Crystal Impact Match Software, Version 3.11.1. XRD analyses were conducted via HighScore (Plus version 3.0.5).

3. Results and Analysis

3.1. Impact of Test Variables on Strength and Stiffness

The study conducted a statistical analysis of the dry densities (1700 and 1500 kg/m3), glass-powder contents, gypsum contents, and curing durations. This assessment explains the distinct effects of individual factors on the (UCS), as shown in Figure 2a–c, (G0) depicted in Figure 2d–f, and (E) represented in Figure 2g–i. Regardless of other factors’ influence, the calculated factors exhibited a noticeable increase when the specimens were compacted to a greater dry density. It is attributed to the porosity reduction and enhanced interaction of soil particles and additive materials in denser specimens. The increase in gypsum content resulted in a consistent improvement across all strength and stiffness features. It is worth noting that the increase was more significant in denser samples when compared to less dense ones.
On the other hand, the behavior of the glass-powder content was inconsistent across all strength and stiffness features. It was observed that, for all mentioned features (UCS, G0, and E), increments from 0% to 8% led to a decrease, and suddenly, for the 12% content, a shift to an increasing trend was noted. It highlights the significance of a 12% glass-powder content in the samples, implying a critical threshold for this material. The analysis also shows that the test variables exert the most significant impact on the G0 and a comparatively lesser impact on the E.
The statistical analysis demonstrated a significant correlation between the variables of the tests and the strength and stiffness characteristics of the samples. It was found that the gypsum content had the most pronounced impact on these characteristics.

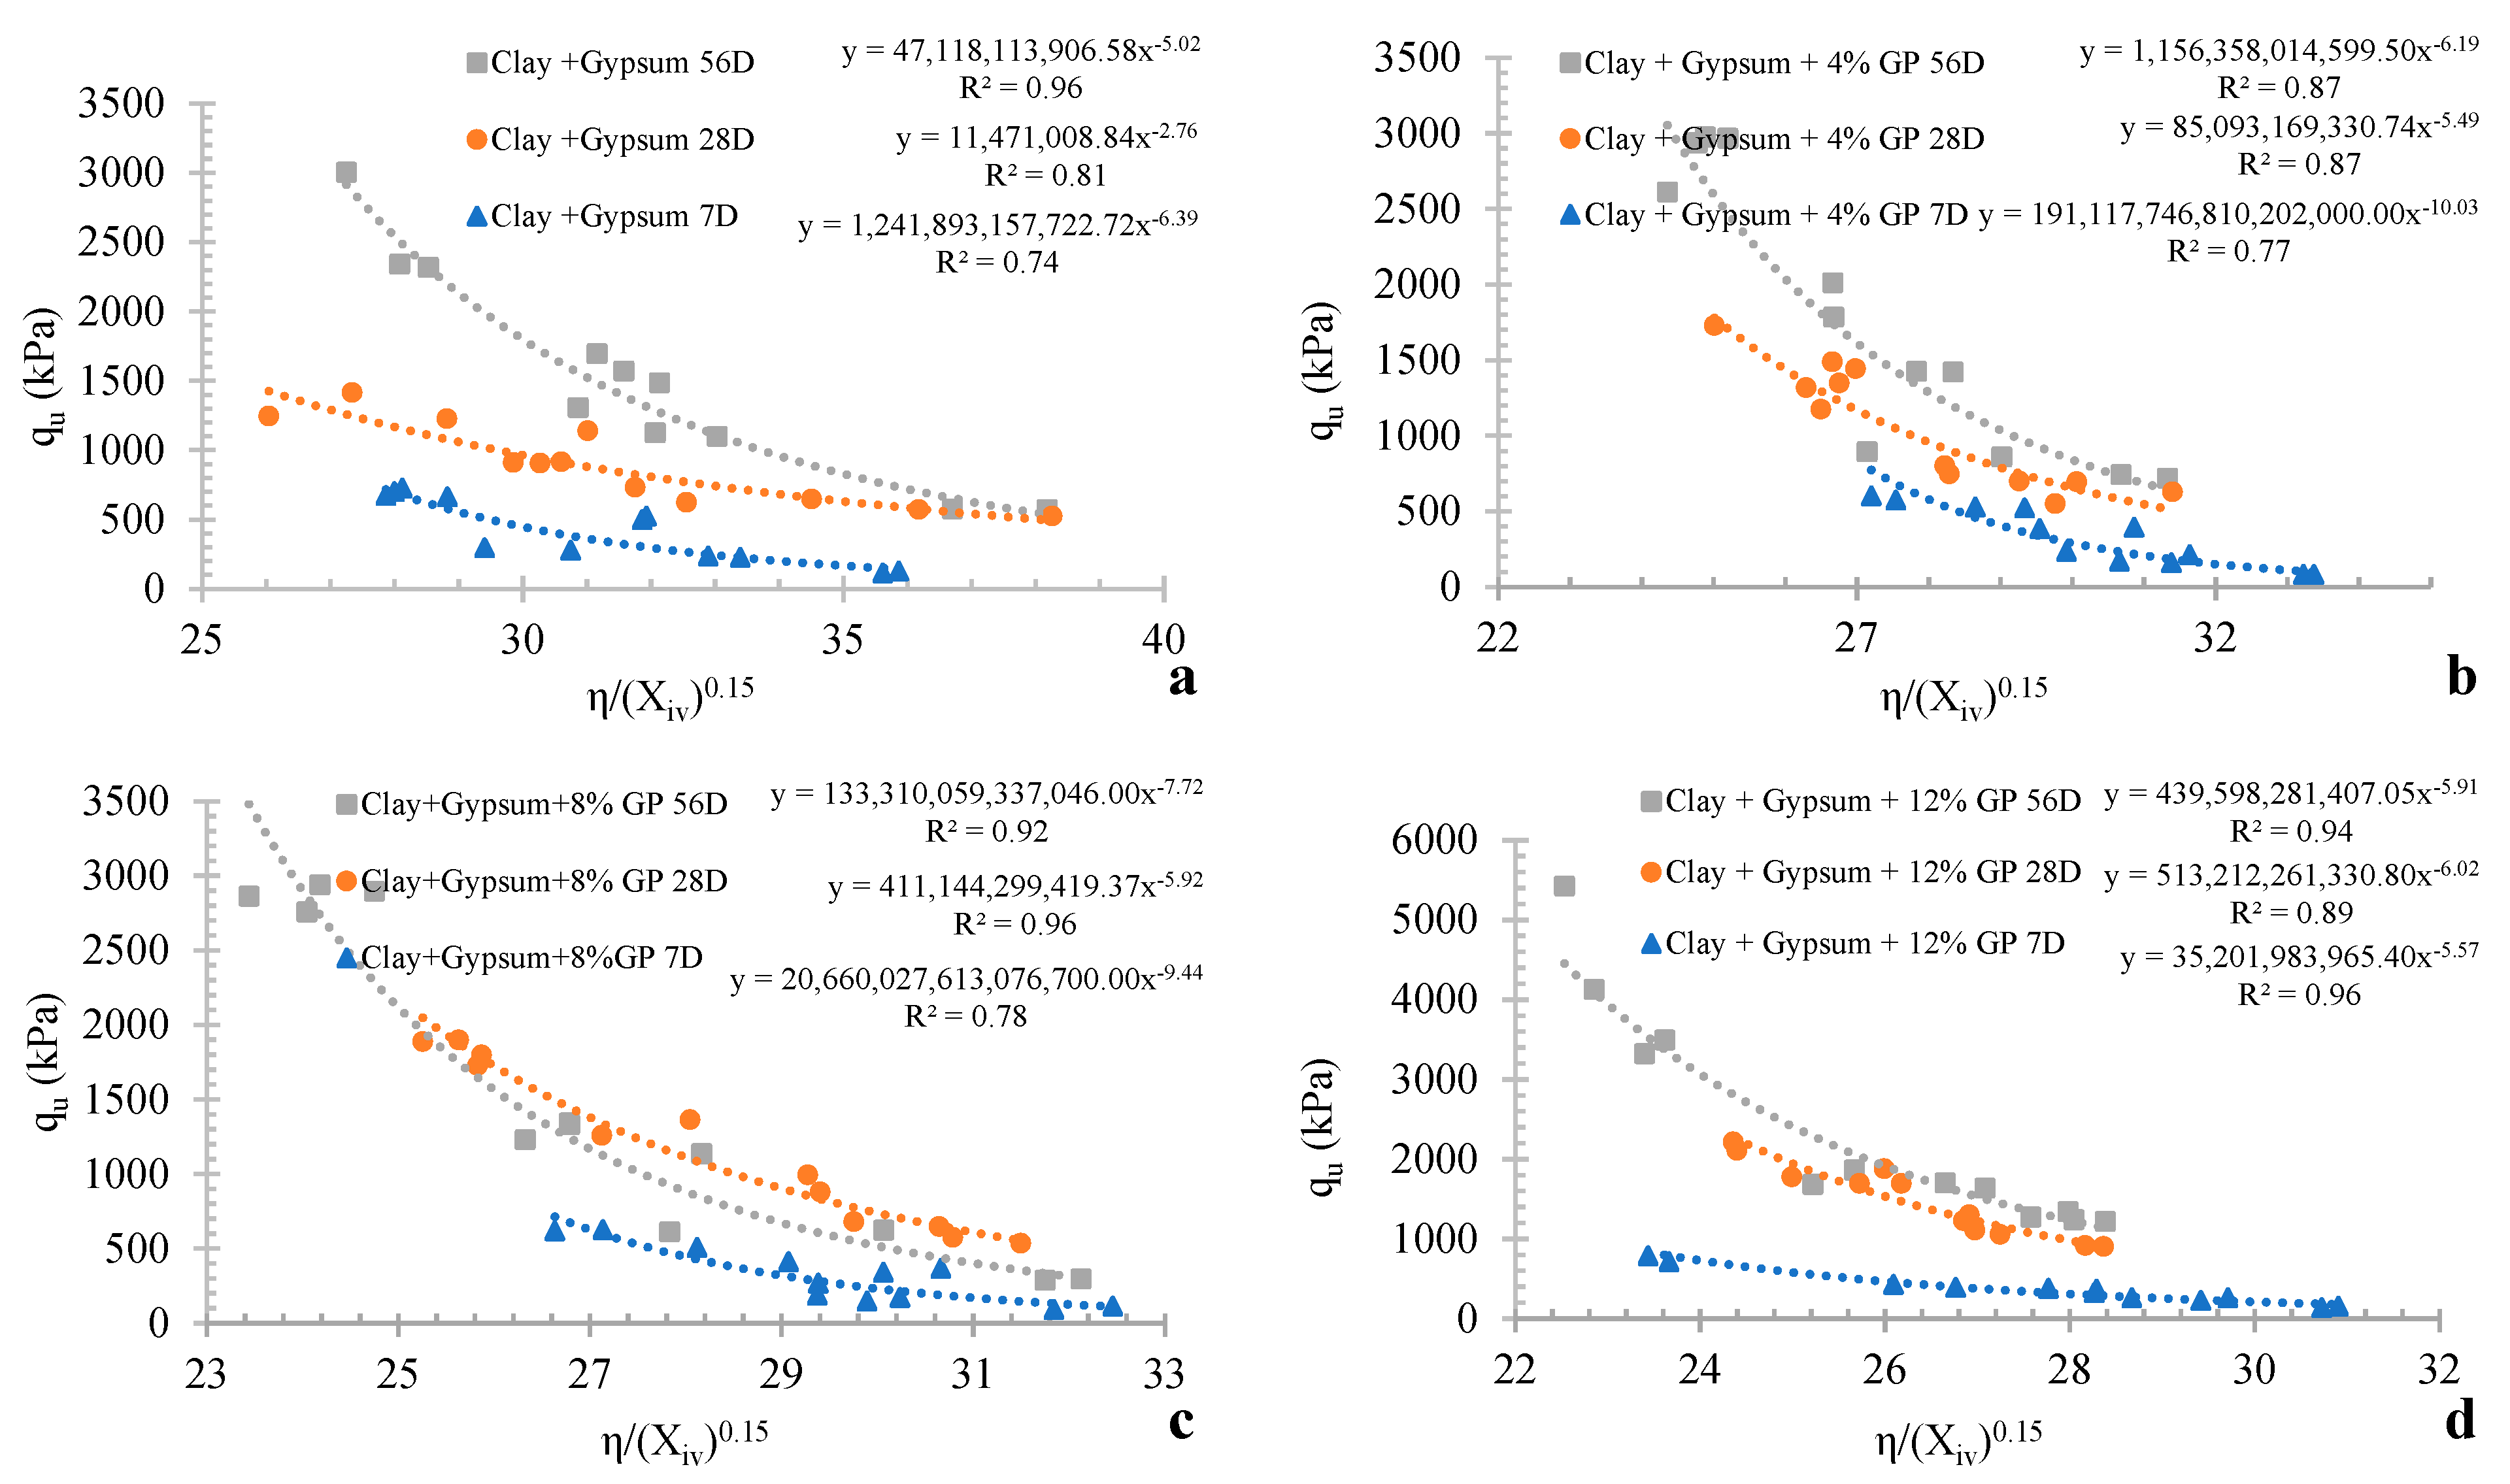
3.2. Influence of Porosity–Binder Index on UCS

Figure 3 illustrates the correlation between the UCS and the corrected porosity–binder (P/B) ratio (η/Xivα) for various samples with varying additives, densities, and curing durations [40].
This study shows that porosity significantly impacts blend behavior, as evidenced by the power coefficient α. It is consistent with prior research findings [41]. When α assumes a value of less than 1, it implies that porosity has a more significant influence [42]. Within the present investigation, the optimal fit was at α = 0.15. It aligns with earlier empirical studies, where the α values typically ranged from 0.12 to 0.35, primarily depending on the specific soil type, as demonstrated in previous research.
As can be seen from Figure 3a–d, by increasing the porosity index, the decrease in qu has been achieved, which aligned with prior studies [43,44,45]. Considering the amount of glass powder, it was revealed that samples with 12% GP, compared to the other percentages of GP, have a lesser range of porosity that yields higher amounts of qu. This jump of qu from 8% to 12% of GP is because of a higher reduction in the porosity investigated in a microstructural analysis. On the other hand, the high regressions of curvatures in Figure 3a–d represent a significant relation between qu and porosity in all samples.
Moreover, regarding the graphs in Figure 3, curing days play a significant role in sample strengthening. As shown in Figure 3a–d, graphs of 7, 28, and 56 curing days are positioned above each other, respectively, except for samples with a GP content of 8%. In addition, graphs related to seven curing days are notably distinguished from the other two graphs in each chart regarding the distance, especially at high porosities. The growth of qu by increasing the curing days is predictable; however, the case of GP content of 8% is discussed in the microstructural analysis part.

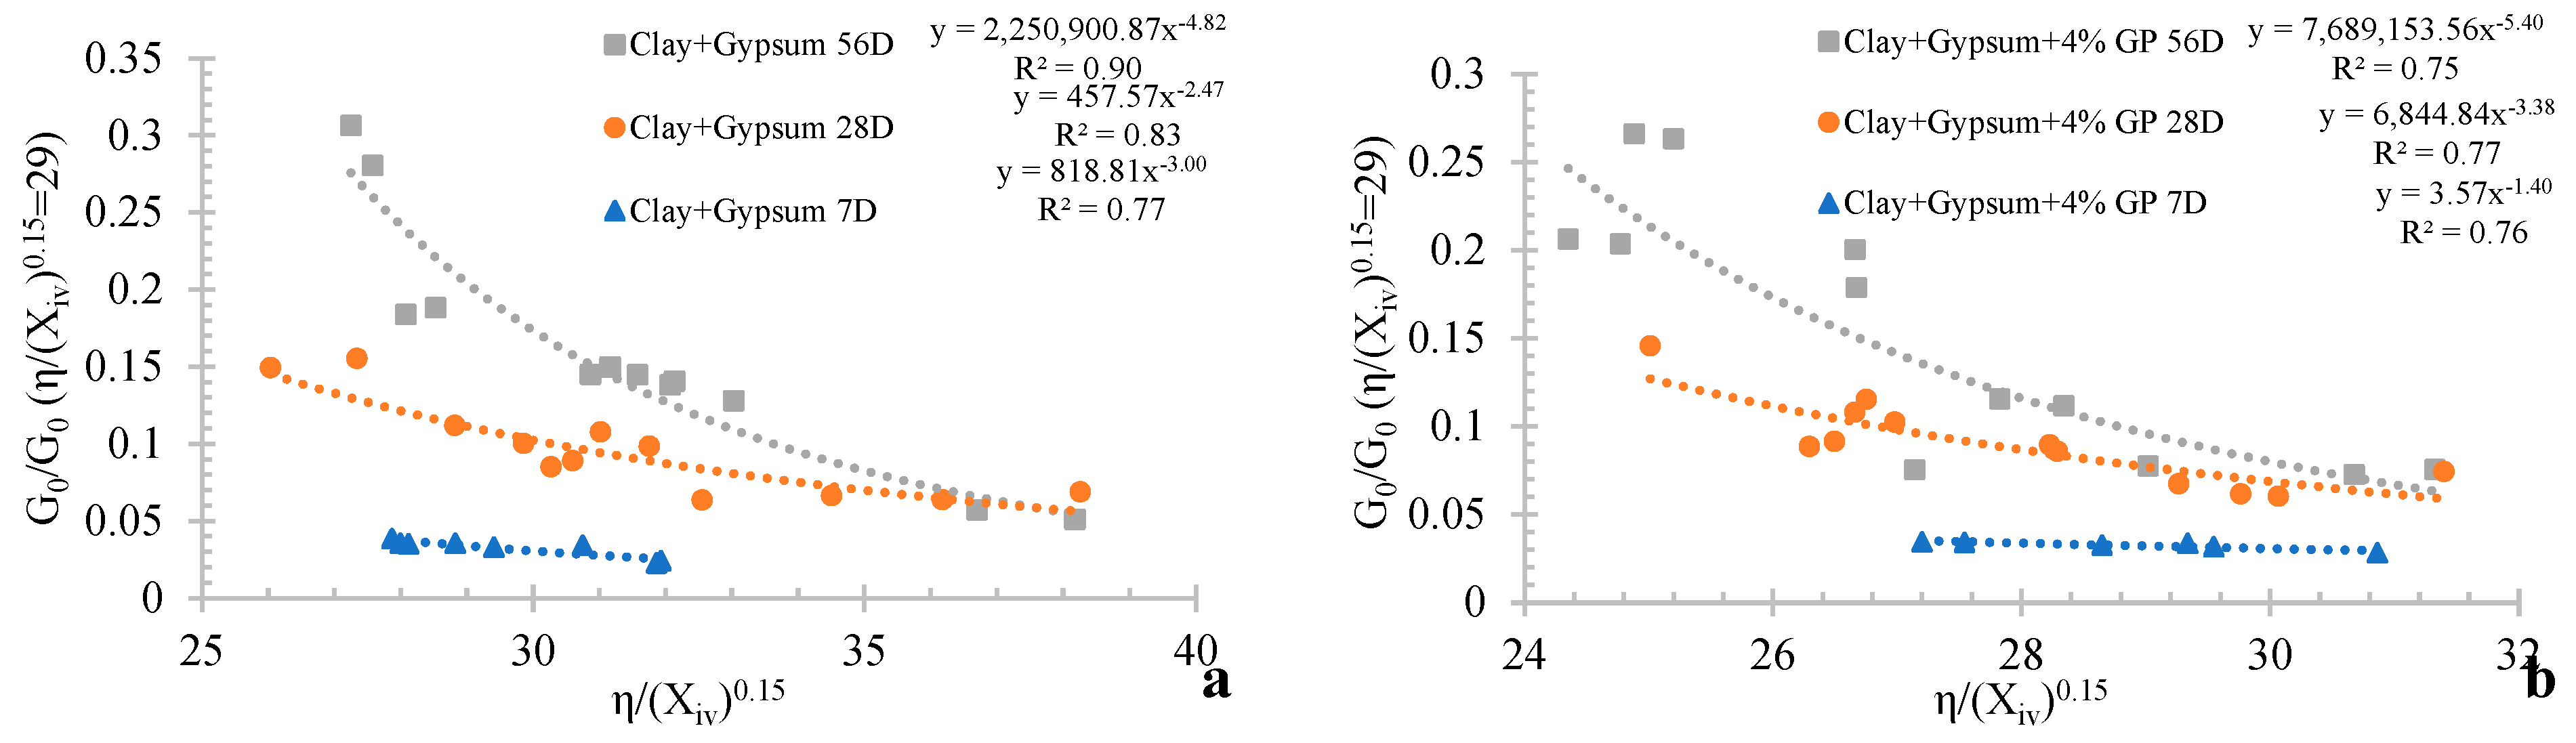
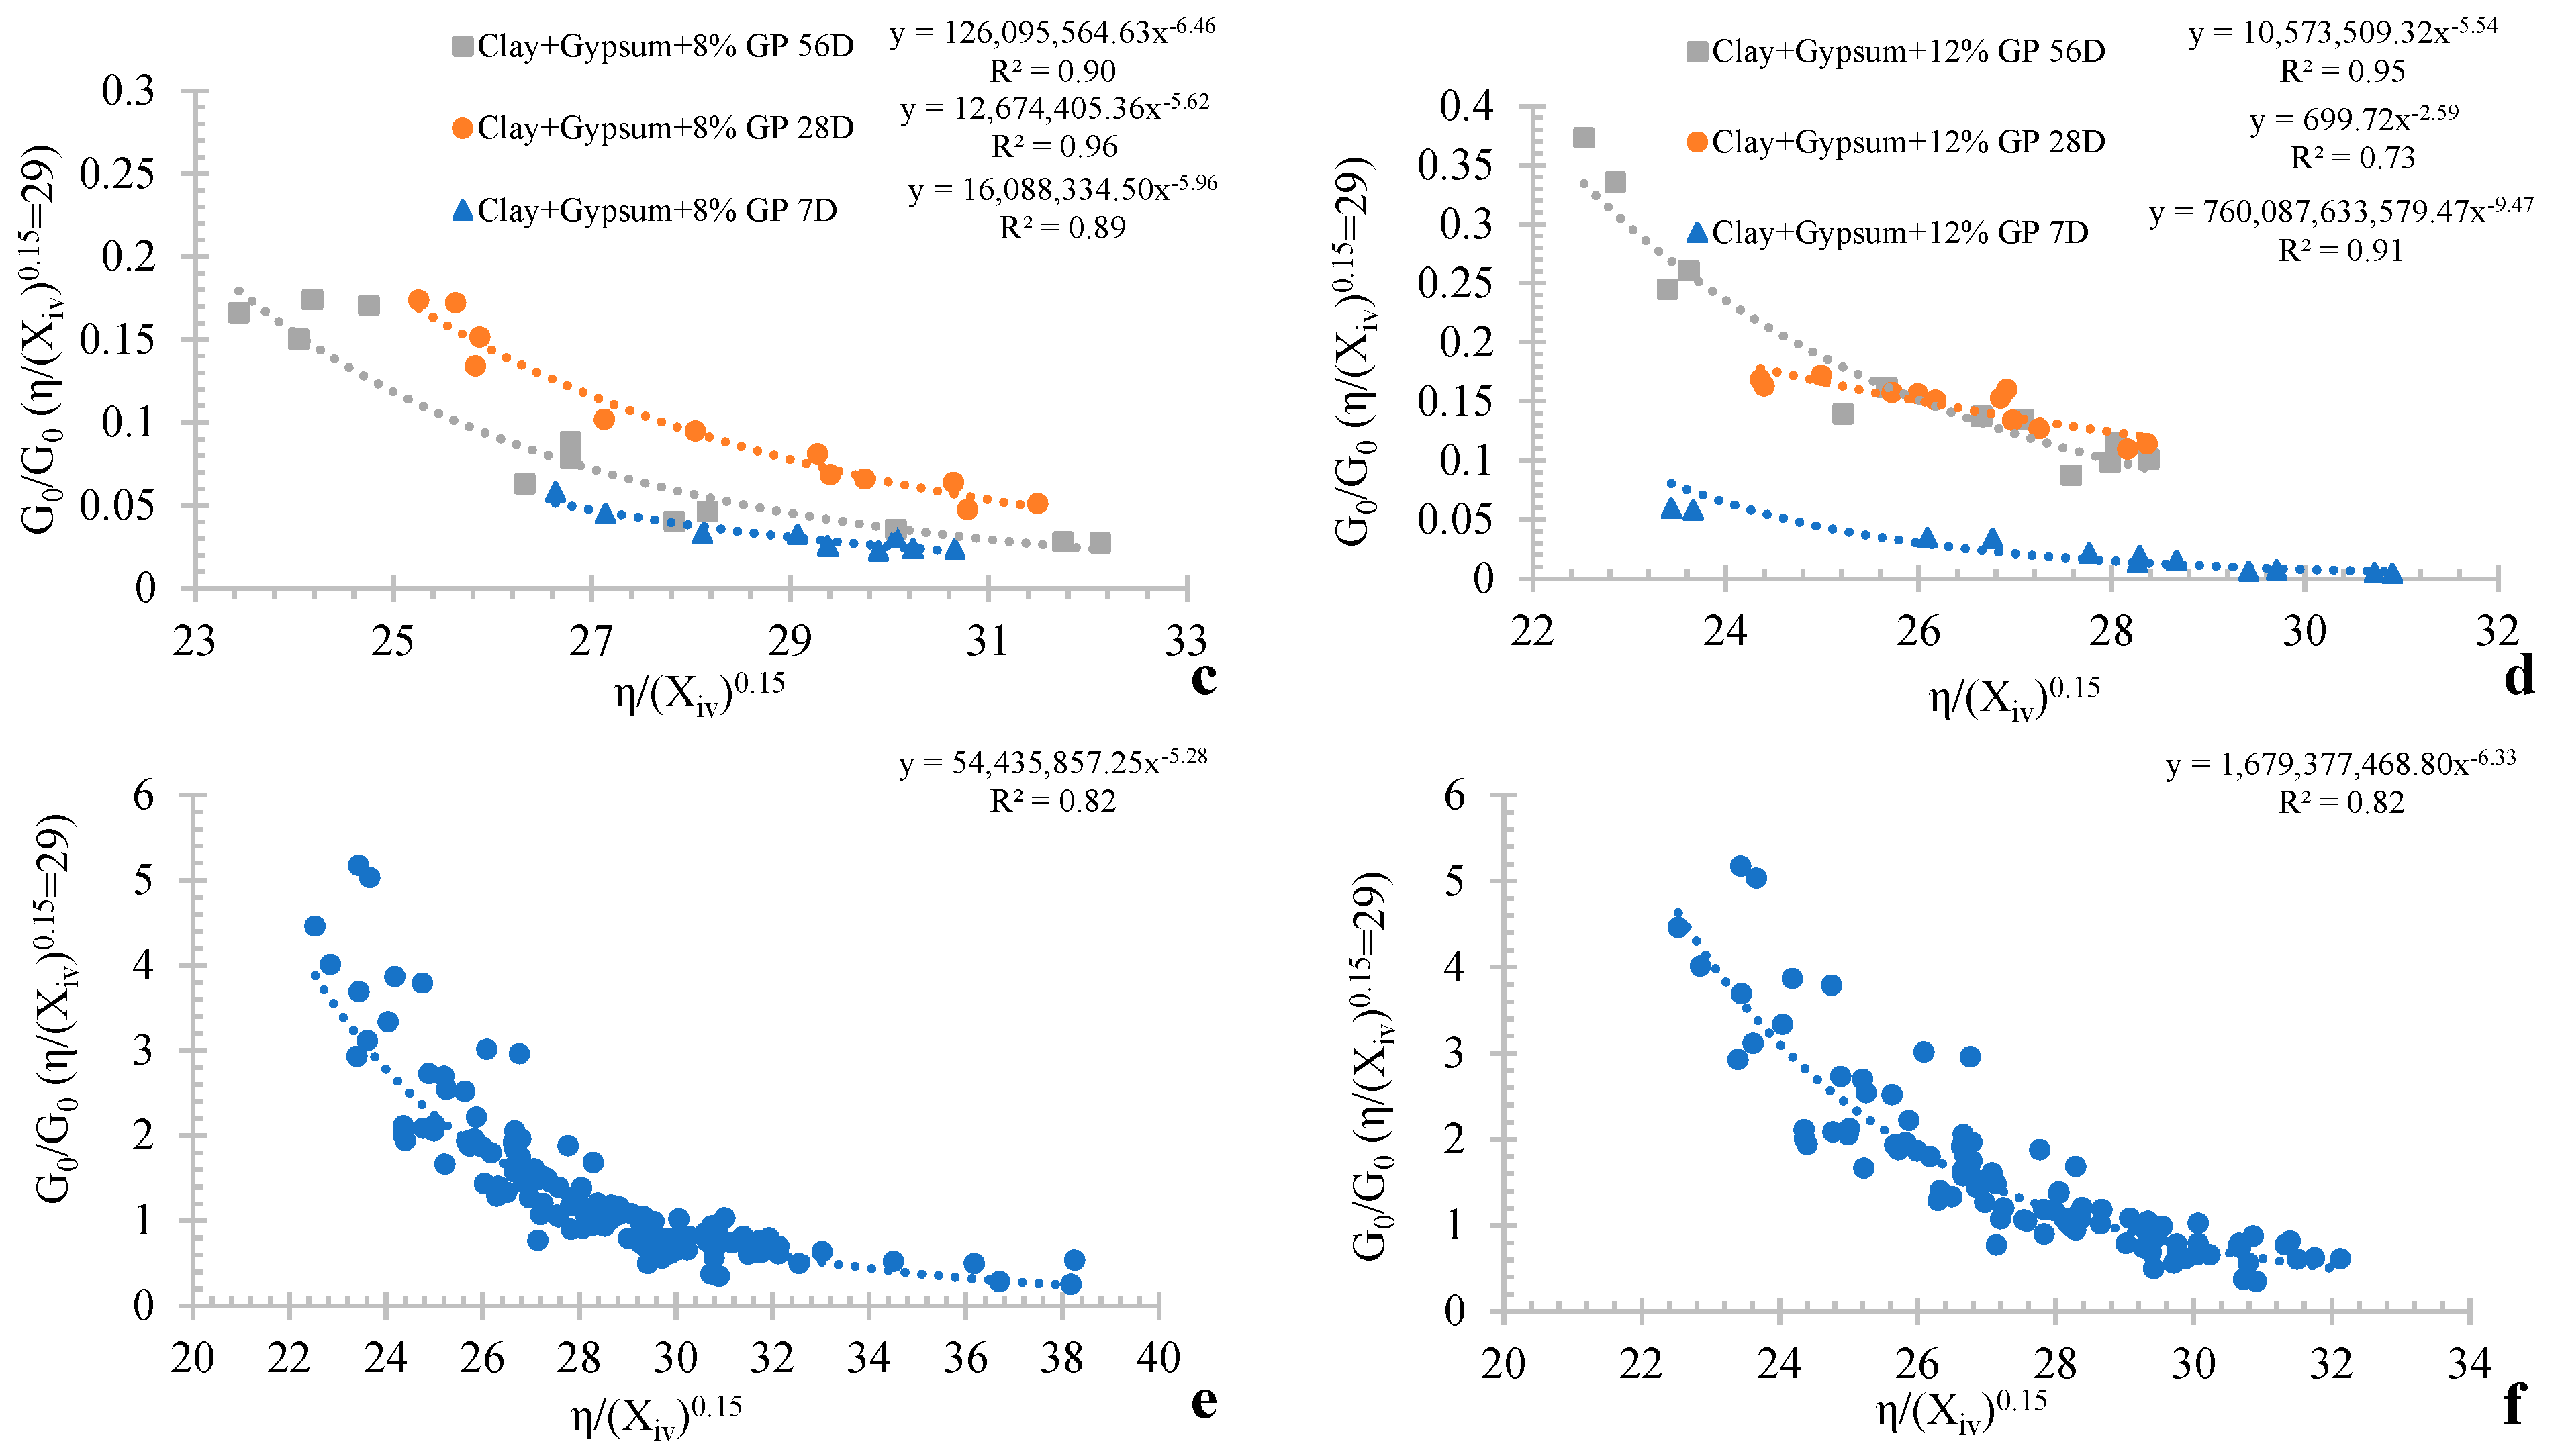
3.3. Influence of P/B Index on G0

Figure 4 illustrates how the G0 relates to the modified porosity-to-binder index (η/Xiv0.15). In contrast to the findings of the UCS test, the diagrams show lower regression coefficients. Due to the regression status of the charts, there is an excellent correlation between the porosity index and stiffness; again, graphs with 12% glass powder have the highest regression coefficient among the other GP percentages.
Here, similar to the previous part, the graphs’ positions are predictable, which means that an increase in curing periods increases the samples’ stiffness, except for the chart related to samples with a GP content of 8%. Furthermore, the results for the seven-day-cured samples are not close to the 28- and 56-day curing duration results, and the behaviors of these samples are more linear in comparison with the qu graphs. In other words, the additives’ effects on soil improvement are negligible on short curing days. However, the chart with 8% GP exhibits an exception again.

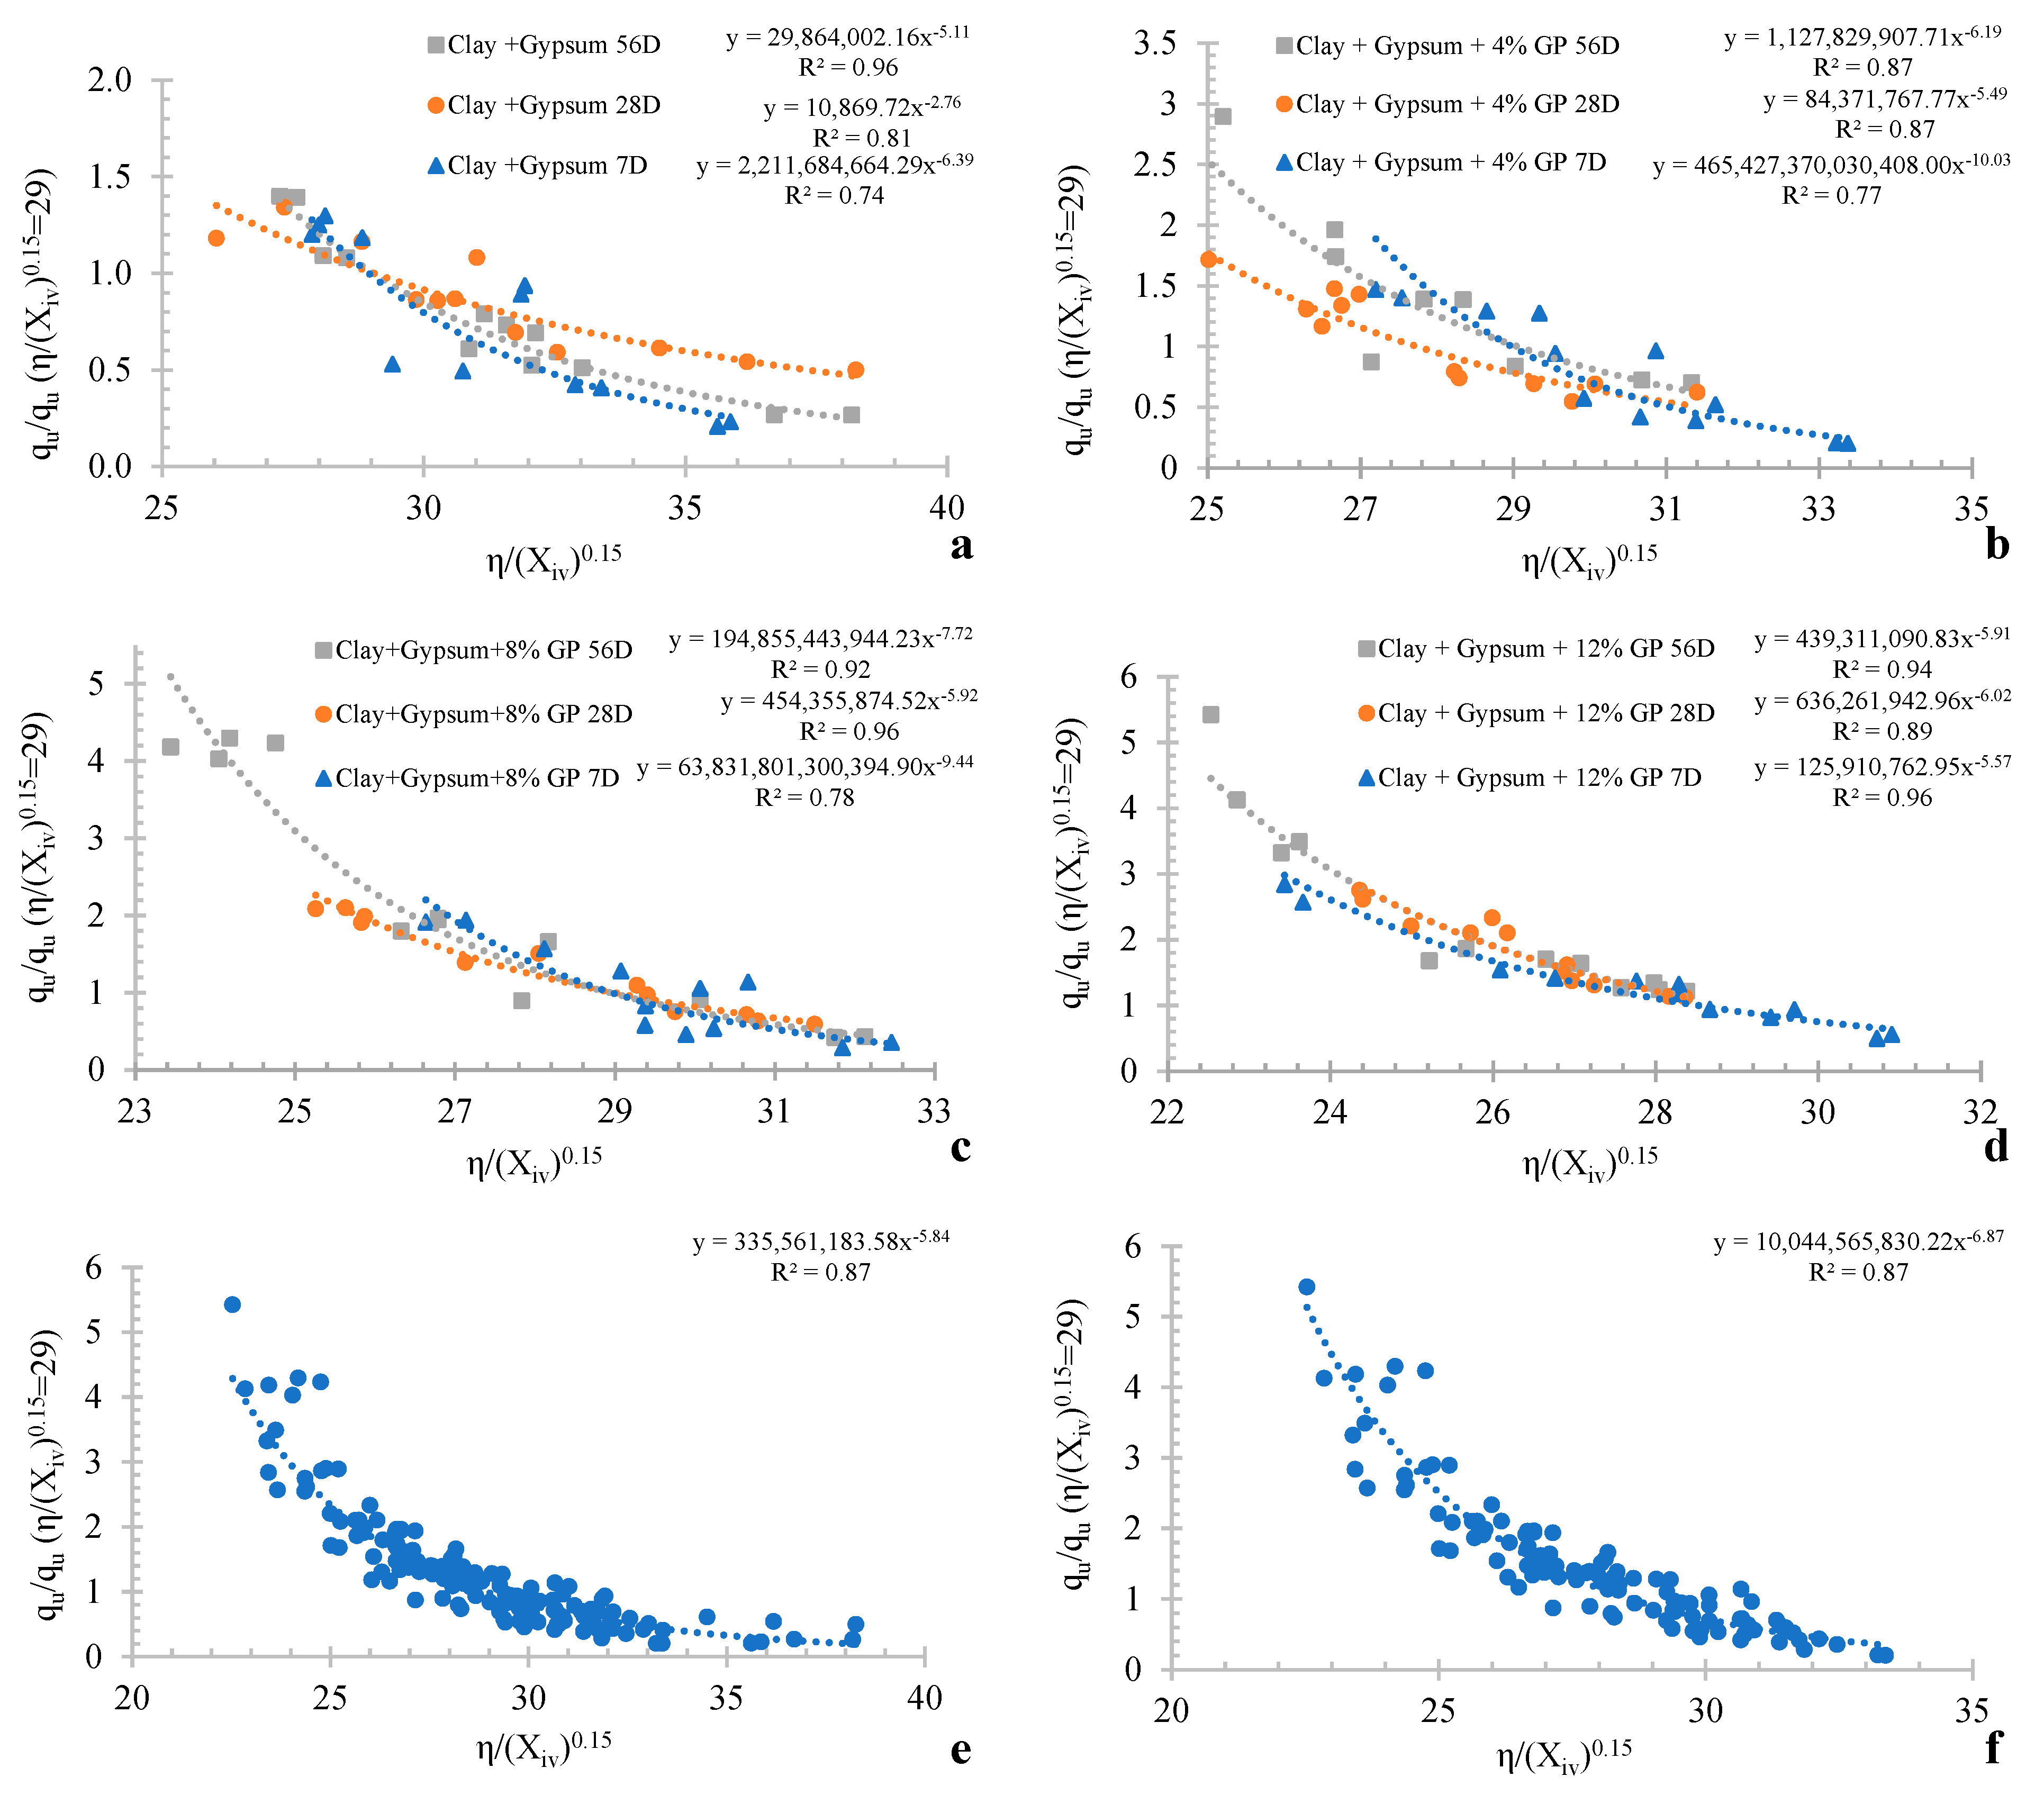
3.4. Influence of P/B Index on Normalized UCS and G0

Figure 5 and Figure 6 express the sample’s normalized results of UCS and G0, respectively. Through this normalization process, a heightened level of comprehension and enhanced predictive capabilities have been achieved.
Notably, Equations (3) and (4) display high regression coefficients, with R2 = 0.87 and R2 = 0.82 correspondingly. Regardless of the amount of additives and the curing length, these statistical connections are vital for determining qu and G0 for certain mixtures of clay types, as shown by one test. It is recommended to do this test with three similar samples to achieve a typical strength amount for the selected value of η/Xiv0.15, represented as ∇, for improved accuracy. The decision to use ∇ amounts near 25 was made in this work because it is recommended in recent studies on different materials [42,43].
q u = q u ( η / X i v 0.15 = 29 ) × ( 10,044 , 565,830.22 ) η / X i v 0.15 ( 6.87 )
G 0 = G 0 ( η / X i v 0.15 = 29 ) × ( 1679 , 377,468.80 ) η / X i v 0.15 ( 6.33 )

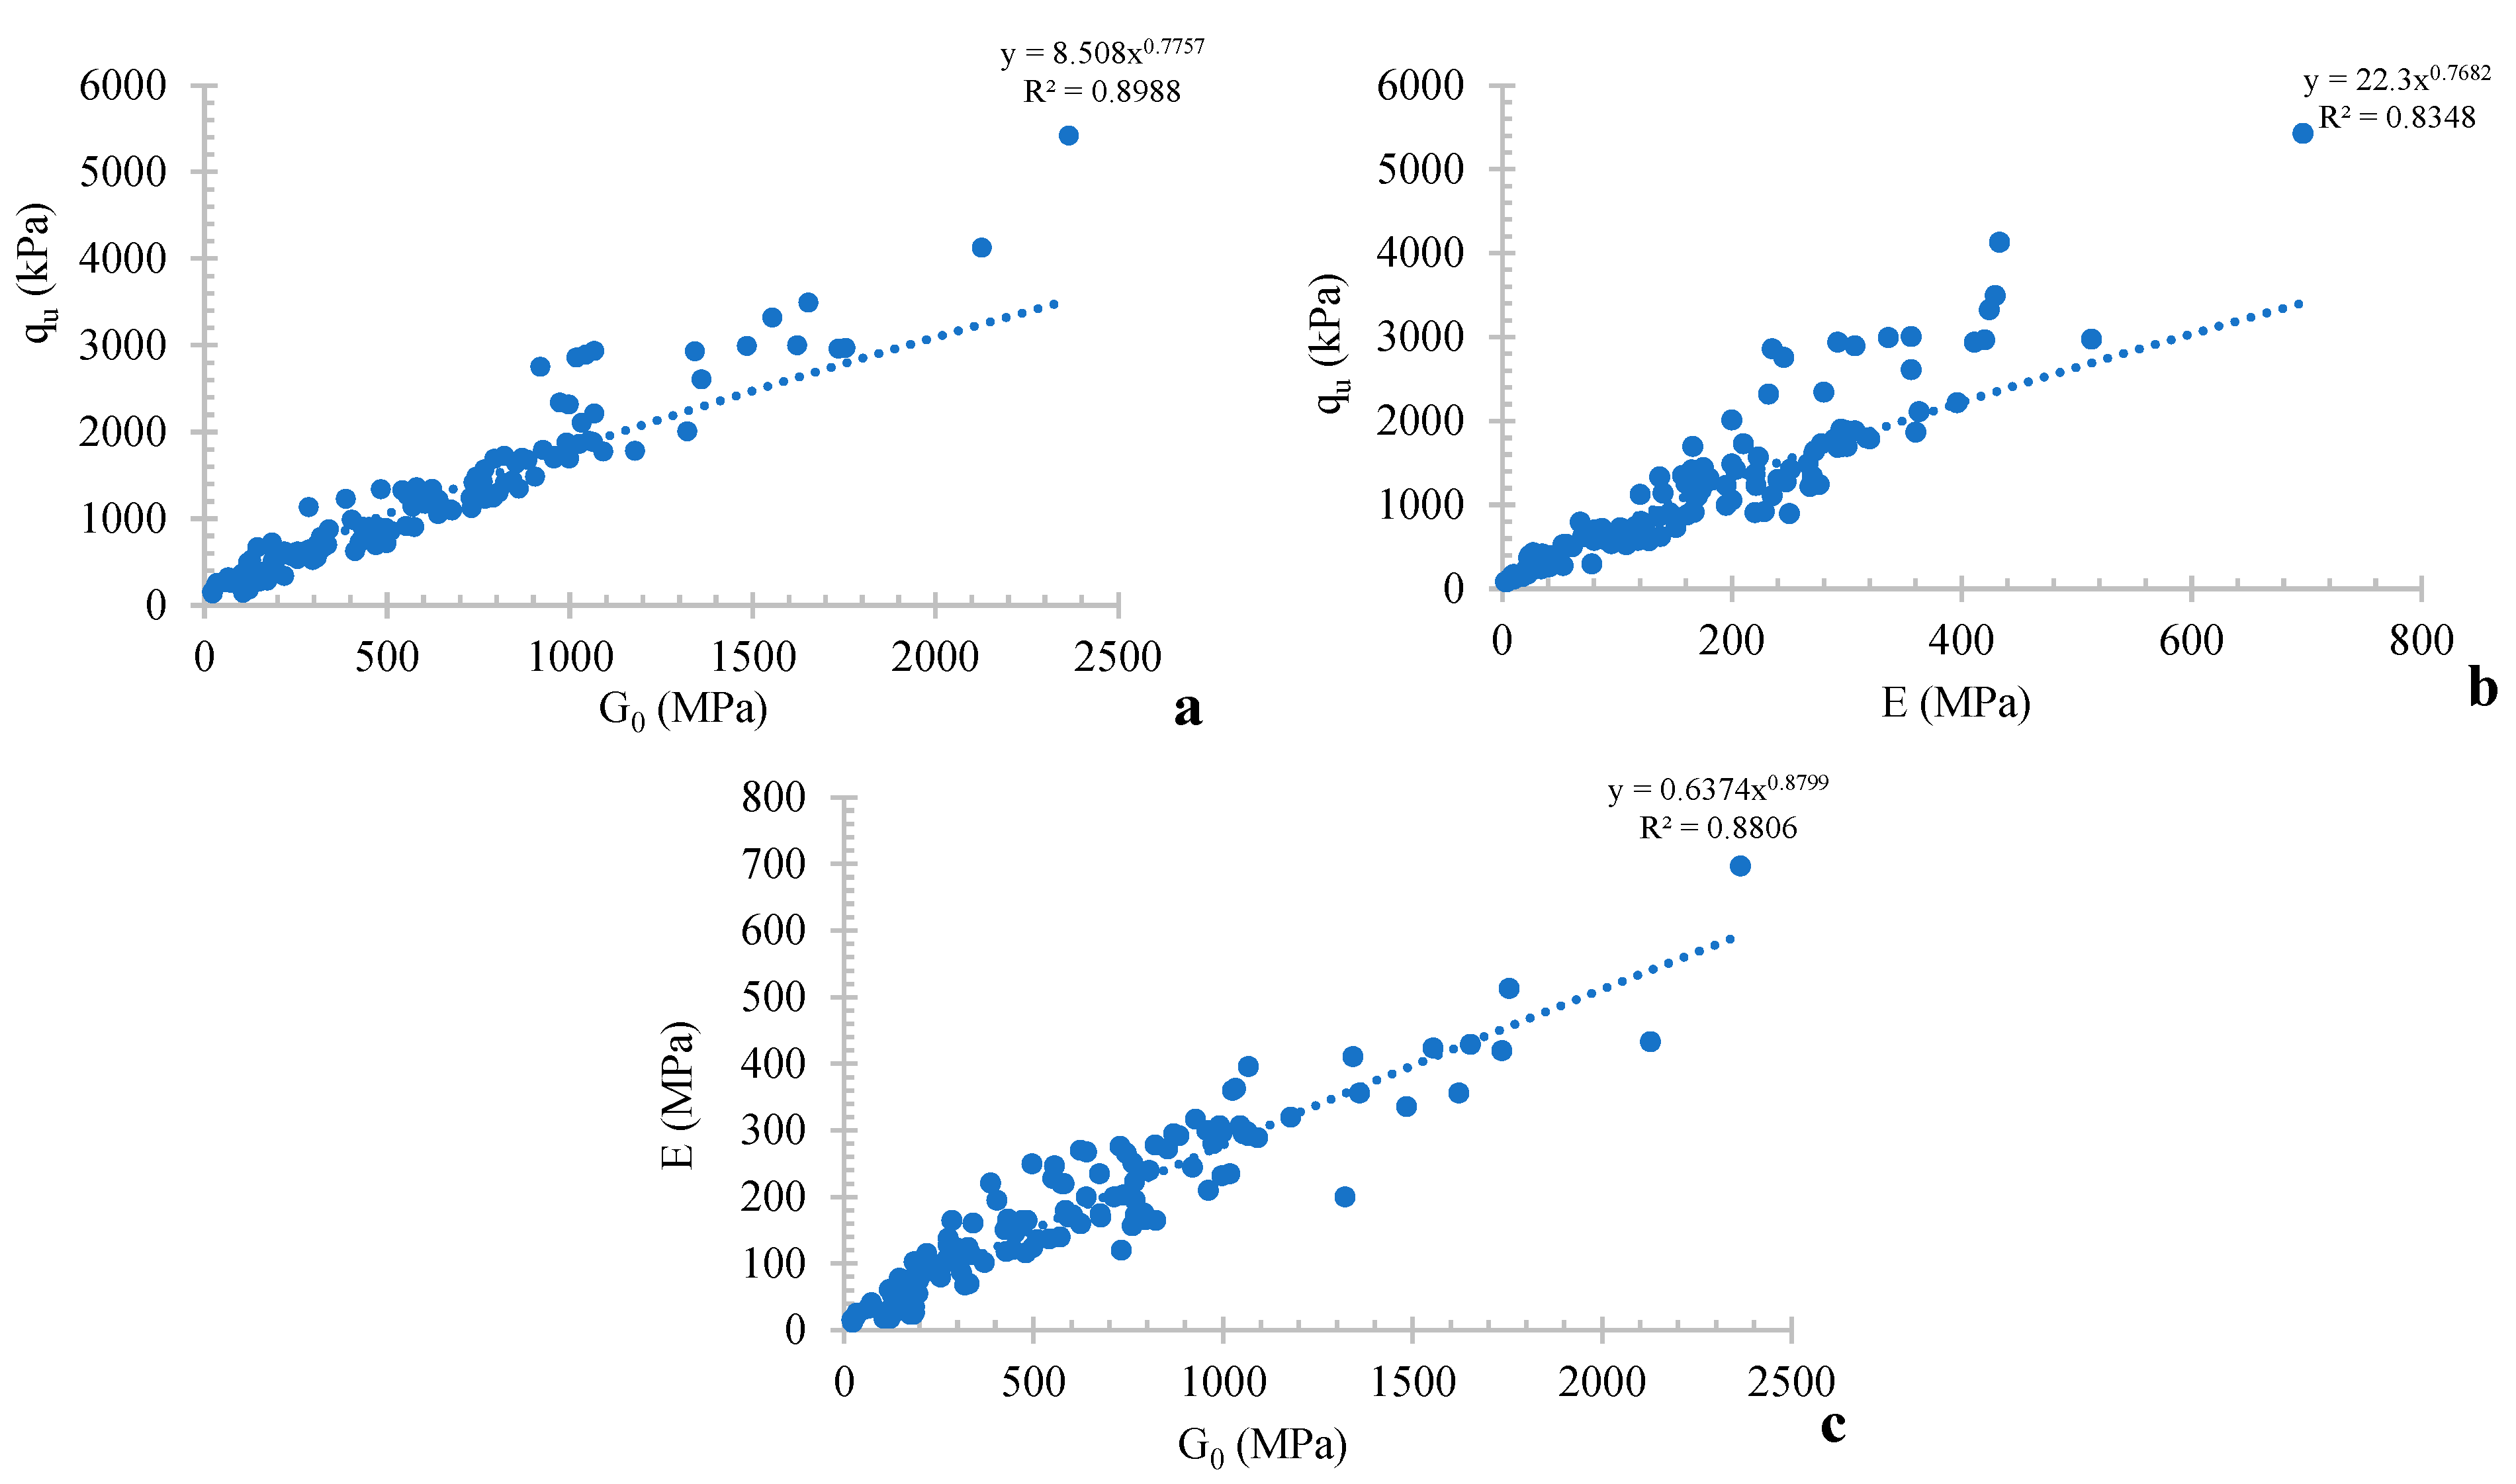
3.5. Relations between Strength and Stiffness

Figure 7 reveals a strong correlation between physical properties, characterized by high regression values. A well-fitted power diagram effectively represents the relationship between the qu-G0 graph in Figure 7a and Equation (5), exhibiting a high regression coefficient (R2 = 0.89). Furthermore, Figure 7c illustrates the relationship between E and G0 for all the mixtures under examination, as described by Equation (6), which displays a power diagram with a notable coefficient of regression of R2 = 0.88.
Equations (3) and (5) play an essential role in determining the G0 of specimens prepared at the specified value of η/(Xiv)0.15 = 29, and they are linked to the relevant parameters of UCS and E in Equations (3) and (4). The significance of Figure 7a,c lies in the fact that, at different GP and sintered gypsum amounts, qu and E can be determined using Equations (5) and (6) for various clay blends over specific curation through the non-destructive assessment of G0.
q u = 8.508 G 0 0.7757
E = 0.6374 G 0 0.8799

3.6. Durability Assessment of Soil Samples by Sintered Gypsum and Glass Powder

As shown in Figure 8a–d, the presence of GP aggravates the durability factor of mixed samples. However, by increasing the GP content from 4% to 12%, the porosity decreases lightly, and it is declared that the worst GP content for durability is 4%. Regarding the charts, samples with more curing days express less ALM (%), which means that pozzolanic reactions between additives and the clay soil continue over 56 days. It is discussed in the microstructural analysis. As seen from the high regression values of the ALM graphs, the relation between the ALM and porosity in this study is meaningful. After normalization of the ALM graph for all durability tests and comparing Figure 8e,f, an increase of 1% is apparent, strengthening the link between the ALM and the porosity index.
Conversely, similar to the formulas in the physical properties part, a formula has been generated to predict the ALM by various combinations of additives. Equation (7), with a strong regression coefficient (R2 = 0.867), expresses an accurate prediction tool for the ALM assessment in further investigations.
A L M = ALM ( η / X i v 0.15 = 29 ) × ( 0.00000069 ) η / X i v 0.15 x ( 4.21 )

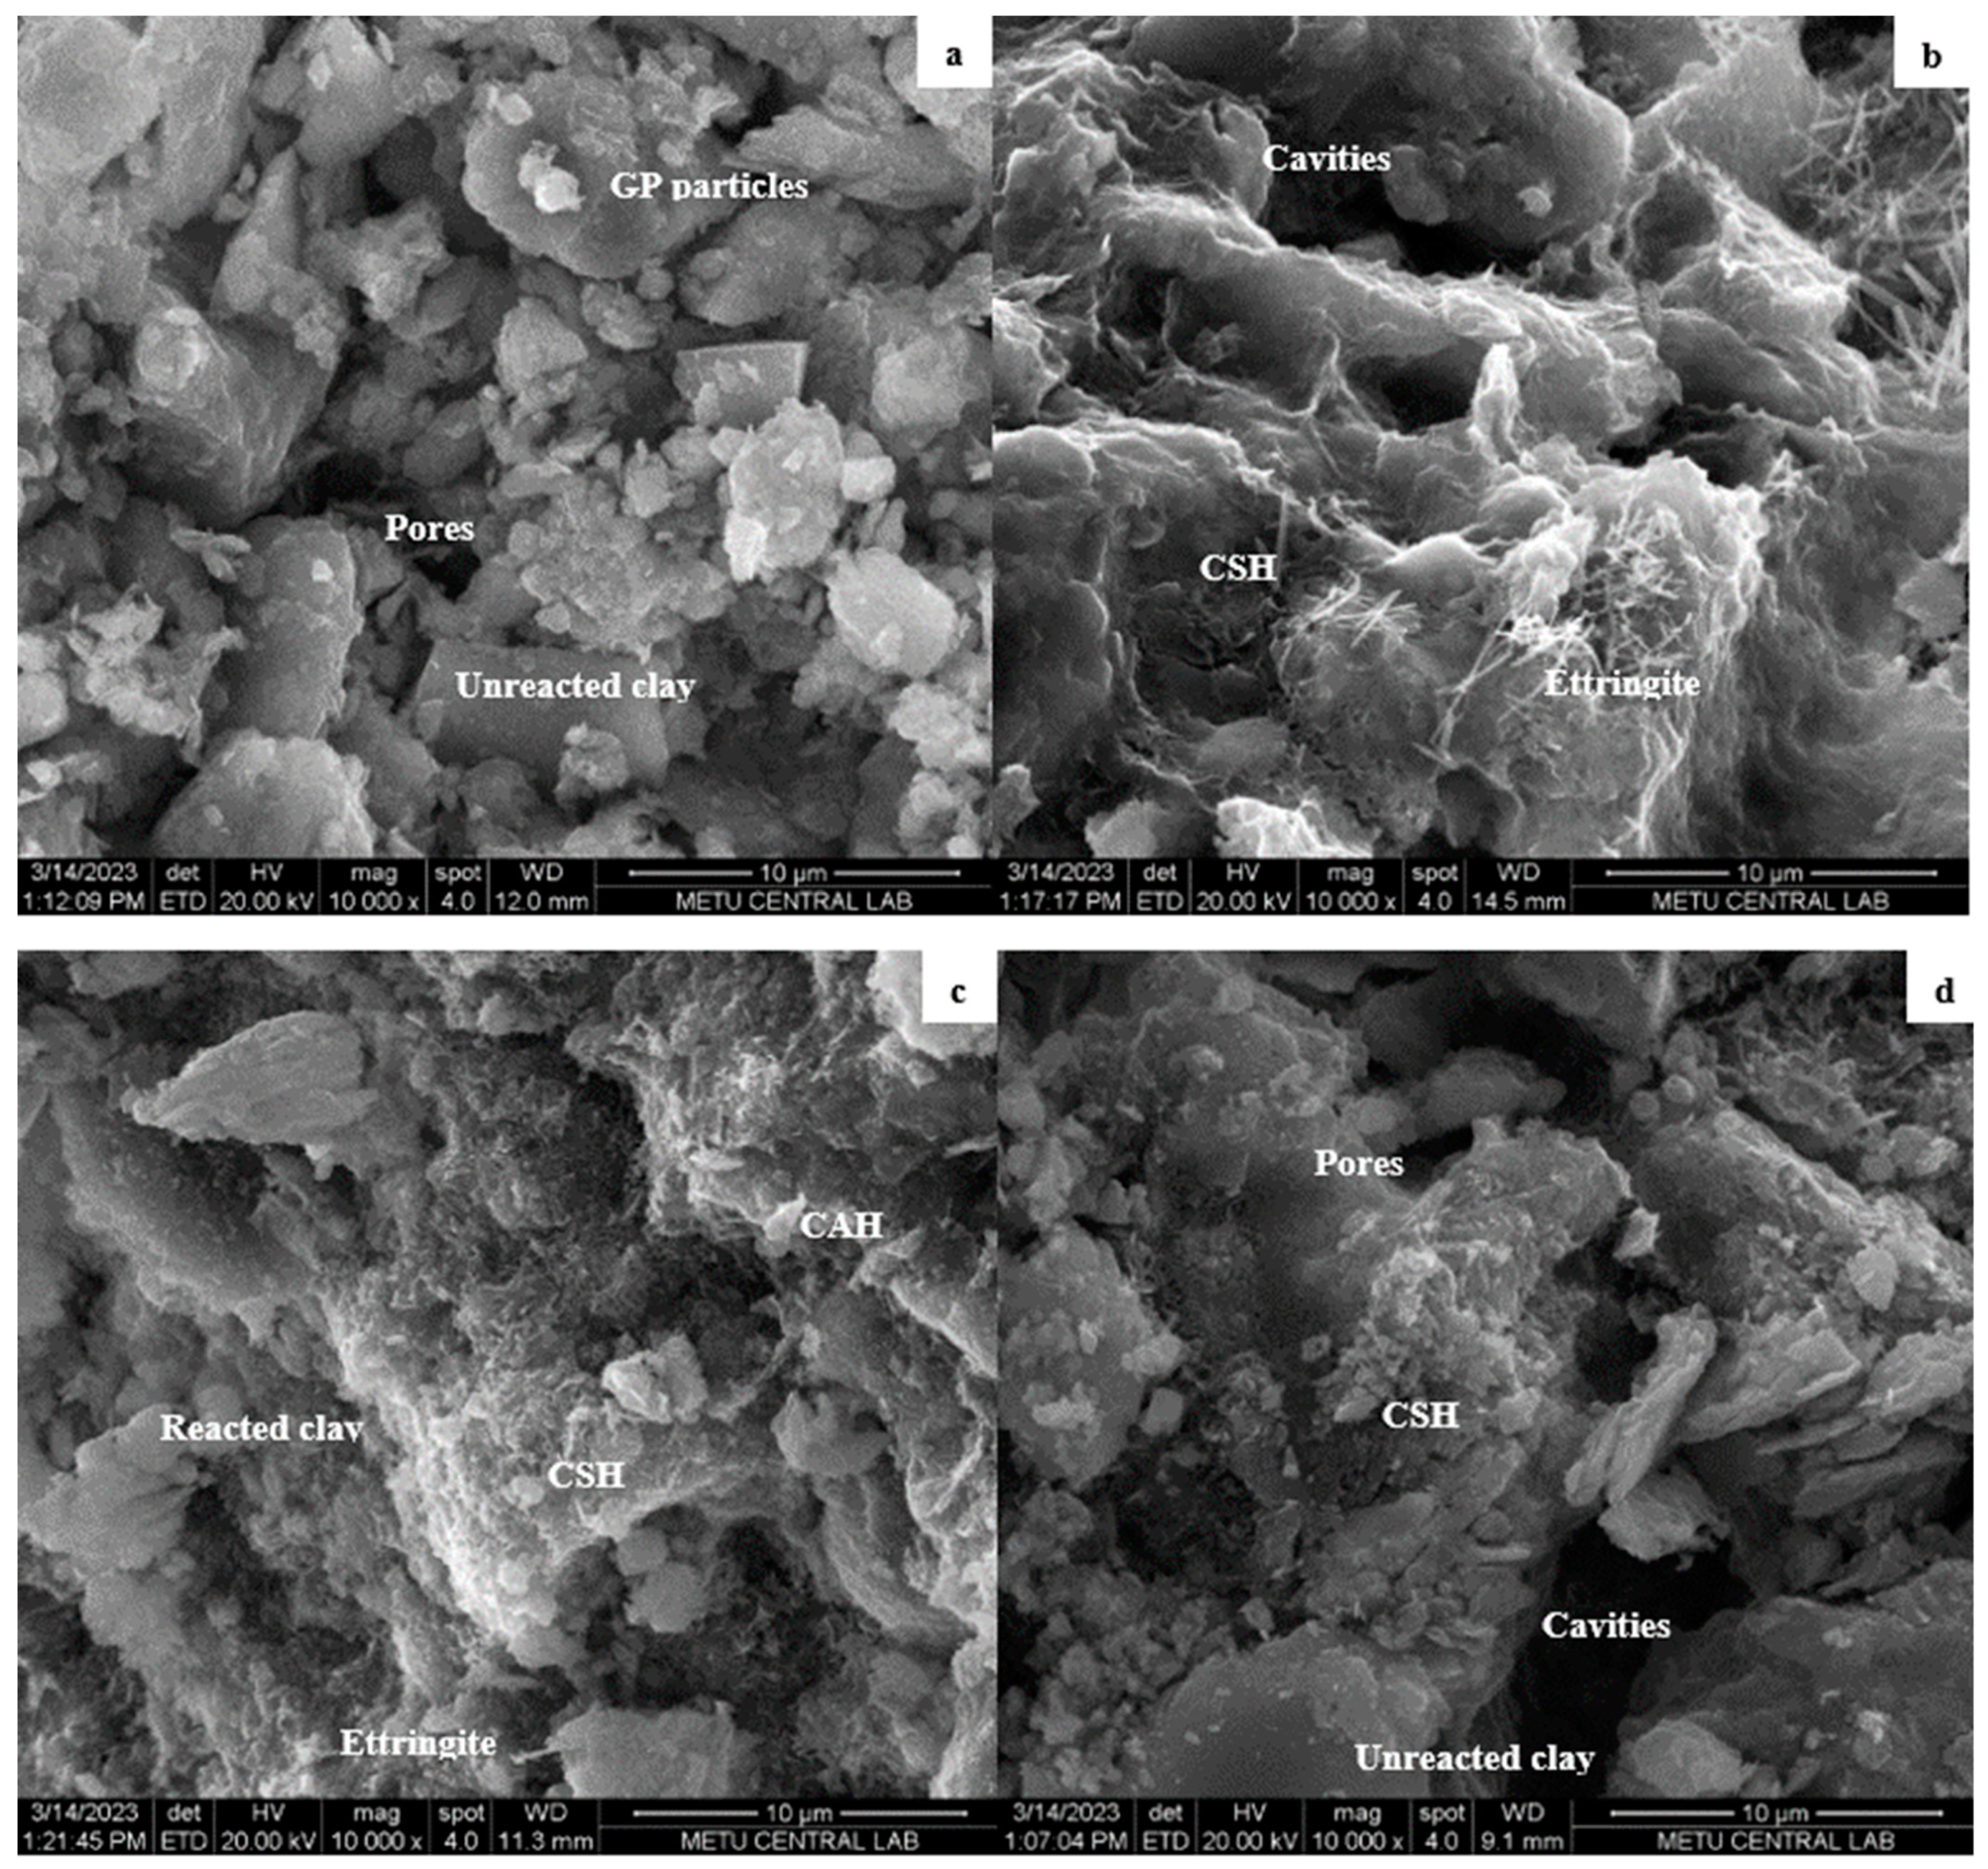
3.7. Microstructural Analysis

XRD and SEM analyses were performed to provide a comprehensive microstructural assessment in this investigation. Figure 9 presents the XRD findings, encompassing 12 distinct samples characterized by two levels of GP content (0% and 8%) and two gypsum content variations (5% and 15%) across curing durations of 7, 28, and 56 days, maintaining a density of 1700 kg/m3. The predominant phases identified in these samples are quartz (Q) and calcite (C), with silicon (Si) and alumina (Al) present as minor constituents. The reflections observed indicate the presence of smectite, illite, and a chlorite–kaolinite mix within the phyllosilicates, suggesting a complex mineralogical composition.
Notably, the XRD patterns exhibit a visible peak (silicon) between the two prominent peaks (quartz and calcite). This intermediary peak demonstrates an increasing trend from samples 1 to 3, shown in a red oval (Figure 9), with the extension of curing duration for samples lacking GP, whereas the converse is observed for samples containing GP from samples 10 to 12. This distinct variation is attributed to the heightened silicon concentration inherent in the glass powder. Across the 7- to 56-day curing period, a pronounced rate of pozzolanic reactions involving silicon was observed within the samples incorporating GP, explaining the observed trends in the XRD patterns.
The SEM microphotograph in Figure 10 illustrates a sample containing 15% gypsum content, subjected to a 28-day curing period, and without glass powder, showcasing crucial features influencing the strength properties of clay soil. Needle-like structures, representing ettringite, are observed alongside distinct aluminum phases and hydrated silicate identified as C-A-H and C-S-H, respectively [46]. These compounds, formed through chemical reactions with stabilizing agents, significantly enhance the engineering properties of clay soil. Ettringite plays a positive role in soil blends by forming a tough network that binds soil particles together, increasing the soil’s strength, stiffness, and erosion resistance. This network reduces the plasticity of clay soils, enhances their compaction, and improves their durability. C-S-H acts as a binding agent, creating a gel-like matrix that strengthens the soil and reduces its permeability. Moreover, C-A-H is a reinforcing element that strengthens the soil structure and facilitates pozzolanic reactions to generate additional cementitious compounds. The early arrangement of aluminum hydrates contributes to refining the composite’s porosity.
The series of microphotographs, shown in Figure 11a–c, systematically investigate the influence of varying curing durations on the observed structural changes. Evident within these microphotographs is a progressive increase of C-S-H, C-A-H, and ettringite with the increase in curing days. Specifically, Figure 11c exhibits an apparent reduction in porous structures, which is attributed to the hydration and crystallization processes. This results in a more closely packed and interconnected arrangement of calcite particles; a primary phase identified in the XRD analysis. Also, the sample with 8% GP (Figure 11c), shows differences in the texture of the ettringite and C-S-H gel formation, with fewer hollow structures than Figure 11d. The absence of GP in Figure 11d accentuates the noticeable cavities attributed to the lack of filler material, while unreacted clay particles remained unreacted. Nano-silica is a refined form of silica that improves the geotechnical properties of clay soil by making it easier for clay particles to stick together. This reduces the number of empty spaces between the particles without the need for pozzolanic reactions.
Figure 12a shows a big difference between a sample with the same additives cured for only 28 days (Figure 12b) and one cured for 56 days (Figure 12a). The difference is that the sample in Figure 12a has more pores and clear particle separation. This observation supports the different behavior exhibited in Figure 3c and Figure 4c. Specifically, the distinct soil structures shown in Figure 12b contribute to enhanced strength and are more significant than the sample in Figure 12a. Differences in soil structure and composition due to varying curing periods show their effects on strength and stiffness. This highlights a considerable association between curing time, soil microstructure, and the resulting mechanical behavior in specific blends.

4. Conclusions

The investigation focused on assessing the physical, mechanical, and microstructural alterations induced by varying proportions of GP (0%, 4%, 8%, and 12%) and sintered gypsum (0%, 5%, 10%, and 15%) at different curing durations (7, 28, and 56 days) and dry densities (1500 and 1700 kg/m3). The experimental program encompassed various tests, including UCS, wetting–drying cycle durability, UPV tests, and microstructural analyses via SEM and XRD.
  • The results showed strong relationships between the test variables and the samples’ strength and stiffness. The strength and stiffness of the clay specimens were continuously enhanced by increased density and gypsum content, which is notable. Conversely, the influence of glass-powder content exhibited a non-uniform behavior, where the addition of 12% GP emerged as a critical threshold, revealing an unexpected shift in the trend toward improved strength and stiffness features compared to lower GP percentages;
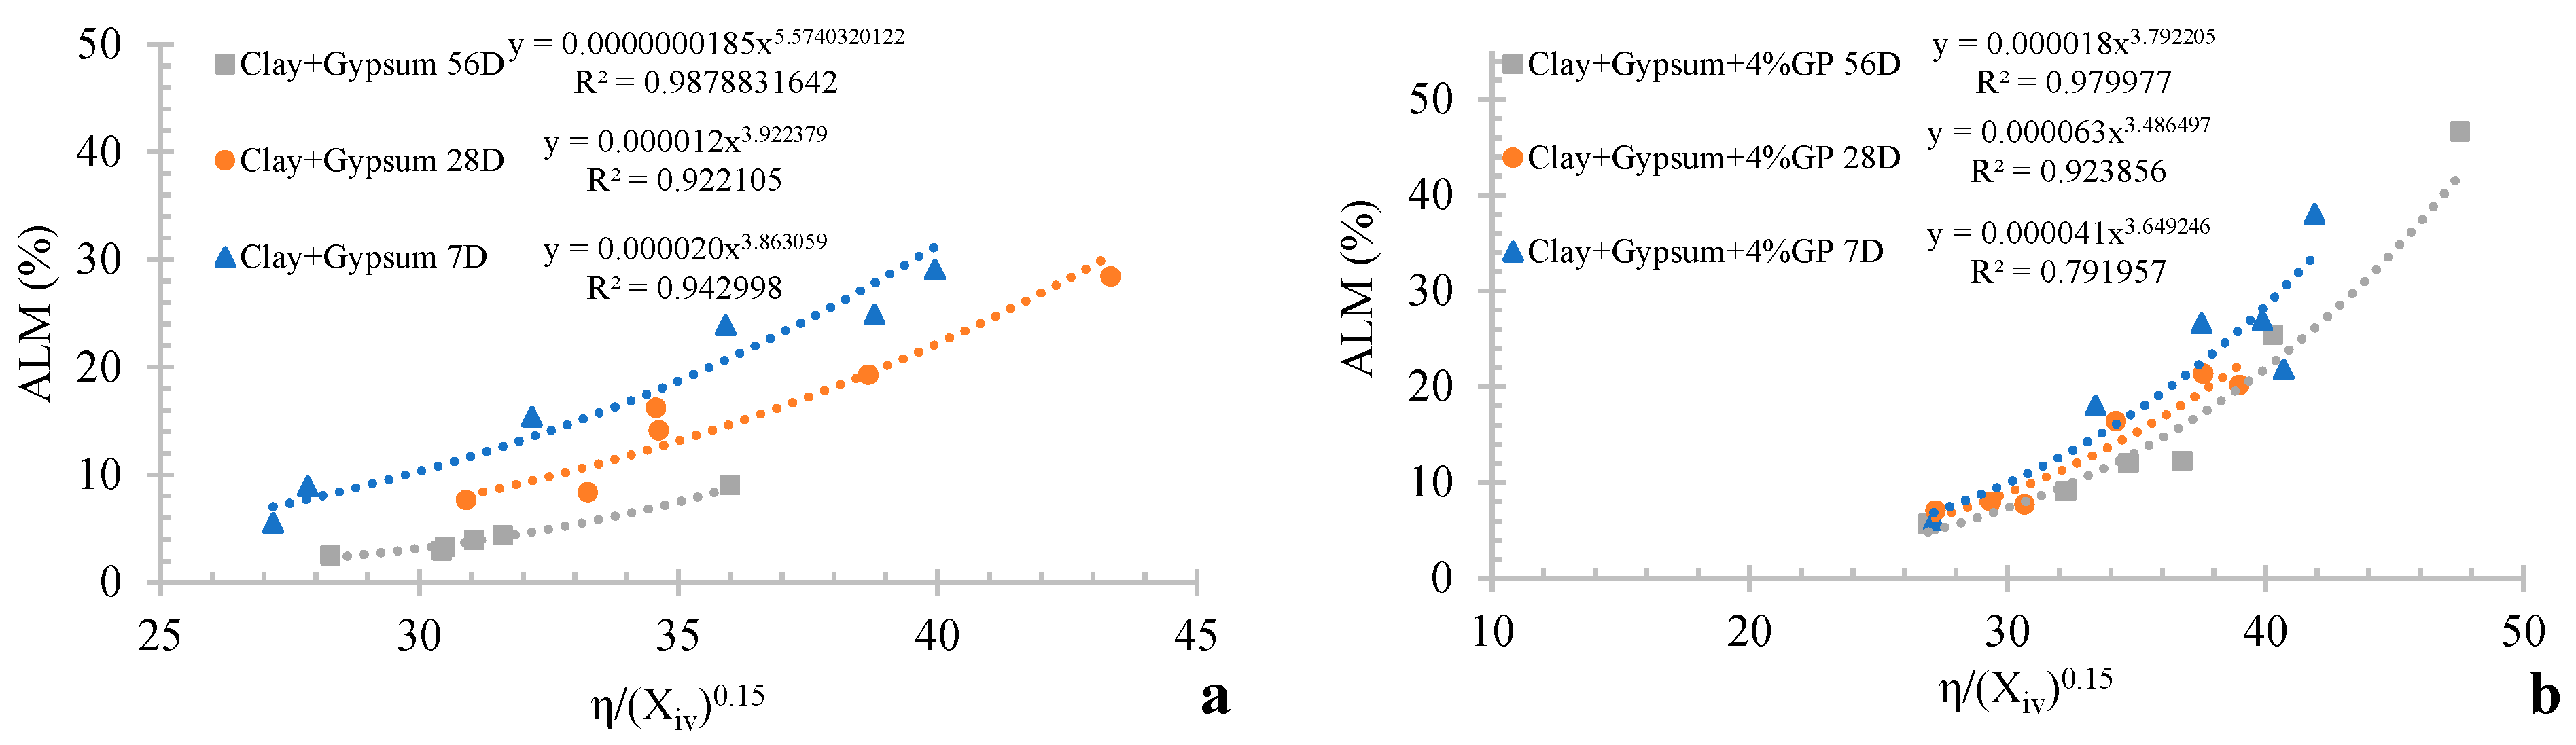
  • The study also found a strong link between the P/B index and UCS and G0. Normalization of the data enhanced the predictability of these properties, yielding valuable equations for predicting qu and G0 for specific clay blends and facilitating efficient material design and assessment. Additionally, the durability assessment revealed that low GP content aggravated the durability factor of the specimens. The worst GP content for durability was 4%, while an increase to 12% GP led to a slight decrease in porosity and improved durability. The generated equation for the ALM proved to be an accurate tool for predicting the ALM for varying additive contents;
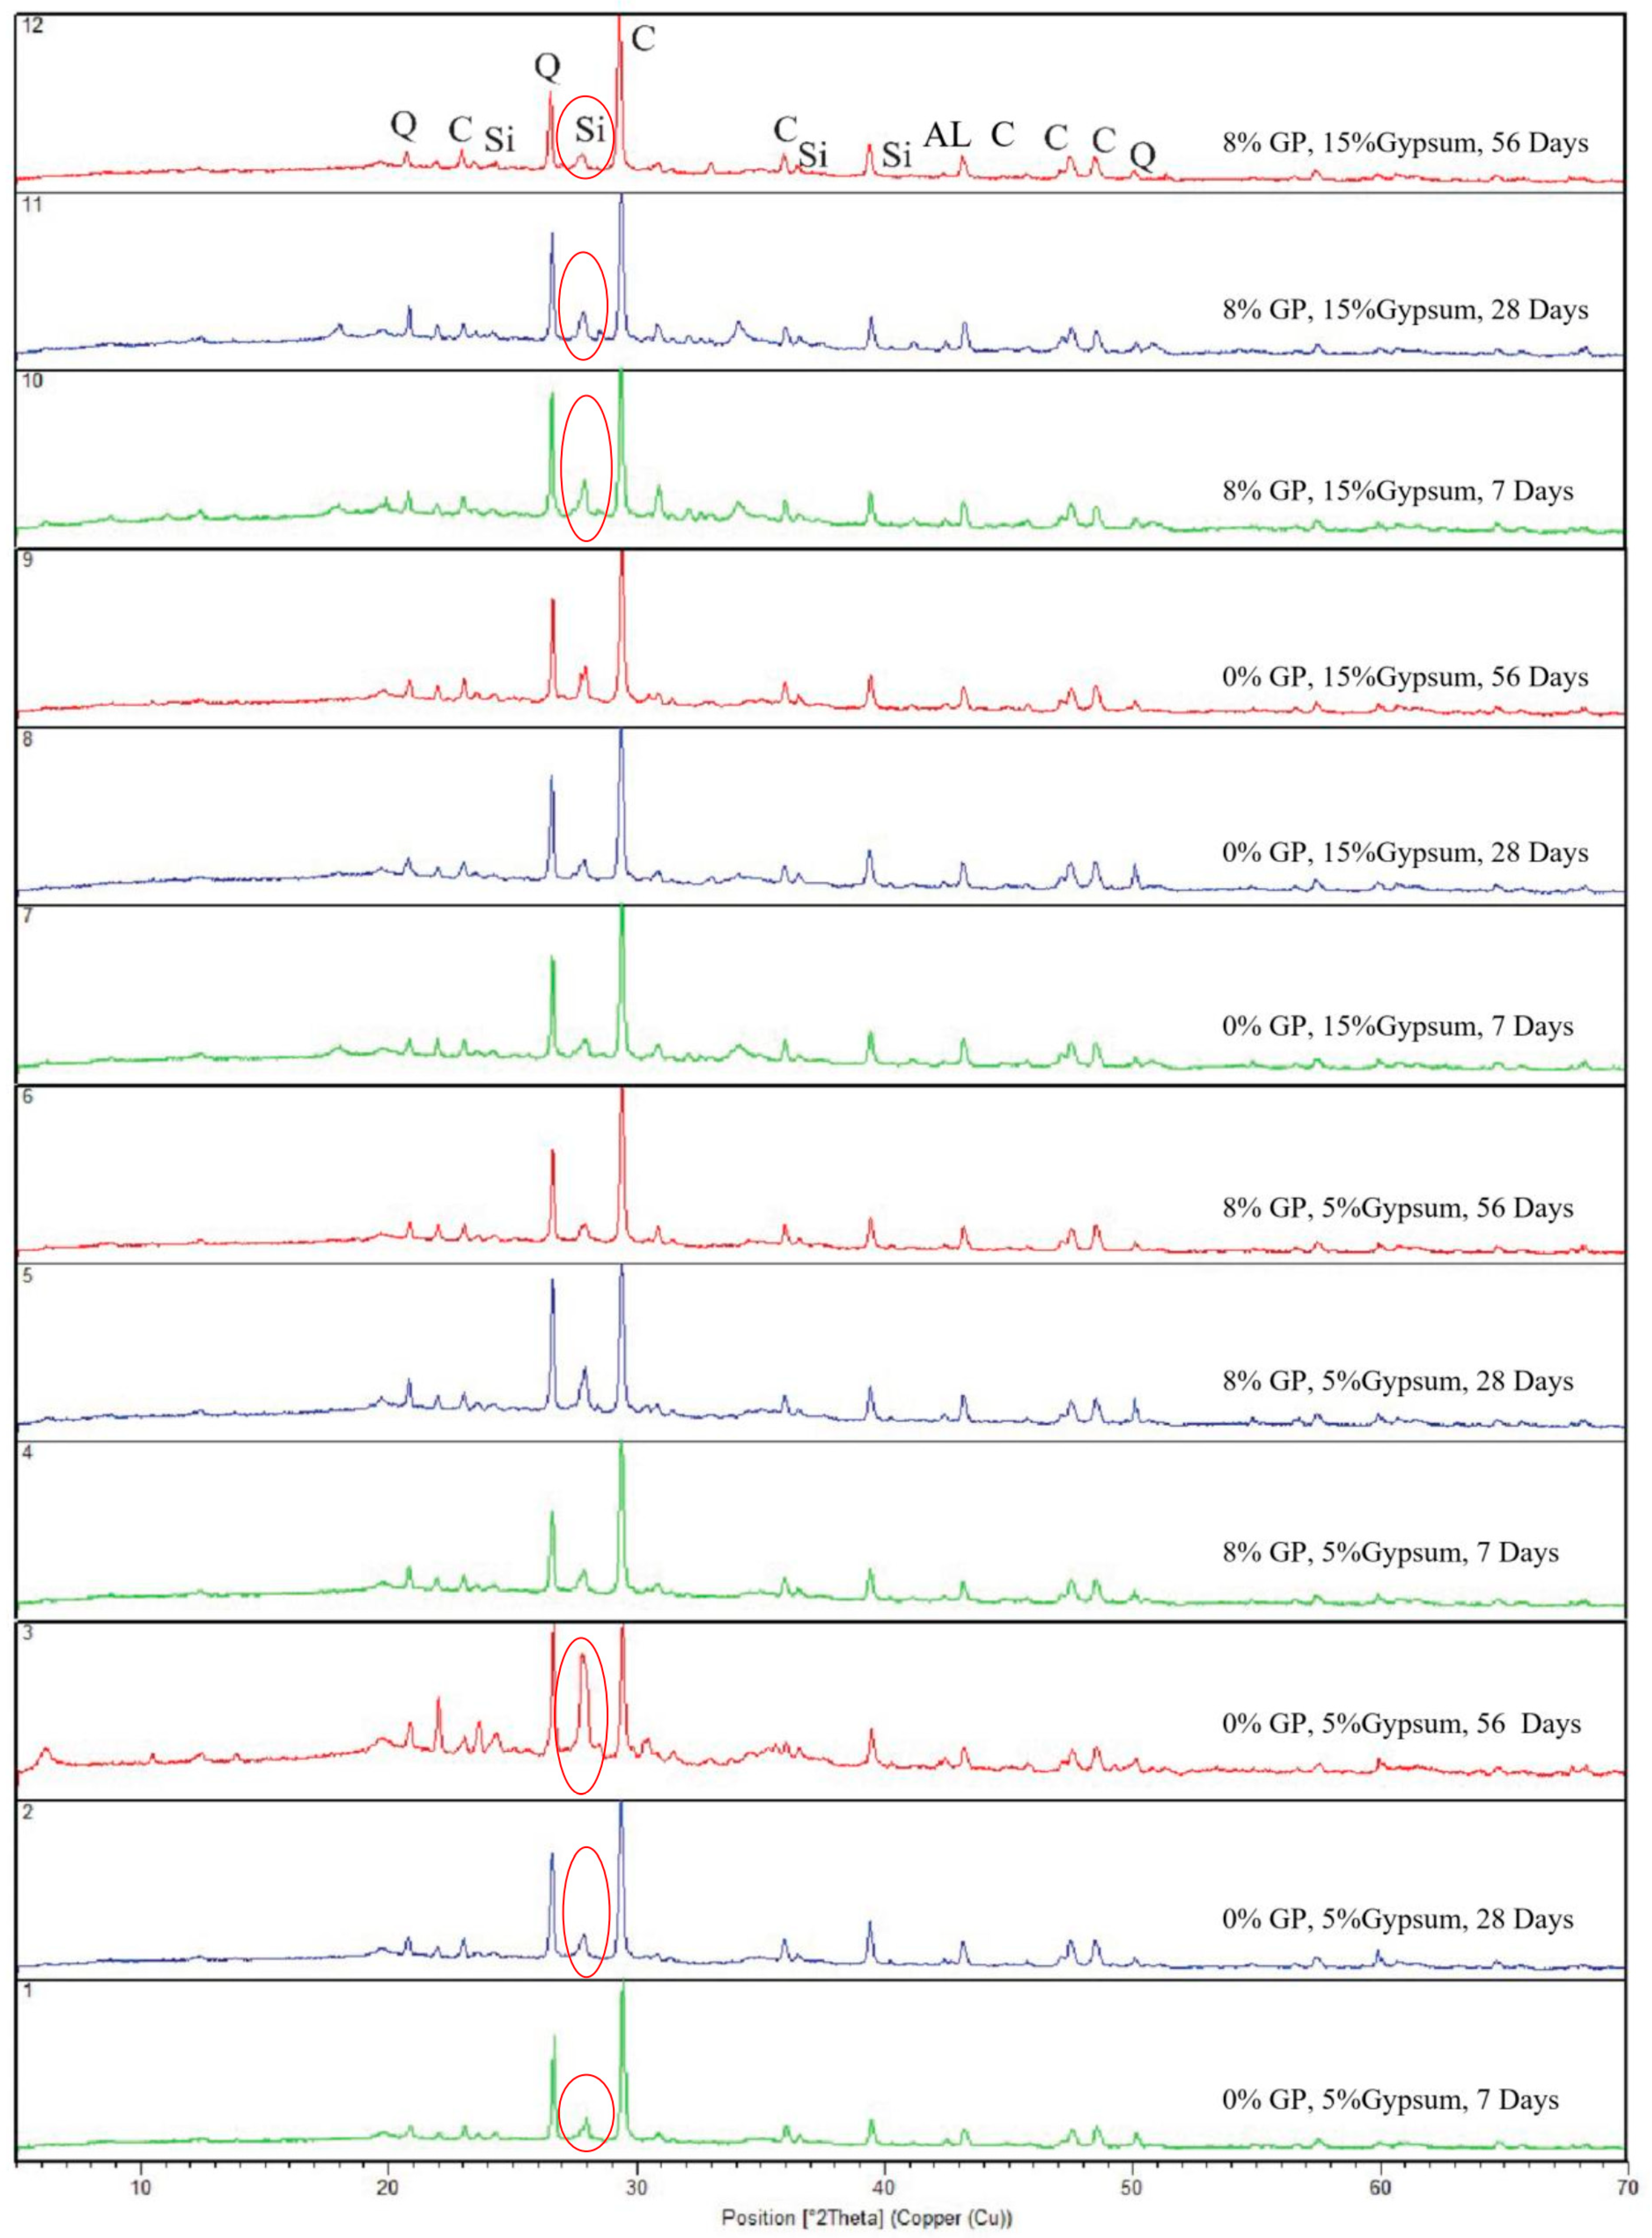
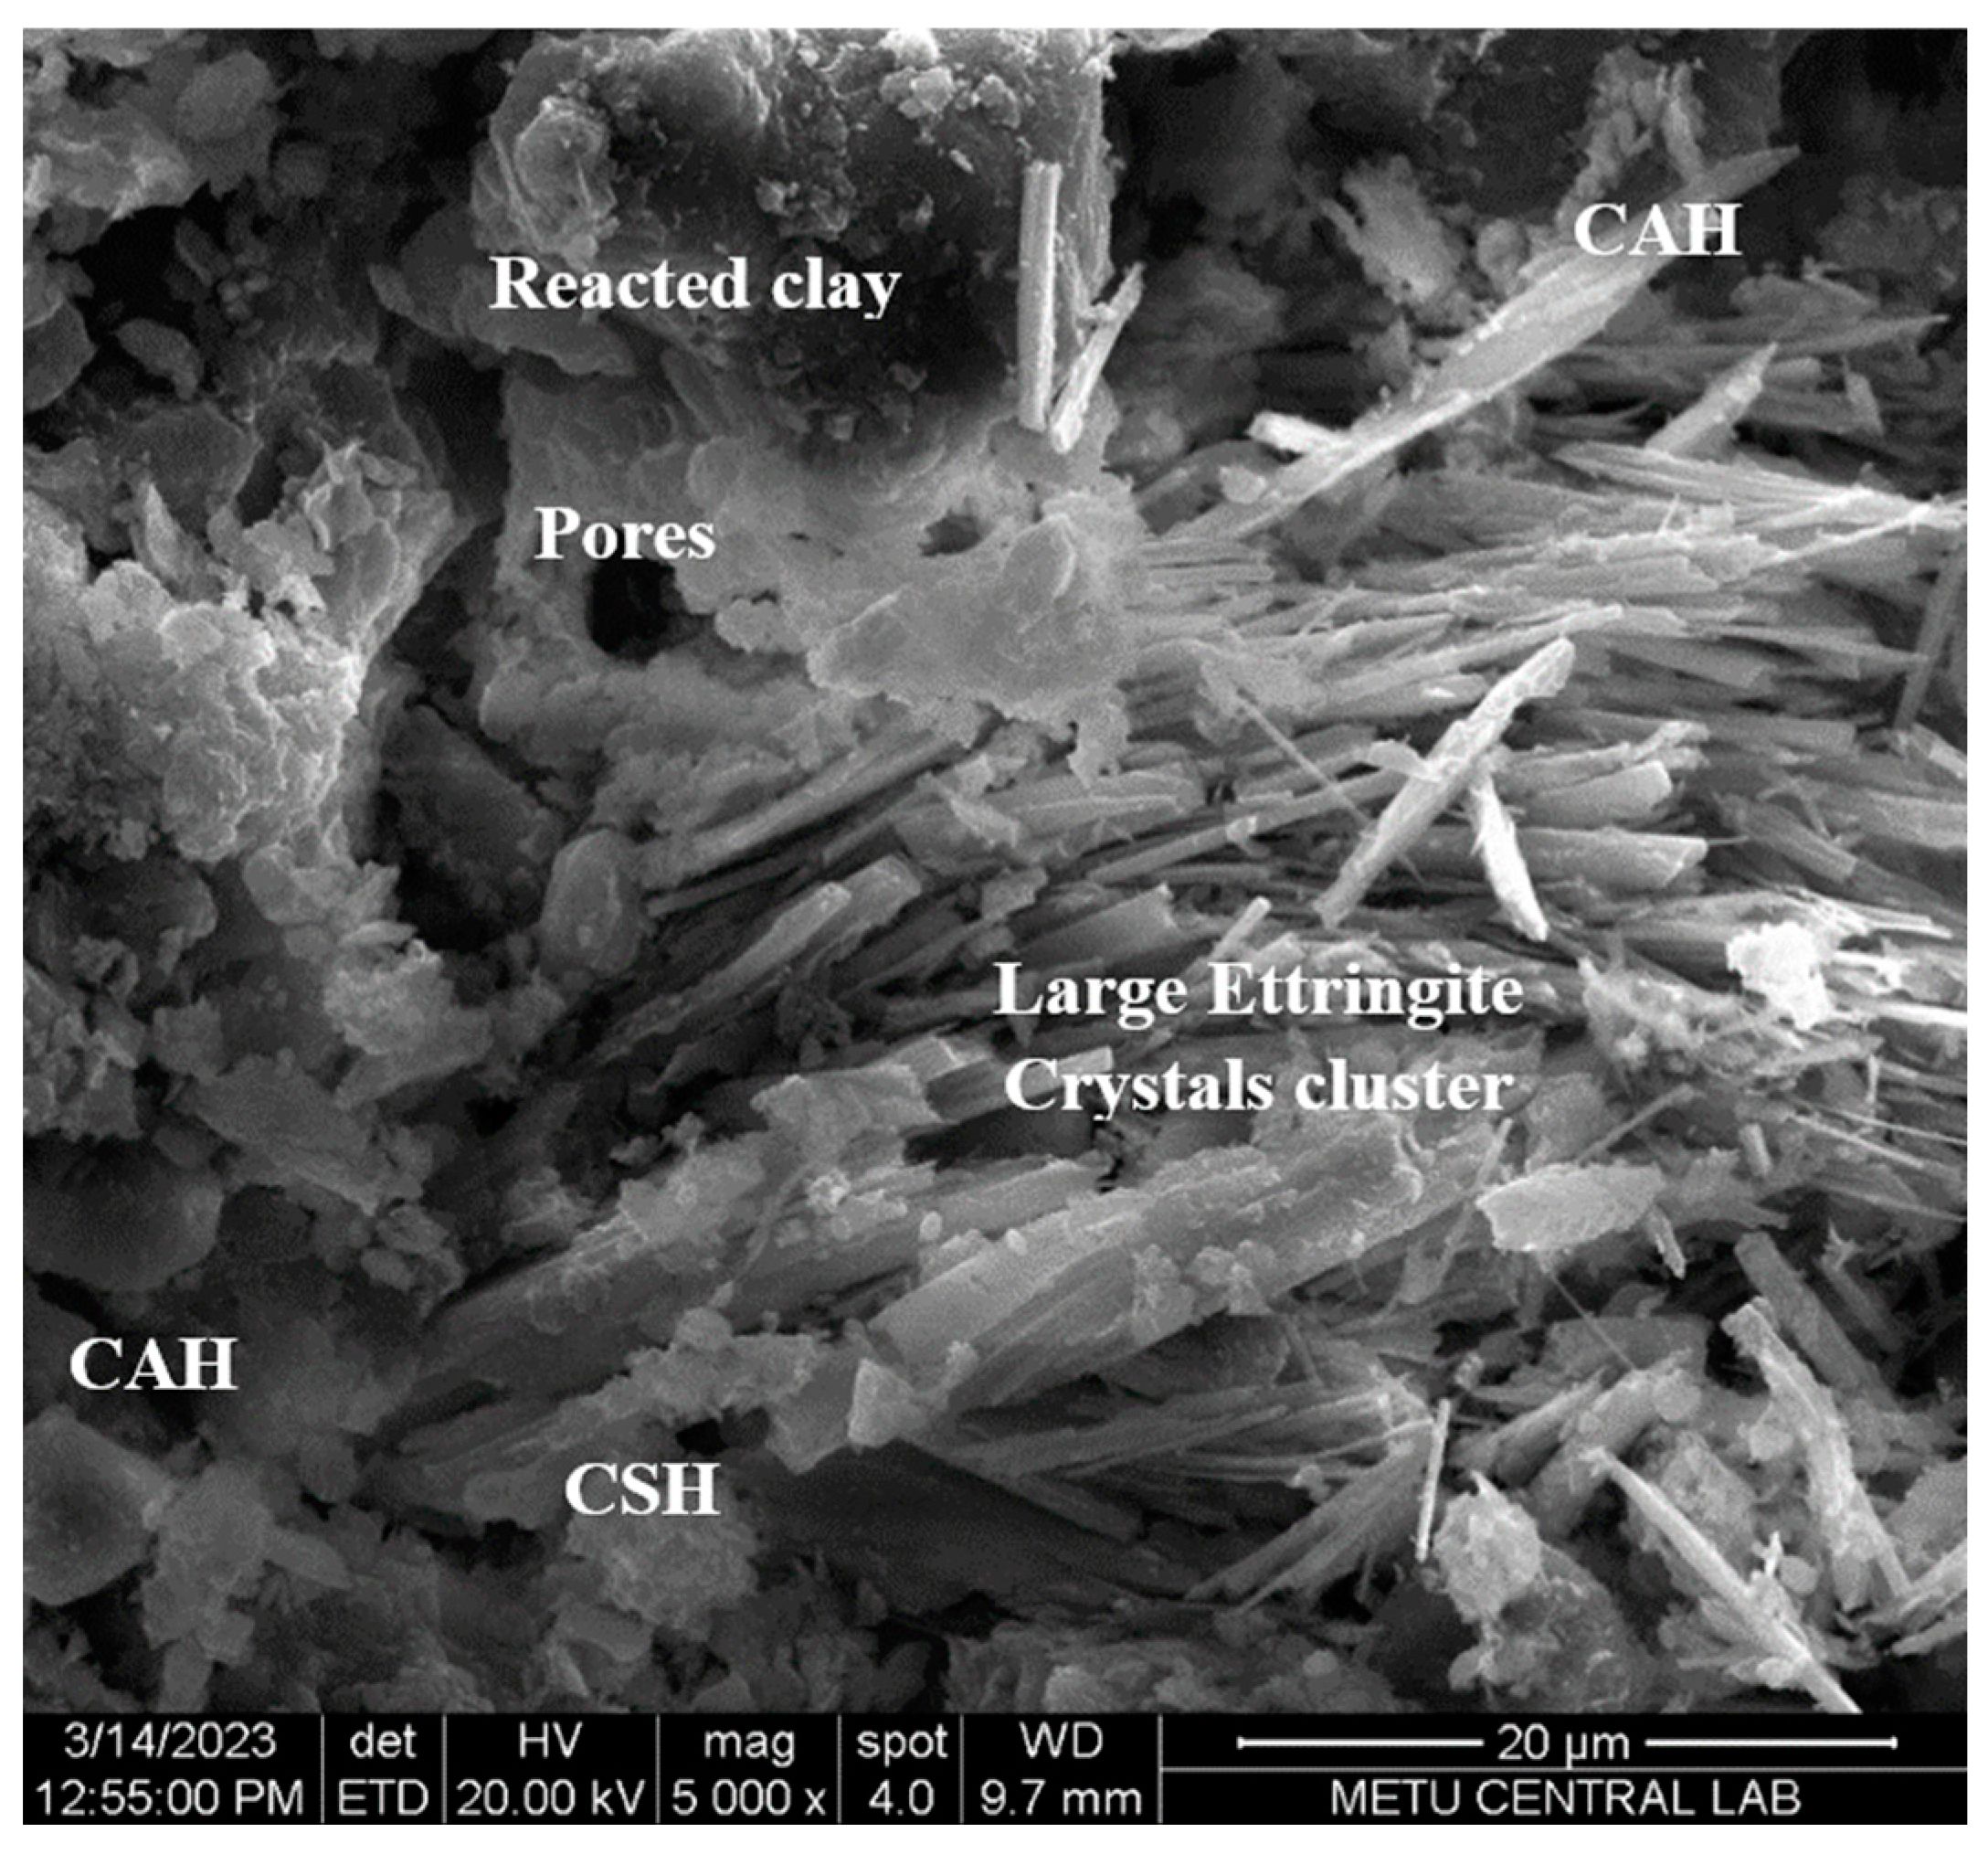
  • Microstructural analyses via SEM and XRD clarified critical insights into the pozzolanic reactions induced by GP and sintered gypsum. SEM microphotographs unveiled the formation of ettringite, C-A-H, and C-S-H compounds, contributing significantly to enhanced strength, stiffness, and erosion resistance in the treated samples. Moreover, microstructural analyses highlighted the pronounced impact of the curing duration on the soil’s structure, explaining its significant influence on mechanical behavior.
In conclusion, this comprehensive study demonstrated the significant potential of glass powder and sintered gypsum as effective additives for improving the geotechnical characteristics of clay soil. The research findings offer valuable insights into the intricate relationships between test variables, strength and stiffness features, and microstructural transformations, providing a foundation for informed material design and application in geotechnical engineering practices. The established correlations and predictive equations are practical tools for optimizing additive compositions and assessing the mechanical performance of clay-based materials in diverse construction applications. Ultimately, this study contributes to advancing sustainable practices by repurposing waste materials, especially from EoL PV panels, and developing innovation in geotechnical engineering.

Author Contributions

All authors contributed to the study’s conception and design. Material preparation, data collection, and analysis were performed by M.N. and A.E. The first draft of the manuscript was written by M.N. and A.I. and all authors commented on previous versions of the manuscript. All authors have read and agreed to the published version of the manuscript.

Funding

The authors express their appreciation to the Office of Research Coordination and Support, Middle East Technical University, Northern Cyprus Campus, for funding this research group. The Scientific Research Project Code is FEN-20-YG-4.

Informed Consent Statement

Not applicable.

Data Availability Statement

The data presented in this study are available on request from the corresponding author. The data are not publicly available due to safety concerns.

Acknowledgments

The authors greatly appreciate the discussions and help from Nilo C. Consoli from the Universida de Federal do Rio Grande do Sul.

Conflicts of Interest

The authors declare no conflicts of interest.

References

  1. Shin, J.; Park, J.; Park, N. A method to recycle silicon wafers from end-of-life photovoltaic modules and solar panels by using recycled silicon wafers. Sol. Energy Mater. Sol. Cells 2017, 162, 1–6. [Google Scholar] [CrossRef]
  2. Ardente, F.; Latunussa, C.E.L.; Blengini, G.A. Resource-efficient recovery of critical and precious metals from waste silicon PV panel recycling. Waste Manag. 2019, 91, 156–167. [Google Scholar] [CrossRef] [PubMed]
  3. Irena, I.P. End-of-Life Management: Solar Photovoltaic Panels; International Renewable Energy Agency: Masdar City, United Arab Emirates; International Energy Agency Photovoltaic Power Systems: Redfern, Australia, 2016. [Google Scholar]
  4. Mahmoudi, S.; Huda, N.; Alavi, Z.; Behnia, M. Material flow analysis of the end-of-life photovoltaic waste in Australia. DEStech Trans. Environ. Energy Earth Sci. 2018. [Google Scholar] [CrossRef] [PubMed]
  5. Fthenakis, V.M. Life cycle impact analysis of cadmium in CdTe PV production. Renew. Sustain. Energy Rev. 2004, 8, 303–334. [Google Scholar] [CrossRef]
  6. Fthenakis, V.M.; Moskowitz, P.D. Photovoltaics: Environmental, health and safety issues and perspectives. Prog. Photovolt. 2000, 8, 27–38. [Google Scholar] [CrossRef]
  7. Nieuwlaar, E.; Alsema, E.; Van Engelenburg, B. Using life-cycle assessments for the environmental evaluation of greenhouse gas mitigation options. Energy Convers. Manag. 1996, 37, 831–836. [Google Scholar] [CrossRef]
  8. Phylipsen, G.J.M.; Alsema, E.A. Environmental Life-Cycle Assessment of Multicrystalline Silicon Solar Cell Modules. Ph.D. Thesis, Department of Science, Technology and Society, Utrecht University, Utrecht, The Netherlands, 1995. [Google Scholar]
  9. Bang, Y.Y.; Hong, N.J.; Sung Lee, D.; Lim, S.R. Comparative assessment of solar photovoltaic panels based on metal-derived hazardous waste, resource depletion, and toxicity potentials. Int. J. Green Energy 2018, 15, 550–557. [Google Scholar] [CrossRef]
  10. Padoan, F.C.; Altimari, P.; Pagnanelli, F. Recycling of end of life photovoltaic panels: A chemical perspective on process development. Sol. Energy 2019, 177, 746–761. [Google Scholar] [CrossRef]
  11. Mahmoudi, S.; Huda, N.; Behnia, M. Critical assessment of renewable energy waste generation in OECD countries: Decommissioned PV panels. Resour. Conserv. Recycl. 2021, 164, 105145. [Google Scholar] [CrossRef]
  12. Li, G.; Zhu, R.; Yang, Y. Polymer solar cells. Nat. Photonics 2012, 6, 153–161. [Google Scholar] [CrossRef]
  13. Shen, P.; Bin, H.J.; Xiao, L.; Li, Y.F. Enhancing the photovoltaic performance of copolymers containing thiophene unit with D-A conjugated side chain by rational molecular design. Macromolecules 2013, 46, 9575–9586. [Google Scholar] [CrossRef]
  14. Kuttah, D.; Sato, K. Review on the effect of gypsum content on soil behavior. Transp. Geotech. 2015, 4, 28–37. [Google Scholar] [CrossRef]
  15. Saidate, I.; Rikioui, T. Stabilization of gypsum clay soil by adding lime. Civ. Eng. J. 2022, 8, 2511–2520. [Google Scholar] [CrossRef]
  16. Rai, A.K.; Singh, G.; Tiwari, A.K. Comparative study of soil stabilization with glass powder, plastic and e-waste: A review. Mater. Today Proc. 2020, 32, 771–776. [Google Scholar] [CrossRef]
  17. Tahmoorian, F.; Samali, B.; Yeaman, J.; Mirzababaei, M. Evaluation of the volumetric performance of asphalt mixtures containing recycled construction aggregate (rca). Int. J. Pavement Eng. 2022, 23, 2191–2205. [Google Scholar] [CrossRef]
  18. Gowtham, S.; Naveenkumar, A.; Ranjithkumar, R.; Vijayakumar, P.; Sivaraja, M. Stabilization of clay soil by using glass and plastic waste powder. Int. J. Eng. Tech. 2018, 4, 146–150. [Google Scholar]
  19. Khan, M.S.; Tufail, M.; Mateeullah, M. Effects of Waste Glass Powder on the Geotechnical Properties of Loose Subsoils. Civ. Eng. J. 2018, 4, 2044–2051. [Google Scholar] [CrossRef]
  20. Parihar, N.S.; Garlapati, V.K.; Ganguly, R. Stabilization of Black Cotton Soil Using Waste Glass. In Handbook of Environmental Materials Management; Hussain, C.M., Ed.; Springer International Publishing: Berlin/Heidelberg, Germany, 2018; pp. 1–16. [Google Scholar]
  21. Pourabbas Bilondi, M.; Toufigh, M.M.; Toufigh, V. Experimental Investigation of Using a Recycled Glass Powder-based Geopolymer to Improve the Mechanical Behavior of Clay Soils. Constr. Build. Mater. 2018, 170, 302–313. [Google Scholar] [CrossRef]
  22. Abhishek; Sharma, R.K.; Bhardwaj, A. Effect of Construction Demolition and Glass Waste on Stabilization of Clayey Soil. In Handbook of Environmental Materials Management; Hussain, C.M., Ed.; Springer International Publishing: Berlin/Heidelberg, Germany, 2019; pp. 87–94. [Google Scholar]
  23. Arrieta Baldovino, J.D.J.; dos Santos Izzo, R.L.; da Silva, É.R.; Lundgren Rose, J. Sustainable use of recycled-glass powder in soil stabilization. J. Mater. Civ. Eng. 2020, 32, 04020080. [Google Scholar] [CrossRef]
  24. Canakci, H.; Aram, A.L.; Celik, F. Stabilization of clay with waste soda lime glass powder. Procedia Eng. 2016, 161, 600–605. [Google Scholar] [CrossRef]
  25. Hassnawi, A.; Mahdi, Z.A.; Noor, S. Assessment of subgrade soil. Int. J. Civ. Eng. Technol. 2018, 9, 12–21. [Google Scholar]
  26. Babatunde, O.; Sani, J.; Sambo, S. Black cotton soil stabilization using glass powder. Int. J. Innov. Res. Sci. Eng. Technol. 2019, 8, 5208–5214. [Google Scholar]
  27. Al-Taie, A.; Yaghoubi, E.; Wasantha, P.L.P.; Van Staden, R.; Guerrieri, M.; Fragomeni, S. Mechanical and physical properties and cyclic swell-shrink behaviour of expansive clay improved by the recycled glass. Int. J. Pavement Eng. 2023, 24, 2204436. [Google Scholar] [CrossRef]
  28. Ibrahim, H.H.; Mawlood, Y.I.; Alshkane, Y.M. Using waste glass powder for stabilizing high-plasticity clay in Erbil city-Iraq. Int. J. Geotech. Eng. 2021, 15, 496–503. [Google Scholar] [CrossRef]
  29. ASTM D4318-17e1; Standard Test Methods for Liquid Limit, Plastic Limit, and Plasticity Index of Soils. ASTM International: West Conshohocken, PA, USA, 2017. [CrossRef]
  30. ASTM D854-14; Standard Test Methods for Specific Gravity of Soil Solids by Water Pycnometer. ASTM International: West Conshohocken, PA, USA, 2014. [CrossRef]
  31. ASTM D6913/D6913M-17; Standard Test Methods for Particle-Size Distribution (Gradation) of Soils Using Sieve Analysis. ASTM International: West Conshohocken, PA, USA, 2017. [CrossRef]
  32. ASTM D698-12e2; Standard Test Methods for Laboratory Compaction Characteristics of Soil Using Standard Effort (12,400 ft lbf/ft3 (600 kN-m/m3)). ASTM International: West Conshohocken, PA, USA, 2012. [CrossRef]
  33. ASTM C39/C39M-20; Standard Test Method for Compressive Strength of Cylindrical Concrete Specimens. ASTM International: West Conshohocken, PA, USA, 2020. [CrossRef]
  34. Selig, E.; Ladd, R. Preparing Test Specimens Using Undercompaction. Geotech. Test. J. 1978, 1, 16. [Google Scholar] [CrossRef]
  35. ASTM C511-19; Standard Specification for Mixing Rooms, Moist Cabinets, Moist Rooms, and Water Storage Tanks Used in the Testing of Hydraulic Cements and Concretes. ASTM International: West Conshohocken, PA, USA, 2019. [CrossRef]
  36. ASTM D1632_D1632M-07; Standard Test Methods for Compressive Strength of Molded Soil-Cement Cylinders. ASTM International: West Conshohocken, PA, USA, 2007. [CrossRef]
  37. ASTM D1633-17; Standard Test Methods for Compressive Strength of Molded Soil-Cement Cylinders. ASTM International: West Conshohocken, PA, USA, 2017. [CrossRef]
  38. Consoli, N.C.; Festugato, L.; Filho, H.C.S.; Miguel, G.D.; Neto, A.T.; Andreghetto, D. Durability assessment of soil-pozzolan-lime blends through ultrasonic-pulse velocity test. J. Mater. Civ. Eng. 2020, 32, 04020223. [Google Scholar] [CrossRef]
  39. ASTM D559; Standard Test Methods for Wetting and Drying Compacted Soil-Cement Mixtures. ASTM International: West Conshohocken, PA, USA, 2015. [CrossRef]
  40. Consoli, N.C.; Marques, S.F.V.; Floss, M.F.; Festugato, L. Broad-spectrum empirical correlation determining tensile and compressive strength of cement-bonded clean granular soils. J. Mater. Civ. Eng. 2017, 29, 06017004. [Google Scholar] [CrossRef]
  41. Filho, H.C.S.; Martins, C.G.; Menezes, R.J.W.; Dornelles, L.E.; Consoli, N.C. The effect of key parameters on the strength of a dispersive soil stabilized with sustainable binders. Geotech. Geol. Eng. 2021, 39, 5395–5404. [Google Scholar] [CrossRef]
  42. Hanafi, M.; Abki, A.; Ekinci, A.; Baldovino, J.D.J.A. Mechanical properties of alluvium clay treated with cement and carbon fiber: Relationships among strength, stiffness, and durability. Int. J. Pavement Eng. 2022, 24, 2094928. [Google Scholar] [CrossRef]
  43. Consoli, N.C.; Foppa, D.; Festugato, L.; Heineck, K.S. Key parameters for strength control of artificially cemented soils. J. Geotech. Geoenviron. Eng. 2007, 133, 197–205. [Google Scholar] [CrossRef]
  44. Ekinci, A.; Filho, H.C.S.; Consoli, N.C. Copper slag-hydrated lime portland cement stabilized marine deposited clay. Proc. Inst. Civ. Eng. Improv. 2019, 175, 1–30. [Google Scholar]
  45. Ekinci, A.; Hanafi, M.; Aydin, E. Strength, stiffness, and microstructure of wood-ash stabilized marine clay. Minerals 2020, 10, 796. [Google Scholar] [CrossRef]
  46. Wu, Z.; Deng, Y.; Liu, S.; Liu, Q.; Chen, Y.; Zha, F. Strength and micro-structure evolution of compacted soils modified by admixtures of cement and metakaolin. Appl. Clay Sci. 2016, 127, 44–51. [Google Scholar] [CrossRef]
Figure 1. Glass powder, sintered gypsum, and clay soil particle size distribution.
Applsci 14 04961 g001
Figure 2. Relationship between the studied properties and gypsum amount, glass powder, density, and curing: (a) UCS-gypsum, (b) UCS-glass powder, (c) UCS-curing days, (d) G0-gypsum, (e) G0-glass powder, (f) G0-curing days, (g) E-gypsum, (h) Es-glass powder, (i) E-curing days.
Applsci 14 04961 g002
Figure 3. The associations between the UCS and the modified P/B index for all curing durations and different amounts of sintered gypsum, with (a) 0% GP, (b) 4% GP, (c) 8% GP, (d) 12% GP for both samples’ dry densities.
Applsci 14 04961 g003
Figure 4. The associations between the G0 and the modified P/B index for all curing durations and different amounts of sintered gypsum with (a) 0% GP, (b) 4% GP, (c) 8% GP, (d) 12% GP for both samples’ dry densities.
Applsci 14 04961 g004
Figure 5. The relationships between the normalized UCS and the modified P/B index for all curing durations and different amounts of sintered gypsum with (a) 0% GP, (b) 4% GP, (c) 8% GP, (d) 12% GP, (e) all tested samples in one chart, and (f) all GP-improved samples with additives in one chart for both samples’ dry densities.
Applsci 14 04961 g005
Figure 6. The relationships between the normalized G0 and the modified P/B index for all curing durations and different amounts of sintered gypsum with (a) 0% GP, (b) 4% GP, (c) 8% GP, (d) 12% GP, (e) all tested samples in one chart, and (f) all GP-improved samples with additives in one chart for both samples’ dry densities.
Applsci 14 04961 g006aApplsci 14 04961 g006b
Figure 7. Correlation between (a) UCS and G0, (b) UCS and E, and (c) E and G0.
Applsci 14 04961 g007
Figure 8. The associations between the ALM and the modified P/B index for all curing durations and different amounts of sintered gypsum with (a) 0% GP, (b) 4% GP, (c) 8% GP, (d) 12% GP, (e) all GP-improved samples in one chart, and (f) all normalized ALM for GP-improved samples with additives in one chart for both samples’ dry densities.
Applsci 14 04961 g008aApplsci 14 04961 g008b
Figure 9. XRD results for tested samples’ GP content of 0 and 8 percent and gypsum content of 5 and 15 percent at different curing days, at a density of 1700 kg/m3.
Applsci 14 04961 g009
Figure 10. SEM photo of treated sample, which includes major structures.
Applsci 14 04961 g010
Figure 11. SEM microphotographs of samples with 8% GP and 15% gypsum content at (a) 7 curing days, (b) 28 curing days, (c) 56 curing days, and (d) samples with 0% GP and 15% gypsum content at 56 curing days.
Applsci 14 04961 g011
Figure 12. SEM photos for tested samples with 8% GP and 5% gypsum content at (a) 56 curing days and (b) 28 curing days.
Applsci 14 04961 g012
Table 1. Physical characteristics of clay soil, sintered gypsum, and glass powder.
PropertiesClaySintered Gypsum PowderGlass Powder
Consistency Limits (ASTM D4318-17e1) [29]
Plasticity index (%)26--
Liquid limit (%)46--
Specific gravity (ASTM D854-14) [30]2.662.332.64
Particle-Size Distribution (ASTM D6913/D6913M-17 [31]
D50 (mm)0.0050.11
Clay (diameter < 0.002 mm) (%)40--
Silt (0.002 mm < diameter < 0.075 mm) (%)54252.53
Fine sand (0.075 mm < diameter < 0.425 mm) (%)67525
Standard Compaction Characteristics
(ASTM D698-12e2) [32]
Maximum Dry Density (kg/m3)1700--
Optimum moisture Content (%)17--
Disclaimer/Publisher’s Note: The statements, opinions and data contained in all publications are solely those of the individual author(s) and contributor(s) and not of MDPI and/or the editor(s). MDPI and/or the editor(s) disclaim responsibility for any injury to people or property resulting from any ideas, methods, instructions or products referred to in the content.

