Article

Environmental Effects of Using Ammonium Sulfate from Animal Manure Scrubbing Technology as Fertilizer

Wageningen Environmental Science, Wageningen University & Research, P.O. Box 47, 6708 AA Wageningen, The Netherlands
*
Author to whom correspondence should be addressed.
Appl. Sci. 2024, 14(12), 4998; https://doi.org/10.3390/app14124998
Submission received: 3 May 2024 / Revised: 23 May 2024 / Accepted: 29 May 2024 / Published: 7 June 2024
(This article belongs to the Special Issue Bio-Based Products and Co-products Applications)

Abstract

:
Processed manure products have the potential to substitute chemical fertilizers and the use of these products may increase resource efficiency in the food system and decrease emissions of ammonia (NH3) and greenhouse gasses (GHG). The yields of maize and grass, as well as emissions, have been determined from a processed manure product: liquid ammonium sulfate from nitrogen stripping animal manure (AS), in comparison to a regular mineral fertilizer, calcium ammonium nitrate (CAN), in a greenhouse experiment and a field demonstration using a sandy and a clay soil. NH3 emissions were determined by comparing AS with a dairy manure as a reference. The yield of both crops, their nitrogen nutrient use efficiency (NUE), and nitrous oxide (N2O) emissions were not significantly different, while NH3 emission was lower from AS compared to the dairy manure. As a side-effect, the sulfur (S) contents of the grass in the fields fertilized with AS were much higher than in the non-fertilized control. We conclude that AS, produced here with a pH < 5.5, can be used as an alternative for CAN in Dutch dairy systems, or similar other system, if S leaching losses do not pose a problem for the environment. Meanwhile, care should be taken not to exceed S in feed above toxic levels for ruminants.

1. Introduction

Processed nitrogen products from livestock manure, so-called RENURE products (REcovered Nitrogen from manURE), have the potential to substitute chemical fertilizers, and, in combination with good agricultural management practices, these products might increase resource efficiency in food systems and decrease ammonia (NH3) and greenhouse gas (GHG) emissions [1]. One of these products is liquid ammonium sulfate (AS), which is produced by separating digested dairy slurry into a liquid and a solid fraction, and applying stripper/scrubber technology to the liquid fraction [2]. In the stripper, some of the ammonium in the solution is transferred to the air as ammonia by heating the digestate and/or by increasing the pH. In the scrubber, the ammonia is washed out of the air into a sulfuric acid solution, creating AS. Other fertilizers from this production process include the N-stripped liquid fraction, which is a potential K fertilizer but still contains organic nitrogen. Furthermore, the digestate is separated into a solid and liquid fraction by a screw press. The resulting solid fraction, rich in organic matter, can be processed further by extracting the P, resulting in a P-rich sludge fertilizer and a low-P organic fertilizer [3].
We assume that the use of processed manure products can balance N, P, and K fertilisation of the crop more than the original livestock manure [4]. However, it is not clear whether, and in what conditions, the processed manure products result in efficient fertilizers with low emissions. The efficiency of a nitrogen-delivering fertilizer is often tested by determining the nitrogen fertilizer replacement value (NFRV): an index that compares the effect of a fertilizer of interest on a crop to a well-known mineral N fertilizer [5,6]. The gaseous emissions of new fertilizers are often determined at multiple points in time. Subsequently cumulative N emissions per kg of N fertilized can be determined by the integration of the gaseous emissions over time and thus can be compared to fertilizers with well-known emission factors [7,8]. Another method to determine emission factors is to measure emissions continuously over time during a relevant period [9]. Our aim is to assess whether AS from processed manure has the same agronomic value as mineral nitrogen, for different soils and crops. Additionally, the effect of these fertilizers on GHG and NH3 emissions will be determined, since the carbon in AS can influence the GHG emissions [10], and the NH4 content of AS can influence NH3 emission [11]. The number of experiments conducted on these novel fertilizers is still limited [2,12]; although, AS and other nitrogen products from processed livestock manure are likely to be included in the Commission Directive (draft) amending Council Directive 91/676/EEC (European Nitrate Directive) as a specific nitrogen fertilizer that may be applied as substitute for mineral fertilizers up to 100 kg N ha−1 [13]. Our hypotheses are:
  • Ammonium sulfate from the manure stripping process (AS) has the same nitrogen use efficiency as mineral nitrogen fertilizer in a clay soil with a relative high pH (pH > 7) (20), and a sandy soil with a normal pH (pH < 7) (20), for maize and grass. Maize and grass are the relevant crops for livestock farming in The Netherlands.
  • NH3 and GHG emissions, in this research: methane (CH4) and nitrous oxide (N2O) are influenced by soil type, soil pH, and the fertilizers.
  • NH3 emissions of liquid ammonium sulfate obtained from processed manure are lower than for the original livestock manure, while the NH3 emissions from the remaining treated products (the solid fraction of the digestate and the stripped liquid digestate) are similar or slightly higher than the original livestock manure, resulting in the lower net emission of the processed products compared to the original manure.

2. Materials and Methods

2.1. Introduction

The AS was produced at the Arjan Prinsen Farm (APF), a dairy farm in Haarlo, The Netherlands, with about 60–80 cows and an anaerobic mono-digester for the dairy manure. The digested manure was separated by a screw press and the liquid fraction was further treated. Residual heat from the combined heat-and-power unit (CHP) was used to increase the temperature of the liquid digestate in the N stripper (45 °C) in order to promote NH3 transfer to the air. Concentrated sulfuric acid was used to recover the NH3 emitted from the liquid fraction of the digestate, according to methods described earlier [2]. The target pH for the AS product was <5.5, in line with the criteria developed for processed animal manure products (RENURE) [1,13].
Three experiments were performed: (1) a full factorial greenhouse experiment using two crops, maize and grass, and two soils, a sandy soil and a clay soil (Table A1, in Appendix A). Both the yield and gaseous emissions of the GHGs and the NH3 were measured, (2) a field demonstration with both crops (maize and grass) and both soils (clay and sand) focused on maize yields in 2021, and grass yields in 2022 on both soil types. GHG and NH3 emissions as well as the leaching of S were also measured, and (3) a sheltered flux chamber experiment was conducted to test the NH3 emission from AS.
In the greenhouse experiment and the field demonstration, AS was compared to calcium ammonium nitrate (CAN) (Table A2) at equal rates of N and S fertilization by correcting for the S content of CAN by supplementing it with gypsum. This resulted in S fertilization rates of 296–588 kg SO3 ha−1, depending on soil and crop (see Section 2.3, or Table A3), that are in exceedance of crop needs, but are excellent to test the applicability and safety of the AS. The greenhouse experiment was designed to test the nitrogen fertilizer replacement value (NFRV) [5]. The field demonstration was used to test the application of AS at a field scale and at a fertilization rate of 100% of the N fertilization advice, and therefore control plots were assumed to be less relevant. The method of application of the AS was liquid injection to approximately 5 cm soil depth, while the application method for CAN, a granular fertilizer, was broadcast spreading. We use CAN as a reference fertilizer as this is the most used N fertilizer in NW Europe.

2.2. Greenhouse Experiment

The greenhouse experiment was set up to determine the NFRV of AS (6% N, 7% S) for maize (Zea mays L.) and grass (Lollium perenne L.) on two soil types (sand and clay, both from Wageningen, The Netherlands): the soil types, coordinates and analysis are given in Table A4. Furthermore, 5 rates of fertilizer were used based on recommendations determined by routine soil analysis [14], including fertilization advice to farmers [15]. The routine laboratory (Eurofins Agro, Wageningen, The Netherlands) recommended a N fertilization rate of 120 kg of N ha−1 for grass (first grass cut) and 165 kg of N ha−1 for maize. Five fertilization rates were used in the greenhouse experiment: 0%, 50%, 75%, 100%, and 125% of Eurofins advice. CAN (26% N) was tested at all rates of fertilizer, AS was tested at 50% and 75% to focus on the fertilizer levels at which a fertilizer response is expected. Gypsum (24% S) was added to the CAN treatments to make the S dosage equal to that of the AS treatments (Table A5). The trial was performed in triplicate, which resulted in 84 pots. Both fertilizers were applied via low-emission methods respective to their type: CAN pellets via broadcast application and AS via injection. The soils were established and maintained gravimetrically at 60% water holding capacity by daily watering.
The samples of AS used for all the experiments were freshly obtained from APF and stored at 4 °C before use. The samples were analyzed by LUFA Nord West in Hameln, Germany, using methods given below in Table A2.
The grass was cut at 5 cm above the soil surface 23, 63 and 113 days after the fertilization. The maize was cut at 3 cm above the soil 41 days after fertilization. The fresh weight of the maize and each grass cut was determined, and the dry matter was determined after drying for 48 h at 70 °C. After the cuts, the plant samples were dried at 70 °C, and the N content of the dry matter was determined after digestion with H2SO4/H2O2/Se via SFA analysis [16], and the soil mineral N content (for methods see the footnote of Table A1) was determined after removing the plant roots.
The CH4 and N2O measurements during the greenhouse experiments were executed using a photo-acoustic infrared gas analyzer (Innova 1512, (LumaSense Technologies A/S, Ballerup, Denmark). CH4 and N2O were measured 10 times during the first 31 and 38 days after fertilization (for grass and maize, respectively). The pots were covered with a polyvinyl chloride (PVC) flux chamber, to create a closed headspace, 30 min before the measurement [17]: a flux chamber of 8 L and a height of 20 cm was used to completely enclose the grass and small maize plants. Cumulative emissions (over 31 (grass) or 38 (maize) days; in µg m−2) of N2O and CH4 were calculated according to the method [17], assuming linear emissions during the closure time and a soil surface area of 0.0314 m2 in the pot.
For the NH3 emission measurements, we used acid traps during the greenhouse experiment. To do so, extra pots were added to completely replicate all treatments. After a closure time of 10 days, these pots were discarded because of the potential damage to the plants resulting from the long closure period. Closed-chamber acid traps [18] were used to measure emissions of NH3 in the first 10 days after fertilization. The acid traps were changed twice, resulting in two measurements per pot over 10 days, and the total emissions across the two measurements were further analyzed for the results. For the measurement, a 100 mL vessel with 50 mL of 0.5 M H2SO4 was placed on the soil, and a PVC chamber (8 L) was placed over each pot. Each acid solution was analyzed after 1:10 dilution using automated segmented flow spectroscopy (SFA) [19]. The total NH3 emissions (g pot−1) were calculated by adding up the emissions from each of the measurements.

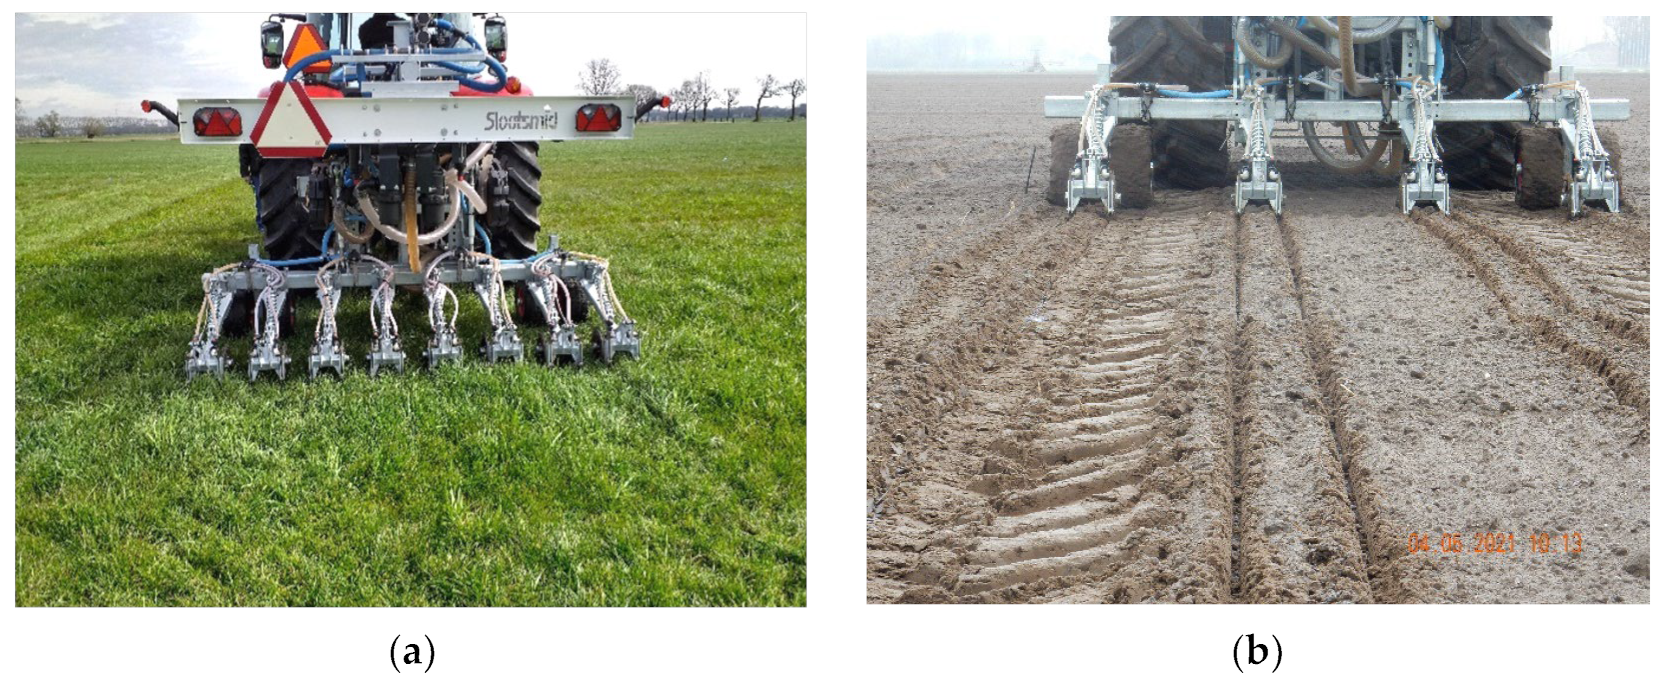
2.3. Field Demonstration 2021 and 2022

Three field demonstrations were performed: maize 2021, grass 2021, and grass 2022. Each was prepared in the spring of the corresponding year on a clay soil (Table A1), and on a sandy soil in Wageningen, The Netherlands. Fertilization advice was determined by Eurofins Agro and mineral N was measured prior to the experiment. Each field had 6 plots: 3 blocks and 2 randomized fertilizer treatments per block. Fertilizer treatment 1, AS, consisted of the N-stripped product (6% N, 7% S), while treatment 2, CAN + S, consisted of a combination of a S containing CAN (Triferto, Doetinchem, The Netherlands; Novasul 23% N, 7% S), and gypsum (Triferto, The Netherlands (gypsum, 24% S)); a combination designed to make the total S dosage equal to the AS treatment. The AS used in 2022 was slightly more concentrated, with 7% N and 8% S (Table A2). The AS was applied using a low-emission technique from Slootsmid (Borculo, The Netherlands): application of the liquid AS was carried out by its placement in shallow vertical slots about 5 cm deep, cut into soil by a disc, and each application unit consisted of two discs and injectors. The distance between the maize seeds (Zea mays L., cv Ronaldinio) was 75 cm (100,000 seeds per ha), and the AS was injected at 7 cm from both sides of the maize seeds. The distance between the application units in grass was 25 cm and it was 75 cm in maize (Figure A2). In the 2022 grass demonstration, one additional control plot was added to both fields. Each plot was 10 m × 9 m. Weed control was applied to all maize plots by standard methods. No irrigation was used as there was sufficient precipitation during the experiment. The soil used for the maize was tilled in the spring and was seeded with the guidance of GPS. The grasslands were existing grasslands used by farmers with swards dominated by Lolium perenne L.
Maize was harvested in September of 2021 using a forage harvester (New Holland, Torino, Italy, 1770). The fresh yield was determined per two rows of maize, a random sample was taken for dry matter content and chemical analysis. After cutting the maize, all plots were sampled in November 2021 for soil mineral N, and soil density on the basis of soil organic matter, to calculate mineral N of the 0–90 cm soil layer per hectare.
In 2021, the first grass cut was in early June using a Haldrup forage harvester (Notec Engineering GmbH, Ilsenhofen, Germany), no second cut was harvested due to a mistake in the second fertilization (incorrect fertilization treatments). In 2022, there were two cuts (May and June), after which the experiment was stopped because sulfur was only added in the first two fertilizations to mimic agricultural practice. In NW Europe, ammonium- and sulfate-rich fertilizers are specifically used in spring when soil mineralization is relatively low. For each of these grass cuts, fresh grass matter was determined directly; a random subsample was taken to determine dry matter content.
Chemical analysis of the grass and maize was performed on samples dried at 70 °C, including a determination of the water content (70 °C–105 °C). Total N and P were determined using SFA, after digestion with H2SO4/H2O2-Se, and total Ca, K, Mg, N, and S were determined using ICP-OES analysis after microwave digestion with HNO3-HCl-H2O2 [16]. Soil mineral N was only measured following the conclusion of the field demonstrations, including plant available S (0.01 M CaCl2 according to [20]) after the 2022 field demonstration.
The N2O measurements during field demonstrations were only performed in 2022, and were similar to the measurements in the greenhouse. N2O emissions were measured repeatedly following the first fertilization using the Innova gas analyzer in the same manner as described for the greenhouse experiment, except that the PVC tube was pressed into the grass sod. There was also a zero measurement a few weeks prior to the first fertilization. On the AS field, N2O measurements were measured at two locations within the plot: (1) on top of the injection strokes, and (2) in between the injection strokes. On the CAN plots, two random locations were chosen, since this fertilizer is spread and not injected. The N2O emissions were measured 5 times over 36 days after fertilization.
In order to determine whether the excess nitrogen and sulfate is lost by leaching, the soils were sampled on 21 June 2022, after the second grass cut, for 0–30, 30–60 and 60–90 cm below surface level to determine extractable nitrate, ammonium and sulfate [20] and soil organic matter (loss of ignition) to calculate the volume weight of the soil layers.

Statistics

As in the yield experiments, maize and grass were tested separately. Linear models and ANOVA tests were used for all measures.
For the field demonstration, maize and grass were tested separately for each trial, and treatments that were not fully balanced or replicated were left out of the statistical tests. This means that there was no control treatment in the field trials, so the results of the field trial should mainly be considered as supportive of the greenhouse trial. Linear models were followed by an ANOVA test and least squares differences (LSDs) tests were used to determine statistically significant treatments.

2.4. Sheltered Flux Chamber Experiment

Ammonia emissions from fertilized grassland were studied using transparent cylindrical chambers (inside ⌀ 24 cm, height 32.6 cm), filled with grass sods in each chamber, located in a plastic film tunnel greenhouse that was open on both sides. The cumulative ammonia emissions of multiple products from APF were determined using a method in which 2 L of air above each grass sod was drawn at a flow rate of 2 L per minute per chamber through acid trap solutions consisting of 100 mL of 0.05 M H2SO4, using methods described earlier [21]. Approximately two weeks before the start of the 1st and 2nd experiment on 23 November and 7 December 2023, respectively, the grass sods were taken from an unfertilized patch of grassland, near to the location of the field demonstration with grass on sand in 2021 and 2022 (Table A1), and placed in standard pots (outside ⌀ 24 cm, height 14 cm), filled up to a height of 13 cm (excluding grass), that were placed inside transparent cylindrical chambers (⌀ 25 cm, wall thickness 5 mm, height 25 cm). Due to a lot of rain falling during the month of November 2023, the amount of water in the freshly sampled soil, including grass sods, was at field capacity.
The tested products from the APF were: untreated cattle slurry (CS) and AS resulting from stripping the liquid fraction of CS, sampled on 27 October 2023 (composition, Table A6). The compositions of the AS and CS were determined at LUFA Nord West in Hameln, Germany (for methods, see the footer of Table A2). An amount of 8 mL of CS or 7 mL of AS, both equal to 100 kg of N ha−1 (453 mg of N per chamber of 0.032 m2) were added to three chambers on day 0 (23 November 2023). Two reference chambers were used without a fertilizer. The emissions from all chambers were determined before the fertilization after 4 days, resulting in limit of quantification (LOQ) for this method when assuming ten times the standard deviation of these blank measurements: 0.05 mg of N. The acid trap solutions of 0.05 M H2SO4 were sampled, weighed, and replaced by fresh solutions after 1, 4, 8 and 15 days. Each acid solution was analyzed for NH4 using automated segmented flow spectroscopy (SFA) (ISO/TS-14256-1, 2003) [19] without dilution. The amount of NH4 in the acid solution was multiplied with the weighted volume of around 100 mL, this gave the emissions for the amount of time that it was exposed to the acid. The sum of the sampled solutions gives the cumulative NH3 emissions per product per 15 days (total time measured). The cumulative emissions were calculated per total ammoniacal nitrogen (TAN): the NH4 content of cattle slurry (CS) and AS, as given in Table A6. The 1st experiment was discontinued after 5 days when the temperature fell below freezing during the night, for which the glassware had to be emptied. The 2nd experiment started a week later (7 December 2023). Due to time limitations, the flux chamber experiment does not exactly match the greenhouse and field experiments since the experiment solely included a grass crop on sandy soil. Moreover, NH3 emissions were tested with CS as a reference and not CAN because NH3 emissions from CAN are often very low [22] while the NH3 emissions from cattle manure are high and often used as a benchmark [23,24].

3. Results

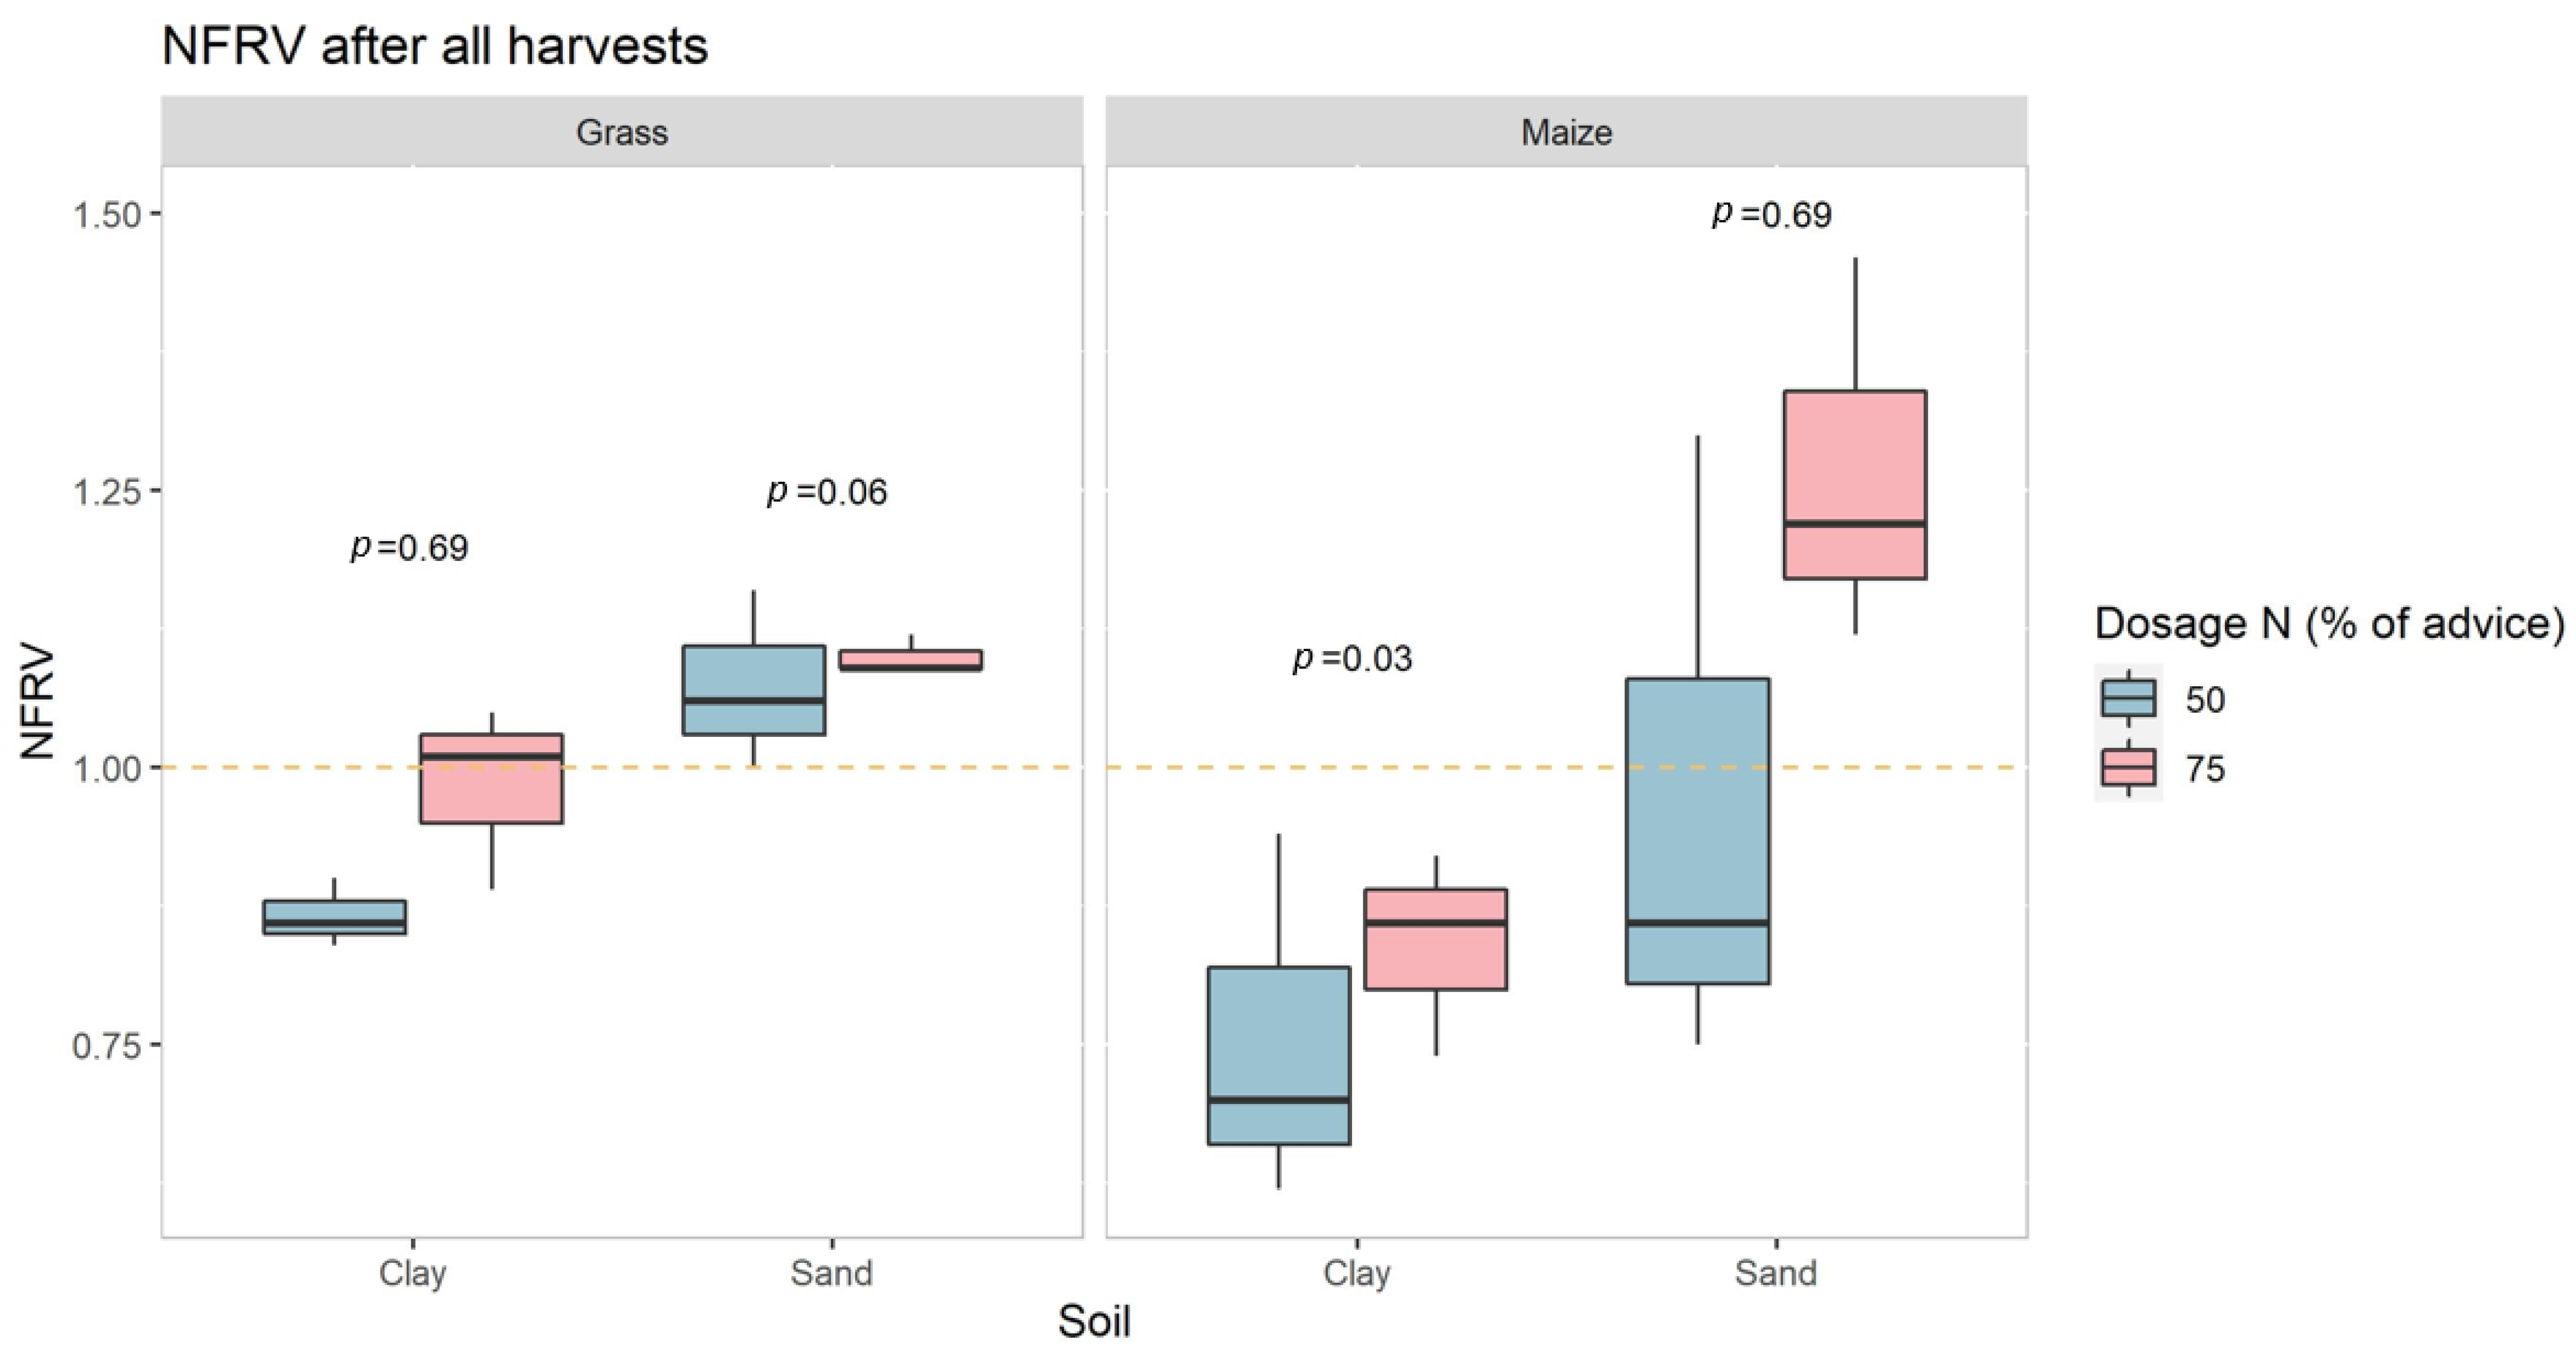
3.1. Greenhouse Experiment, Yield and N Uptake

The results of the greenhouse experiment showed no significant effect of replacing CAN with AS on the dry matter yield of grass, except for in the 75% N dosage, where yield losses of 11.5% on sand and 13.7% on clay were observed compared to the 100% treatment (Figure 1 top). For the crop N uptake of the grass, the fertilizers showed a significant interaction effect with the soil, which can be seen in the 50% treatment on clay from the LSD groupings (Figure 2 top), though fertilizer alone was not significant. These results imply there may be a small effect on the dry matter yield of grass, but there is no evidence for reduced quality at the higher N dose.
The dry matter yield of maize showed no significant effect of fertilizer (Figure 1 bottom), but crop N uptake had a significant effect from fertilizer and the interaction of soil and fertilizer (Figure 2 bottom). This particularly affected the 75% dosage of maize on clay soil (Figure 2 left). This implies that the quality of maize might be slightly reduced by the use of AS, but there is no evidence for this affecting the dry yield.
Figure 3 shows the NFRV results and significance test (a sign test of values combining the 75% and 50% treatments, but the crop–soil combinations were tested separately). The NFRV of AS was only significantly different from CAN for maize on clay, where it was 0.75 for the 50% dose and 0.84 for the 75% dose (standard deviations of 0.17 and 0.92, respectively). This is supported by similar results from the linear models, where the fertilizer showed an effect on maize N uptake, especially on clay soil.
The remaining amounts of mineral N in the soil at the end of both the grass and maize greenhouse experiments were very low, near or below the detection limit of 0.9 mg of N kg−1). This leads to the conclusion that all available N was fully utilized for plant growth or lost via gaseous emissions after fertilization. The possibility of gaseous losses is further examined in Section 3.2, Section 3.3 and Section 3.4 on environmental monitoring campaigns.

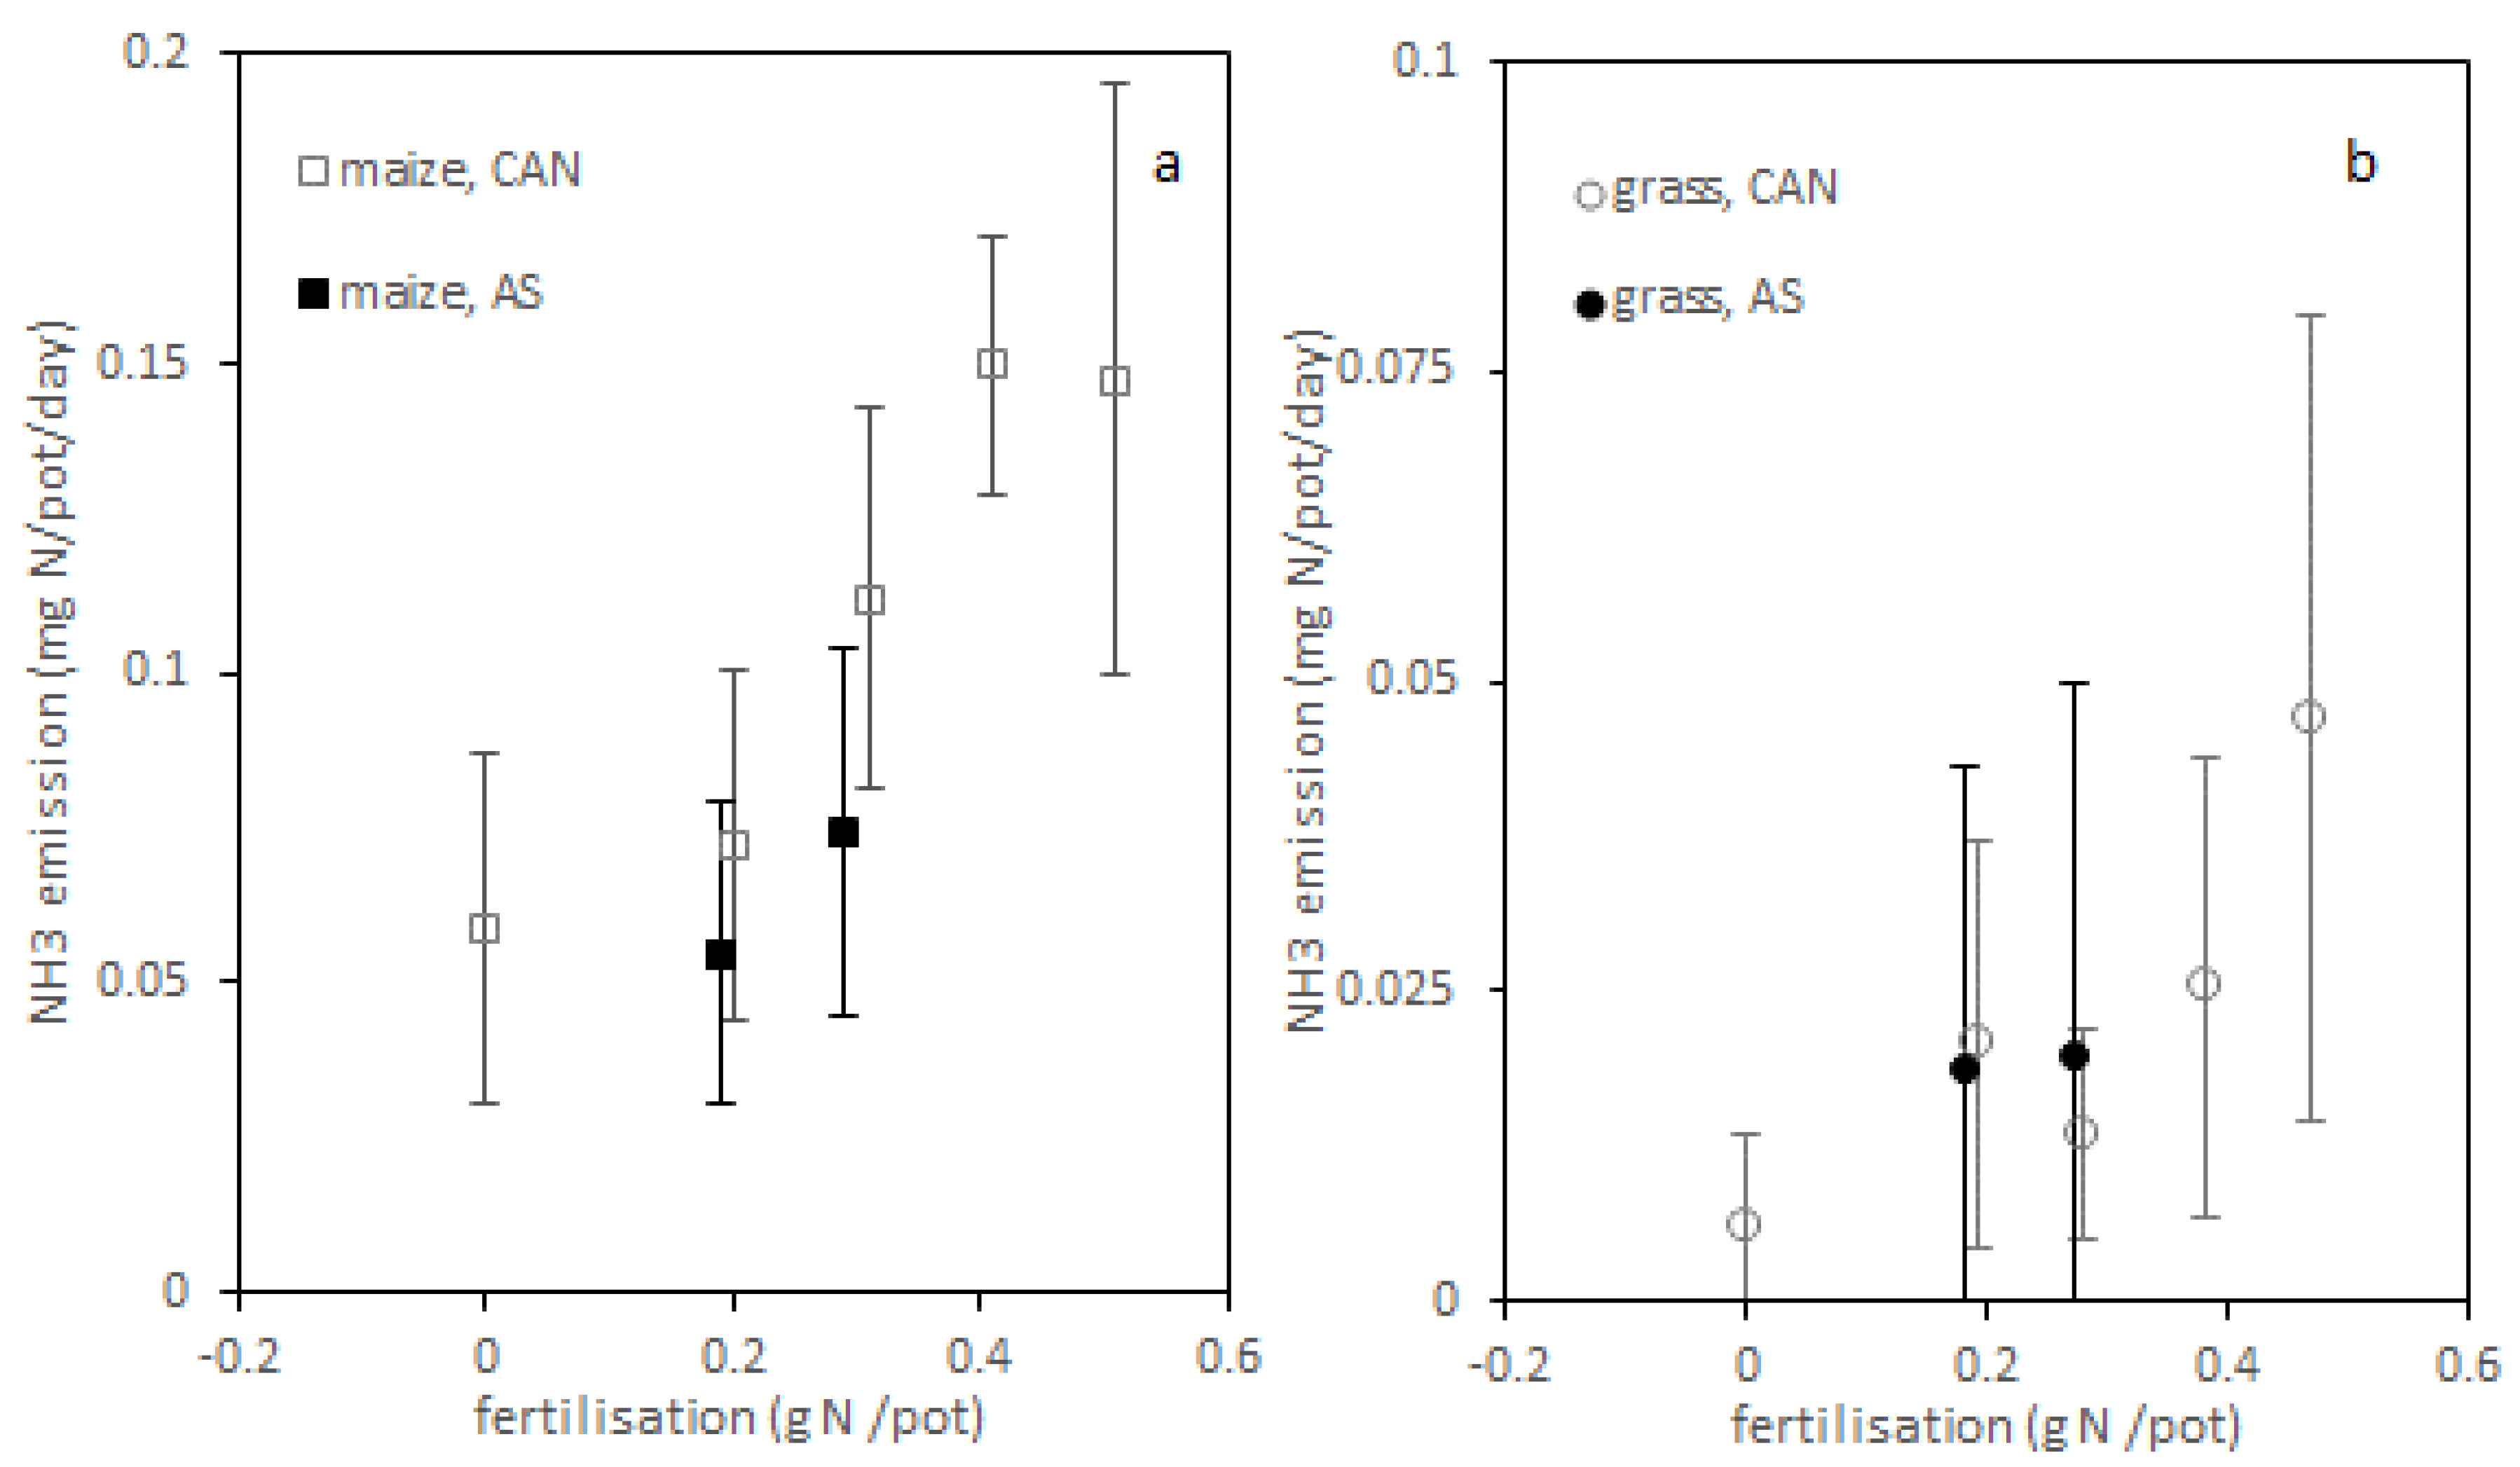
3.2. Greenhouse Experiment, Gaseous Emissions

Ammonia emissions, measured using acid traps, showed no differences between AS and CAN. Emissions of NH3 remained low in the first 10 days after fertilization: 0.02–0.3% of added N (Figure A1). There was a significant effect of soil type (under maize), sandy soil had higher emissions than clay soil. Emissions were much lower than what would have been estimated using the corresponding emission factor from the Dutch National Emission Model Agriculture (NEMA), which is 2.5% of applied N for CAN and 1.8% of applied N for air scrubber effluent [25]. While there are questions about the applicability and accuracy of these emission factors based on small scale experiments, they give an indication of the range that might be expected and relative differences between fertilizing products. The measured ammonia was a factor of seven or more lower compared to the NEMA values. Since the experiment was conducted with closed chambers, the effect of wind was missing from the experiment. Several examples in the literature show that ammonia emissions are consistently underestimated when no wind is allowed to blow over the measuring area [26,27]. To make more reliable ammonia emissions, an additional sheltered flux chamber experiment was conducted (Section 3.4).
The N2O emissions measured in the greenhouse experiment were very low (<0.04% of the applied N) (Table A8) and contained many values below the detection limit: 50 µg of N-N2O m−2 h−1. Therefore, they could not be tested with a linear model approach and were tested with a Kruskal–Wallis non-parametric test. This showed no significant effects of soil, dosage, or fertilizer type. CH4 emissions in the greenhouse experiment were also very low (values were below the detection limit: 100 µg of CH4 m−2 h−1), and showed no significant effects for maize or grass (Kruskal–Wallis test).

3.3. Field Demonstration in 2021 and 2022

In 2021 and 2022, there were no significant effects of fertilizer type on any of the factors tested in the maize or grass field demonstration experiment: dry matter (DM) and nutrient uptake. Soil type did have a significant effect in most cases (Table A9). These results do not indicate a significant difference in yield or N uptake between CAN and AS treatments at a dosage of 100% in field conditions. It should be noted that when sufficient fertilizer is applied to provide 100% of the recommended available N, no differences in crop yield are expected; in other words, the yield increase as a function of fertilization becoming low [5]. In addition to yield and N uptake by crops, the amount of mineral nitrogen in the soil remaining after harvest also showed no difference between both treatments: AS and CAN (Table A7).
However, the sulfur content in grass was affected by the high sulfur dosage using AS or CAN + S as the sole N fertilizers: 2.1 g of S kg−1 DM average in the unfertilized blank and 3.6–5.2 g of S kg−1 DM in the treatments (note: Table A9 gives the DM yield and S uptake). The soil was sampled for 0–30, 30–60 and 60–90 cm below the surface level for mineral nitrogen (Nmin) and plant available S [20]. The amount of extractable S in the sandy soil after the second grass cut was 290 to 524 kg of S ha−1 in the soil (0–90 cm), while the unfertilized blank had 61 to 71 kg of S ha−1 (Table A7), and at least a part of this S (97 to 167 kg of S ha−1) could be found in the 30–60 cm soil layer, demonstrating the potential loss of S by leaching into groundwater.
The N2O emissions from the field demonstration were much higher than the greenhouse experiment, which may be due to the wet weather in early April (cumulative precipitation and temperature in the month of April were 61 mm and 9.3 °C, respectively) that occurred at the time of fertilization and measurement, as wet weather facilitates N2O emission [28]. In this trial, a linear model was used to calculated the emissions. The fertilizer was found to have a significant effect on the emissions, namely that AS had significantly lower N2O emissions than CAN + S in both soil types (Figure 4).

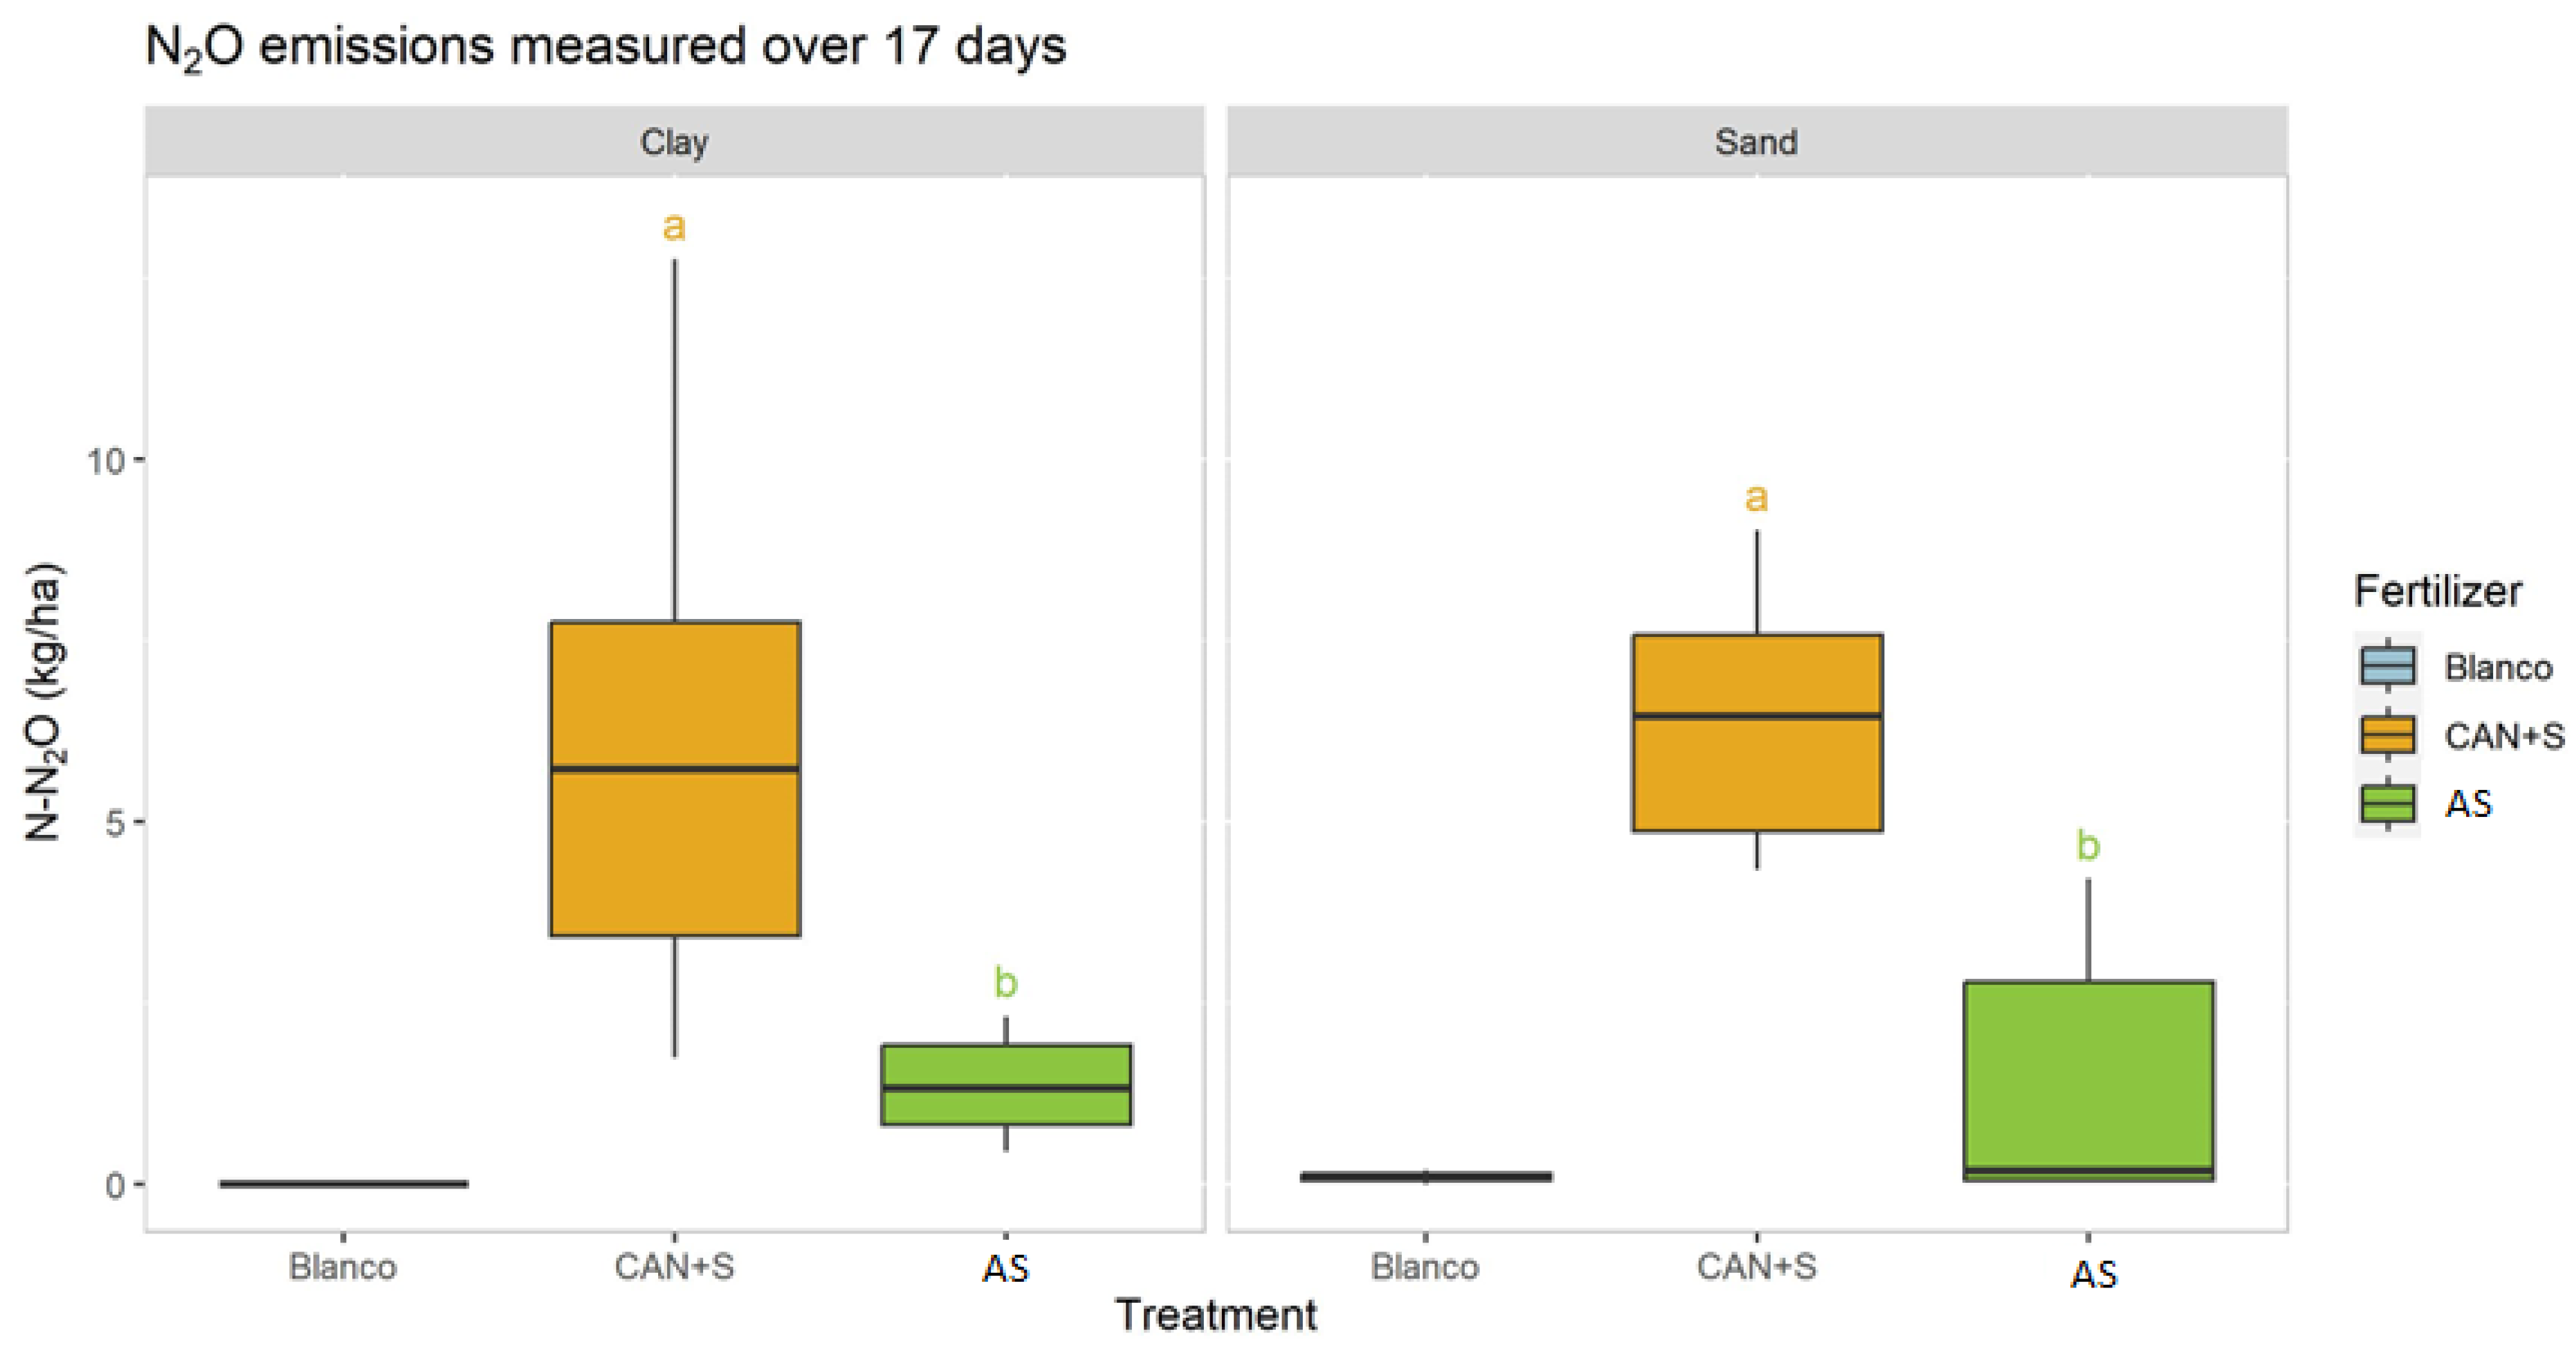
3.4. Sheltered Flux Chamber Experiment

The cumulative NH3 emissions were measured in two experiments, as described in Section 2.4: 1st and 2nd, see Figure 5. The NH3 emissions from the cattle slurry (CS) in the 1st experiment were lower than in the 2nd experiment, while the temperature in the 1st experiment was also lower [11]. More relevant for these experiments are the very low emissions from the AS (<0.01% of TAN).

4. Discussion

The NFRV of the AS from stripped manure was similar to the CAN in this study on sandy and clay soil, for maize and grass. Only in one of the six combinations of the greenhouse experiment (clay and maize) was the NFRV significantly lower than 1. The NFRV of the AS from the processed animal manure, reported by others, was significantly lower (30–94%) [12] compared to our results, which might be explained by NH3 losses due to higher temperatures, the application technique (spoke wheel and injection) or the higher pH values of the stripped AS or soil. Usually, solid ammonium sulfates have relevant NH3 emissions (84 g of NH3/kg of N) [22], 11.3% (%N of applied N) [29], while lower emissions from are assumed the liquid effluent from air scrubbers (1.8% N of applied N) [29]. In the current study, the emissions from AS were near to zero, probably because the target pH for the AS at the production site was <5.5. The NH3 emissions from the cattle slurry (CS), the reference for the NH3 measurements, was 14% (% of TAN) (Figure 5) after 15 days at 8.5 °C, which corresponds well to the standard emission factor for ammonia in The Netherlands from dairy slurry applied with low-emission techniques as used in this study (applying manure in vertical slots in soil): 17% of TAN [29].
S levels in animal feed of 3 to 4 g kg−1 DM can cause toxic effects in cattle and sheep but can also have indirect effects such as copper deficiencies [30,31,32,33]. S in crops is related to S fertilization at deficient nutrient levels [34,35,36], while it is unknown if S levels have a plateau or increase at surplus S levels (luxury consumption) [37]. With 2.1 g of S kg−1 DM in the unfertilized grass in the sandy and clay soil, the fertilized grass had 3.6–5.2 g of S kg−1 DM, showing the risk of AS fertilization at 298 and 326 kg of SO3 ha−1 for the first grass cut and 247 and 262 kg of SO3 ha−1 for the second grass cut (Table A3). This was far above the S fertilization advice, namely 0 and 35 kg of SO3 ha−1, respectively, for the clay and the sandy soil. A fertilization recommendation of <35 kg of SO3 ha−1, in combination with fertilization advice of 200 kg of N ha−1, can only be met by using small amounts of AS in comparison to other nitrogen fertilizers. Note that the S contents in grass may already be close to the optimum. In The Netherlands, the average S levels in silage grass increased from 3 g of S kg−1 DM in the period 1996–2009 [38] to 3.3 g of S kg−1 in the period 2015–2019, according to routine analysis by Eurofins Agro, probably due to targeted S fertilization due to increased awareness by farmers of a decrease in S deposition [38].

5. Conclusions

Liquid ammonium sulfate from processed animal manure (AS) was produced according to the proposed technologies [1] in the European Nitrate Directive [13]. The field demonstrations showed that AS can be applied with a low-NH3-emission technique on sandy and clay soils under two crops (grass and maize), and result in similar yields without damaging the crops. In both the field and greenhouse experiments, full N fertilization was carried out using ammonium sulfate, which produced much more S than the fertilization recommendation for S. The greenhouse experiment showed that for most soil–crop combinations tested, there was no evidence that AS is less effective as a nitrogen fertilizer than CAN. There were only two exceptions in the greenhouse experiments: dry matter yield of grass on both clay and sandy soil, and crop N uptake for maize on clay soil. Since N loss through NH3 or N2O was very low in the greenhouse experiment we have no explanation for the lower efficiency of AS for maize on clay soil. The sheltered flux chamber experiment showed no NH3 emission from AS in sandy soil.
AS can be applied to supplement the use of commonly used livestock manure and mineral N fertilizer to meet the crop’s S requirement. However, the goal of using processed manure products, to make nutrient fertilization more balanced with crop needs than the original animal manure, is only achieved if AS is applied in line with the recommendation of both N and S, and not by applying more. Applying S at higher doses than the recommendation for S does not fit into any strategy because increased S content in grass can be toxic to cattle and sheep [30] and excess S can leach into (1) surface waters leading to eutrophication in P-rich systems [39] and (2) groundwater leading to elevated sulfate concentrations in drinking water. The field demonstration in grass showed that sulfur uptake can be increased when extreme amounts of AS are used. To avoid toxicity to livestock when used as feed material, these elevated levels should be accounted for in their complete diet.
The greenhouse experiment provided no evidence for significant differences in NH3, N2O, or CH4 emissions caused by fertilizer type, because the achievable measuring accuracy was not sufficient to distinguish between the overall low emissions. The low amount of N emissions is consistent with the N balance, which shows that the amount of uptake by the plant was higher than the amount taken up by the control, implying that the crop was able to utilize all or most of the applied N in addition to some N available in the soil, and that there was very little loss via emissions. The greenhouse experiment was conducted under controlled conditions; in contrast, the field demonstrations provide insight into emissions in a less controlled environment. Here, the N2O emissions showed higher levels from the CAN fields compared to the AS fields after rainfall.

Author Contributions

Conceptualization, R.R., O.S. and K.v.D.; methodology, R.R.; validation, R.R.; formal analysis, R.R.; investigation, R.R.; resources, O.S. and K.v.D.; data curation, R.R.; writing—original draft preparation, R.R.; writing—review and editing, R.R., K.v.D. and O.S.; visualization, R.R.; supervision, O.S.; project administration, O.S.; funding acquisition, O.S. All authors have read and agreed to the published version of the manuscript.

Funding

This research received funding from the EU Horizon 2020 Research and Innovation Programme under grant agreement No. 862849, “Innovative nutrient recovery from secondary sources—Production of high-added value Fertilizers’ from animal MANURE”, project acronym: FERTIMANURE. www.fertimanure.eu (accessed on 30 May 2024).

Institutional Review Board Statement

Not applicable.

Informed Consent Statement

Not applicable.

Data Availability Statement

The raw data supporting the conclusions of this article will be made available by the authors on request.

Acknowledgments

We thank: Philip Ehlert for starting the experiment, Anna Adriani for assisting on this project, Willeke van Tintelen for performing the greenhouse experiment, Jordy van‘t Hull for help with the CH4, N2O and NH3 measurements, Slootsmid Mesttechniek B.V. (Borculo, The Netherlands) for the fertilization of the fields, and Arjan Prinsen from the Arjan Prinsen Farm (APF) (Haarlo, The Netherlands) for the pilot fertilizers.

Conflicts of Interest

The authors declare no conflicts of interest.

Appendix A

Table A1. Soil characteristics of the four experimental fields. Organic matter (OM) content in %, mineral nitrogen (Nmin: sum of NO3 + NH4 expressed as kg of N ha−1 0–90 cm using 1 M KCl), clay (<2 μm) %, silt (<50 μm) (%), CaCO3 (%), K-CaCl2 (mg of K kg−1), P-CaCl2 (mg of P kg−1). For methods (accredited laboratory: Eurofins Agro, Wageningen, and soil chemistry laboratory WUR-CBLB) see footer of this table.
CropSoilXY CoordinatesSoil
Type
Layer (cm)NminpHOM<2 µm<50 µmCaCO3KP
Grass 2021Sand 51.99175,
5.64489
Umbric Gleysol0–10395.74.4415<0.21022.8
Clay 51.96380,
5.62833
eutric cambisol0–10476.38.843311.1610.6
Grass 2022Sand 51.99241,
5.64582
Umbric Gleysol0–10566.01.8817<0.2170.9
Clay 51.96422,
5.62797
eutric cambisol0–101126.68.139301.2260.4
Maize 2021Sandy 51.99262,
5.65325
Umbric Gleysol0–25-5.82.93130.21222.3
Clay 51.95542,
5.63467
Calcaric cambisol0–25-7.31.733462.1701.7
Soil chemistry laboratory (WUR-CBLB, Wageningen). Mineral nitrogen (Nmin: sum of nitrate and ammonium) extractable from fresh soil using 0.01 M CaCl2 1:10 m/v, NO3 and NH4 analysis using SFA [20]. Eurofins Agro, Wageningen; pH, after drying and sieving using near-infrared spectroscopy (NIRS). OM, soil organic matter after drying and sieving using near-infrared spectroscopy (NIRS). Q; <2 µm, lutum, after drying and sieving using near-infrared spectroscopy (NIRS). <50 µm; silt, after drying and sieving using near-infrared spectroscopy (NIRS). CaCO3; carbon analysis [40]; K, potassium extractable using 0.01 M CaCl2 1:10 m/v [20], K analyses using ICP-OES [41]); P, phosphorous extractable using 0.01 M CaCl2 1:10 m/v [20], P analyses using ICP-MS [42]. Q; Q: the methods that are accredited according to the Dutch Accreditation Council (RvA) for Eurofins Agro: laboratory nr. L 122 https://www.rva.nl/wp-content/uploads/scopes_files/home/rva-ftp/L122-sce.pdf (accessed on 30 May 2024).
Table A2. Chemical composition of two batches of ammonium sulfate (AS), calcium ammonium nitrate supplemented with sulfate (CAN + S) and gypsum on the basis of product instructions. Batch 1 (AS1) was used in 2021 for grassland and batch 2 (AS2) was used in 2021 for maize, and batch 3 (AS3) was used in 2022 for grassland. For methods (accredited laboratory: LUFA Nord West, Hameln) see footer of this table.
AS1 2021AS2 2021CAN + SGypsumAS3 2022
UnitGrassMaizeGrass and MaizeGrass and MaizeGrass
Dry matter% 27.929.0798.8299.5137
N tot% 5.816.0922.80.0257.75
NH4-N%%5.55.1710.82<0.017.25
S tot%6.786.927.124.28.17
S water soluble%6.776.813.32.36n.d
Bulk density g L−11137117611741435n.d.
pH-4.34.2--3.4
TOC%0.120.070.91.61<0.18
Dry matter, weight loss due to drying at 105 °C for 24 h ([43] chapter 5.1); N tot, total nitrogen by dry combustion in an element analyzer for liquid samples diluted with acid to prevent volatilization of NH3, and Kjeldahl method for solid samples ([43] chapters 1, 3.5.2.7.); NH4-N, distilling of NH3 after addition of a phosphate buffer, and collection of NH3 in sulfuric acid, and use of titration to determine excess acid [44]; S tot, total S after digestion for 2 h with aqua regia followed by filtration over filter paper, and subsequent analysis with inductive coupled plasma optical emissions spectroscopy (ICP-OES) [41]; S water soluble [41]; bulk density ([43] chapter 5.1); pH was determined by mixing 50 mL of a sample with 100 mL of 0.01 M CaCl2 for a few hours ([45] chapter A 5.1.1.; TOC, total organic carbon, dry combustion in a CN analyzer ([45] chapter A 4.1.3.2.).
Table A3. Product dosage (kg ha−1) in the field demonstration (CAN* is a commercial product: CAN supplemented with S) for the 1st and 2nd fertilization (given as: 1st/2nd), respectively, on 4 April 2022 and 16 May 2022.
TreatmentProduct AppliedTotal Applied
CropSoil ASCAN*CaSO4NSO3P2O5K2OMgONa2OCuZn
Grass 2021SandCAN-S-5004501143611585503020
AS1910--111325
ClayCAN-S-450410103328758055000
AS1740--101296
Grass 2022Sandblank0000015/25180/10025/251020
CAN-S-483/387419/336116/93326/262
AS1600/1282--116/93326/262
Clayblank0000095/25110/5075/75000
CAN-S-441/366383/318106/88298/247
AS1462/1213--106/88298/247
Maize
2021
SandCAN-S-600530137427050000.51
AS2250-50137420
ClayCAN-S-69060015748610550000.5
AS2570-55157478
Table A4. Two soil samples used in the greenhouse experiment. Characteristics of the four experimental fields and their soil layers (cm). Organic matter (OM) content in %, clay (<2 μm) %, silt (<50 μm) (%), CaCO3 (%), K-CaCl2 (mg K kg−1), P-CaCl2 (mg P kg−1), and water holding capacity (WHC) (ml water/kg ds), and extractable NO3 and NH4 (mg N kg−1) using 1 M KCl. For methods, see Table A1.
SoilLayerpHOM<2 μm<50 μmCaCO3KPWHCNO3NH4
clay 0–257.31.733462.1701.74255.63.5
sandy 0–255.43.1212<0.270224517.70.6
Methods for fertilizers: see field demonstration.
Table A5. Product dosage (g pot−1) in the greenhouse experiment. A dosage of CAN 100 (100% of advice) corresponds to 120 N ha−1 for grass (clay and sand) and 130 and 165 kg N ha−1 for maize on sand and clay, respectively. All other dosages are based on 0, 50%, 75% or 125% of the advice.
TreatmentProduct AppliedTotal Applied
CropSoilCodeASCANCaSO4NSO3
maizeclay000000
CAN 500110.260.47
CAN 7501.51.50.390.70
CAN 1000220.520.93
CAN 12502.52.50.651.16
AS 504.4304.430.252.06
AS 756.6406.640.373.09
sand000000
CAN 5000.780.780.200.36
CAN 7501.181.180.310.55
CAN 10001.571.570.410.73
CAN 12501.9661.9660.510.91
AS 503.4903.490.191.62
AS 755.2305.230.292.43
grassclay0001.7700.82
CAN 5000.7261.770.190.82
CAN 7501.091.770.280.82
CAN 10001.451.770.380.82
CAN 12501.811.770.470.82
AS 503.2200.60.180.28
AS 754.83000.270
sand0001.770.000.82
CAN 5000.7261.770.190.82
CAN 7501.091.770.280.82
CAN 10001.451.770.380.82
CAN 12501.811.770.470.82
AS 503.2200.60.180.28
AS 754.83000.270
Table A6. Chemical composition of fertilizers from APF used for ammonia emission experiments in November and December 2023, and which were sampled at APF at 27 October 2023. For methods see Table A2.
UnitAS 2023CS
Dry matter%37.49.4
N tot% 4.5980.347
NH4-N%%4.490.16
S tot%5.250.054
Bulk density g L−11100989
pH 5.07.5
Table A7. Average soil extractable nitrogen (kg N ha−1) and sulfate (kg S ha−1) in the field demonstration, per layer and sum. Only the treatments were performed in triplicate and were tested for significant differences. * Soil was not sampled in grass in 2021 because the experiment was terminated after a mistake was made using the fertilizers after the first grass cut.
Soil Extractable N (kg of N ha−1)
SoilTreatment0–3030–6060–90Sum
Maize 2021
SandCAN + S17262366
AS17252163
ClayCAN + S1815942
AS19161045
Grass 2021 *
Grass 2022
SandCAN + S2628862
AS34321076
Control814426
ClayCAN + S30321173
AS35391286
Control2624858
n.s.
Soil Extractable S (kg of S ha−1)
0–3030–6060–90Sum
SandCAN + S34016717524
AS12911023262
Control29281471
ClayCAN + S24710227377
AS1609733290
Control22221761
n.s.
Amount of extractable N and S per ha has been calculated assuming that the weight of soil is related to soil organic matter.
Table A8. Average N2O emissions (% N of applied N) determined in the greenhouse experiment (see Table A5 for applied N) on the basis of 10 measurements in a period of 31 days.
SandClay
GrassMaizeGrassMaize
CAN 500.01%0.00%0.00%0.03%
CAN 750.02%0.00%0.00%0.00%
CAN 1000.03%0.00%0.01%0.01%
CAN 1250.00%0.00%0.02%0.02%
AS 500.04%0.00%0.03%0.00%
AS 750.00%0.00%0.00%0.02%
Table A9. Average yield (103 kg dry matter ha−1) (DM) and nutrient uptake (kg ha−1) of crops in field demonstrations. The grass yield in 2021 consisted of one grass cut, and in 2022 of two grass cuts (see main text for explanation). No significant differences between the treatments (CAN-S and AS) were found per year and crop. The standard deviation is given on the basis of three replications. The blank in 2022 consisted of a single plot.
DmNPKCaMgNaS
Maize 2021
clayCAN + S19.2 ± 0.3157 ± 2327 ± 3161 ± 1440 ± 123 ± 21.0 ± 0.115 ± 1
AS18.3 ± 0.8178 ± 928 ± 3154 ± 1238 ± 222 ± 10.9 ± 0.115 ± 0.5
sand CAN + S22.1 ± 1235 ± 1433 ± 2288 ± 1238 ± 223 ± 11.0 ± 0.118 ± 1
AS23 ± 1.1252 ± 1338 ± 2256 ± 1237 ± 224 ± 11.0 ± 0.119 ± 1
Grass 2021
clayCAN + S6.6 ± 0.3118 ± 521 ± 0.3178 ± 1426 ± 18 ± 0.39 ± 219 ± 1
AS6.7 ± 0.6131 ± 521 ± 1178 ± 1028 ± 39 ± 110 ± 321 ± 2
sandCAN + S7.7 ± 0.8142 ± 1524 ± 2145 ± 2729 ± 513 ± 217 ± 122 ± 2
AS6.8 ± 0.6132 ± 1322 ± 2141 ± 1623 ± 411 ± 118 ± 121 ± 2
Grass 2022
clay Blank2.946.18.355.312.53.81.75.1
CAN + S6.3 ± 0.4 181 ± 1119 ± 1156 ± 1133 ± 311 ± 113 ± 123 ± 2
AS5.9 ± 0.6171 ± 1618 ± 2146 ± 1330 ± 310 ± 111 ± 328 ± 3
sand Blank3.2417.34815.74.846.2
CAN + S7.0 ± 0.1182 ± 1223 ± 196 ± 944 ± 216 ± 131 ± 727 ± 2
AS6.9 ± 0.2191 ± 1824.2 ± 0.396 ± 1437 ± 115 ± 131 ± 630 ± 2
Figure A1. Cumulative ammonia emissions (expressed as mg of N pot−1 day−1) between day of fertilization (day 0) and day 10 (cumulative) for ammonium sulfate (AS) and calcium ammonium nitrate (CAN) in a greenhouse experiment for (a) maize, and (b) grass (mean values are shown and their standard deviation of six repetitions and both soil types, clay and sand).
Applsci 14 04998 g0a1
Figure A2. Injection of ammonium sulfate in (a) grassland, using a pair of injection units at 25 cm (b) maize, and a pair of injection units at 75 cm in maize, with maize seed between the slots.
Applsci 14 04998 g0a2

References

  1. Huygens, D.; Orveillon, G.; Lugato, E.; Tavazzi, S.; Comero, S.; Jones, A.; Gawlik, B.; Saveyn, H. Technical Proposals for the Safe Use of Processed Manure above the Threshold Established for Nitrate Vulnerable Zones by the Nitrates Directive (91/676/EEC). JRC121636 Publications Office; Publications Office of the European Union: Luxembourg, 2020. [Google Scholar] [CrossRef]
  2. Sigurnjak, I.; Brienza, C.; Snauwaert, E.; De Dobbelaere, A.; De Mey, J.; Vaneeckhaute, C.; Michels, E.; Schoumans, O.; Adani, F.; Meers, E. Production and performance of bio-based mineral fertilizers from agricultural waste using ammonia (stripping-) scrubbing technology. Waste Manag. 2019, 89, 265–274. [Google Scholar] [CrossRef] [PubMed]
  3. van Puffelen, J.L.; Brienza, C.; Regelink, I.C.; Sigurnjak, I.; Adani, F.; Meers, E.; Schoumans, O.F. Performance of a full-scale processing cascade that separates agricultural digestate and its nutrients for agronomic reuse. Sep. Purif. Technol. 2022, 297, 121501. [Google Scholar] [CrossRef]
  4. Meers, E.; Michels, E.; Rietra, R.; Velthof, G. Biorefinery of Inorganics: Recovering Mineral Nutrients from Biomass and Organic Waste; John Wiley & Sons, Inc.: Hoboken, NJ, USA, 2020. [Google Scholar]
  5. Schils, R.; Schröder, J.; Velthof, G. Fertilizer Replacement Value: Linking Organic Residues to Mineral Fertilizers. In Biorefinery Inorganics Recovering Mineral Nutrients from Biomass and Organic Waste; Meers, E., Velthof, G., Michels, E., Rietra, R., Eds.; John Wiley & Sons, Inc.: Hoboken, NJ, USA, 2020; pp. 189–214. [Google Scholar] [CrossRef]
  6. Westerik, D.; Hoffland, E.; Hijbeek, R. Nitrogen fertilizer replacement values of organic amendments: Determination and prediction. Nutr. Cycl. Agroecosyst. 2023. [CrossRef]
  7. van der Weerden, T.; Noble, A.; Beltran, I.; Hutchings, N.; Thorman, R.; de Klein, C.; Amon, B. Influence of key factors on ammonia and nitrous oxide emission factors for excreta deposited by livestock and land-applied manure. Sci. Total Environ. 2023, 889, 164066. [Google Scholar] [CrossRef] [PubMed]
  8. Kros, H.; Cals, T.; Gies, E.; Groenendijk, P.; Lesschen, J.P.; Voogd, J.C.; Hermans, T.; Velthof, G. Region oriented and integrated approach to reduce emissions of nutrients and greenhouse gases from agriculture in The Netherlands. Sci. Total Environ. 2024, 909, 168501. [Google Scholar] [CrossRef] [PubMed]
  9. Bell, M.; Hinton, N.; Cloy, J.; Topp, C.; Rees, R.; Williams, J.; Misselbrook, T.; Chadwick, D. How do emission rates and emission factors for nitrous oxide and ammonia vary with manure type and time of application in a Scottish farmland? Geoderma 2016, 264, 81–93. [Google Scholar] [CrossRef]
  10. Reuland, G.; Sigurnjak, I.; Dekker, H.; Michels, E.; Meers, E. The potential of digestate and the liquid fraction of digestate as chemical fertiliser substitutes under the RENURE criteria. Agronomy 2021, 11, 1374. [Google Scholar] [CrossRef]
  11. Sommer, S.; Génermont, S.; Cellier, P.; Hutchings, N.; Olesen, J.; Morvan, T. Processes controlling ammonia emission from livestock slurry in the field. Eur. J. Agron. 2003, 19, 465–486. [Google Scholar] [CrossRef]
  12. Müller, B.; Hartung, J.; von Cossel, M.; Lewandowski, I.; Müller, T.; Bauerle, A. On-farm use of recycled liquid ammonium sulphate in Southwest Germany using a participatory approach. Nutr. Cycl. Agroecosyst. 2023. [CrossRef]
  13. EC. Commission Directive (Draft) Amending Council Directive 91/676/EEC as Regards the Use of Certain Fertilising Materials from Livestock Manure. Ares (2024)2885619 19/04/2024. Available online: https://ec.europa.eu/info/law/better-regulation/have-your-say/initiatives/14242-Commission-Directive-amending-Annex-III-of-the-Nitrates-Directive_en (accessed on 25 April 2024).
  14. Reijneveld, J.A.; van Oostrum, M.J.; Brolsma, K.M.; Fletcher, D.; Oenema, O. Empower innovations in routine soil testing. Agronomy 2022, 12, 191. [Google Scholar] [CrossRef]
  15. Anonymous. Fertilization Recommendation for Grassland, and Forage Crops. Commissie Bemesting Grasland en Voedergewassen. 2012. Available online: https://edepot.wur.nl/413891 (accessed on 25 April 2024). (In Dutch).
  16. Novozamsky, I.; Houba, V.; Van Eck, R.; Van Vark, W. A novel digestion technique for multi-element plant analysis. Commun. Soil Sci. Plant Anal. 1983, 14, 239–248. [Google Scholar] [CrossRef]
  17. Lubbers, I.M.; Brussaard, L.; Otten, W.; Van Groenigen, J.W. Earthworm-induced N mineralization in fertilized grassland increases both N2O emission and crop-N uptake. Eur. J. Soil Sci. 2011, 62, 152–161. [Google Scholar] [CrossRef]
  18. Van der Stelt, B.; Temminghoff, E.; Van Vliet, P.; Van Riemsdijk, W. Volatilization of ammonia from manure as affected by manure additives, temperature and mixing. Bioresour. Technol. 2007, 98, 3449–3455. [Google Scholar] [CrossRef] [PubMed]
  19. ISO/TS-14256-1; ISO (International Organization for Standardization), Soil Quality—Determination of Nitrate, Nitrite and Ammonium in Field-Moist Soils by Extraction with Potassium Chloride Solution. ISO (International Organization for Standardization): Geneva, Switzerland, 2003.
  20. Houba, V.; Temminghoff, E.; Gaikhorst, G.; Van Vark, W. Soil analysis procedures using 0.01 M calcium chloride as extraction reagent. Commun. Soil Sci. Plant Anal. 2000, 31, 1299–1396. [Google Scholar] [CrossRef]
  21. De Ruijter, F.; Huijsmans, J.; Rutgers, B. Ammonia volatilization from crop residues and frozen green manure crops. Atmos. Environ. 2010, 44, 3362–3368. [Google Scholar] [CrossRef]
  22. EEA. EMEP/EEA Air Pollutant Emission Inventory Guidebook 2023; European Environment Agency: Copenhagen, Denmark, 2013; Available online: https://www.eea.europa.eu/publications/emep-eea-guidebook-2023/part-b-sectoral-guidance-chapters/3-agriculture/3-d-agricultural-soils-2023/view (accessed on 23 May 2024).
  23. Huijsmans, J.; Schröder, J.; Mosquera, J.; Vermeulen, G.; Ten Berge, H.; Neeteson, J. Ammonia emissions from cattle slurries applied to grassland: Should application techniques be reconsidered? Soil Use Manag. 2016, 32, 109–116. [Google Scholar] [CrossRef]
  24. Huijsmans, J.; Vermeulen, G.; Hol, J.; Goedhart, P. A model for estimating seasonal trends of ammonia emission from cattle manure applied to grassland in The Netherlands. Atmos. Environ. 2018, 173, 231–238. [Google Scholar] [CrossRef]
  25. van Bruggen, C.; Bannink, A.; Groenestein, C.; Huijsmans, J.; Luesink, H.H.; Oude Voshaar, S.V.; van der Sluis, S.M.; Velthof, G.L.; Vonk, J. Emissies naar Lucht uit de Landbouw uit de Landbouw in 2015. Berekeningen met het Model NEMA; WOt-Technical Report 98; Wettelijke Onderzoekstaken Natuur & Milieu: Wageningen, The Netherlands, 2015. (In Dutch) [Google Scholar] [CrossRef]
  26. Schlossberg, M.J.; McGraw, B.A.; Hivner, K.R. Comparing closed chamber measures of ammonia volatilization from Kentucky bluegrass fertilized by granular urea. J. Environ. Hortic. 2018, 36, 85–91. [Google Scholar] [CrossRef]
  27. Alexander, J.R.; Spackman, J.A.; Wilson, M.L.; Fernández, F.G.; Venterea, R.T. Capture efficiency of four chamber designs for measuring ammonia emissions. Agrosyst. Geosci. Environ. 2021, 4, e20199. [Google Scholar] [CrossRef]
  28. De Klein, C.A.M.; Van Logtestijn, R.S.P. Denitrification in grassland soils in The Netherlands in relation to irrigation, N-application rate, soil water content and soil temperature. Soil Biol. Biochem. 1996, 28, 231–237. [Google Scholar] [CrossRef]
  29. van Bruggen, C.; Bannink, A.; Bleeker, A.; Bussink, D.W.; Dooren, H.J.C.v.; Groenestein, C.M.; Huijsmans, J.F.M.; Kros, J.; Lagerwerf, L.A.; Oltmer, K.; et al. Emissies naar Lucht uit de Landbouw Berekend met NEMA voor 1990–2021; WOt-Report 242; Wettelijke Onderzoekstaken Natuur & Milieu: Wageningen, The Netherlands, 2023. (In Dutch) [Google Scholar] [CrossRef]
  30. Suttle, N.F. Mineral Nutrition of Livestock; CAB International: Wallingford, UK, 2022. [Google Scholar]
  31. National Research Council. Mineral Tolerance of Animals. Second Revised Edition, 2005; National Academies Press: Washington, DC, USA, 2006. [Google Scholar] [CrossRef]
  32. Drewnoski, M.; Pogge, D.; Hansen, S. High-sulfur in beef cattle diets: A review. J. Anim. Sci. 2014, 92, 3763–3780. [Google Scholar] [CrossRef] [PubMed]
  33. Dias, R.; López, S.; Montanholi, Y.; Smith, B.; Haas, L.; Miller, S.; France, J. A meta-analysis of the effects of dietary copper, molybdenum, and sulfur on plasma and liver copper, weight gain, and feed conversion in growing-finishing cattle. J. Anim. Sci. 2013, 91, 5714–5723. [Google Scholar] [CrossRef] [PubMed]
  34. McLaren, R. Effects of fertilizers on the sulphur content of herbage. Grass Forage Sci. 1976, 31, 99–103. [Google Scholar] [CrossRef]
  35. Keer, J.; McLaren, R.; Swift, R. The sulphur status of intensive grassland sites in southern Scotland. Grass Forage Sci. 1986, 41, 183–190. [Google Scholar] [CrossRef]
  36. Dijksterhuis, G.H.; Oenema, O. Studies on the effectiveness of various sulfur fertilizers under controlled conditions. Fertil. Res. 1990, 22, 147–159. [Google Scholar] [CrossRef]
  37. Kulczycki, G.; Sacała, E.; Koszelnik-Leszek, A.; Milo, Ł. Perennial Ryegrass (Lolium perenne L.) Response to Different Forms of Sulfur Fertilizers. Agriculture 2023, 13, 1773. [Google Scholar] [CrossRef]
  38. Reijneveld, J.; Abbink, G.; Termorshuizen, A.; Oenema, O. Relationships between soil fertility, herbage quality and manure composition on grassland-based dairy farms. Eur. J. Agron. 2014, 56, 9–18. [Google Scholar] [CrossRef]
  39. Lamers, L.P.; Tomassen, H.B.; Roelofs, J.G. Sulfate-induced eutrophication and phytotoxicity in freshwater wetlands. Environ. Sci. Technol. 1998, 32, 199–205. [Google Scholar] [CrossRef]
  40. EN 15936:2022; Soil, Waste, Treated Biowaste and Sludge—Determination of Total Organic Carbon (TOC) by Dry Combustion. CEN (European Committee for Standardization): Brussels, Belgium, 2022. Available online: https://www.nen.nl/en/nen-en-15936-2022-en-293461 (accessed on 23 May 2024).
  41. ISO 11885, 2009; ISO (International Organization for Standardization), Water Quality—Determination of Selected Elements by Inductively Coupled Plasma Optical Emission Spectrometry (ICP-OES). ISO (International Organization for Standardization): Geneva, Switzerland, 2009. Available online: https://www.iso.org/standard/36250.html (accessed on 23 May 2024).
  42. ISO 17294-2, 2016; ISO (International Organization for Standardization), Water Quality—Application of Inductively Coupled Plasma Mass Spectrometry (ICP-MS)—Part 2: Determination of Selected Elements Including Uranium Isotopes. ISO: Geneva, Switzerland, 2016. Available online: https://www.iso.org/standard/82245.html (accessed on 23 May 2024).
  43. VDLUFA. Methodenbuch Band II.2 Sekundärrohstoffdünger, Kultursubstrate und Bodenhilfsstoffe (Grundwerk 2000); VDLUFA: Speyer, Germany, 2000. [Google Scholar]
  44. DIN 38406-5, 1983; DIN (Deutsches Institut für Normung), German Standard Methods for the Examination of Water, Waste Water and Sludge—Cations (group E)—Determination of Ammonia-Nitrogen (E5). DIN: Berlin, Germany, 1983. Available online: https://www.din.de/de/mitwirken/normenausschuesse/naw/wdc-beuth:din21:1061756 (accessed on 23 May 2024).
  45. VDLUFA (Verband Deutscher Landwirtschaftlicher Untersuchungs- und ForschungsAnstalten e. V). Methodenbuch Band I Böden (Grundwerk 1991); VDLUFA: Speyer, Germany, 1991. [Google Scholar]
Figure 1. Total dry weight of the crop harvest of the ammonium sulfate (AS) (green) and calcium ammonium nitrate (CAN) treatments (orange) for two soils (clay and sand), two crops (grass and maize) and different levels of N dosages. The letters indicate groupings of the treatments determined by the least squares difference (LSD): two treatments with the same letter are not significantly different from each other. Grass and maize were analyzed separately and only 50% and 75% of the treatments were included in the statistical tests. LSD is 10.61 g pot−1 for grass and 4.71 g pot−1 for maize.
Applsci 14 04998 g001
Figure 2. Total N uptake of the crop harvest of the ammonium sulfate (AS) (green) and calcium ammonium nitrate (CAN) treatments (orange) for two soils (clay and sand), two crops (grass and maize) and different levels of N dosages. The letters indicate groupings of the treatments determined by the LSD test: two treatments with the same letter are not significantly different from each other. Grass and maize were analyzed separately and only 50% and 75% of treatments were included in statistical tests. LSD is 0.02 g pot−1 for grass and 0.31 g pot−1 for maize.
Applsci 14 04998 g002
Figure 3. NFRV of AS for two crops, two soils, and two dosages, using CAN as a reference. The p value was determined by a two-sided sign test. Data for the 50 and 75% treatments were combined and the tests were performed per crop/soil combination. A p-value < 0.05 is considered significant.
Applsci 14 04998 g003
Figure 4. Cumulative N2O emissions from grass field trial of 2022 at 17 days after fertilization. Emissions were measured from plots fertilized with calcium ammonium nitrate supplemented with sulfate (CAN + S) and AS (AS) at multiple intervals over 17 days after fertilization (linear interpolations of emissions between measured dates). LSD is 2.94 kg of N-N2O/ha. The letters indicate differences based on the least squares difference (LSD): two treatments with different letters are significantly different from each other.
Applsci 14 04998 g004
Figure 5. Cumulative ammonia emissions (% TAN) from cattle slurry (CS) and ammonium sulfate from animal manure stripping (AS) from 1st (started on 23 November 2023) and 2nd experiment (started on 7 December 2023) (means are given, with the standard deviation of three repetitions). The average temperature in the 1st period was 5.1 °C and in the 2nd period it was 8.5 °C.
Applsci 14 04998 g005
Disclaimer/Publisher’s Note: The statements, opinions and data contained in all publications are solely those of the individual author(s) and contributor(s) and not of MDPI and/or the editor(s). MDPI and/or the editor(s) disclaim responsibility for any injury to people or property resulting from any ideas, methods, instructions or products referred to in the content.

