Article

Enhanced Berth Mapping and Clothoid Trajectory Prediction Aided Intelligent Underground Localization

1
College of Advanced Interdisciplinary Studies, National University of Defense Technology, Changsha 410073, China
2
Intelligent Transportation Systems Research Center, Wuhan University of Technology, Wuhan 430063, China
3
Department of Transportation and Logistics, Dalian University of Technology, Dalian 116024, China
4
College of Electronic Science, National University of Defense Technology, Changsha 410073, China
*
Author to whom correspondence should be addressed.
Appl. Sci. 2024, 14(12), 5032; https://doi.org/10.3390/app14125032
Submission received: 9 May 2024 / Revised: 4 June 2024 / Accepted: 7 June 2024 / Published: 9 June 2024
(This article belongs to the Special Issue Mobile Robotics and Autonomous Intelligent Systems)

Abstract

:
In response to the widespread absence of global navigation satellite system (GNSS) signals in underground parking scenes, we propose a multimodal localization method that integrates enhanced berth mapping with Clothoid trajectory prediction, enabling high-precision localization for intelligent vehicles in underground parking environments. This method began by constructing a lightweight map based on the key berths. The map consisted of a series of discrete nodes, each encompassing three elements: holistic and local scene features extracted from an around-view image, and the global pose of the mapping vehicle calculated using the positions of the key berth’s corner points. An adaptive localization strategy was employed during the localization phase based on the trajectory prediction result. A progressive localization strategy, relying on multi-scale feature matching, was applied to the nodes within the map coverage range. Additionally, a compensation localization strategy that combined odometry with the prior pose was utilized for the nodes outside the map coverage range. The experiments conducted in two typical underground parking scenes demonstrated that the proposed method achieved a trajectory prediction accuracy of 40 cm, a nearest map search accuracy exceeding 92%, and a metric localization accuracy meeting the 30 cm standard. These results indicate that the proposed approach satisfies the high-precision, robust, real-time localization requirements for intelligent vehicles in underground parking scenes, while effectively reducing the map memory requirements.

1. Introduction

Localization is vital for connected and automated vehicles (CAVs) [1,2]. Satellite-based localization, reliant on global navigation satellite system (GNSSs), encounters difficulties in satellite-denied areas like underground parking scenes [3]. The literature categorizes non-GNSS vehicle localization into wireless-based [4,5,6], LiDAR-based [7,8,9], and vision-based methods [10,11]. However, wireless-based methods suffer from unstable signal transmission and the costly deployment of access points. LiDAR-based localization methods will also face challenges in data storage, transmission, and updates for a long time to come. Additionally, the high cost of LiDAR makes it less suitable for large-scale industrial applications.
With the rapid development and cost reduction of onboard camera manufacturing technology, vision-based localization methods have been widely utilized in CAVs [12,13]. Classic vision-based localization methods include visual odometry (VO) [14,15,16], visual map-based localization [17,18,19], and visual simultaneous localization and mapping (V-SLAM) [20,21,22]. However, in practice, VO and V-SLAM methods suffer from cumulative error issues in long-term localization [23,24,25]. High-definition (HD) visual maps can provide accurate and stable positional references, which can minimize the accumulation of localization errors. Nevertheless, HD maps store a large amount of static high-precision information and other dynamic information, resulting in significant data volume and storage space requirements, as well as matching delays and low matching efficiency. Lightweight maps take up less storage space than high-precision maps [26], but because of the small magnitude of the features that they store, the accuracy of the localization based on lightweight maps is relatively low. Trajectory predictions can predict the possible future position of a vehicle by analyzing the vehicle’s historical motion trajectory, speed, acceleration, and other dynamic information. This prediction can be combined with real-time visual odometry to correct and optimize the localization results, thereby improving the localization accuracy [27,28]. In complex environments or areas with large signal interference, trajectory prediction can effectively compensate for localization errors.
Based on the above considerations, we propose a sequential processing strategy integrating enhanced berth mapping with Clothoid trajectory prediction to address the abovementioned challenges and extend the localization services to underground parking scenes. The fundamental process involved generating a lightweight map containing multidimensional information based on the key berths in underground parking scenes. Furthermore, it triggered a localization mechanism that matched the trajectory prediction result.
The remaining parts of this paper are organized as follows. Section 2 presents some related work. Section 3 describes the proposed localization method in the GNSS-denied underground parking scenes. The experiments were conducted on real-world datasets and are discussed in Section 4. Finally, Section 5 provides the conclusion of the proposed intelligent underground localization method.

2. Literature Review

This section provides a review of the research progress on the visual positioning of intelligent vehicles in underground parking lots, as shown in Table 1.
The visual localization method based on low-cost cameras is a classical approach that enables high-precision vehicle localization in unknown environments. The VO method estimates the current pose of the vehicle by acquiring time-series localization data. However, due to observation errors, using time-series estimation methods can lead to accumulated errors and cause the trajectory of the vehicle to deviate from the actual route over time. V-SLAM methods perform mapping and localization simultaneously, utilizing map-matching techniques to achieve loop closure detection and improve localization accuracy. However, even with V-SLAM, there still exists a significant problem of accumulated errors as the driving distance increases, resulting in a gradual reduction in the localization accuracy. A widely adopted approach is to decouple the localization process into two stages: visual map construction and map-based localization [17].
The current focus of visual map construction is primarily on improving the localization accuracy. The typical approach involves extracting the feature information from the target scene to build an HD map. An HD visual map can provide accurate and stable position references for localization [29], thereby minimizing cumulative errors. For example, Jingyu Li et al. proposed a lane-segmentation detection method, named Lane-DeepLab, for detecting multi-class lane lines in unmanned driving scenarios for high-definition maps [30]; Huayou Wang et al. extracted semantic information from an HD map and performed data association (DA) to obtain high-precision vehicle poses [31]; Gallazzi et al. exploited a line-detection algorithm to retrieve the required information from camera images, thus constructing a lane-level HD map [32]; and Tuopu Wen et al. introduced the use of an abundance of visual features and multi-frame HD map landmark features to constrain the estimation of the vehicle position and improve localization accuracy [33]. Although HD maps provide rich information support, they have disadvantages such as a large data volume, high storage requirements, and a low matching efficiency. Therefore, it is necessary to explore new solutions to improve maps’ real-time performance, accuracy, and matching efficiency to better meet the requirements of high-precision localization systems.
In the map-based localization stage, the first step is to find the map node in the visual map that is most similar to the current image. Then, the pose relationship between the current vehicle and the map is calculated using the matched feature points to complete the localization. Sparse feature-based matching methods are commonly used in this process [34,35], such as scale-invariant feature transform (SIFT) [36], speeded-up robust features (SURF) [37], oriented FAST and rotated BRIEF (ORB) [38], and others [13,39,40]. Although sparse feature-based map-matching methods satisfy the requirement of minimizing time complexity, they suffer from insufficient matching accuracy.
To improve the matching accuracy, research has proposed localization methods such as hierarchical matching using the bag-of-words (BoW) model [41,42] and multi-view localization [31]. These methods aim to enhance the success rate of map matching by switching perspectives or levels. Another approach to address map-matching failures is to adopt a “coarse-to-fine” matching strategy. For example, based on seqSLAM sequence matching, a multi-resolution localization method has been proposed using particle filter algorithms [43]. However, this process of moving from coarse node-level localization to more precise metric-level localization involves accumulated errors, and the localization accuracy is highly dependent on node density.
In recent years, trajectory prediction has been considered in the localization problem to improve the localization accuracy [27,28]. The core of the trajectory prediction is to deeply analyze and learn the historical motion trajectory of the moving object to predict its future motion trend and position. In the localization problem, trajectory prediction can provide the localization algorithm with prior information on the future position [44]. This prior information can help the algorithm to maintain a high positioning accuracy even when the signal quality is poor. At the same time, trajectory prediction can help reduce the noise and outliers in the sensor data, thereby improving the positioning accuracy.
Underground parking scenes are indoor environments with dense architectural obstructions, limiting the satellite signals. In such cases, low-cost visual cameras can be used for localization. One method is to utilize surveillance cameras in the parking lot to detect vacant parking spaces, thereby assisting in localization [45]. However, this localization method can only roughly estimate the positions of the vacant parking spaces. It cannot obtain precise information about berth and vehicle poses, requiring manual parking and having limited automation. Another method is to extract the berth codes from the around-view images captured by onboard cameras for matching, and further introduce visual fiducial markers to improve the overall localization accuracy [46]. However, the visual fiducial markers, similar to quick response (QR) codes, are prone to occlusion, rendering them ineffective. Specifically, when the reference object is occluded, there may be a slight overlap between the current image and the visual map’s field of view, resulting in map-matching failures and reduced localization accuracy.
In summary, existing vehicle localization methods for underground parking scenes face two unresolved issues: (1) a large data volume, matching latency, and low efficiency in HD maps; (2) a low matching success rate between the target localization node and the nearest map node, resulting in a low localization accuracy. To address these problems, an enhanced berth mapping model is proposed, which generates a lightweight map that improves the map retrieval efficiency and significantly reduces the map storage. Furthermore, trajectory prediction, especially the trajectory prediction method based on the Clothoid theory [47,48,49], has a high trajectory calculation accuracy and can provide high-precision running trajectories of the vehicle to assist in improving the localization accuracy. Therefore, a multimodal localization method with the lightweight map and the Clothoid trajectory prediction is proposed. Thus, the contributions of this paper can be summarized as follows:
  • We introduce an enhanced berth mapping model that is tailored to underground parking scenes. This model, indexed by key berths, selects scene data reasonably and creates uniformly distributed map nodes. Each node includes three elements: holistic and local scene features extracted from an around-view image, and the global pose of the mapping vehicle calculated based on the positions of the key berth’s corner points. This representation model not only assists vehicles in achieving high-precision localization but also significantly reduces the memory requirements of the map.
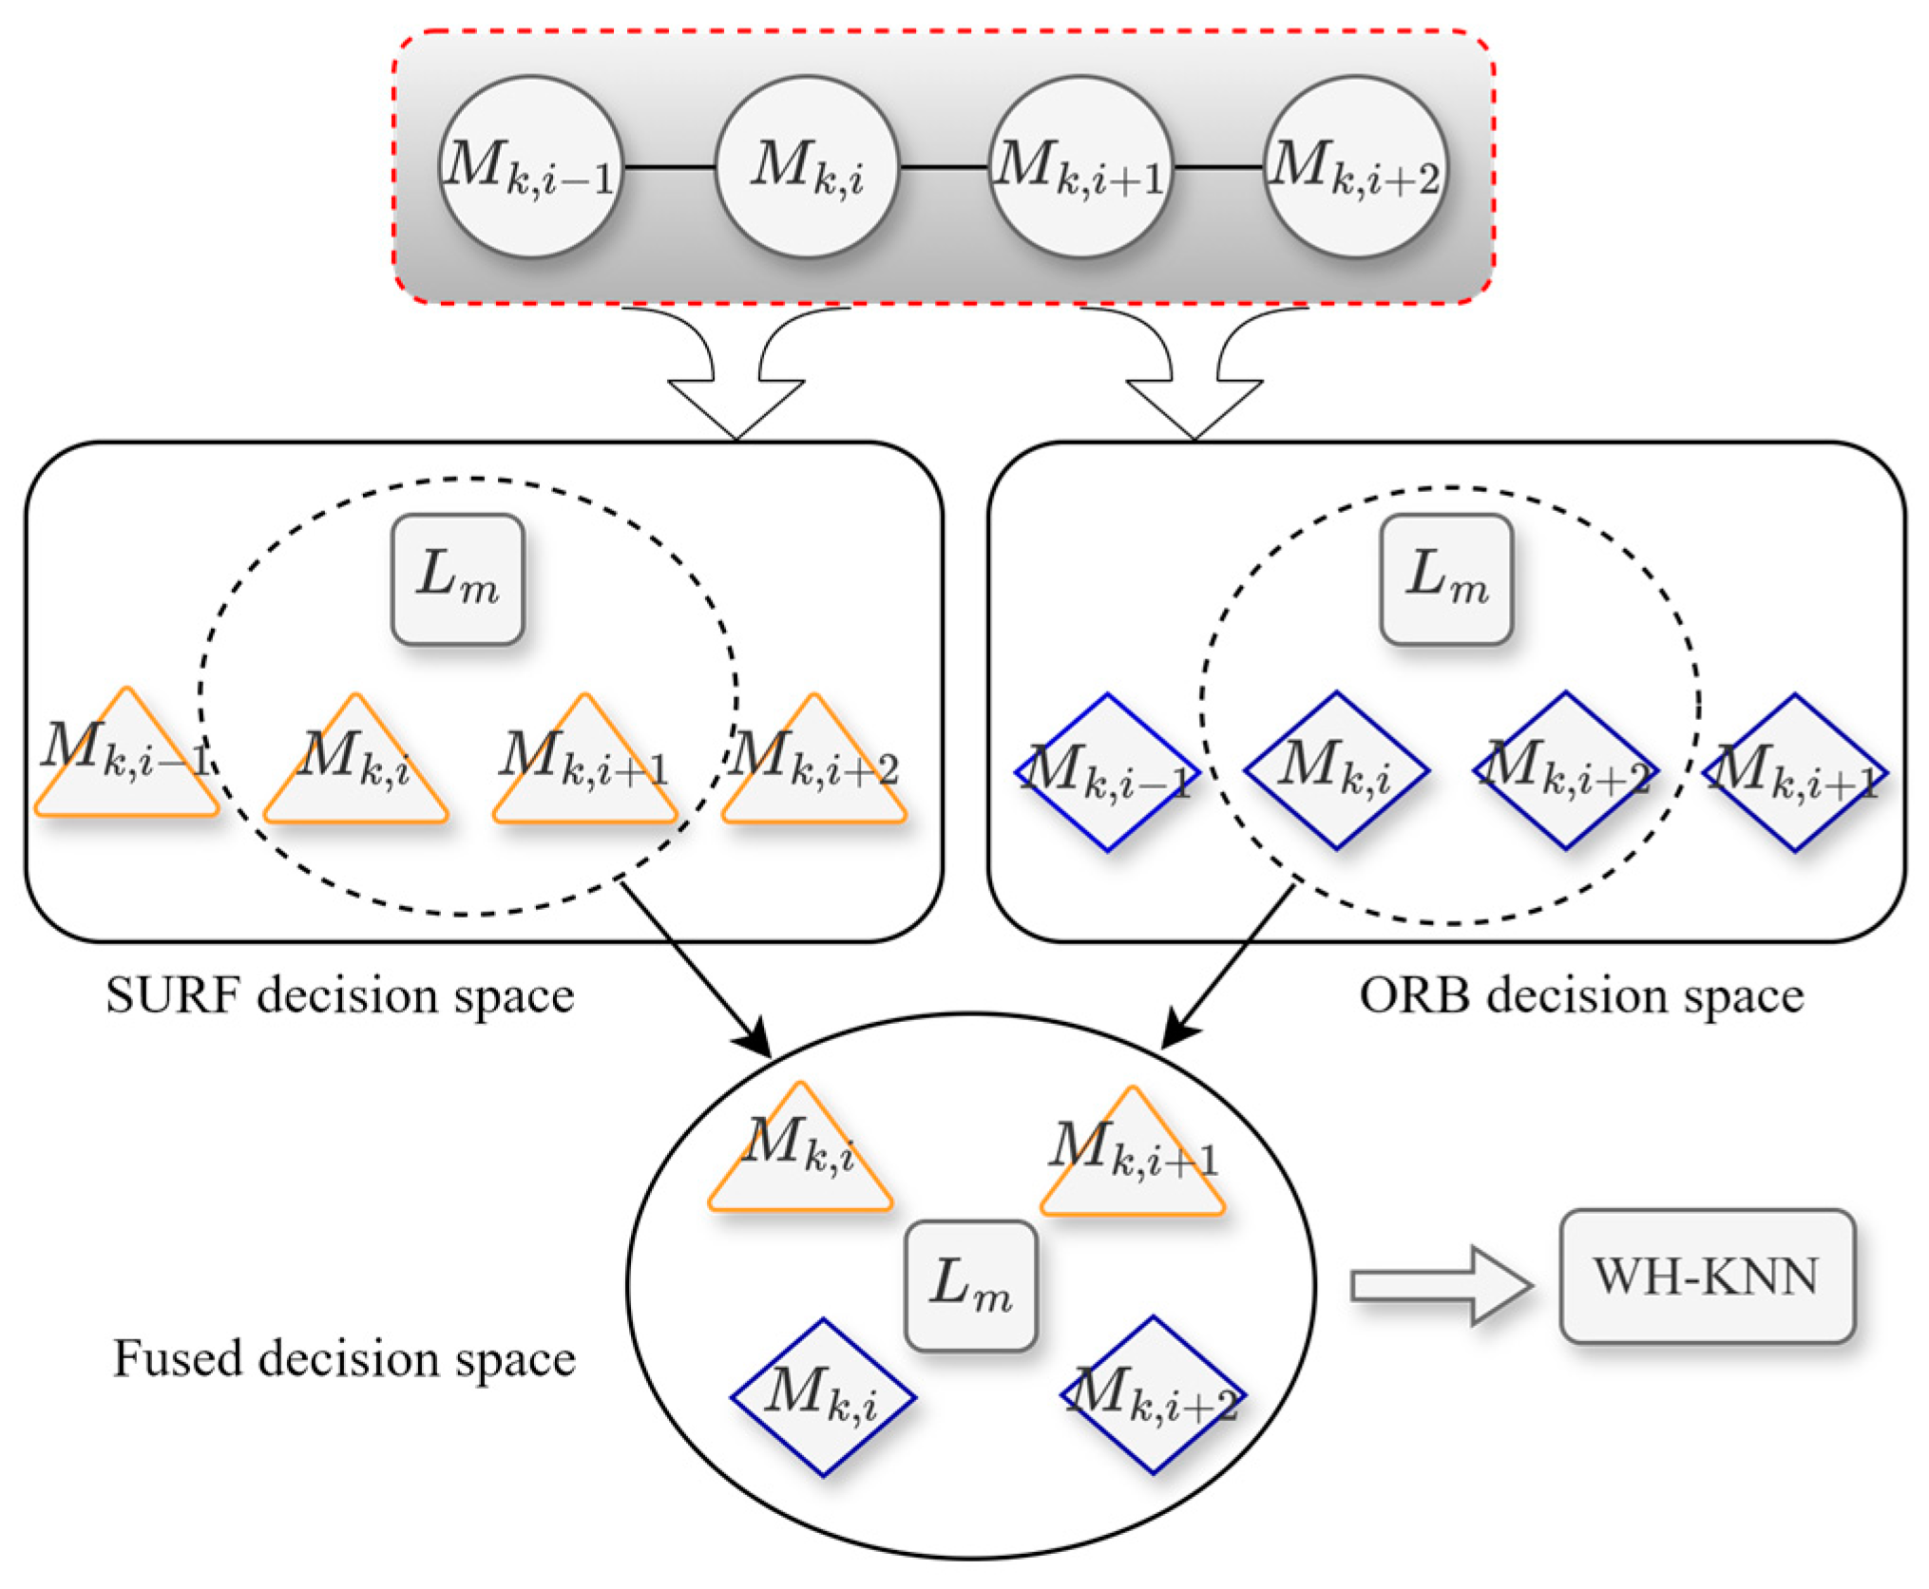
  • We propose a multimodal localization method that is capable of rapid and high-precision vehicle localization with robustness. This method employs an adaptive localization strategy corresponding to the trajectory prediction result. A progressive localization strategy based on multi-scale feature matching is applied if the target node is within the map coverage range. This includes rough localization based on the trajectory prediction, node-level localization integrating the holistic features and the weight hybrid k-nearest neighbor (WH-KNN) algorithm [50], and metric-level localization combining the local feature matching and prior pose. A compensation localization strategy combining odometry with prior pose is utilized if the node is outside the map coverage range.

3. Proposed Method

3.1. System Overview

The proposed method, presented in Figure 1, consists of two main steps: enhanced berth mapping and multimodal localization. The mapping step involves generating a lightweight map using a series of discrete nodes. Each node includes three elements: holistic and local scene features extracted from an around-view image, and the global pose of the mapping vehicle calculated based on the positions of the key berth’s corner points. In the multimodal localization step, the corresponding localization method is adapted based on the predicted pose of the vehicle. If the predicted pose falls within the range of the lightweight map, the vehicle pose is determined based on multi-scale feature matching with the map. If not, the vehicle pose is determined using odometry with prior pose.

3.2. Enhanced Berth Mapping

This paper utilized the node-based map representation model to generate a lightweight map. The method of lightweight map generation is illustrated in Figure 2. Mk represents a map block constructed based on the k-th key berth, which contained a certain number of map nodes. The map nodes {M(k,i)|I ∈ [1, n]} were discretely distributed with a resolution of Δm, which represented the Euclidean distance between the adjacent map nodes. In each map node M(k,i), an around-view image was captured using an around-view monitor (AVM). It should be noted that the around-view image needed to include two outer corner points of the key berth. The pose of the mapping vehicle was calculated based on the positions of the key berth’s corner points:
R   ( k , i )   G · X   ( k , j )   V + t   ( k , i )   G = X   ( k , j )   G ,     j = 1 ,   2 ,
where X ( k , j ) V and X ( k , j ) G are the coordinates of the key berth’s j-th corner point, indicating the coordinates in the coordinate system of the mapping vehicle and the global coordinate system, respectively. P ( k , i ) G = [ R ( k , i ) G , t ( k , i ) G ] represents the global pose of the mapping vehicle, which is also the global pose of the map node M(k,i), where R ( k , i ) G is the rotation matrix and t ( k , i ) G is the translation vector. As shown in Figure 3, the global coordinates of the key berth’s corner points were collected using a total station that was integrated with a global positioning system (GPS). As shown in Figure 4, the coordinate X ( k , j ) V was obtained by converting the pixel coordinate U(k,j) = [u(k,j), v(k,j)]
X   ( k , j )   V =   ( v   ( k , j ) v   r )   ·   λ   ( u   ( k , j ) u   r )   ·   λ ,     j = 1 ,   2 ,
where Ur = [ur, vr] is the pixel coordinates of the mapping vehicle’s rear axle center, and λ is the physical scale of a single pixel in the around-view image.
The selection of the key berths should prioritize improving the localization accuracy. On straight roads, the position of the vehicle (x-coordinate, y-coordinate) constantly changes, while its heading angle remains unchanged or changes very little. On curved roads, both the position and the angle of the vehicle change, making high-precision localization more challenging. Therefore, the key berths should be distributed near the curves of the driving path to make the map cover more of the curved areas. As shown in Figure 2, the red berths are the selected key berths. There is no fixed standard for setting the density of the key berths and the density is proportional to the map coverage area and the mapping workload, which should be set based on the actual needs.
As shown in Figure 1, during the online localization process using a lightweight map, the first step for the vehicle was to locate the nearest map node. Subsequently, the global pose of the vehicle was calculated based on the matching results of the local features and the global pose of the nearest map node. This paper employed holistic feature matching results to determine the nearest map node. The holistic feature referred to a feature extracted from the around-view image after being scaled to a fixed size, and its neighborhood covered the scaled image. This paper extracted two types of holistic features from the around-view image, performed matching steps for each type, and combined the results to enhance the accuracy of the nearest map node search. The selection of the SURF [37] and ORB [38] features as holistic features in this paper was justified using robustness. Additionally, the ORB features were chosen as local features due to their fast matching speed. In summary, each map node consisted of three elements: the holistic features, the local features, and the pose of the mapping vehicle.

3.3. Localization Initialization

When starting the localization process, intelligent vehicles needed to undergo an initial step called localization initialization. Localization initialization involves a series of operations to acquire the initial pose of the vehicle, establishing the starting state for the localization. In this paper, a lightweight map-based approach was used to complete the localization initialization step, and the details of this method are presented in Section 3.5 and Section 3.6. The localization initialization step was triggered when the vehicle entered the map area. It is important to note that, for the subsequent trajectory prediction, the number of nodes that determined the pose based on the localization initialization step should be equal to or greater than 2.

3.4. Trajectory Prediction with Clothoid

Using regular GPS to provide a rough pose estimation for the intelligent vehicles is common in outdoor environments. However, regular GPS signals are obstructed in underground parking scenes, rendering them ineffective for rough localization. Therefore, in this paper, a trajectory prediction was employed to provide a rough pose estimation for the vehicles in underground parking scenes, allowing for a quick determination of whether the vehicle was within the map coverage area and facilitating the selection of an appropriate localization method. This paper categorized the vehicle trajectories into two types, namely straight lines and curves, based on the variation in the heading angle of the vehicle. The corresponding trajectory prediction methods were then proposed accordingly.
Figure 5a illustrates the trajectory of a vehicle moving in a straight line with a constant heading angle. {Le|e ∈ [q, m − 1]} represents the historical localization nodes on this trajectory, with known global poses. Among them, Lq is the initial localization node of this trajectory and q represents the index of this node. Lm is the current localization node and m represents the index of this node. The global pose of Lm was predicted as follows:
R   ( m , g ) G = R   m 1 G = = R   q + 1 G = R   q G t   ( m , g ) G = t   m 1 G + Δ   t   ( m , g ) G ,   and q m 2 m 3 ,
where P ( m , g ) G = ( R ( m , g ) G , t ( m , g ) G ) represents the predicted global pose of the current localization node Lm, and t ( m , g ) G denotes the estimated translation vector from node Lm−1 to node Lm. Due to the short and nearly equal time intervals between the adjacent localization nodes, and the assumption of the vehicle moving at a constant speed within a short period, t ( m , g ) G was calculated based on the mean of the historical translation vectors:
Δ   t   m ,   g G e   =   q   + 1 m   1 Δ   t   e G m q 1 ,
where t e G represents the translation vector between the adjacent historical nodes.
The curved trajectory of the vehicle was approximated as a Clothoid. As shown in Figure 5b, this represented a continuous curvature trajectory originating from zero curvature. The Cartesian position of the current localization node Lm in the coordinate system {Lq}, which was situated at a distance of sm from the origin along the Clothoid, was calculated using the following formulas [51]:
x ( s m ) = sign ( α )   ·   π | α |   ·   C α   s m π   | α | y ( s m ) = π | α |   ·   S α   s m π   | α | ,
where C(s) and S(s) are the Fresnel cosine and sine function [52], respectively, and the function sign(α) returns the sign of the sharpness α. The sharpness α was defined as dc/ds, which indicated the change in the curvature c concerning the distance s traveled on the curve. The curvature c was defined as /ds, representing the change in the heading angle of the vehicle concerning the distance s traveled on the curve. Since the vehicle was assumed to move at a constant speed over a short period, and a vehicle following the Clothoid at a constant speed experienced a constant rate of angular acceleration, the sharpness α was a constant value that was calculated using the following formula:
α = e   =   q + 1 m     1 c e c q s e m q 1 = e   =   q + 1 m     1 θ e θ q s e c q s e m q 1 = e   =   q + 1 m     1 θ e s e 2 m q 1 ,   and θ q = 0 c q = 0 q m 2 m 3 ,
where θe represents the heading angle of the localization node in the coordinate system {Lq}. Since Lq is the origin, both θq and cq are zero. Meanwhile, the time intervals between the adjacent localization nodes were very short, such as a localization frequency of 10 Hz, and the time interval between the adjacent localization nodes was only 0.1 s. As a result, the curve interval Δse between the adjacent localization nodes could be approximated using a straight line Δle. Therefore, the calculation formula for sm was as follows:
s m e   =   q   +   1 m Δ   l e Δ   l m e   =   q   +   1 m     1 Δ   l e m q 1 ,   and q m 2 m 3   .
And then, to calculate the predicted heading angle of the localization node Lm in the coordinate system {Lq} based on the predicted position (x(sm), y(sm)):
θ   ( m ,   g ) = arctan ( y ( s m ) x ( s m ) ) .
Finally, the predicted global pose of the localization node Lm was calculated based on the global pose of Lq:
P   ( m ,   g ) G = P   q G   ·   P   ( m ,   g ) ( V ,   q ) ,
where P q G represents the global pose of Lq, and P ( m , g ) ( V , q ) derived from (x(sm), y(sm)), and θ(m,g) represents the predicted pose in the coordinate system {Lq}.
A check was performed by utilizing the global predicted pose of the current localization node Lm to determine whether it fell within the map coverage area. As illustrated in Figure 6, δ represents the estimated error of Lm’s global predicted pose, while ψ denotes the configured search radius. Hence, the sum of δ and ψ, (δ + ψ), represented the actual search radius. If there existed map nodes falling within the actual search range of Lm, it was considered to be within the map coverage area, and a localization candidate set was constructed based on these map nodes. Otherwise, Lm was regarded as being outside the map coverage area. As depicted in Figure 6, Mcandi = {M(k,i−1), M(k,i), M(k,i+1), M(k,i+2)} formed the localization candidate set for Lm.

3.5. Nearest Map Node Search with WH-KNN

The next step for the localization nodes within the map coverage area was to retrieve the nearest map node. This paper employed the WH-KNN algorithm [50] for searching the nearest map node. The WH-KNN algorithm tackled the problem of ambiguity recognition by introducing the weight values.
Figure 7 illustrates the WH-KNN algorithm. First, the current localization node Lm was matched with the localization candidate set Mcandi using SURF and ORB holistic feature matching. Based on the matching results, SURF and ORB decision spaces were constructed separately. In the SURF decision space, the Euclidean distance was used as the metric [37], while in the ORB decision space, the Hamming distance was used as the metric [38].
Then, the KNN algorithm was used to search for the NF neighbors in the SURF decision space, and similarly, to search for the NB neighbors in the ORB decision space. Based on this, a weight was assigned to each neighbor, where the weight of the nearest neighbor was the smallest, and the weights of the remaining neighbors increased accordingly. In the SURF decision space, the weight assignment formula for the NF searched neighbors was as follows:
W   F ( M η ) = β   ·   D   F ( L   m ,     M η ) η   = 1 N F D   F ( L   m ,     M η ) ,
where DF (Lm, Mη) represents the Euclidean distance between the SURF holistic features of the current localization, Lm, and the η-th nearest map node, Mη. In the ORB decision space, the weight assignment formula for the NB searched neighbors was as follows:
W   B ( M τ ) = σ   ·   D   B ( L   m ,     M τ ) τ   = 1 N B D   B ( L   m ,     M τ ) ,
where DB (Lm, Mτ) represents the Hamming distance between the ORB holistic features of the current localization, Lm, and the τ-th nearest map node, Mτ. The weighting coefficients β and σ represented the weights assigned to the two different types of holistic features, and the calculation formulas were as follows:
β = N F N F + N B ,     σ = N B N F + N B ,
Next, {Mη|η ∈ [1, NF]} and {Mτ|τ ∈ [1, NB]} were merged to create a new decision space {Mξ|ξ ≤ (NF + NB)}. The weight calculation was performed for each map node, Mξ, in the fused decision space.
W ( M ξ ) = M η = M ξ W F ( M η )     · M τ = M ξ W B ( M τ ) ,
As can be seen from the above formula, if a map node belonged to both {Mη|η ∈ [1, NF]} and {Mτ|τ ∈ [1, NB]}, its fusion weight was smaller. If a map node only belonged to either {Mη|η ∈ [1, NF]} or {Mτ|τ ∈ [1, NB]}, its final weight was equal to its initial weight.
If a map node was closer to the current localization node, Lm, its fusion weight should have been smaller. Therefore, the map node with the smallest fusion weight was selected as the nearest map node.
M nearest = arg   min { M ξ   |   ξ     (   N F + N B ) }   W ( M ξ ) ,

3.6. Metric Localization for Vehicle Pose

For the current localization node, Lm, if the nearest map node Mnearest was retrieved, the next step was to solve the final pose of the intelligent vehicle based on the local feature matching results. The specific steps were as follows. First, the ORB local feature set Ωquery was extracted from the around-view image of the current localization node, Lm, and matched with the ORB local feature set, Ωtrain, of the nearest map node Mnearest’s around-view image. Then, the random sample consensus (RANSAC) algorithm [53] was used to remove the mismatched feature pairs and retain the correct matching feature pairs, denoted as fquery and ftrain, where fqueryΩquery and ftrainΩtrain. Next, based on Formula (2), fquery was transformed to the vehicle coordinate system to obtain the feature set f q u e r y V . Based on the global pose of the nearest map node, Mnearest, and Formula (2), ftrain was transformed to the global coordinate system to obtain the feature point set f t r a i n G . Finally, based on the global predicted pose of the current localization node, Lm, the Levenberg–Marquardt (L–M) algorithm [54] was applied to associate f q u e r y V with f t r a i n G , to calculate the pose of the current localization node, Lm, in the global coordinate system.
It is essential to highlight that if the current localization node, Lm, fell outside the map coverage area, the global pose of the intelligent vehicle was calculated based on the local feature matching results between Lm and the preceding localization node Lm−1, employing a calculation method similar to that described earlier. Algorithm 1 effectively demonstrates the integration and execution process of the proposed intelligent underground localization method.
Algorithm 1 Intelligent underground localization algorithm
Input:
KBD: Key berths data for constructing the lightweight map
LD: Localization data from AVM
Output:
PD: Precise global pose data of the intelligent vehicle
   1: function generateLightweightMap(KBD):
   2:   Map ← initializeEmptyMap( )
   3:   for each DataNode in KBD:
   4:     fholistic ← extractHolisticFeatures(DateNode.image)
   5:     flocal ← extractLocalFeatures(DateNode.image)
   6:     Pmap ← calculateGlobalPose(DateNode.cornerPoints)
   7:     MapNode ← createNode(DateNode.id, fholistic, flocal, Pmap)
   8:     Map.addNode(MapNode)
   9:   end for
 10:   return Map
 11: function trajectoryPrediction (VehicleTrajectory):
 12:   if the VehicleTrajectory is a straight line:
 13:     PPredict ← linearExtrapolation(VehicleTrajectory)
 14:   else if the VehicleTrajectory is a curve:
 15:     PPredict ← clothoidTheory(VehicleTrajectory)
 16:   end if
 17:   return PPredict
 18: function multimodalLocalization(QueryImage, PPredict, Map):
 19:   if the PPredict is within the map coverage range:
 20:     fqueryHolistic ← extractHolisticFeatures(QueryImage)
 21:     fqueryLocal ← extractLocalFeatures(QueryImage)
 22:     Mcandi ← coarseLocalization(PPredict, Map)
 23:     Mnearest ← WH-KNN(fqueryHolistic, Mcandi)
 24:     Pfinal ← metricLocalization(fqueryLocal, Mnearest)
 25:   else if the PPredict is outside the map coverage range:
 26:     fqueryLocal ← extractLocalFeatures(QueryImage)
 27:     Pfinal ← odometryTheory(fqueryLocal)
 28:   end if
 29:   return Pfinal
 30: function mainProcess(KBD, LD):
 31:   PD ← initializeEmptyResult( )
 31:   Map ← generateLightweightMap(KBD)
 32:   for each LocalizationNode in LD:
 33:     PPredict ← trajectoryPrediction(VehicleTrajectory)
 34:     Pfinal ← multimodalLocalization(LocalizationNode.queryImage, PPredict, Map)
 35:     PD.addPose(Pfinal)
 36:   end for
 37:   return PD

4. Experimental Results

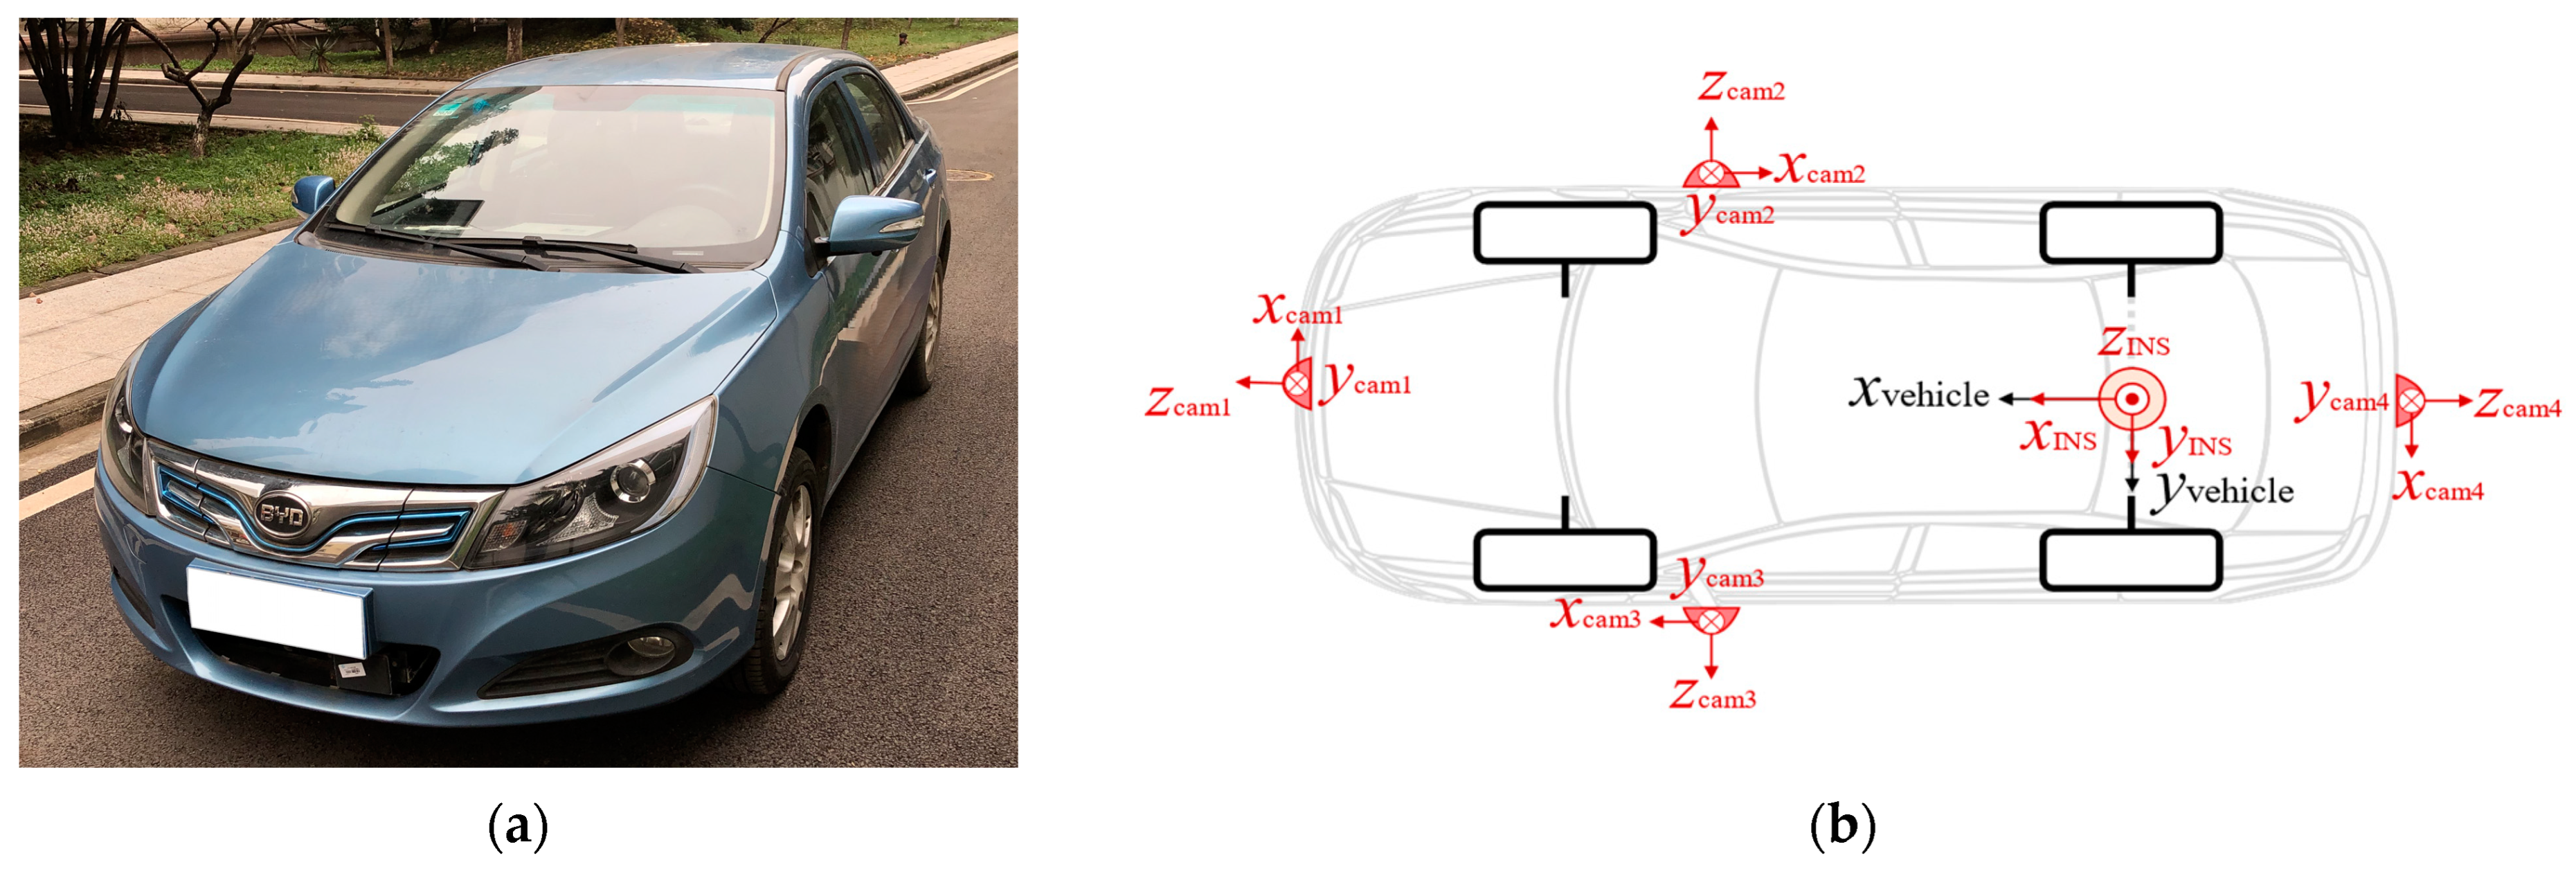
4.1. Scenes and Platforms Introduction

To validate the performance of the proposed localization method, this paper conducted experiments in two typical underground parking scenes, as shown in Figure 8. Figure 8a,b depicts an industrial park’s underground parking scene with a total experimental path length of approximately 146 m, an area of approximately 1145 m2, and a total of 24 berths. Figure 8c,d represents a mall’s underground parking scene with a total experimental path length of around 362 m, an area of approximately 6669 m2, and a total of 141 berths.
The test vehicle used in the experiments was the BYD e5 electric car, as shown in Figure 9a. Figure 9b illustrates the sensor installation positions. The vehicle was equipped with four fisheye cameras, installed respectively on the front and rear bumpers, as well as the left and right mirrors of the vehicle, to form an AVM. The data acquisition frequency of the AVM was 10 Hz, and the captured images had a pixel size of 416 × 416, with a physical scale factor of 0.02 m per pixel. The pixel coordinates at the rear axle center of the vehicle were Ur = (207, 285). Additionally, a high-performance inertial navigation system (INS) was installed at the rear axle center of the vehicle. The INS can still collect high-precision pose information even in enclosed indoor environments, such as underground parking scenes, serving as the ground truth for the localization system. The data acquisition frequency of the INS was 50 Hz. Time synchronization between the AVM and the INS was achieved through clock synchronization and interpolation. The computing platform used for the experiments was a laptop computer equipped with a 2.8 GHz Intel i7-7700HQ CPU and 4 GB RAM.

4.2. Datasets

The test vehicle collected three loops of data in each of the two experimental scenes at speeds below 20 km/h. In the industrial park’s underground parking scene, the three loops of data consisted of 330 nodes, 358 nodes, and 287 nodes, respectively. In the mall’s underground parking scene, the three loops of data comprised 1482 nodes, 1443 nodes, and 1658 nodes, respectively. The data from the first loop in both scenes were used for the map construction, while the data from the second and third loops were utilized for the localization experiments.
In this paper, the collected around-view images were subjected to linear pixel value scaling to reduce the illumination, thereby simulating around-view image data acquisition under low-light conditions, as shown in Figure 10. The left image in Figure 10 represents the original image captured under sufficient lighting conditions, while the right image has had its illumination reduced to 50% of the original. With the aforementioned processing, each loop of the localization data underwent four sets of experiments: Group 1, where both the lighting conditions for the localization data and the map data were strong; Group 2, where the lighting conditions for the localization data were weak while those for the map data were strong; Group 3, where the lighting conditions for the localization data were strong while those for the map data were weak; Group 4, where both the localization data and the map data had weak lighting conditions. In summary, this paper employed the method of linear pixel value scaling to control the illumination as a variable, allowing for the assessment of the proposed localization method’s robustness to varying lighting conditions.

4.3. Comparison Methods

This paper selected the literature [34] that shared the same core concept of “mapping first, then localization” as the comparison method. For the target localization scene, in [34], a dense map was constructed offline based on node models. During the online localization, [34] first generated the around-view images based on sensor data. Subsequently, it employed the quantity of the matched local feature pairs as a measurement criterion to achieve node-level localization within the map and to calculate the pose of the vehicle based on the result of the node-level localization. In this paper, a comprehensive evaluation was conducted in various aspects, including the memory requirements for the maps, the nearest map node retrieval, the metric localization, timeliness, and robustness, when compared with [34], to thoroughly assess the performance of the proposed method.
Simultaneously, to further evaluate the proposed method’s performance in terms of localization accuracy, robustness, and the ability to overcome cumulative errors, this paper selected the mature panoramic SLAM method, PAN-SLAM [25], as a comparative benchmark. This feature-based PAN-SLAM method calculated the target’s position based on panoramic image sequences, employing steps such as feature detection and matching, frame tracking, and loop closure detection. PAN-SLAM demonstrated outstanding localization performance across various scenarios.

4.4. Maps Construction

This paper constructed the maps based on the first loop of data collected from each underground parking scene. As shown in Figure 8b, there were a total of six key berths in the industrial park’s underground parking scene, and as shown in Figure 8d, there were a total of 13 key berths in the mall’s underground parking scene. Near each key berth, a certain number of nodes were selected to construct a map block. The selection of nodes followed two principles: firstly, the selected nodes’ around-view images should include the two outer corner points of the key berths; secondly, to avoid excessive density, there should be a certain distance between the adjacent nodes. It was performed to improve the efficiency of the map matching and ensure the real-time performance of the entire localization system. Based on the above criteria, the map constructed in the industrial park’s underground parking scene consisted of six blocks with 78 nodes. In the mall’s underground parking scene, the map consisted of 12 blocks with 277 nodes. The Euclidean distance between the adjacent nodes was approximately 0.5 m. Figure 11 illustrates the distribution of the map nodes in different underground parking scenes. It is worth noting that this paper constructed two maps for each underground parking scene based on the corresponding light intensities due to the variations in the lighting conditions.
Table 2 provides a comparison of the memory requirements for the maps constructed by the proposed method and Tao’s method [32]. The proposed method reduced map memory usage by over 75% compared with Tao’s method. This was because the proposed method constructed maps based on the key berths and selected a reasonable number of data nodes, resulting in a more lightweight map. In contrast, Tao’s method built maps based on all the data nodes, leading to redundancy and significantly increased memory requirements for the system. Additionally, in low-light conditions, the memory usage for the maps constructed was reduced by over 50% compared with well-lit conditions. This was because the number of local features was directly proportional to the lighting conditions. As shown in Figure 10, when the lighting was strong, the number of extracted local features was significantly higher, increasing the maps’ memory requirements.

4.5. Localization Initialization Step

In the localization experiments conducted in two typical underground parking scenes, the starting points were consistently positioned near key parking berths, that is, within the coverage range of the map. This approach was implemented to ensure that the system initiated the localization initialization process right from the outset, expediting the entire localization procedure. During the experiments, the number of nodes used to calculate the global pose of the vehicle based on the initialization step was set at five. It should be noted that if the starting point was positioned beyond the coverage range of the map, the holistic feature matching results between the localization nodes and the map nodes would serve as the triggering mechanism for the localization initialization step. Specifically, when a matching around-view image was detected from the map, it triggered the localization initialization step and completed the entire initialization procedure within the map block where the matched map node was located.

4.6. Trajectory Prediction Results

This paper provides a coarse pose for the intelligent vehicle in the underground parking scene through trajectory prediction, which helps to narrow the scope of the nearest map node retrieval and serves as a prior pose for metric localization. To improve the computational efficiency, the following formulas [52] were employed during the trajectory prediction process to approximate the values of the Fresnel cosine function C(x) and the sine function S(x):
C x = 1 2 + ω x sin π 2 x 2 ϕ x cos π 2 x 2 S x = 1 2 ω x cos π 2 x 2 ϕ x sin π 2 x 2 ω x = 1 + 0.926 x 2 + 1.792 x + 3.104 x 2 ϕ x = 1 2 + 4.142 x + 3.492 x 2 + 6.670 x 3
The results of the trajectory prediction experiments based on 16 sets of data are shown in Table 3. In the industrial park’s underground scene, the average error for each group of experiments fell within the range of [0.31 m, 0.51 m], with the maximum errors not exceeding 2.85 m. In the mall’s underground scene, the average error for each group of experiments was within the range of [0.39 m, 0.47 m], with the maximum errors not exceeding 2.23 m. The experimental results indicated that the trajectory prediction algorithm achieved an average prediction accuracy of approximately 0.4 m across multiple datasets in two typical underground parking scenes. Furthermore, the algorithm demonstrated a high precision, robustness, and consistent performance with a difference in the average error of no more than 0.11 m between the different scenes. Additionally, the maximum error of this trajectory prediction algorithm was less than 3 m. Therefore, in this paper, the threshold δ for the vehicle trajectory prediction error was set to 3 m, which adequately covered the actual errors occurring in the trajectory prediction algorithm. It is worth noting that the trajectory prediction aims to provide a coarse pose, so the algorithm was considered reasonable when the error was within a manageable range.
Once the coarse position of the vehicle was obtained, it could be checked whether the vehicle is within the coverage range of the map. The radius ψ for searching the map nodes was set to 3 m. Therefore, the actual search radius for the map nodes was (δ + ψ = 6 m), and the map nodes within this radius constituted the localization candidate set Mcandi. If the localization node was within the coverage range of the map, the next step was to retrieve the nearest map node.

4.7. Nearest Map Node Search Results

The evaluation method for the nearest map node retrieval experiments adopted commonly used metrics in loop-closure detection [55]. Specifically, when the vehicle was positioned between two adjacent map nodes, it was typically considered that both the nearest map node and the second nearest map node are the correct matching results. In other words, when the frame error was equal to 0 or equal to 1, both were considered correct matches. Here, the “frame error” refers to the node difference between the map nodes obtained in the experiment and the ground truth.
The value of K in the WH-KNN algorithm is a crucial factor directly related to the accuracy of the nearest map node retrieval. Therefore, before conducting the experiments on retrieving the nearest map nodes, it was essential to determine a reasonable value for K through experimentation. In this paper, Group 1 from each dataset was selected for experimentation, and an optimal value for K was chosen within the threshold range [2,8]. The experimental results are presented in Table 4. In the industrial park’s underground parking scene, the second loop of data achieved the best performance at K = 6, with a nearest map retrieval accuracy of 96.37% and an average error of 0.039 frames. For the third loop of data, the optimal result was achieved at K = 5, with a nearest map retrieval accuracy of 94.77% and an average error of 0.059 frames. In the mall’s underground parking scene, both loops of data performed optimally at K = 5, with nearest map retrieval accuracies of 95.36% and 93.67%, and average errors of 0.053 frames and 0.071 frames, respectively. From the above, it can be observed that the optimal performance was achieved at K = 5 for three of the four datasets. Only in the case of the second dataset in the industrial park’s underground parking scene did K = 5 yield a suboptimal result. However, the difference in performance was minimal, with an accuracy of only 0.56% lower and an error of 0.006 frames higher than the optimal result. In summary, choosing K = 5 was a reasonable choice.
After determining the value of K, the experiments for the nearest map node retrieval based on 16 sets of data were conducted, and the experimental results are shown in Table 5. In the industrial park’s underground parking scene, for our method, the accuracy for each group of experiments fell within the range of [93.03%, 96.09%], with average errors ranging from 0.045 to 0.080 frames. In contrast, for Tao’s method, the accuracy for each group of experiments was within the range of [41.81%, 77.37%], with the average errors ranging from 0.246 to 1.268 frames. In the mall’s underground parking scene, for our method, the accuracy for each group of experiments fell within the range of [92.52%, 95.63%], with the average errors ranging from 0.052 to 0.084 frames. In contrast, for Tao’s method, the accuracy for each group of experiments was within the range of [42.34%, 49.62%], with average errors ranging from 1.030 to 1.238 frames.
Based on the experimental results of the nearest map node retrieval, it was evident that the proposed method achieved a retrieval accuracy of over 92% in all scenes, with an average error not exceeding 0.09 frames. This reflects the high precision, robustness, and strong applicability of our method across different scenes. In contrast, Tao’s method failed to achieve a retrieval accuracy exceeding 78% in all scenes, and the discrepancy in retrieval accuracy between the different scenes could be as high as 33%. This indicates that Tao’s method has a lower retrieval accuracy and poorer scene adaptability. Compared with Tao’s method, our method significantly improved accuracy. This improvement can be attributed to our method’s encoding of images into a holistic feature and using the distance between the holistic features to represent the similarity between the nodes, which provided a more comprehensive and rational representation. Moreover, our method successfully resolved the problem of ambiguous recognition by utilizing the WH-KNN algorithm, which significantly enhanced the accuracy. Tao’s method relies on the quantity of matched local feature pairs to measure the node similarity. However, erroneous matching pairs can have a detrimental impact on the representation of node similarity, leading to a reduced retrieval accuracy.
Our method maintained a difference in accuracy of less than 2% under different lighting conditions for the same source data, while the accuracy difference for Tao’s method reached up to 22%. This demonstrated that our method’s resistance to lighting interference far surpassed the comparison method’s. The sensitivity of Tao’s method to lighting conditions was because when the lighting is sufficient, there was an abundance of matched local feature pairs, and the proportion of erroneous matching pairs among them was relatively low, resulting in a minor impact on the retrieval accuracy. However, when the lighting was weak, there were fewer matched local feature pairs, and the proportion of erroneous matching pairs among them was higher, significantly affecting the retrieval accuracy. In contrast, our method represented the similarity between the nodes based on the distance between the holistic features, effectively avoiding these issues and enhancing the resistance to lighting interference.

4.8. Metric Localization Results

The results of the metric localization for our method and the comparison methods are presented in Table 6. Figure 12 shows the comparison of the localization trajectories and the cumulative error distribution between the three methods in the industrial park’s underground parking scene, while Figure 13 displays the same data for the mall’s underground parking scene.
In the industrial park underground parking scene, our method achieved an average error in the range of [0.262 m, 0.429 m] for each experiment, with the percentage of nodes with errors less than 0.6 m ranging from 85.71% to 99.16%. In contrast, Tao’s method had an average error in the range of [0.329 m, 1.158 m] for each experiment, with the percentage of nodes with errors less than 0.6 m ranging from 40.77% to 82.4%. PAN-SLAM had an average error in the range of [0.313 m, 0.492 m] for each experiment, with the percentage of nodes with errors less than 0.6 m ranging from 62.72% to 89.66%.
In the mall’s underground parking scene, our method resulted in an average error in the range of [0.355 m, 0.408 m] for each experiment, with the percentage of nodes with errors less than 0.6 m ranging from 83.84% to 91.55%. In contrast, Tao’s method had an average error in the range of [1.155 m, 1.432 m] for each experiment, with the percentage of nodes with errors less than 0.6 m ranging from 9.83% to 16.22%. PAN-SLAM had an average error in the range of [0.587 m, 0.754 m] for each experiment, with the percentage of nodes with errors less than 0.6 m ranging from 41.80% to 53.43%.
Based on the results of the metric localization experiments, our method achieved an average localization accuracy of approximately 30 cm on multiple test datasets in two typical underground parking scenarios. Moreover, around 90% of nodes had errors less than 0.6 m, indicating that our method offered a high localization accuracy, robustness, and strong applicability across different scenes. In contrast, Tao’s method had an overall average localization accuracy of approximately 1.15 m, with the highest difference in the localization accuracy between different scenes reaching up to 0.94 m. This indicated that Tao’s method had a lower localization accuracy and poor scene adaptability. Compared with Tao’s method, our method significantly improved the localization accuracy. This improvement can mainly be attributed to the superior performance of our method in the nearest map node retrieval process. To explain further, they are more similar when the retrieved map node is closer to the localization node. Consequently, the number of matched local feature pairs increased, which aided in solving the pose relationship between them. The cumulative error distribution in Figure 12 and Figure 13 demonstrated that our method exhibited minimal localization fluctuations, while Tao’s method suffered from many localization outliers. This highlighted the superior stability of our method compared with Tao’s method.
The localization accuracy of PAN-SLAM was approximately 54 cm on multiple datasets in two typical underground parking scenarios. Compared with PAN-SLAM, our method improved the localization accuracy by around 24 cm, demonstrating a superior localization performance in various positioning scenarios. Although PAN-SLAM showed a good localization performance, it suffered from the phenomenon of cumulative errors, especially as the travel trajectory became longer, making this cumulative error more pronounced. In contrast, our method effectively avoided the accumulation of errors by employing a progressive map-matching strategy. This ensured not only localization accuracy but also maintained the robustness of the localization system.
Considering the overall experimental results, Group 1 performed the best. This meant that the metric localization performance was optimal when both the localization and map data had sufficient lighting conditions. This was because the number of matched local feature pairs was directly proportional to the lighting conditions, as shown in Figure 14. When the lighting was sufficient, the number of matches was significantly higher compared with the weak lighting conditions, and a greater number of matched local feature pairs contributed positively to the localization accuracy. However, our method maintained a difference in the accuracy of less than 0.1 m under varying lighting conditions for the same-source data. This indicated that the lighting had a very limited impact on our method’s performance in the metric localization because our method could maintain a high accuracy in the nearest map node retrieval, even under different lighting conditions. Therefore, a relatively abundant set of matched local feature pairs could still be ensured when the lighting was weak.

4.9. Time Consumption Results

The comparison of the results regarding localization time between our method and the comparison methods is presented in Table 7. In the industrial park’s underground parking scene, our method achieved an average localization time ranging from 102 ms to 155 ms for each group of experiments, while Tao’s method resulted in an average localization time ranging from 1469 ms to 1993 ms. PAN-SLAM resulted in an average localization time ranging from 98 ms to 121 ms.
In the mall’s underground parking scene, our method’s average localization time for each group of experiments fell within the range of 122 ms to 165 ms, while the Tao meth-od’s average localization time ranged from 1731 ms to 1965 ms. PAN-SLAM resulted in an average localization time ranging from 105 ms to 125 ms.
Based on the experimental results regarding the localization time, our method achieved a localization time of no more than 155 ms in all scenes, meeting the real-time requirements. In contrast, Tao’s method exhibited a localization cycle of no less than 1731 ms across all scenes, indicating a more extended localization period. Compared with Tao’s method, our method significantly enhanced the localization efficiency, which was primarily attributable to utilizing the holistic features. On one hand, encoding the images directly into a holistic feature drastically reduced the feature extraction time. On the other hand, representing the similarity between the nodes with the distances between the holistic features reduced the feature matching time. Tao’s method relied on the number of matched local feature pairs to represent the node similarity, and since there are hundreds of local features on each image, both the feature extraction and matching required a considerable time to complete. Furthermore, the Tao method’s map nodes were densely distributed, resulting in more map nodes in the localization candidate set Mcandi, further extending the localization time.
PAN-SLAM relied primarily on feature matching between the adjacent panoramic images to achieve localization, thereby achieving a high localization frequency. Our method accelerated the map node retrieval efficiency by employing holistic feature matching, maintaining a localization frequency comparable with PAN-SLAM. Consequently, both our method and PAN-SLAM met the requirements for the positioning timeliness.

5. Conclusions

This paper first proposed an enhanced berth mapping model for underground parking scenes. The generated lightweight map was distributed in block form around key parking berths, and each map block consisted of a certain number of discrete nodes. Furthermore, a high-precision multimodal localization method was proposed that integrated the lightweight map and the Clothoid trajectory prediction. This method used trajectory prediction to determine the position range of the vehicle and employed an adaptive localization strategy that matched the prediction result. The experiments were conducted in two typical underground parking scenes, leading to the following conclusions:
  • The proposed representation method constructed a lightweight map based on the scene data associated with the key berths, effectively compressing the memory requirements of the map while assisting the intelligent vehicles in achieving high-precision positioning. Additionally, it offered the advantages of a low mapping cost, a low maintenance cost, and high practicality.
  • The proposed localization method achieved a trajectory prediction accuracy of 40 cm on multiple datasets from two typical underground parking scenes. Meanwhile, the accuracy of the nearest map node retrieval exceeded 92%, and the metric localization accuracy met the 30 cm standard. This demonstrated that the proposed localization method possessed high precision, robustness, and applicability to diverse scenes. Simultaneously, under varying lighting conditions for the same source data, the method controlled the differences in various indicators within a narrow range, showcasing its strong resistance to light interference.
  • The proposed localization method, based on a lightweight enhanced berth map, utilized the distance between the holistic features to represent the similarity between the nodes, effectively reducing the localization time and achieving a localization frequency of approximately 10 Hz, thus meeting the real-time requirements. This demonstrated the low spatial and temporal complexity and low operational cost of the localization system.
In our future research plans, we will continue to focus on around-view images of underground parking lot scenes and develop semantic feature extraction and matching methods to replace the role of traditional features in the localization system. This will improve the real-time performance, accuracy, and robustness of the system.

Author Contributions

Conceptualization, F.L. and Z.H.; methodology, F.L.; software, F.L.; validation, F.L. and Y.Y.; formal analysis, F.L.; investigation, F.L. and Y.Y.; writing—original draft preparation, F.L. and J.C.; writing—review and editing, F.L. and X.L.; visualization, J.C.; supervision, F.L. and Z.H.; project administration, Z.H. and X.L.; funding acquisition, X.L. All authors have read and agreed to the published version of the manuscript.

Funding

This research was funded by the National Natural Science Foundation of China, grant number U20A20198.

Institutional Review Board Statement

Not applicable.

Informed Consent Statement

Not applicable.

Data Availability Statement

The data presented in this study are available on request from the corresponding author. The data are not publicly available due to privacy.

Conflicts of Interest

The authors declare no conflicts of interest.

References

  1. Chen, Y.; Zhang, H.; Wang, F.-Y. Society-Centered and DAO-Powered Sustainability in Transportation 5.0: An Intelligent Vehicles Perspective. IEEE Trans. Intell. Veh. 2023, 8, 2635–2638. [Google Scholar] [CrossRef]
  2. Nielsen, K.; Hendeby, G. Multi-Hypothesis SLAM for Non-Static Environments with Reoccurring Landmarks. IEEE Trans. Intell. Veh. 2023, 8, 3191–3203. [Google Scholar] [CrossRef]
  3. Li, X. GNSS Repeater Based Differential Indoor Positioning with Multi-Epoch Measurements. IEEE Trans. Intell. Veh. 2023, 8, 803–813. [Google Scholar] [CrossRef]
  4. Dinh-Van, N.; Nashashibi, F.; Thanh-Huong, N.; Castelli, E. Indoor Intelligent Vehicle Localization Using WiFi Received Signal Strength Indicator. In Proceedings of the 2017 IEEE MTT-S International Conference on Microwaves for Intelligent Mobility (ICMIM), Nagoya, Japan, 19–21 March 2017; pp. 33–36. [Google Scholar]
  5. Yu, K.; Wen, K.; Li, Y.; Zhang, S.; Zhang, K. A Novel NLOS Mitigation Algorithm for UWB Localization in Harsh Indoor Environments. IEEE Trans. Veh. Technol. 2019, 68, 686–699. [Google Scholar] [CrossRef]
  6. Zhu, X.; Qiu, T.; Atiquzzaman, M. BLS-Location: A Wireless Fingerprint Localization Algorithm Based on Broad Learning. IEEE Trans. Mob. Comput. 2023, 22, 115–128. [Google Scholar] [CrossRef]
  7. Shu, C.; Luo, Y. Multi-Modal Feature Constraint Based Tightly Coupled Monocular Visual-LiDAR Odometry and Mapping. IEEE Trans. Intell. Veh. 2023, 8, 3384–3393. [Google Scholar] [CrossRef]
  8. Xia, C.; Shen, Y.; Yang, Y.; Deng, X.; Chen, S.; Xin, J.; Zheng, N. Onboard Sensors-Based Self-Localization for Autonomous Vehicle with Hierarchical Map. IEEE Trans. Cybern. 2023, 53, 4218–4231. [Google Scholar] [CrossRef] [PubMed]
  9. Zhao, C.; Song, A.; Zhu, Y.; Jiang, S.; Liao, F.; Du, Y. Data-Driven Indoor Positioning Correction for Infrastructure-Enabled Autonomous Driving Systems: A Lifelong Framework. IEEE Trans. Intell. Transp. Syst. 2023, 24, 3908–3921. [Google Scholar] [CrossRef]
  10. Tang, Y.; Hu, Y.; Cui, J.; Liao, F.; Lao, M.; Lin, F.; Teo, R.S.H. Vision-Aided Multi-UAV Autonomous Flocking in GPS-Denied Environment. IEEE Trans. Ind. Electron. 2019, 66, 616–626. [Google Scholar] [CrossRef]
  11. Wu, F.; Duan, J.; Ai, P.; Chen, Z.; Yang, Z.; Zou, X. Rachis Detection and Three-Dimensional Localization of Cut off Point for Vision-Based Banana Robot. Comput. Electron. Agric. 2022, 198, 107079. [Google Scholar] [CrossRef]
  12. Shi, P.; Zhu, Z.; Sun, S.; Rong, Z.; Zhao, X.; Tan, M. Covariance Estimation for Pose Graph Optimization in Visual-Inertial Navigation Systems. IEEE Trans. Intell. Veh. 2023, 8, 3657–3667. [Google Scholar] [CrossRef]
  13. Zhang, Z.; Zhao, J.; Huang, C.; Li, L. Learning Visual Semantic Map-Matching for Loosely Multi-Sensor Fusion Localization of Autonomous Vehicles. IEEE Trans. Intell. Veh. 2023, 8, 358–367. [Google Scholar] [CrossRef]
  14. Nister, D.; Naroditsky, O.; Bergen, J. Visual Odometry. In Proceedings of the Proceedings of the 2004 IEEE Computer Society Conference on Computer Vision and Pattern Recognition, CVPR 2004, Washington, DC, USA, 27 June–2 July 2004. [Google Scholar]
  15. Li, M.; Mourikis, A.I. High-Precision, Consistent EKF-Based Visual-Inertial Odometry. Int. J. Robot. Res. 2013, 32, 690–711. [Google Scholar] [CrossRef]
  16. Yusefi, A.; Durdu, A.; Bozkaya, F.; Tığlıoğlu, Ş.; Yılmaz, A.; Sungur, C. A Generalizable D-VIO and Its Fusion with GNSS/IMU for Improved Autonomous Vehicle Localization. IEEE Trans. Intell. Veh. 2023, 9, 2893–2907. [Google Scholar] [CrossRef]
  17. Lategahn, H.; Stiller, C. Vision-Only Localization. IEEE Trans. Intell. Transp. Syst. 2014, 15, 1246–1257. [Google Scholar] [CrossRef]
  18. Endres, F.; Hess, J.; Sturm, J.; Cremers, D.; Burgard, W. 3-D Mapping With an RGB-D Camera. IEEE Trans. Robot. 2014, 30, 177–187. [Google Scholar] [CrossRef]
  19. Chalvatzaras, A.; Pratikakis, I.; Amanatiadis, A.A. A Survey on Map-Based Localization Techniques for Autonomous Vehicles. IEEE Trans. Intell. Veh. 2023, 8, 1574–1596. [Google Scholar] [CrossRef]
  20. Mur-Artal, R.; Tardós, J.D. ORB-SLAM2: An Open-Source SLAM System for Monocular, Stereo, and RGB-D Cameras. IEEE Trans. Robot. 2017, 33, 1255–1262. [Google Scholar] [CrossRef]
  21. Sun, Y.; Liu, M.; Meng, M.Q.-H. Improving RGB-D SLAM in Dynamic Environments: A Motion Removal Approach. Robot. Auton. Syst. 2017, 89, 110–122. [Google Scholar] [CrossRef]
  22. Labbé, M.; Michaud, F. RTAB-Map as an Open-Source Lidar and Visual Simultaneous Localization and Mapping Library for Large-Scale and Long-Term Online Operation. J. Field Robot. 2019, 36, 416–446. [Google Scholar] [CrossRef]
  23. Fuentes-Pacheco, J.; Ruiz-Ascencio, J.; Rendón-Mancha, J.M. Visual Simultaneous Localization and Mapping: A Survey. Artif. Intell. Rev. 2015, 43, 55–81. [Google Scholar] [CrossRef]
  24. Cho, H.; Kim, E.K.; Kim, S. Indoor SLAM Application Using Geometric and ICP Matching Methods Based on Line Features. Robot. Auton. Syst. 2018, 100, 206–224. [Google Scholar] [CrossRef]
  25. Ji, S.; Qin, Z.; Shan, J.; Lu, M. Panoramic SLAM from a Multiple Fisheye Camera Rig. ISPRS J. Photogramm. Remote Sens. 2020, 159, 169–183. [Google Scholar] [CrossRef]
  26. Cai, Y.; Lu, Z.; Wang, H.; Chen, L.; Li, Y. A Lightweight Feature Map Creation Method for Intelligent Vehicle Localization in Urban Road Environments. IEEE Trans. Instrum. Meas. 2022, 71, 8503115. [Google Scholar] [CrossRef]
  27. Lin, K.; Chen, M.; Deng, J.; Hassan, M.M.; Fortino, G. Enhanced Fingerprinting and Trajectory Prediction for IoT Localization in Smart Buildings. IEEE Trans. Autom. Sci. Eng. 2016, 13, 1294–1307. [Google Scholar] [CrossRef]
  28. Leordeanu, M.; Paraicu, I. Driven by Vision: Learning Navigation by Visual Localization and Trajectory Prediction. Sensors 2021, 21, 852. [Google Scholar] [CrossRef] [PubMed]
  29. Guo, C.; Lin, M.; Guo, H.; Liang, P.; Cheng, E. Coarse-to-Fine Semantic Localization with HD Map for Autonomous Driving in Structural Scenes. In Proceedings of the 2021 IEEE/RSJ International Conference on Intelligent Robots and Systems (IROS), Prague, Czech Republic, 27 September–1 October 2021; pp. 1146–1153. [Google Scholar]
  30. Li, J.; Jiang, F.; Yang, J.; Kong, B.; Gogate, M.; Dashtipour, K.; Hussain, A. Lane-DeepLab: Lane Semantic Segmentation in Automatic Driving Scenarios for High-Definition Maps. Neurocomputing 2021, 465, 15–25. [Google Scholar] [CrossRef]
  31. Wang, H.; Xue, C.; Zhou, Y.; Wen, F.; Zhang, H. Visual Semantic Localization Based on HD Map for Autonomous Vehicles in Urban Scenarios. In Proceedings of the 2021 IEEE International Conference on Robotics and Automation (ICRA), Xi’an, China, 30 May–5 June 2021; pp. 11255–11261. [Google Scholar]
  32. Gallazzi, B.; Cudrano, P.; Frosi, M.; Mentasti, S.; Matteucci, M. Clothoidal Mapping of Road Line Markings for Autonomous Driving High-Definition Maps. In Proceedings of the 2022 IEEE Intelligent Vehicles Symposium (IV), Aachen, Germany, 4–9 June 2022; pp. 1631–1638. [Google Scholar]
  33. Wen, T.; Jiang, K.; Wijaya, B.; Li, H.; Yang, M.; Yang, D. TM3Loc: Tightly-Coupled Monocular Map Matching for High Precision Vehicle Localization. IEEE Trans. Intell. Transp. Syst. 2022, 23, 20268–20281. [Google Scholar] [CrossRef]
  34. Tao, Q.; Hu, Z.; Huang, G.; Cai, H.; Xianglong, W. LiDAR-Only Vehicle Localization Based on Map Generation. In Proceedings of the Transportation Research Board (TRB), 2019 Annual Meeting, Washington, DC, USA, 10 January 2020. [Google Scholar]
  35. Bansal, M.; Kumar, M.; Kumar, M. 2D Object Recognition: A Comparative Analysis of SIFT, SURF and ORB Feature Descriptors. Multimed. Tools Appl. 2021, 80, 18839–18857. [Google Scholar] [CrossRef]
  36. Lowe, D.G. Distinctive Image Features from Scale-Invariant Keypoints. Int. J. Comput. Vis. 2004, 60, 91–110. [Google Scholar] [CrossRef]
  37. Bay, H.; Ess, A.; Tuytelaars, T.; Van Gool, L. Speeded-Up Robust Features (SURF). Comput. Vis. Image Underst. 2008, 110, 346–359. [Google Scholar] [CrossRef]
  38. Rublee, E.; Rabaud, V.; Konolige, K.; Bradski, G. ORB: An Efficient Alternative to SIFT or SURF. In Proceedings of the 2011 International Conference on Computer Vision, Barcelona, Spain, 6–13 November 2011; pp. 2564–2571. [Google Scholar]
  39. Charmette, B.; Royer, E.; Chausse, F. Vision-Based Robot Localization Based on the Efficient Matching of Planar Features. Mach. Vis. Appl. 2016, 27, 415–436. [Google Scholar] [CrossRef]
  40. Li, J.; Hu, Q.; Ai, M. RIFT: Multi-Modal Image Matching Based on Radiation-Variation Insensitive Feature Transform. IEEE Trans. Image Process. 2020, 29, 3296–3310. [Google Scholar] [CrossRef] [PubMed]
  41. Bampis, L.; Gasteratos, A. Revisiting the Bag-of-Visual-Words Model: A Hierarchical Localization Architecture for Mobile Systems. Robot. Auton. Syst. 2019, 113, 104–119. [Google Scholar] [CrossRef]
  42. Gomez-Ojeda, R.; Moreno, F.-A.; Zuniga-Noel, D.; Scaramuzza, D.; Gonzalez-Jimenez, J. PL-SLAM: A Stereo SLAM System Through the Combination of Points and Line Segments. IEEE Trans. Robot. 2019, 35, 734–746. [Google Scholar] [CrossRef]
  43. Yin, P.; Srivatsan, R.A.; Chen, Y.; Li, X.; Zhang, H.; Xu, L.; Li, L.; Jia, Z.; Ji, J.; He, Y. MRS-VPR: A Multi-Resolution Sampling Based Global Visual Place Recognition Method. In Proceedings of the 2019 International Conference on Robotics and Automation (ICRA), Montreal, QC, Canada, 20–24 May 2019; pp. 7137–7142. [Google Scholar]
  44. Maddern, W.; Milford, M.; Wyeth, G. CAT-SLAM: Probabilistic Localisation and Mapping Using a Continuous Appearance-Based Trajectory. Int. J. Robot. Res. 2012, 31, 429–451. [Google Scholar] [CrossRef]
  45. Zhang, C.; Du, B. Image-Based Approach for Parking-Spot Detection with Occlusion Handling. J. Transp. Eng. Part A Syst. 2020, 146, 04020098. [Google Scholar] [CrossRef]
  46. Huang, Y.; Zhao, J.; He, X.; Zhang, S.; Feng, T. Vision-Based Semantic Mapping and Localization for Autonomous Indoor Parking. In Proceedings of the 2018 IEEE Intelligent Vehicles Symposium (IV), Changshu, China, 26–30 June 2018; pp. 636–641. [Google Scholar]
  47. Li, J.; Lou, J.; Li, Y.; Pan, S.; Xu, Y. Trajectory Tracking of Autonomous Vehicle Using Clothoid Curve. Appl. Sci. 2023, 13, 2733. [Google Scholar] [CrossRef]
  48. Zhang, S.; Wang, R.; Jian, Z.; Zhan, W.; Zheng, N.; Tomizuka, M. Clothoid-Based Reference Path Reconstruction for HD Map Generation. Trans. Intell. Transport. Sys. 2023, 25, 587–601. [Google Scholar] [CrossRef]
  49. Lin, P.; Javanmardi, E.; Tsukada, M. Clothoid Curve-Based Emergency-Stopping Path Planning with Adaptive Potential Field for Autonomous Vehicles. IEEE Trans. Veh. Technol. 2024, 1–16. [Google Scholar] [CrossRef]
  50. Liu, G.; Hu, Z. Fast Loop Closure Detection Based on Holistic Features from SURF and ORB. Robot 2017, 39, 36–45. [Google Scholar] [CrossRef]
  51. Kimia, B.B.; Frankel, I.; Popescu, A.-M. Euler Spiral for Shape Completion. Int. J. Comput. Vis. 2003, 54, 159–182. [Google Scholar] [CrossRef]
  52. Abramowitz, M.; Stegun, I.A.; Miller, D. Handbook of Mathematical Functions with Formulas, Graphs and Mathematical Tables (National Bureau of Standards Applied Mathematics Series No. 55). J. Appl. Mech. 1965, 32, 239. [Google Scholar] [CrossRef]
  53. Fischler, M.A.; Bolles, R.C. Random Sample Consensus: A Paradigm for Model Fitting with Applications to Image Analysis and Automated Cartography. Commun. ACM 1981, 24, 381–395. [Google Scholar] [CrossRef]
  54. Marquardt, D.W. An Algorithm for Least-Squares Estimation of Nonlinear Parameters. J. Soc. Ind. Appl. Math. 1963, 11, 431–441. [Google Scholar] [CrossRef]
  55. Cummins, M.; Newman, P. FAB-MAP: Probabilistic Localization and Mapping in the Space of Appearance. Int. J. Robot. Res. 2008, 27, 647–665. [Google Scholar] [CrossRef]
Figure 1. The illustration of the proposed localization method.
Applsci 14 05032 g001
Figure 2. The illustration of the enhanced berth mapping. Each key berth is associated with a map block, which consists of a certain number of map nodes. Each node contains information on three elements: holistic features, local features, and the pose of the mapping vehicle. It is important to note that the SURF feature descriptor is a 64-dimensional vector, while the ORB feature descriptor is a 256-bit binary string.
Applsci 14 05032 g002
Figure 3. The illustration of global position collection for the key berths’ corner points.
Applsci 14 05032 g003
Figure 4. The illustration of coordinate transformation from the pixel coordinate system to the vehicle coordinate system.
Applsci 14 05032 g004
Figure 5. The vehicle trajectory can be classified into two types: (a) represents the trajectory of straight-line driving, and (b) represents the trajectory of curved driving approximated as a Clothoid.
Applsci 14 05032 g005
Figure 6. Coarse localization involved checking whether the localization node was within the map coverage area based on the predicted pose. If it was within the coverage area, a preliminary selection of map nodes was performed based on the predicted pose.
Applsci 14 05032 g006
Figure 7. The illustration of WH-KNN. The SURF decision space refers to the holistic SURF feature matching results between the current localization node, Lm, and the localization candidate set, Mcandi. Similarly, the ORB decision space refers to the holistic ORB feature matching results between the current localization node, Lm, and the localization candidate set, Mcandi.
Applsci 14 05032 g007
Figure 8. Experimental scenes. (a) Depicts the experimental path in the industrial park’s underground parking scene; (b) shows the distribution of the berths in the industrial park’s underground parking scene; (c) illustrates the experimental path in the mall’s underground parking scene; (d) displays the distribution of the berths in the mall’s underground parking scene.
Applsci 14 05032 g008
Figure 9. Experimental platforms. (a) Shows the test vehicle used in the experiments is the BYD e5 electric car; (b) illustrates the sensor installation locations.
Applsci 14 05032 g009
Figure 10. Contrast of lighting intensity. The left image represents the original image with sufficient lighting. The right image, subjected to linear pixel value scaling, has had the lighting intensity reduced to 50% of the original image. The green circles in the images denote the extracted local features.
Applsci 14 05032 g010
Figure 11. Distribution of map nodes. (a) Depicts the distribution of the map nodes in the industrial park’s underground parking scenes; (b) illustrates the distribution of the map nodes in the mall’s underground parking scene. The coordinates (41,517,770, 3,462,200) and (41,486,100, 3,455,580) correspond to the base coordinates of the map nodes in their respective underground parking scenes. For instance, if a map node of the industrial park’s underground parking scene is displayed at coordinate (30, 15) in the figure, the actual coordinates would be (41,517,770 + 30, 3,462,200 + 15).
Applsci 14 05032 g011
Figure 12. Comparison of the metric localization results between our method and the comparison methods in the industrial park’s underground parking scene. (a,b) Depict the localization trajectories and the cumulative error distribution based on the data from the second loop; (c,d) show the localization trajectories and the cumulative error distribution based on the data from the third loop. The cumulative error distribution refers to the percentage of localization nodes within each error level relative to the total number of localization nodes.
Applsci 14 05032 g012aApplsci 14 05032 g012b
Figure 13. Comparison of metric localization results between our method and the comparison methods in the mall’s underground parking scene. (a,b) Depict the localization trajectories and cumulative error distribution based on the data from the second loop; (c,d) show the localization trajectories and cumulative error distribution based on the data from the third loop.
Applsci 14 05032 g013
Figure 14. Comparison of the local feature matching results under different lighting conditions. (ad) Depict the lighting conditions for Group 1, Group 2, Group 3, and Group 4, respectively.
Applsci 14 05032 g014
Table 1. Overview of the literature review.
Classical Localization in Unknown EnvironmentsLocalization ProcessClassification of MethodsDisadvantages
Visual localization methodVisual map constructionHD map [29,30,31,32,33]Large data volume, high storage requirements, and low matching efficiency
Lightweight map [26]Less features, reduced accuracy
Map-based localizationSparse feature-based matching methods [13,34,35,36,37,38,39,40]Insufficient matching accuracy
Multi-level matching method [31,41,42]Mismatching of feature points in repeated textures
“Coarse-to-fine” matching strategy [43]High dependence on node density
Localization method considering trajectory prediction [27,28,44]High dependence on node density
Visual localization in underground parking lotsPanoramic monitoring for identifying idle parking spaces [45]Unable to obtain precise pose of parking spaces and vehicle
Berth codes matching method [46]Mismatching caused by encoding occlusion
Table 2. Memory requirements comparison for the maps constructed by different methods.
SceneMethodMemory Requirements (MB)
Strong LightWeak Light
Industrial parkOurs4.42.2
Tao’s17.78.1
MallOurs22.39.6
Tao’s114.151.0
Table 3. Comparison of the trajectory prediction results for each experimental group.
SceneLoop NumberAverage Error (m)Max Error (m)
Group 1Group 2Group 3Group 4Group 1Group 2Group 3Group 4
Industrial park2nd0.310.340.440.371.672.142.852.38
3rd0.380.400.510.431.211.891.851.91
Mall2nd0.390.410.410.401.982.081.991.80
3rd0.420.420.470.451.641.622.231.60
Table 4. Comparison of the results for the different K values in nearest map node retrieval.
K’s ValueIndustrial ParkMall
2nd Loop3rd Loop2nd Loop3rd Loop
Accuracy
(%)
K = 293.0192.3387.5385.46
K = 393.8593.0390.7889.69
K = 495.2594.0893.4991.86
K = 595.8194.7795.3693.67
K = 696.3793.7394.1192.16
K = 795.8193.0393.0091.13
K = 894.9792.3392.3390.59
Average error
(frames)
K = 20.0810.0980.1730.188
K = 30.0780.0870.1200.128
K = 40.0530.0660.0800.093
K = 50.0450.0590.0530.071
K = 60.0390.0730.0730.090
K = 70.0470.0800.0890.106
K = 80.0590.0870.1110.113
Table 5. Comparison of the results for the different methods in nearest map node search.
SceneLoop NumberMethodAccuracy (%)Average Error (Frames)
Group
1
Group
2
Group
3
Group
4
Group
1
Group
2
Group
3
Group
4
Industrial park2ndOurs95.8195.8195.5396.090.0450.0470.0500.047
Tao’s77.3775.1460.3470.110.2460.2850.8600.419
3rdOurs94.7793.0394.4393.380.0590.0800.0700.080
Tao’s63.7660.9841.8156.100.4150.4981.2680.662
Mall2ndOurs95.3695.5095.6395.430.0530.0520.0530.059
Tao’s49.6249.6248.6548.581.0301.0631.0461.086
3rdOurs93.6792.8892.7092.520.0710.0810.0830.084
Tao’s44.9945.6642.3444.151.1841.1981.2351.238
Table 6. Comparison of the results for the different methods in the metric localization.
SceneLoopMethodAverage Error (m)Percentage of Nodes with Error < 0.6 m (%)
Group
1
Group
2
Group
3
Group
4
Group
1
Group
2
Group
3
Group
4
Industrial park2ndOurs0.2620.2810.3640.30099.1698.3290.5094.69
Tao’s0.3290.3620.8030.50382.4081.2860.8975.70
PAN-SLAM0.3130.4160.3130.41689.6673.1889.6673.18
3rdOurs0.3390.3520.4290.37297.5695.4785.7194.43
Tao’s0.5420.5791.1580.72564.1162.3740.7759.23
PAN-SLAM0.4040.4920.4040.49274.2262.7274.2262.72
Mall2ndOurs0.3550.3620.3620.35791.2790.8590.5191.55
Tao’s1.1551.1791.1931.17116.2214.4815.3214.83
PAN-SLAM0.5870.7310.5870.73153.4343.2453.4343.24
3rdOurs0.3730.3720.4080.39688.9689.0283.8485.52
Tao’s1.2671.2671.4321.35411.8410.989.8310.01
PAN-SLAM0.6610.7540.6610.75449.1941.8049.1941.80
Table 7. The comparison of the results for different methods in terms of the localization time.
SceneLoopMethodAverage Time Consumption (ms)
Group 1Group 2Group 3Group 4
Industrial park2ndOurs132114145119
Tao’s1765154019471490
PAN-SLAM116101116101
3rdOurs144102155107
Tao’s1798151019931469
PAN-SLAM1219812198
Mall2ndOurs131125149122
Tao’s1906173119451763
PAN-SLAM118105118105
3rdOurs161146165149
Tao’s1947186119651883
PAN-SLAM125113125113
Disclaimer/Publisher’s Note: The statements, opinions and data contained in all publications are solely those of the individual author(s) and contributor(s) and not of MDPI and/or the editor(s). MDPI and/or the editor(s) disclaim responsibility for any injury to people or property resulting from any ideas, methods, instructions or products referred to in the content.

