Article

Finite Element Analysis of Prefabricated Semi-Rigid Concrete Beam–Column Joint with Steel Connections

Hunan Provincial Key Laboratory of Engineering Rheology, Central South University of Forestry and Technology, Changsha 410004, China
*
Author to whom correspondence should be addressed.
Appl. Sci. 2024, 14(12), 5070; https://doi.org/10.3390/app14125070
Submission received: 7 May 2024 / Revised: 31 May 2024 / Accepted: 31 May 2024 / Published: 11 June 2024

Abstract

:
This paper introduces a novel type of prefabricated semi-rigid concrete beam–column joint, aiming to examine its load-carrying capacity and seismic performance in comparison with a traditional cast-in-place joint. This study utilized the ABAQUS 2020 software to establish finite element models for both types of joints and conducted finite element analysis under low circumferential reciprocating displacement loads. When comparing the energy dissipation capacity, ductility, ultimate load-carrying capacity, stress mechanism, and damage mode, a comprehensive evaluation of the two types of joints was performed. Furthermore, this study investigated the impacts of various factors such as the axial compression ratio, concrete strength, reinforcement strength, and connector strength on the ultimate load-carrying capacity, ductility, and energy dissipation performance of the joints. Based on the findings, the newly combined joint exhibited a substantial 31.7% increase in its ultimate load-carrying capacity, along with a notable 7.23% enhancement in ductility and an improved energy dissipation capacity when compared with the cast-in-place joint. As a result, it can be concluded that the seismic performance of the new joint surpasses that of cast-in-place joints. Additionally, this study examined the impact of modifying relevant parameters on the seismic performance of the new prefabricated semi-rigid concrete beam–column joint.

1. Introduction

With the increasing popularity of prefabricated buildings, research and practical experience have demonstrated that conventional rigid and articulated models are no longer suitable for prefabricated structures due to their unique construction methods [1,2,3,4]. Song et al. [3] conducted a pseudo-static loading test with a constant axial force on two prefabricated steel-reinforced concrete frame joint assemblies and one reinforced concrete frame joint assembly, and the results revealed that the type of prefabricated joint connection significantly affects the structural performance. Zhang et al. [5] proposed a new type of beam-to-column joint used in prefabricated concrete frames and cyclic loading tests of three specimens, namely, two beam–column joints of this type and a cast-in-place beam–column joint, were conducted to study the seismic behavior and feasibility of this type of joint. Test results indicated that all beam-column joints exhibited beam hinge failure. Luo et al. [6] presented precast reinforced concrete beam–column joints with grouted sleeves and found that these joints exhibited improved seismic performance via experimental tests and finite element analysis, and they found that the error between the experimental and finite element analysis results was minimal.
With the in-depth study of building structures by various researchers, it has been found that the joint connections between individual members are not idealized rigid joints or articulation joints in steel and concrete buildings, and the joints in actual structures are often semi-rigid joints between rigid and articulation joints [7,8].
Semi-rigid joints are a kind of connection between a rigid joint and an articulated joint. Semi-rigid joints can transmit bending moment and shear force like rigid joints and can also produce a relative corner between beams and columns like articulated joints and have a certain rotation capacity, which can dissipate energy not only by plastic deformation but also by the relative corners between the beams and columns [9,10,11,12]. Braconi et al. [13] studied the seismic performance of PEC column-section beam frames and found that the strength of the specimens gradually degraded, and the ductility performance was advantageous. Ghayeb et al. [14] proposed a combined joint form in which precast concrete members were bolted to the joints using steel plates and a steel tube, and the test results showed that the ductility of the joints improved, but the bearing capacity became weaker due to the complex structure of the joints. Nzabonimpa et al. [15] presented a novel approach to combine steel and concrete in structural joints utilizing an angle steel connection form. This method involved incorporating a U-shaped anchor reinforcement into the column and connecting the beam–column using rebar, high-strength bolts, and steel sleeves. The experimental studies demonstrated that this joint exhibited a commendable energy dissipation capacity. Choi et al. [16] proposed the utilization of an ECC (engineered cementitious composite) material to fill the area between a beam–column joint. The findings of their research revealed the effectiveness of this approach in load transfer, a significant improvement in the ultimate bearing capacity of the joint, and a commendable energy dissipation capacity. Lacerda et al. [17] used a pinned structure to connect beams and columns with a hidden corbel joint and grouted the joint with improved strength and flexural stiffness, but it was difficult to promote due to the complexity of the process. An experimental study on precast high-strength steel fiber-reinforced concrete post-cast monolithic joints by Bin Zhao et al. [18] showed that the use of high-strength steel fiber-reinforced concrete produces a good energy dissipation capacity and ductility. Li et al. [19] introduced a bolted beam–column joint form at the slab-end and performed both experimental and finite element simulation studies to evaluate its performance. The findings demonstrated that the joint exhibited a favorable energy dissipation capacity and could be efficiently restored by replacing damaged components, such as high-strength bolts and precast beams. Pan et al. [20] conducted a comprehensive study aimed at assessing the seismic performance of hybrid structures comprising prefabricated reinforced concrete columns and steel beams (RCS). The investigation involved experiments and finite element analysis. The results indicated that the utilization of semi-rigid connections in these structures resulted in a decrease in the overall stiffness and an increase in the self-oscillation period compared with that of rigid RCS structures. Zhao et al. [21] investigated the seismic performance of semi-rigid joints in PEC composite column–beam frames. Through a combination of experimental testing and finite element simulations, they discovered that equipping joints with pads allowed them to achieve the seismic design objective of “strong columns and weak beams”. This design approach facilitated the full utilization of the performance capabilities of the semi-rigid joints in composite members, resulting in a good energy dissipation capacity.
In this research, a novel type of prefabricated semi-rigid joint is proposed, taking into account the respective advantages of steel and concrete structures [22]. The joint uses steel sections and bolts to connect the concrete beam–column structures. Three-dimensional analysis models of the new joint and a traditional cast-in-place concrete joint were created using the ABAQUS 2020 finite element simulation software. Low circumferential reciprocal displacement loads were applied to both joints, and the ultimate bearing capacity and ductility of the joints were investigated by analyzing the differences between the hysteresis curves and the displacement reverse-skeleton curves. The damage characteristics and force mechanisms of the joints were evaluated by the analysis of the force nephograms. In addition, finite element software was used to analyze the performance variations of the novel joint under different conditions.

2. Establishment of the Finite Element Model

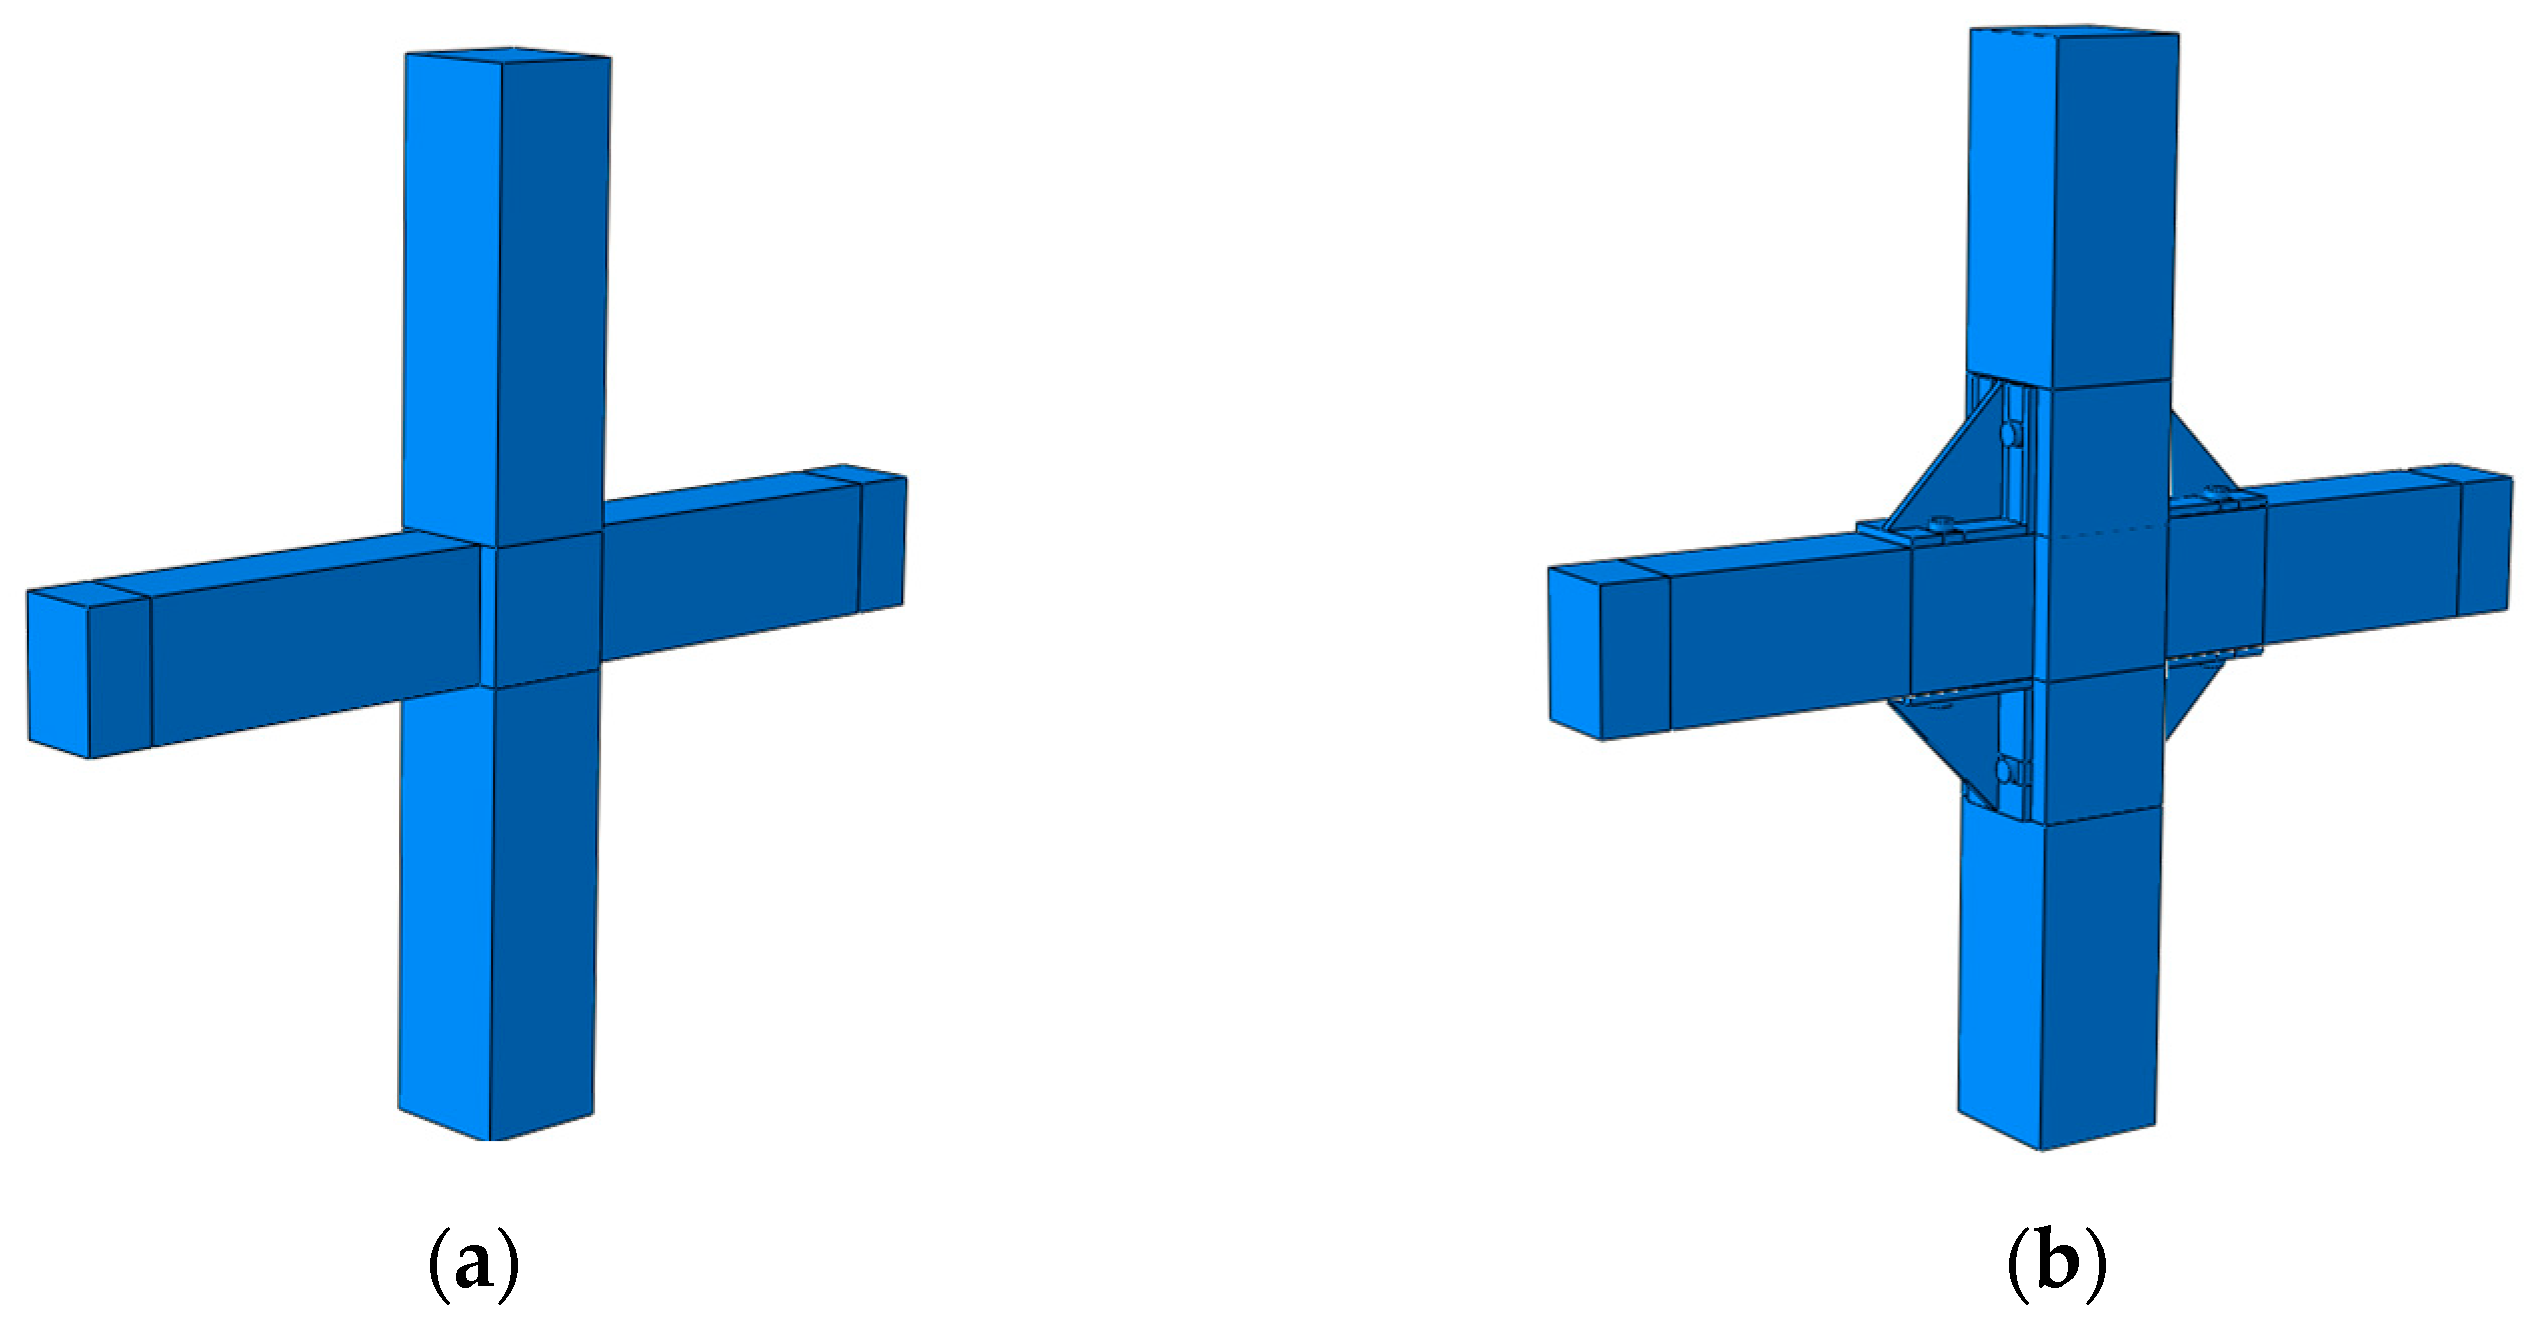
2.1. Geometric Models

In this study, two models were established by the finite element analysis software ABAQUS. One was a cast-in-place joint, and the other was the prefabricated joint. The interactions between different materials in the joint models included “constraint” and “contact”. In both models, the reinforcement bars were embedded into the concrete, so the slip between the reinforcing steel bars and the concrete was not taken into account in the analysis models [23,24]. In the prefabricated joint, the frictional contact between the reinforcing steel bar and the concrete was defined as 0.3, and the frictional contact between the bolt and the steel section was set as 0.35 [25,26].
The finite element models are visually depicted in Figure 1, while the structural parameters of the models are presented in Table 1.

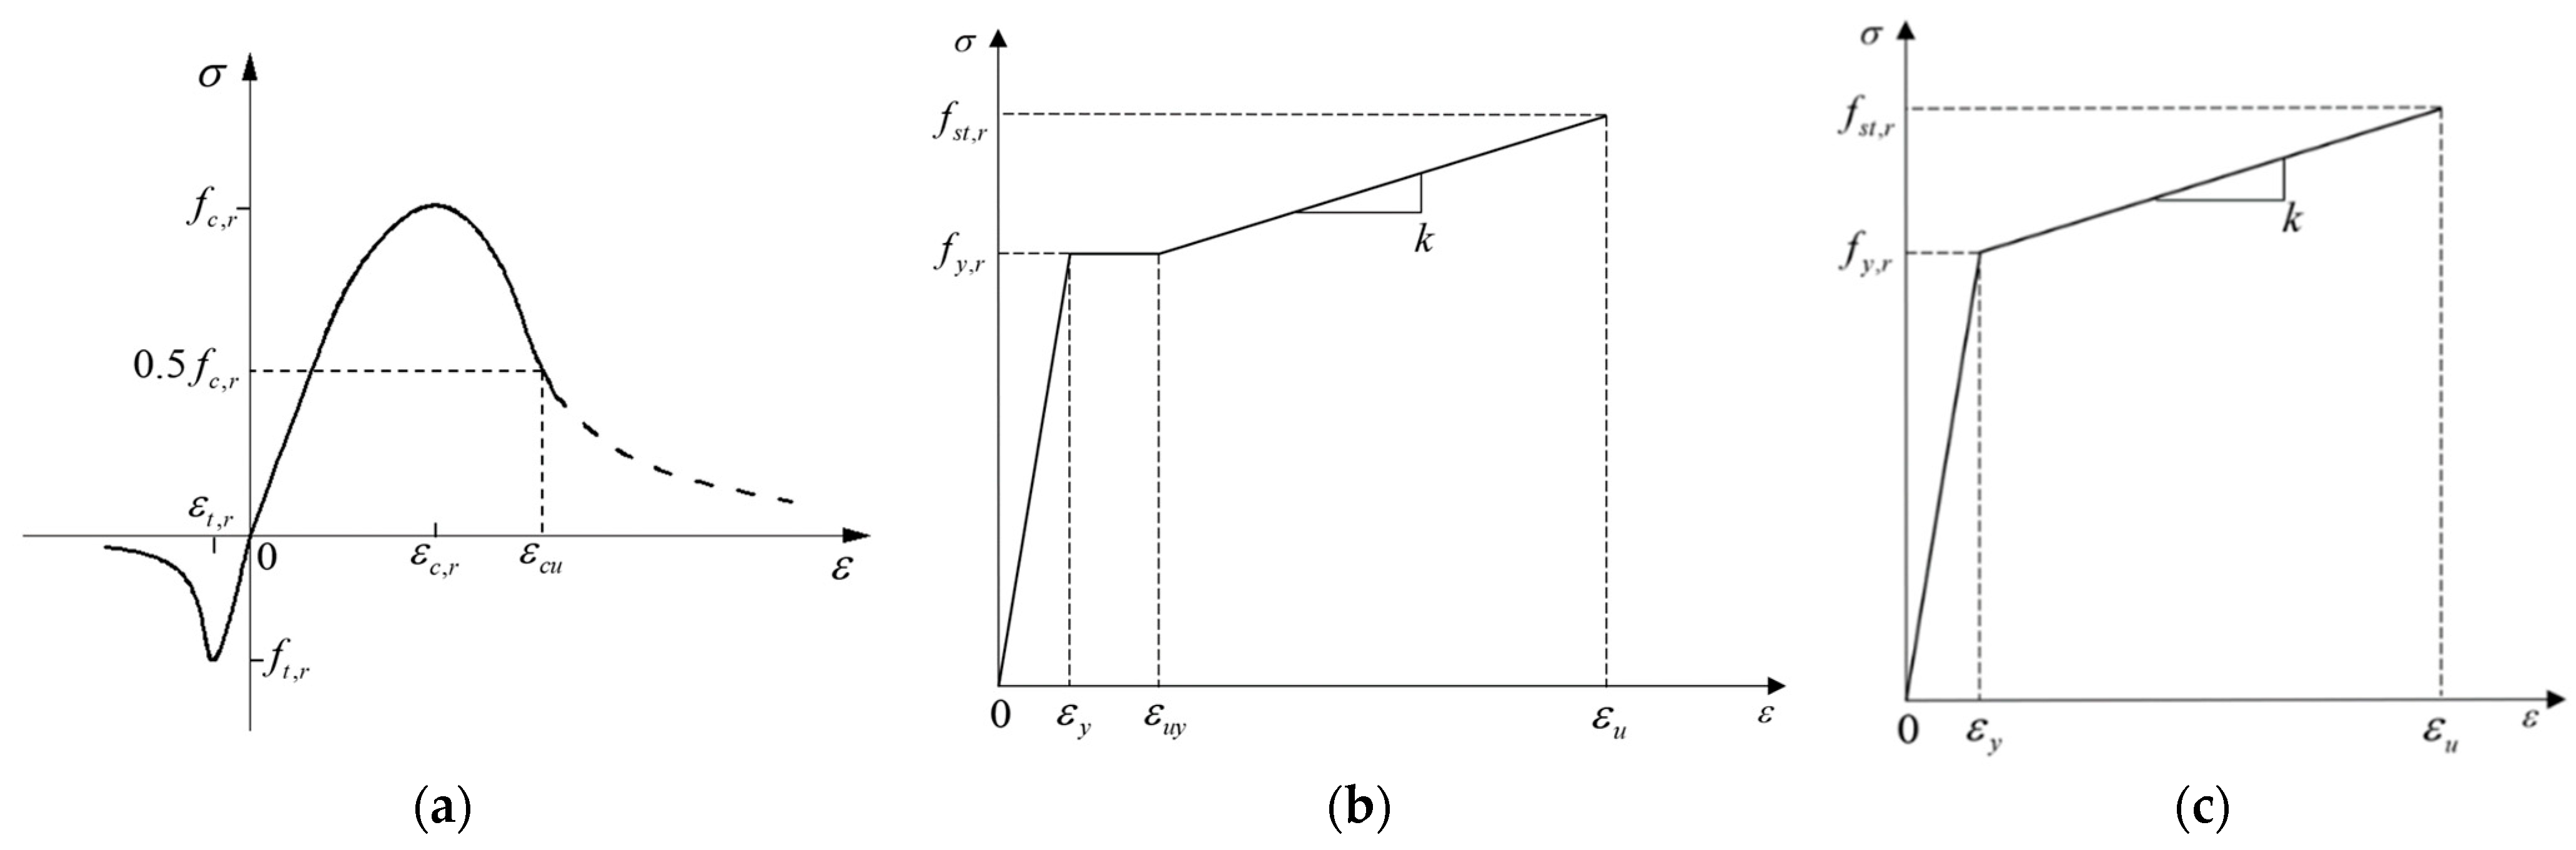
2.2. Material Constitutive Relations

The concrete damage plasticity model was used. The concrete strength grade was C40, and the steel strength grade was HRB400. The constitutive relation models of the concrete and the steel bar are shown in Figure 2a,b, referencing the Code for the Design of Concrete Structures (GB50010-2010) [27]. The constitutive relation model for both steel sections and bolts incorporated a bilinear follow-up strengthening model [28]. This model was divided into two segments, namely, the elastic phase and the strengthening phase. The intrinsic structure model of this model is illustrated in Figure 2c.

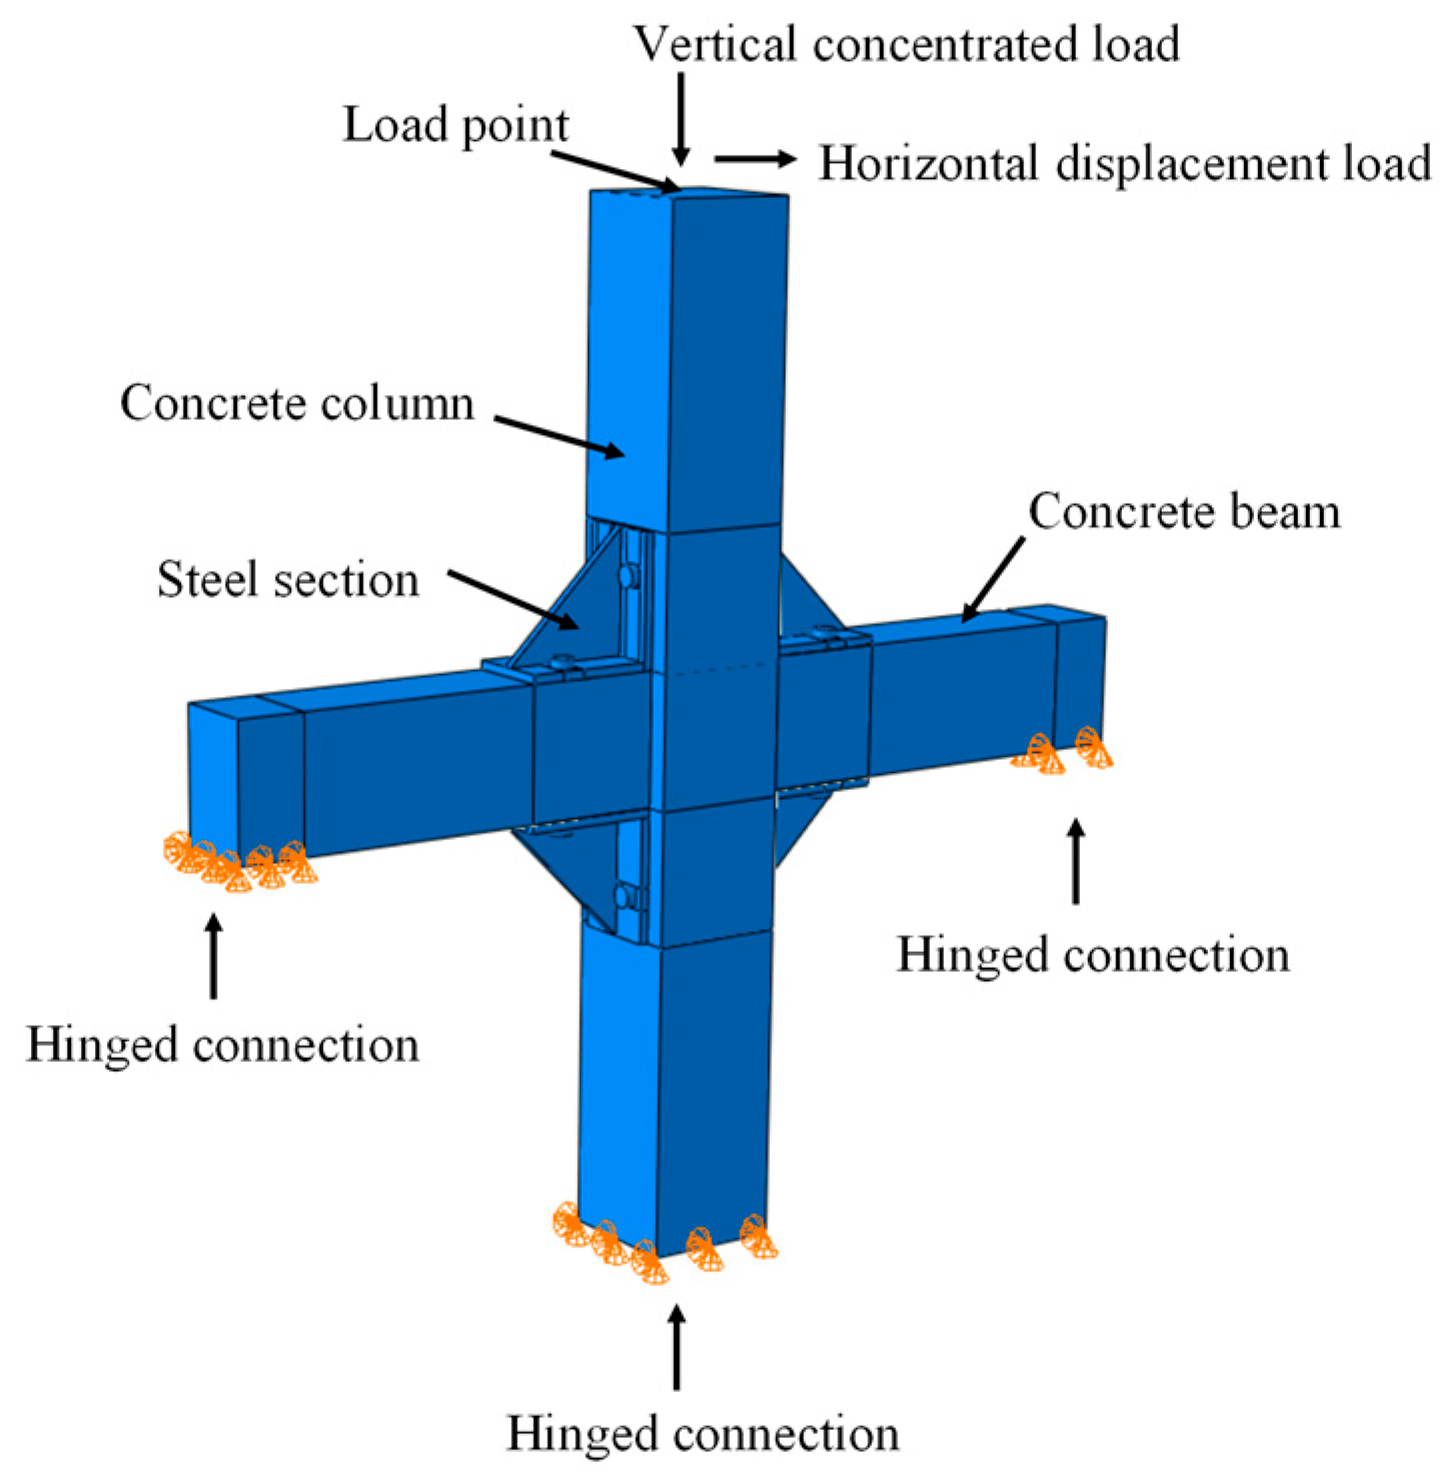
2.3. Boundary Conditions and Loading Method

According to the Specification of Test Methods for Earthquake Resistant Buildings and related studies [29,30,31], both the ends of the beam and the bottom end of the column were set with hinged connections. The upper end of the column was considered a free end, where a vertical concentrated load and a horizontal displacement load were applied, as shown in Figure 3.

3. Analysis of Finite Element Simulation Results

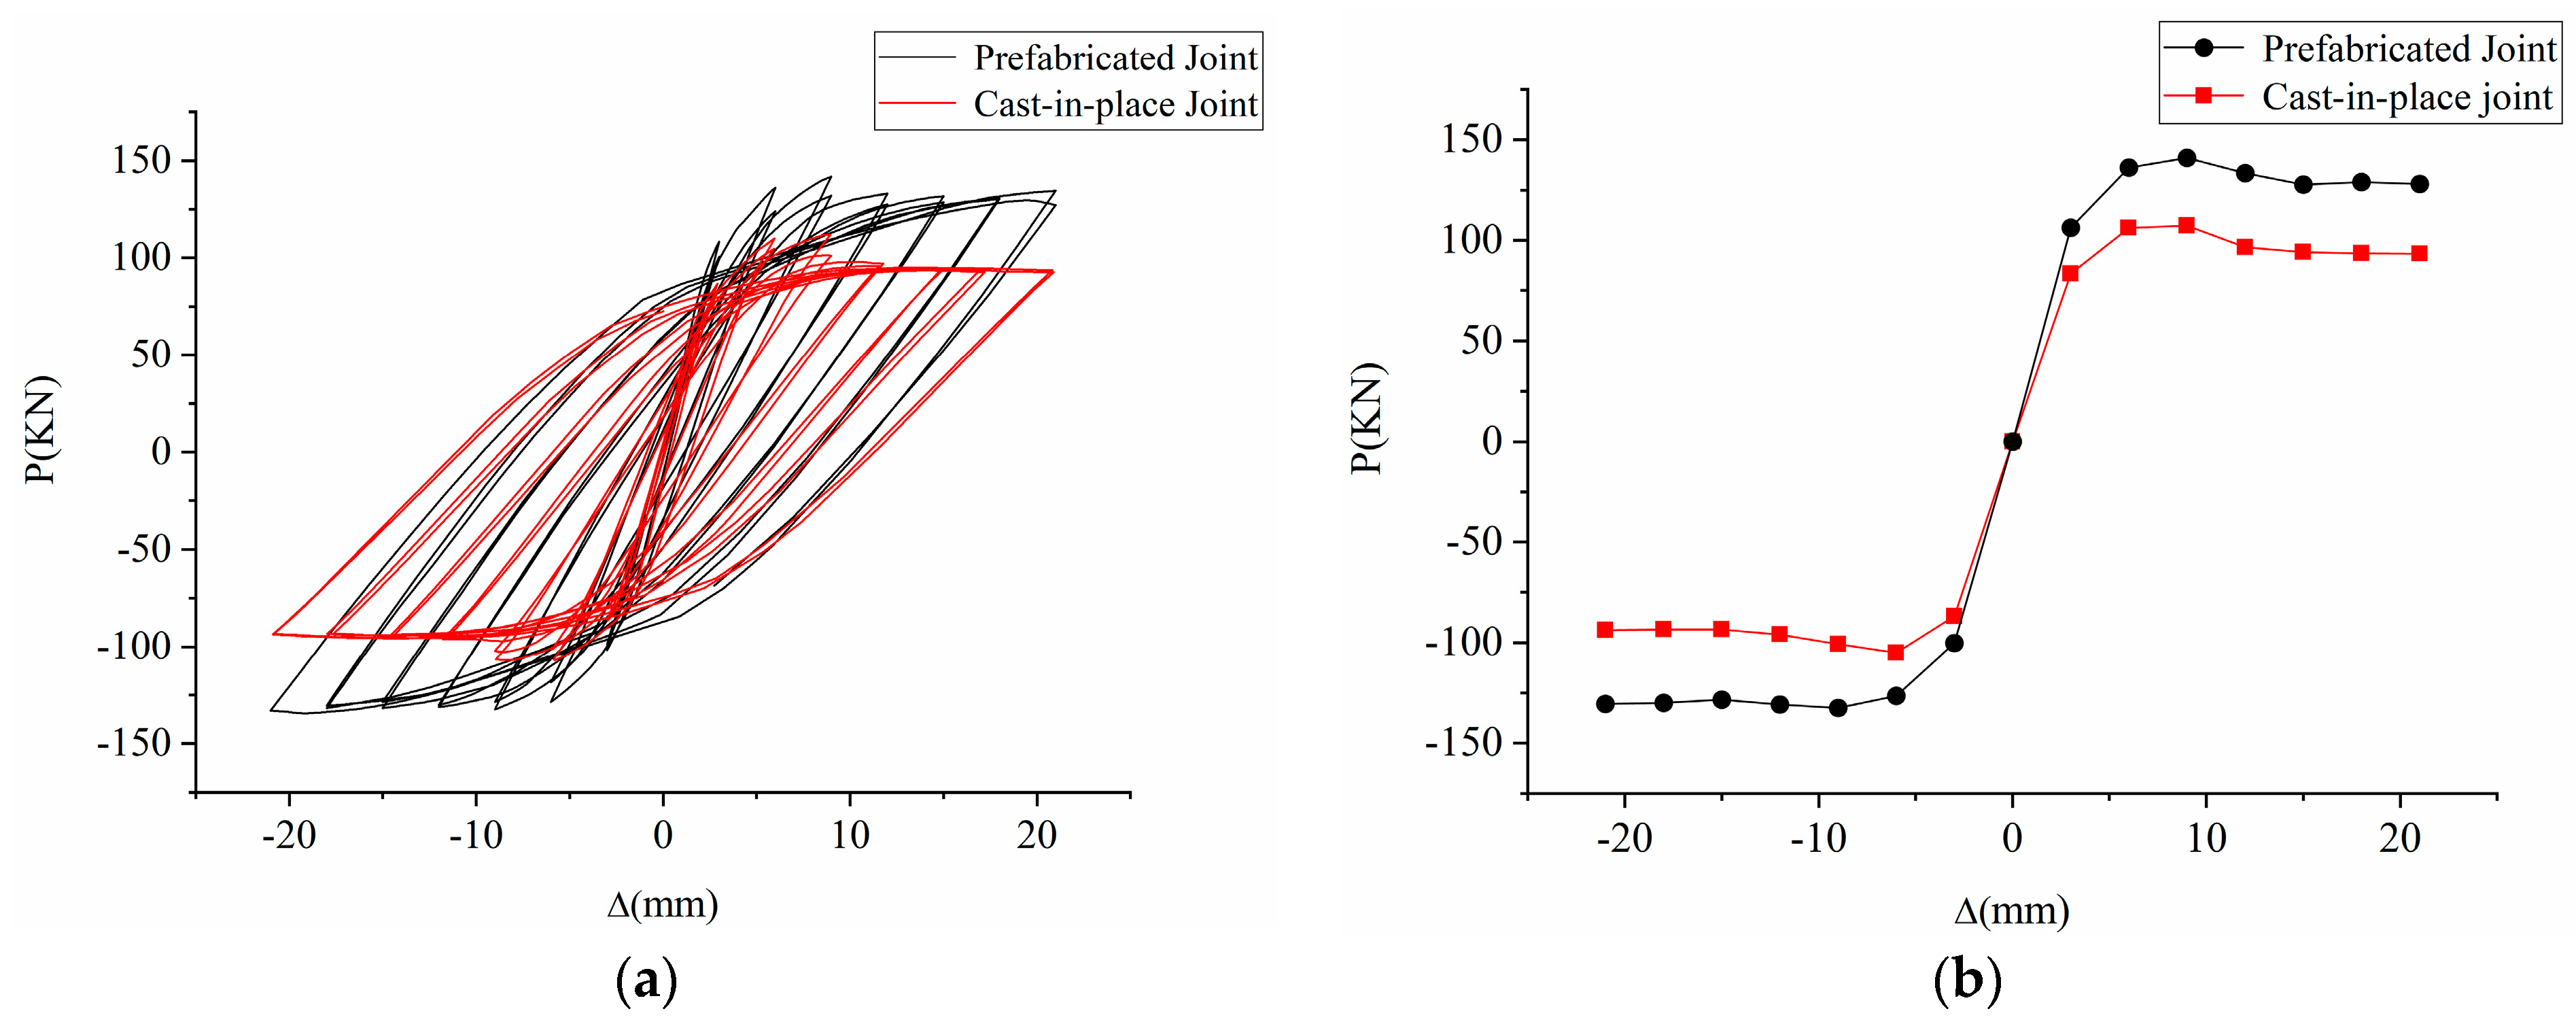
3.1. Hysteresis Curve and Skeleton Curve

The reaction–displacement (P-Δ) hysteresis curves and the skeleton curves of the structure under a low reciprocal circumferential load are shown in Figure 4. The hysteresis curves reveal that during the initial stage of loading, the curves appear mostly straight and overlap. The absence of noticeable changes in the joint stiffnesses further supports the conclusion that both the prefabricated joint and the cast-in-place joint remained in the elastic stage. As the horizontal displacement increases, the hysteresis curves begin to bend, resulting in a gradual decrease in the stiffness of both joints. In both hysteresis loops, the area of the hysteresis loop increases, and the structure begins to exhibit residual deformation through the curve. At this stage, the maximum bearing capacity of the prefabricated joint is noticeably higher than that of the cast-in-place joint.
The displacement–load skeleton curves show that the ultimate bearing capacity of the prefabricated joint was 141.77 kN under a low circumferential reciprocal load, and the ultimate bearing capacity of the prefabricated joint was 107.62 kN. In other words, the prefabricated joint exhibited a 31.7% higher ultimate bearing capacity compared with its cast-in-place counterpart. The reason for this is that the prefabricated joint restricted the deformation of the concrete members due to the addition of steel sections, thus delaying the breaking of the concrete, while the steel sections themselves had higher strengths, so the ultimate bearing capacity of the pre-fabricated joint was increased. It is evident that the cast-in-place joint experienced a more pronounced decrease in its bearing capacity after reaching its ultimate bearing capacity. The subsequent loading cycles showed a 16.6% decrease in the bearing capacity compared with the final bearing capacity cycle. In contrast, the prefabricated joint showed a lesser decrease in its bearing capacity, with a decrease of only 8.9%. This shows the better ductility of the prefabricated joint, as it was able to support a higher percentage of its ultimate bearing capacity even under subsequent load cycles.

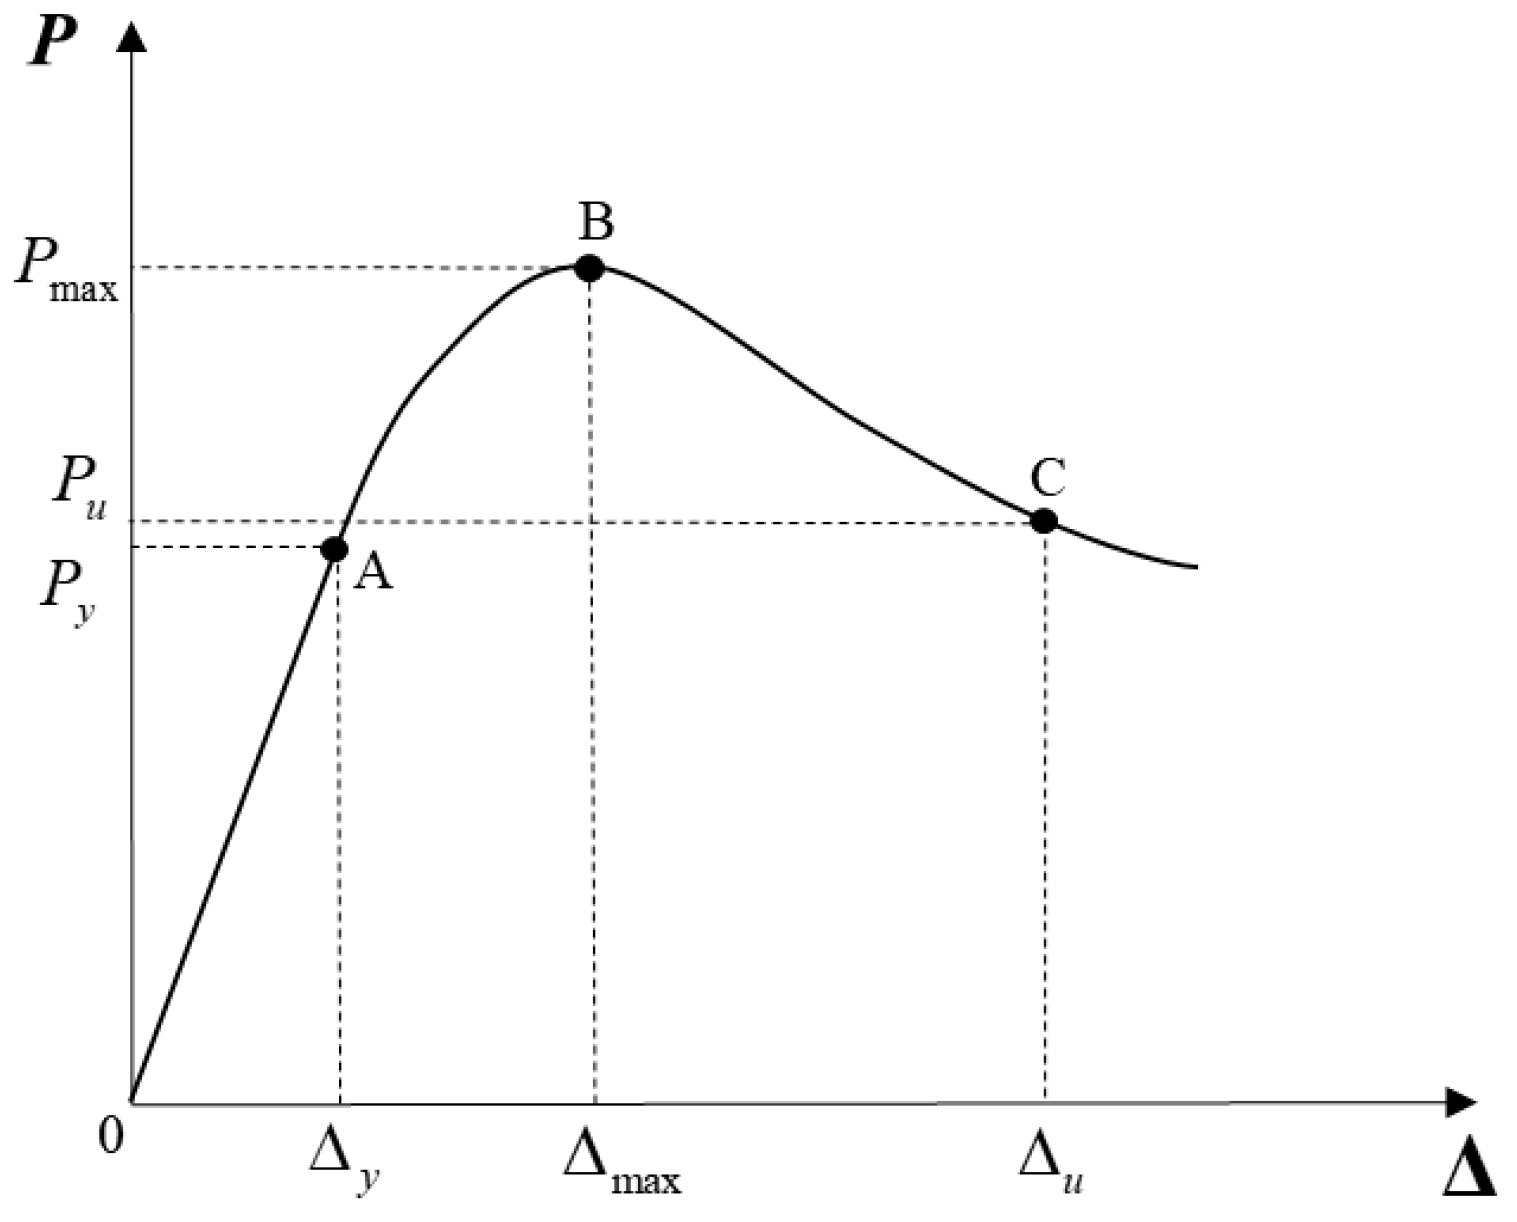
3.2. Ductility Analysis of Joints

Ductility indicates the ability of a material to deform plastically before being subjected to a force that results in fracture. It serves as a crucial indicator of the ability of a structure to withstand deformation. Structural ductility is commonly quantified using the ductility coefficient μ . The ductility coefficient μ is calculated using the following formula: μ = Δ u / Δ y , where Δ u represents the ultimate displacement of the structure or member, and Δ y represents the yield displacement of the structure or member. The parameters associated with the ductility coefficient can be determined from a typical P-Δ skeleton curve. The results of the ductility calculation are typically presented in a calculation diagram, as depicted in Figure 5. The detailed calculation results can be found in Table 2.
Based on the information in Table 2, the ductility coefficient of the prefabricated joint under a low circumferential reciprocal load was 7.26, while the ductility coefficient of the traditional cast-in-place joint was 6.77. This indicates that the ductility of the prefabricated joint was enhanced by approximately 7.23% compared with the cast-in-place joint. The improved ductility of the prefabricated joint can be attributed to the superior ductility of steel compared with concrete. The inclusion of steel structures within the joint helped restrict the deformation of the concrete structure during the loading process. This reinforcement provided by the steel structures contributed to the improved ductility of the joint to a certain extent.

3.3. Comparison of Energy Consumption Capacities of Joints

The energy dissipation capacity of a joint plays a vital role in determining the overall capacity of the structure to withstand seismic loads. It refers to the ability of the joint to absorb and dissipate energy during the damage process, effectively safeguarding its structural integrity. The energy dissipation capacity of joints is commonly assessed using the energy dissipation coefficient E. Equation (1) represents the formula for calculating the energy dissipation coefficient E. Furthermore, Figure 6 provides a schematic representation of the calculation method for evaluating the energy dissipation coefficient.
E = S A B C + C D A S O B E + O D F
In this paper, the hysteresis loop energy dissipation coefficients for the yield state, limit state, and damage state were calculated separately. The calculation results are presented in Table 3.
According to the information provided in Table 3, it is evident that the structural energy dissipation coefficient of the cast-in-place joint in the yield state surpassed that of the prefabricated joint. This was mainly due to the fact that the members exhibited a better energy dissipation performance in the cast-in-place joint when in the elastic stress phase before the yield phase. In contrast, the prefabricated joint experienced a weaker energy dissipation during the yield phase because the presence of a profiled steel structure restricted the displacement of the assembled joints in the elastic stress phase. However, under extreme load conditions, the prefabricated joint showed significantly a higher ultimate bearing capacity compared with the cast-in-place joint. Consequently, the energy dissipation capacity of the prefabricated joint outperformed that of the cast-in-place joint. Furthermore, it is noted that the energy dissipation coefficients of the joints were generally similar when the concrete strength was equal. This similarity arose because the concrete was damaged during the nodal damage phase, resulting in a comparable energy dissipation performance in both types of joints.

4. Comparative Analysis of Force Mechanism

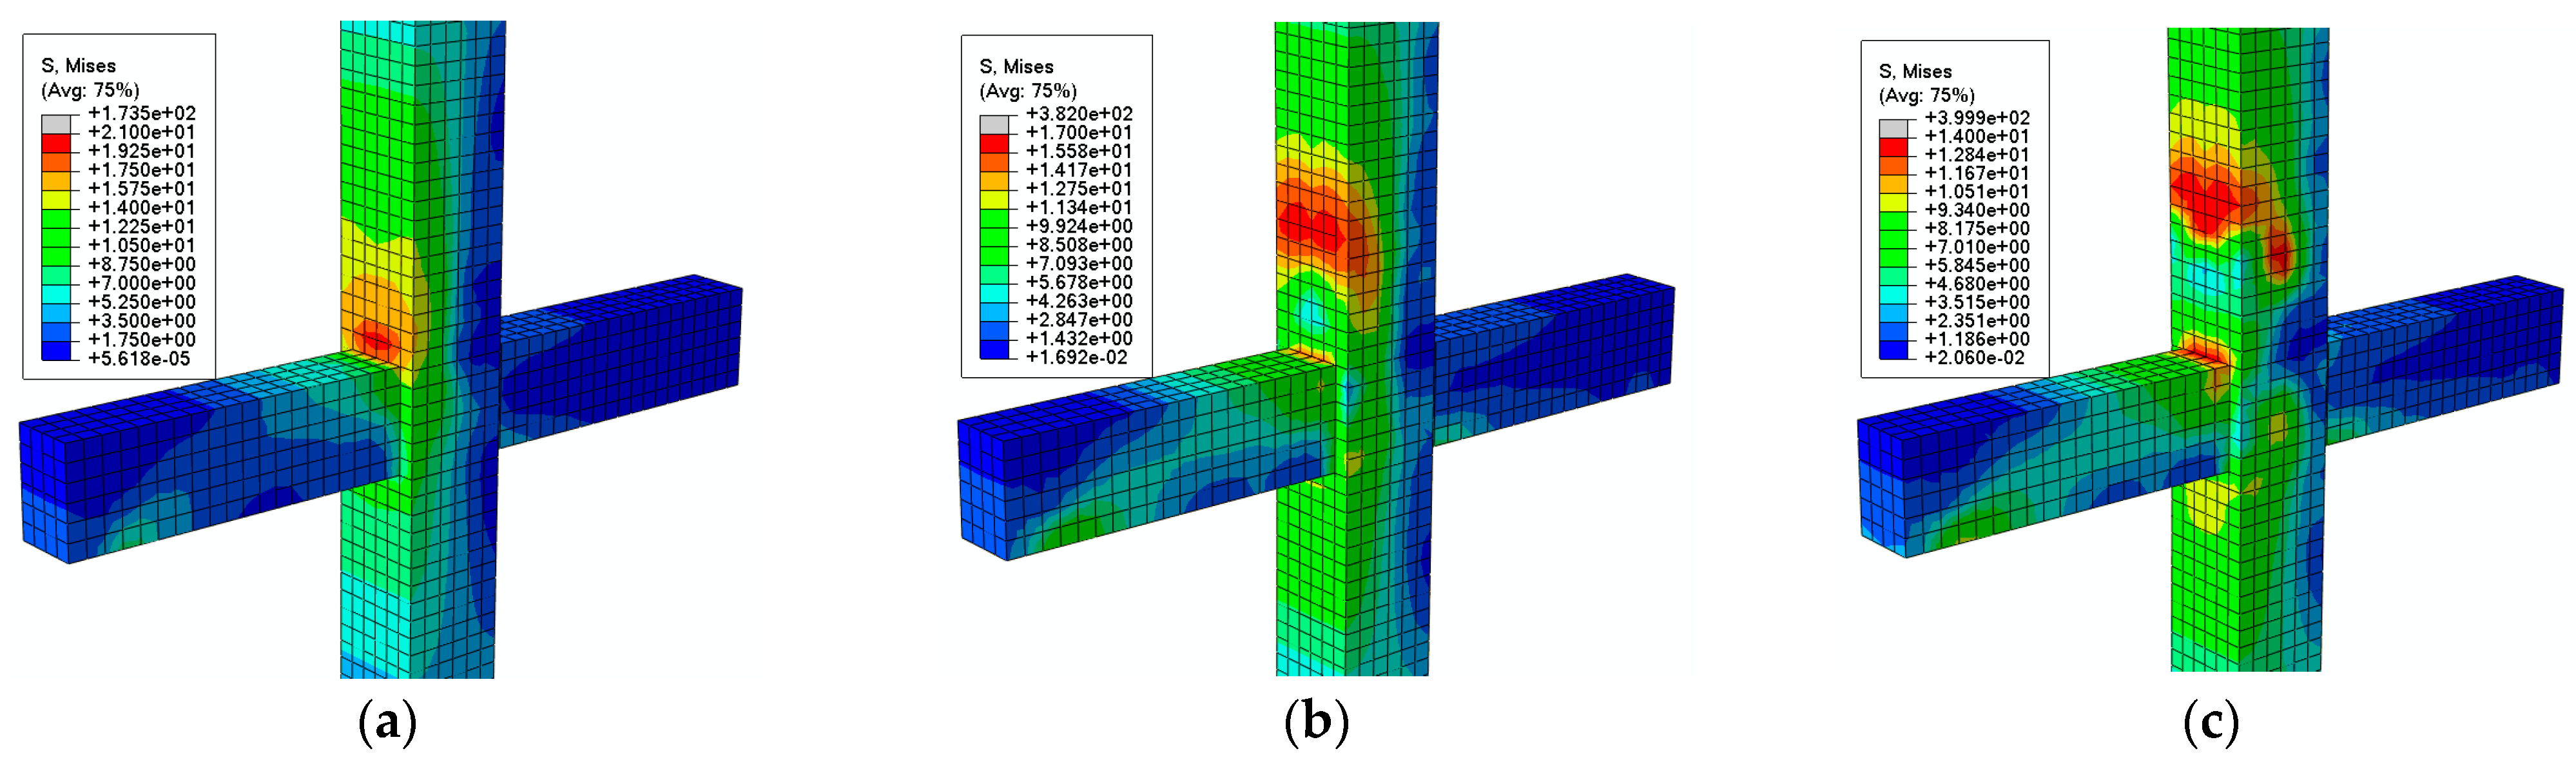
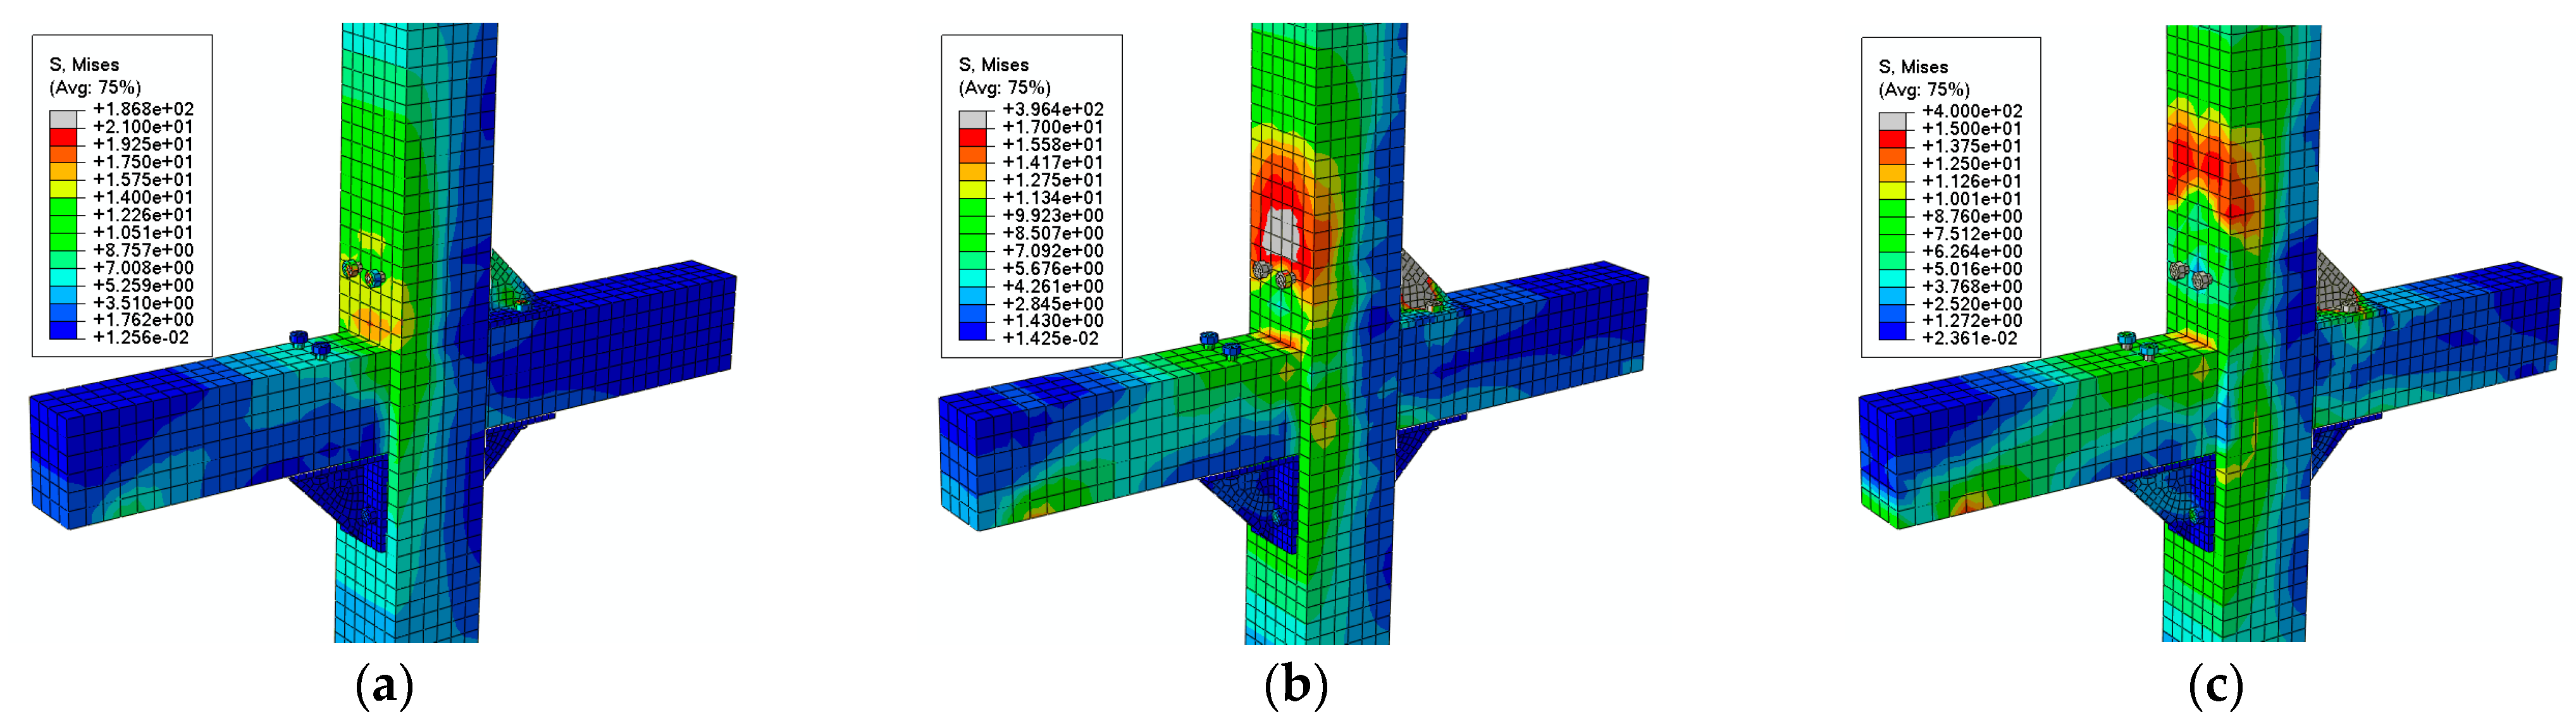
4.1. Concrete Stress Nephograms

The stress nephogram of a structure can intuitively react to the stress of the structure at each stage in each part under a load, and the stress mechanism of the structure under the load can be analyzed. It is an important step of finite element analysis, and the stress nephograms for each stage of the concrete joints are shown in Figure 7 and Figure 8.
According to the stress nephograms, it can be seen that due to the constraint of the steel connectors, the stress of the concrete in the elastic stage of the assembly node was significantly lower than that of the cast-in-place node. As the load increased and reached the maximum bearing capacity of the joint, internal force redistribution occurred within the joint. This redistribution led to a shift in the maximum stress toward the upper area of the joint, and the restraint of the steel sections caused localized stress concentration. Consequently, the maximum stress in the concrete of the pre-fabricated joint exceeded that of the cast-in-place joint at this stage. A further increase in the load eventually led to the displacement at which joint damage occurred. At this point, the core part of the joint concrete was damaged, and the joint started to fail. This indicated the limit of the load capacity of the joint and reflected the point at which the joint failed.

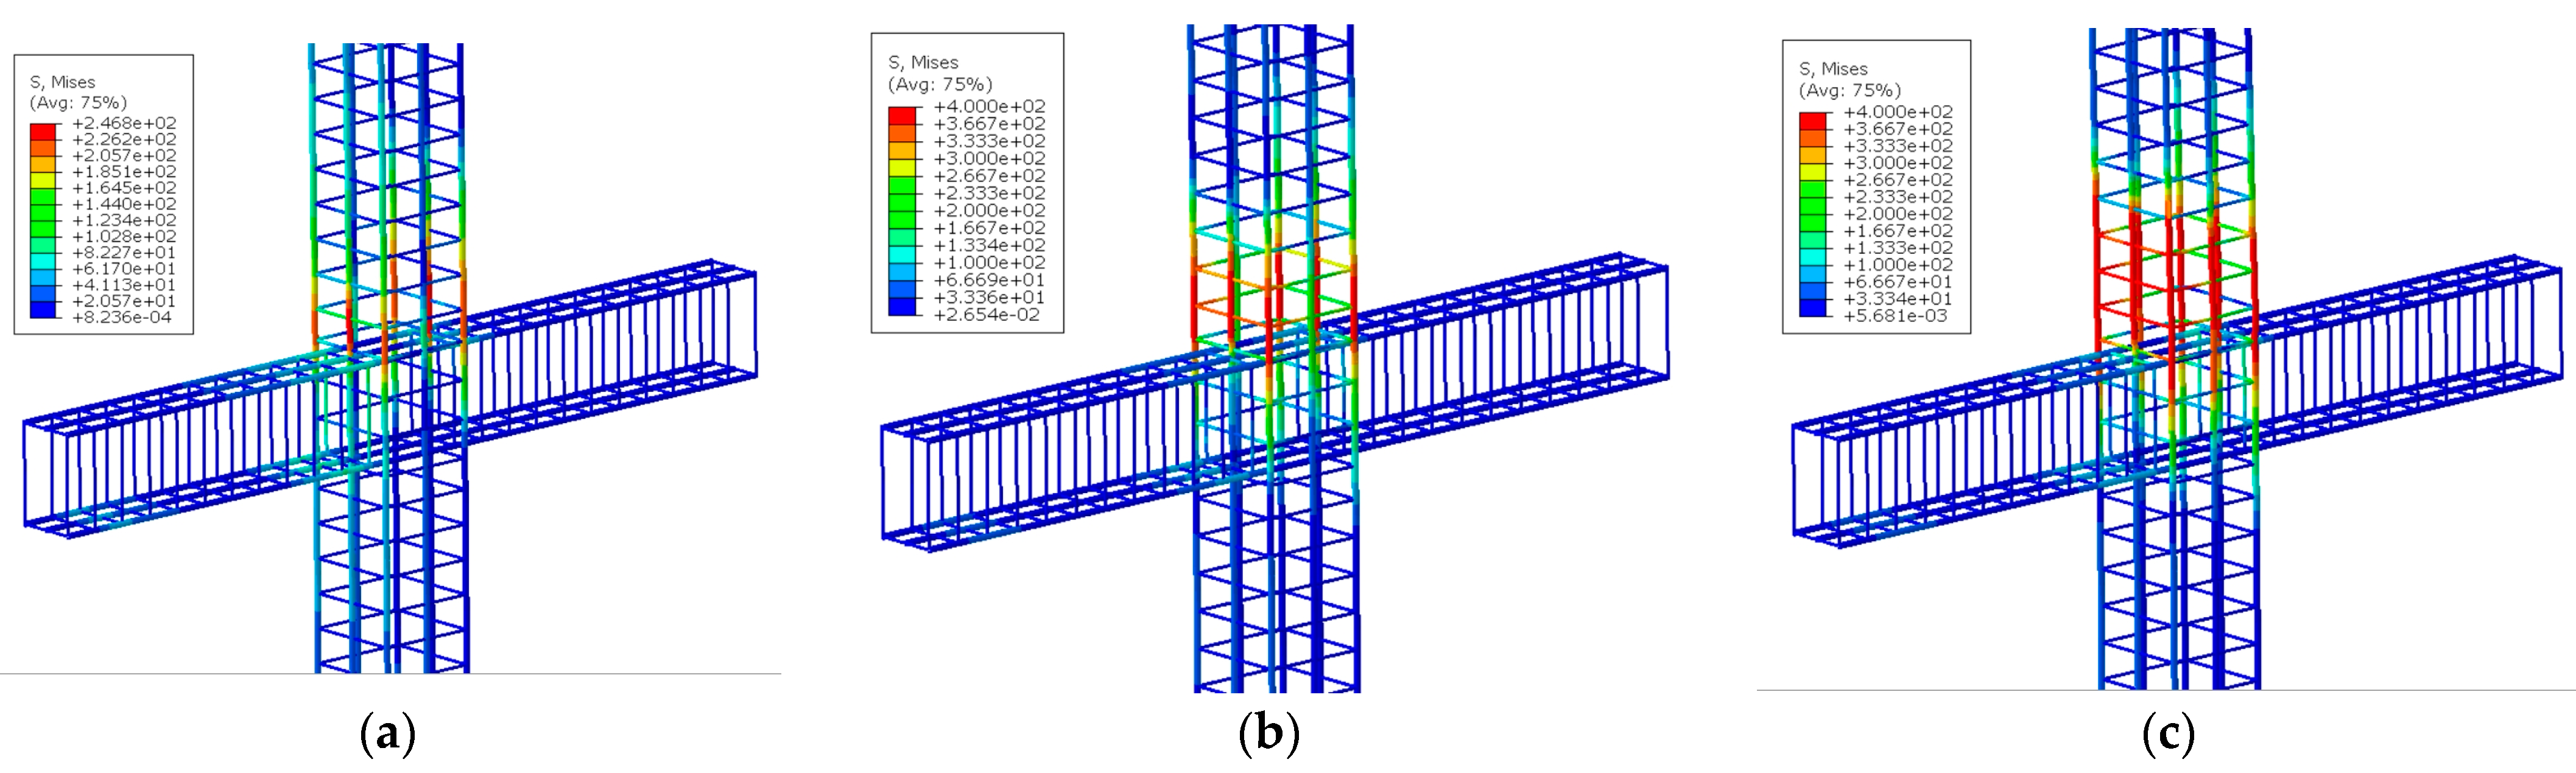
4.2. Reinforcing Steel Stress Nephogram

Using the reinforcement bar as the main stress member of the reinforced concrete structure, the stress cloud of the reinforcement bar given by the software helped us to analyze when the internal reinforcement bar reached yielding and damage. The stress nephograms of the internal reinforcement bars in the joints are shown in Figure 9 and Figure 10.
By analyzing the stress nephograms of the reinforcement steel, it can be seen that in the elastic stage, the stresses of the two joints were also small, and there was no obvious difference due to the small transverse displacement of the joints. As the joint bearing capacity reached the limit, some of the longitudinal reinforcing steel in both joints reached the yield stress in tension, and some of the stirrups in the cast-in-place joint also reached the yield stress, while the stirrups in the prefabricated joint had not yet reached the yield stress. This indicates that the steel section structure of the prefabricated joint effectively limited the transverse deformation of the joint, so the stirrups reached the yield strength later and thus improved the ultimate bearing capacity of the joint. Most of the longitudinal bars of both joints reached the yield strength during the joint damage phase, and the stirrups of the prefabricated joint also started to yield, but the number of stirrups that yielded was smaller than that in the cast-in-place joint. The stress distribution of the prefabricated joint was more uniform, which played the role of stirrups and improved the joint ductility.

4.3. Joint Damage Nephograms

The damage nephograms for each phase of the cast-in-place joint are shown in Figure 11. The concrete compression damage nephogram of a joint can more intuitively reflect the damage of the joint. From the nephogram analysis, it is evident that the pre-fabricated joint exhibited less concrete compression damage at each time point compared with the cast-in-place joint. Furthermore, the volume of failed concrete was significantly lower in the pre-fabricated joint. These findings indicate that the new prefabricated joint offers improved seismic resistance compared with traditional cast-in-place joints. Furthermore, under similar conditions, the new prefabricated joint effectively reduces structural damage and improves structural ductility and service life.

5. Analysis of Factors Influencing Node Ductility and Energy Consumption

Using previous studies on conventional concrete joints, it was found that the axial pressure ratio, concrete strength, and reinforcement steel strength have crucial effects on the performance of joints [30,31,32,33,34]. Therefore, this study aimed to investigate the effects of various factors such as the axial compression ratio, concrete strength, steel strength, and steel strength on the ultimate bearing capacity, ductility, and energy dissipation performance of the new prefabricated joint. The energy dissipation coefficient of the joint was evaluated according to the hysteresis loop in the limit state.

5.1. Axial Pressure Ratio

In this study, four different axial pressure ratios were considered, namely, 0.2 (432 kN), 0.3 (648 kN), 0.4 (864 kN), and 0.5 (1080 kN). The corresponding analytical calculations are shown in Table 4. It can be seen that as the axial pressure ratio increased, the ultimate bearing capacity of the joint also increased, which was due to the fact that the increase in vertical force inhibited, to a certain extent, the development of horizontal cracks in the yield phase of the joint core under a reciprocal load, thus increasing the ultimate bearing capacity of the joint. The joint ductility decreased with the increase in the axial compression ratio because the joint entered the plastic damage stage with the application of the load. The larger vertical force increased the unfavorable bending moment of the joint under the horizontal load, which led to the earlier damage of the joint and thus reduced the joint’s ductility. The energy dissipation coefficient of the joint increased and then decreased with the increasing axial pressure ratio. The reason for the increase was that the increase in the ultimate bearing capacity of the joint increased the area of the hysteresis loop, which led to an increase in the energy dissipation coefficient, but as the axial pressure ratio continued to increase, the horizontal displacement capacity of the joint was suppressed, so the area of the hysteresis loop started to decrease, which led to a decrease in the energy dissipation coefficient.

5.2. Concrete Strength

To investigate the impact of the concrete strength on the seismic resistance of the new joint, four different levels of concrete strength were considered: C30, C40, C50, and C60. The corresponding calculation results are presented in Table 5. It can be seen that with increasing concrete strength, the ultimate bearing capacity of the joint significantly increased; however, the ductility of the joint also showed a relatively obvious decrease, which was due to the higher concrete strength grade, and the ductility of the concrete material itself decreased and was more prone to brittle damage, which reduced the ductility of the joint structure. Due to the decrease in the ductility of the concrete material, the hysteresis curve of the low-strength members was more full, and the energy dissipation performance was better. However, the simulation also found that the load capacity of the low-strength concrete members significantly decreased in the late loading period compared with that of the high-strength concrete members.

5.3. Reinforcing Steel Strength

For the study on the effect of reinforcement strength, four reinforcement strength grades were established, namely, HPB300, HRB335, HRB400, and HRB500, and the calculation results are shown in Table 6. From the results of the analysis, it becomes apparent that the ultimate bearing capacity of the joints exhibited a positive correlation with the strengthening of the reinforcing steel. The HPB300-grade joint achieved its maximum bearing capacity in the second displacement cycle, while the HRB335 and HRB400 joints exhibited their maximum bearing capacities in the third displacement cycle. In comparison, the ultimate bearing capacity of the HRB500 steel bar joints appeared in the fifth displacement period. The increase in the strength of the steel bar obviously improved the bearing capacity of the structure, and the ductility of the structure obviously increased with the increase in the strength of the steel bar. The energy dissipation coefficient of the structure was greatly different from the displacement point of the ultimate bearing capacity. The HPB300-level joint had a small hysteresis curve area due to the early occurrence of the ultimate bearing capacity, so the energy dissipation coefficient was small. Combined with the remaining data, it can be seen that the energy dissipation coefficient of the structure decreased with increasing steel grade, mainly because the difference in the location of the ultimate load affected the area of the structure’s hysteresis curve. However, because of the obvious improvement in ductility in the joint with increasing steel grade, the overall level of energy dissipation in the joint with a higher steel grade increased.

5.4. Steel Section and Bolt Strengths

The prefabricated joint was mainly connected by steel sections and bolts, so four different strength grades, Q235, Q295, Q345, and Q460, for the steel sections and bolts were selected for the bolted connection. It was found that the strength grade of the connection had a minimal impact on the performance of the joints, almost negligible. Even the strength of the Q235 steel, with the lowest strength, was several times higher than the concrete’s strength, so the deformation of the steel structure under the load was much smaller than that of the concrete. The steel connectors played the role of connecting the beam–column structure and limiting the concrete deformation, but the strength of the connectors did not affect the performance level of the structure under other conditions.

6. Conclusions

(1)
Compared with traditional joints, the ductility and the energy-consuming performance of the new joint were improved to a certain extent, and the ultimate bearing capacity was greatly improved. The seismic performance of the concrete beam–column joint connected using newly assembled steel sections proved to be superior to that of the traditional cast-in-place joint. This joint demonstrated excellent performance in seismic conditions, which meets the practical needs of modern precast concrete beam–column joint seismic performance analysis.
(2)
According to the nephogram analysis of the joints, it can be seen that the prefabricated joint had distinctive characteristics of concrete and reinforcing steel stress changes in the elastic stage, the ultimate bearing capacity stage, and the damage stage, and the damage mode was clear. Compared with the traditional cast-in-place joint, the performance indexes were superior, and the joint design was reasonable.
(3)
This study thoroughly examined and analyzed the influences of a variety of factors on the distinct properties of the new joint. This study observed that an increase in the axial compression ratio and the strength of the concrete had a positive impact on the ultimate load-carrying capacity and the energy dissipation capacity of the joint but led to a decrease in ductility. Therefore, it is crucial to reasonably set the axial compression ratio and concrete strength to ensure the ductility of joints in practical projects. Then, as the strength of the steel reinforcement in the joint increased, the ultimate load-carrying capacity and ductility also improved, while the energy dissipation capacity initially increased and then decreased. Therefore, an excessively high steel reinforcement strength may not necessarily be advantageous in enhancing the seismic capacity of joints. Furthermore, since the strength of steel section connectors is significantly higher than that of concrete, the use of high-strength components for steel section connectors does not produce a substantial improvement in seismic performance.

Author Contributions

Methodology, software, data analysis, and writing, Y.X.; funding acquisition, resources, and writing, M.Y.; software, data analysis, and writing, W.L. All authors have read and agreed to the published version of the manuscript.

Funding

This research was funded by the Key Scientific Research Projects Of Hunan Provincial Education Department (grant number 20A522 and 21A0601) and the National Natural Science Foundation Of China (grant number 32371807).

Institutional Review Board Statement

Not applicable.

Informed Consent Statement

Not applicable.

Data Availability Statement

The raw data supporting the conclusions of this article will be made available by the authors on request.

Conflicts of Interest

The authors declare no conflicts of interest.

References

  1. Huang, Y.; Yi, W.J.; Clay, J.N.; Zhang, R. Seismic performance of precast concrete frames with debonded reinforcement. Mater. Struct. 2018, 51, 1–12. [Google Scholar]
  2. Jiang, L.; Li, Z.; Li, L.; Gao, Y. Constraints on the promotion of prefabricated construction in China. Sustainability 2018, 10, 2516. [Google Scholar] [CrossRef]
  3. Song, Y.P.; Wang, J.; Fan, G.X.; Cheng, W.P. Experimental study of mechanical properties of prefabricated frame structure beam-column joint. J. Dalian Univ. Technol. 2014, 54, 438–444. [Google Scholar]
  4. Fang, C.; Izzuddin, B.A.; Elghazouli, A.Y.; Nethercot, D.A. Modeling of semi-rigid beam-to-column steel joints under extreme loading. Front. Struct. Civ. Eng. 2013, 7, 245–263. [Google Scholar] [CrossRef]
  5. Zhang, X.; Hao, J.; Duan, D.; Xu, S.; Zhang, S.; Yu, H. Experimental study on bolted and anchored beam-to-column joints of prefabricated concrete frames. Adv. Struct. Eng. 2020, 23, 374–387. [Google Scholar] [CrossRef]
  6. Luo, X.; Long, H.; Ou, Y.; Dong, S. Study on finite element model of the prefabricated reinforced concrete beam-column joints with grouted sleeves. Adv. Civ. Eng. 2021, 2021, 1–15. [Google Scholar] [CrossRef]
  7. GB/T 51231-2016; Technical Standard for Assembled Buildings with Oncrete Structure. China Architecture & Building Press: Beijing, China, 2017.
  8. Alvin, M. The effect of joints on the stability behaviour of steel frame beams. J. Constr. Steel Res. 2002, 58, 1375–1390. [Google Scholar]
  9. Shi, Q.; Yan, S.; Kong, L.; Bu, X.; Wang, X.; Sun, H. Seismic behavior of semi-rigid steel joints—Major axis T-stub and minor axis end-plate. J. Constr. Steel Res. 2019, 159, 476–492. [Google Scholar] [CrossRef]
  10. Wang, J.; Wang, J.; Wang, H. Seismic behavior of blind bolted CFST frames with semi-rigid connections. Structures 2017, 9, 91–104. [Google Scholar] [CrossRef]
  11. Guo, L.; Wang, J.; Zhang, M. Modelling and experiment of semi rigid joint between composite beam and square CFDST column. Steel Compos. Struct. 2020, 34, 803–818. [Google Scholar]
  12. Yu, J.B.; Guo, Z.X.; Guo, X. Seismic behavior of a new type prefabricated concrete frame beam-column connections. Adv. Eng. Sci. 2018, 3, 209–215. [Google Scholar]
  13. Braconi, A.; Bursi, O.S.; Fabbrocino, G.; Salvatore, W.; Tremblay, R. Seismic performance of a 3D full-scale high-ductility steel–concrete composite moment-resisting structure—Part I: Design and testing procedure. Earthq. Eng. Struct. Dyn. 2008, 37, 1609–1634. [Google Scholar] [CrossRef]
  14. Ghayeb, H.H.; Razak, H.A.; Sulong, N.R. Development and testing of hybrid precast concrete beam-to-column connections under cyclic loading. Constr. Build. Mater. 2017, 151, 258–278. [Google Scholar] [CrossRef]
  15. Nzabonimpa, J.D.; Hong, W.K.; Kim, J. Experimental and non-linear numerical investigation of the novel detachable mechanical joints with laminated plates for composite precast beam-column joint. Compos. Struct. 2018, 185, 286–303. [Google Scholar] [CrossRef]
  16. Choi, H.K.; Choi, Y.C.; Choi, C.S. Development and testing of precast concrete beam-to-column connection. Eng. Struct. 2013, 56, 1820–1835. [Google Scholar] [CrossRef]
  17. Lacerda, M.M.S.; da Silva, T.J.; Alva, G.M.S.; de Lima, M.C.V. Influence of the vertical grouting in the interface between corbel and beam in beam-to-column connections of precast concrete structures—An experimental analysis. Eng. Struct. 2018, 172, 201–213. [Google Scholar] [CrossRef]
  18. Zhao, B.; Lu, X.L.; Liu, H.F. Experimental study on seismic behavior of precast concrete beam-column subassemblage with cast-in-situ monolithic joint. J. Build. Struct. 2004, 6, 22–28. [Google Scholar]
  19. Li, Z.Y.; Huang, Y.Z.; Lu, W.; He, Q.H. Seismic behavior of semi-rigid joints of precast concrete beam and column. J. Civ. Environ. Eng. 2023, 45, 55–64. [Google Scholar]
  20. Pan, Z.; Si, Q.; Zhu, Y.; Ying, H.; Wang, X.; Du, D. Seismic performance of prefabricated semi-rigid RCS structures. Structures 2022, 43, 1369–1379. [Google Scholar] [CrossRef]
  21. Zhao, G.T.; Zhao, C.; Li, B.S.; Wang, L.Y. Experimental study and optimization analysis on PEC composite column-type steel beam frame semi-rigid joint seismic performance. Build. Struct. 2022, 52, 92–98. [Google Scholar]
  22. Ding, K.W.; Liu, J.H.; Ma, W.; Liu, Y.L. Experimental study on seismic performances of a new type of fabricated semi-rigid beam-to-column connection. China Civ. Eng. J. 2021, 54, 1–7+56. [Google Scholar]
  23. Yu, S.B.; Huang, S.J.; Gao, P. Finite Element Analysis of Mechanical Behavior of Beam Column Semi-RigioJoints in Precast Concrete Frame. In Proceedings of the 2022 Industrial Building Academic Exchange Conference, Beijing, China, 10 February 2022. [Google Scholar]
  24. Silva, A.R.; Batelo, E.A.; Silveira, R.A.; Neves, F.A.; Gonçalves, P.B. On the nonlinear transient analysis of planar steel frames with semi-rigid connections: From fundamentals to algorithms and numerical studies. Lat. Am. J. Solids Struct. 2018, 15, e28. [Google Scholar] [CrossRef]
  25. Baltay, P.; Gjelsvik, A. Coefficient of friction for steel on concrete at high normal stress. J. Mater. Civ. Eng. 1990, 2, 46–49. [Google Scholar] [CrossRef]
  26. Wang, Y.Z.; Fu, C.G. ABAQUS Structural Engineering Analysis and Examples, 1st ed.; China Architecture & Building Press: Beijing, China, 2010; pp. 102–186. [Google Scholar]
  27. GB 50010-2010; Code for Design of Concrete Structures. China Architecture & Building Press: Beijing, China, 2010.
  28. Li, G.C.; Wang, S.; Tian, L.; Bao, C.Y. FEM analisis on the performance of concrete bucking restrained brace joints. Eng. Mech. 2013, 30, 212–216. [Google Scholar]
  29. JGJ/T 101-2015; Specification for Seismic Test of Buildings. China Architecture & Building Press: Beijing, China, 2015.
  30. Wu, C.X.; Zhou, Y.; Lai, W.S.; Zhang, Y.F.; Deng, X.S. Experiment on seismic performance of castinsitu and prefabricated concrete frame structure joints. J. Archit. Civ. Eng. 2018, 32, 60–66. [Google Scholar]
  31. Liu, K.X.; Yu, Y.S.; Wei, L.; Wang, Y. Comparative analysis of three design methods for a new typebeam-column assembled rigid joint. World Earthq. Eng. 2017, 33, 84–90. [Google Scholar]
  32. Wang, Q.W.; Zhang, Y.K.; Zhang, H.Z. Finite element analysis on mechanical behavior of SRC spacial interior joints. J. Xi’an Univ. Archit. Technol. 2016, 48, 853–861. [Google Scholar]
  33. Wang, J.; Zhang, N. Performance of circular CFST column to steel beam joints with blind bolts. J. Constr. Steel Res. 2017, 130, 36–52. [Google Scholar] [CrossRef]
  34. Wang, J.; Li, B.; Li, J. Experimental and analytical investigation of semi-rigid CFST frames with external SCWPs. J. Constr. Steel Res. 2017, 128, 289–304. [Google Scholar] [CrossRef]
Figure 1. Models of joints: (a) cast-in-place joint; (b) prefabricated joint.
Applsci 14 05070 g001
Figure 2. Constitutive relation models: (a) uni-axial stress–strain curve of concrete; (b) stress–strain curve of steel bar; and (c) constitutive relation model of steel sections and bolts.
Applsci 14 05070 g002
Figure 3. Boundary conditions and loading method.
Applsci 14 05070 g003
Figure 4. Hysteresis and skeleton curves of the joints: (a) hysteresis curves; (b) skeleton curves.
Applsci 14 05070 g004
Figure 5. Ductility calculation diagram.
Applsci 14 05070 g005
Figure 6. Schematic diagram of joint energy dissipation coefficient.
Applsci 14 05070 g006
Figure 7. Concrete stress nephograms of cast-in-place joint: (a) elastic phase; (b) ultimate load phase; and (c) damage phase.
Applsci 14 05070 g007
Figure 8. Concrete stress nephograms of prefabricated joint: (a) elastic phase; (b) ultimate load phase; and (c) damage phase.
Applsci 14 05070 g008
Figure 9. Reinforcing steel stress nephograms of cast-in-place joint: (a) elastic phase; (b) ultimate load phase; and (c) damage phase.
Applsci 14 05070 g009
Figure 10. Reinforcing steel stress nephograms of prefabricated joint: (a) elastic phase; (b) ultimate load phase; and (c) damage phase.
Applsci 14 05070 g010
Figure 11. Damage nephogram for each phase of cast-in-place joint: (a) 2 s damage nephogram; (b) 6 s damage nephogram; and (c) 15.5 s damage nephogram.
Applsci 14 05070 g011
Table 1. Parameters of each joint’s size.
Joint FormColumn (mm)Beam (mm)Steel Section (mm)Bolt Diameter (mm)
Cast-in-place joint300 × 300 × 2300300 × 200 × 2300\\
Prefabricated joint300 × 300 × 2300300 × 200 × 2300300 × 300 × 2030
Table 2. Calculation results of joint ductility.
Joint Form Δ y  (mm) Δ u  (mm) μ P y  (kN) P u  (kN) P max  (kN)
Cast-in-place joint1.5310.366.7776.1383.86107.62
Prefabricated joint2.3617.137.26103.24123.51141.77
Table 3. Calculation results of joint energy dissipation coefficient.
Joint FormYield StateLimit StateDamage State
Cast-in-place joint0.370.581.53
Prefabricated joint0.310.661.54
Table 4. Influence of axial compression ratio on joint.
Axial Pressure
Ratio
Ultimate Bearing
Capacity (kN)
DuctilityEnergy Dissipation
Coefficient
0.2130.0416.670.603
0.3134.5012.070.616
0.4141.048.570.625
0.5144.595.980.609
Table 5. Influence of concrete strength on joint.
Concrete StrengthUltimate Bearing
Capacity (kN)
DuctilityEnergy Dissipation
Coefficient
C30128.9811.700.634
C40141.048.570.625
C50149.957.670.648
C60153.697.480.630
Table 6. Influence of reinforcing steel strength on joint.
Reinforcing Steel StrengthUltimate Bearing
Capacity (kN)
DuctilityEnergy Dissipation
Coefficient
HPB300134.496.210.577
HRB335134.866.580.824
HRB400141.7710.790.645
HRB500146.3113.580.70
Disclaimer/Publisher’s Note: The statements, opinions and data contained in all publications are solely those of the individual author(s) and contributor(s) and not of MDPI and/or the editor(s). MDPI and/or the editor(s) disclaim responsibility for any injury to people or property resulting from any ideas, methods, instructions or products referred to in the content.

