Article

Soil Compaction Induced by Three Timber Extraction Options: A Controlled Experiment on Penetration Resistance on Silty-Loamy Soils

by
Mădălina Florina Presecan
,
Gabriel Osei Forkuo
and
Stelian Alexandru Borz
*
Department of Forest Engineering, Forest Management Planning and Terrestrial Measurements, Faculty of Silviculture and Forest Engineering, Transilvania University of Brasov, Şirul Beethoven 1, 500123 Brasov, Romania
*
Author to whom correspondence should be addressed.
Appl. Sci. 2024, 14(12), 5117; https://doi.org/10.3390/app14125117
Submission received: 26 April 2024 / Revised: 5 June 2024 / Accepted: 7 June 2024 / Published: 12 June 2024
(This article belongs to the Special Issue Ecosystems and Landscape Ecology)

Abstract

:

Featured Application

Penetration resistance is a descriptor of soil compaction. In this study, we have exercised control over the weight of the payload of three timber extraction options, therefore the results may be used to estimate the contribution to soil compaction of each pass, as well as for comparison and for planning of operations, given the trends and the magnitude of penetration resistance between the passes.

Abstract

Local effects of ground-based timber harvesting, such as soil compaction, are often important for forest management and resilience of forests. One way to evaluate the compaction of the forest soils is by the penetration resistance. Most often, however, the control over the weight of the means used to extract the wood is difficult to maintain, influencing therefore the outcomes of the comparison studies. In this study, a controlled experiment was set up to see how the penetration resistance is affected by the number of passes of three wood extraction methods. A first objective of the study was to characterize the undisturbed soils by the mean values of penetration resistance along the profile. The second objective of the study was to compare the changes in penetration resistance induced by the number of passes along the soil profile. The extraction means were selected based on their typical use in flat-land operations, namely horse logging, skidding and forwarding, and the weight of their loads was determined before the experiment; then, each one was tested in a different area by operating in a closed loop on flat land, with 15 passes over the respective testing area. Penetration resistance was sampled up to 80 cm in depth in 10 control points, as well as in 10 sampling points over the wheels’ footprints. Ten samples were taken on the latter after the first, second, third, fourth, fifth, tenth and fifteenth passes, and comparisons were set up based on natural changing points in penetration resistance found in the control areas. The comparisons found significant differences by an increase in penetration resistance for all three extraction means, and there was a difference by an order of magnitude and depth; horse logging affected it the least and forwarding the most in magnitude, while skidding seemed to produce more significant changes in depth. However, the magnitude and depth of these changes may have depended on the characteristics of the soils from the test areas, and it cannot be concluded that the found levels of penetration resistance will affect the trees located nearby the experimental trails. The problem of soil compaction should be further examined by dedicated studies, given the variability in soil characteristics and diversity in means used to extract timber.

1. Introduction

Forest ecosystems provide a wide range of tangible and intangible benefits, one of which is timber. Timber harvesting encompasses a set of strategic, tactical and operational decisions and actions, which should be tailored to find the balance between the resilience of forests and the benefits that timber harvesting brings to society; this often leads to a high diversity in methods and means used to harvest timber [1]. Environmental performance of timber harvesting systems may be assessed based on local and global effects they produce, and environmental performance of operations has been one of the main concerns in the science and practice [2,3]; very often, however, it is evaluated based on local effects that machines produce in the forest in which they operate. Ground-based timber extraction such as that using skidders and forwarders requires a direct contact and interaction between the machines and forest soil. Typically, it causes soil compaction to a degree, measured in terms of severity and extent, that depends, among other factors, on the machine’s constructive parameters, local soil condition and the decisions on planning and operation [4].
Soil compaction, on the other hand, has serious consequences on other soil-related processes such as increasing the soil’s strength and bulk density, decreasing its porosity, infiltration and hydraulic conductivity, impeding the colonization by fauna and increasing the surface water flow, soil loss and sedimentation [5,6,7,8,9], while soil recovery after mechanical compaction is typically very slow [10,11,12]. For the same soil type, machine and local conditions, the severity and extent of soil compaction depend on the machines’ traffic characteristics such as the number of passes over the same trail and the size of the transported payloads [13,14,15]. From this point of view, it is common sense that heavy machines are likely to produce a higher severity in terms of soil compaction in fewer passes as compared to lighter machines or manual extraction means. In turn, information about the machine type and size, size of the extracted payload, number of passes and their joint effect as measured in terms of soil compaction may provide useful information for planning timber harvesting at several decision-making levels, supporting the acceptance of practices or setting planning thresholds that are related to changes that occur in soils.
There are many ways and methods used to estimate the soil compaction severity [16,17,18], of which measuring the penetration resistance has become a widely accepted and used method in forest operations research (e.g., Refs. [19,20,21,22,23]) due to the simplicity of setting and implementing the experimental designs and affordability in terms of money, time and other resources spent to collect, process and analyze the required data. However, the method only provides indicative figures on soil compaction state, since it measures the strength of the soil instead of actual bulk density. Nevertheless, penetration resistance was found to be strongly related to parameters such as bulk density and water content (e.g., Refs. [24,25]), which makes it useful for comparing undisturbed soils against those trafficked by machines; it also provides an important advantage, namely the possibility to readily evaluate the changes that may appear through the soil’s depth in a relatively continuous depth profile, while bulk density sampling is rather discrete. Changes in soil compaction are evaluated based on comparison of data; control points are used to take reference data on the undisturbed soil, which are then compared to the data coming from trafficked soil [26,27,28,29,30]. Unfortunately, one of the main limitations in such experimental designs is related to the heterogeneity of forest soils. Structure and texture, for instance, may vary along the depth for the same sampling point, as well as between the studied sampling points. To accommodate this, and based on informed guesses, experimental comparison studies on soil compaction have been based on pre-determined soil layer depths [31,32,33,34,35], usually taking a step of 10 cm. Data resulting from these in terms of bulk density and/or penetration resistance were pooled to make the samples for comparison. Then, the interaction between the loaded machines and the soils was frequently examined by observational designs, meaning that there was little control over the payload size extracted at different machine passes. Among other limitations related to the sampling timing and other important characteristics of the soil such as variation in moisture as a function of depth, the results on soil compaction changes in such designs would be only indicative, preventing a detailed planning of operations with the aim to control soil compaction.
In Romania, for instance, ground-based extraction systems dominate by their share in timber harvesting. More specifically, skidding, forwarding and animal logging may account for more than 95% of the harvested timber. Of these, skidding by domestic machines is dominant due to a well-established producer that manufactures and sells them at competitive prices [36]. Nevertheless, due to efficiency reasons, forwarding has gradually been introduced in operations and may account for a more important share in the near future as compared with the latest period and statistics [37]. For ground-based machine timber extraction systems, a well-designed network of skid trails and/or skid roads is required [4]. The difference between the skid trails and skid roads is that the first use the natural ground for extraction, while the latter typically require earth moving operations, hence they are called bladed skid roads [4]. As such, trails are a common stand access solution in flat or low-sloped terrains such as those found on plains or some low hills of the country. Skid roads are typically built on sloped hills and in mountainous regions of the country.
The goal of this study was to evaluate the changes in soil compaction measured by the penetration resistance by a payload- and number-of-passes-controlled experiment for three commonly used timber extraction means characterized by their degree of mechanization: animal logging, skidding and forwarding. The first objective of the study was to characterize the dynamics in penetration resistance along the depth of undisturbed soils, with the main aim to identify the natural changing points in penetration resistance and to decide on the depth of layers used for comparison. The second objective of the study was to compare and characterize the changes in soil compaction as induced by the number of passes.

2. Materials and Methods

2.1. Study Sites and Soil Characteristics

Three study sites (Figure 1) were selected in the central part of Romania to capture as much as possible the variability in soil types for hilly areas, which host more than 30% of the Romanian forests [38]. In addition, a requirement of the study was that of running the experiments on soils located on flat ground so as to remove the effects on soil compaction caused by the slope (e.g., Ref. [39]). A third important criterion was that of having readily available harvesting contractors willing to support the study by following a protocol designed to keep the same payload at each pass. Three contractors were willing to support the study by running the experiment on horse logging by carts of short wood, forwarding of logs by a specialized machine and skidding of tree lengths by a specialized machine (Figure 1). A fourth criterion was to time the measurements with those periods of the year in which the operations are commonly carried out, and a fifth and last criterion was that of having some control over the moisture of the soil. The sites were selected based on a prior documentation based on the local forest management plans and the aim was to have in the experiment similar soils in terms of physical characteristics. On this last requirement, however, there was little control when aiming to have fulfilled some of the above-described criteria.
For simplicity, these three sites are called hereafter H for horse logging, F for forwarding and S for skidding. H is located at about N 46°11′1.20″–E 24°43′40.44″, F is located at N 46°08′4.98″–E 24°59′35.04″ and S is located at N 46°12′32.34″–E 25°06′45.66″. The area of study is characterized by the dominance of broadleaved mixed forests. The harvesting equipment was based on what is typical for real-world operations. For instance, horse logging by carts (H) is typically used to deliver firewood from several types of extractions, assuming that part of the harvested wood is fully processed in the stand or at the trail into very short logs, which are then manually loaded into the cart, transported to the forest road or directly to a customer and then unloaded. This option has a low transportation capacity and it is fully manual. Forwarding by a specialized forwarder (F) is in fact a fully mechanized high-capacity option, in which the wood is loaded with the machine’s crane, transported to the landing and unloaded. Skidding by a cable skidder (S) is a partly mechanized, medium- to high-capacity option, in which tree lengths are usually extracted to the landing, where they are unhooked. As such, the expected order of magnitude in soil compaction was from H to F, whereas for the same magnitude in soil compaction more passes with low-capacity options were expected.
Physical soil samples were taken from small pits which were dug at all of the sites to be able to identify and characterize the soils (Figure 1e). The samples were taken from each soil horizon and transported laboratory for tests on pH, moisture content (MC, %), hygroscopicity (Hy, %) and carbonate content (CaCO3, %) and to run a granulometric analysis (Table 1). The preparation and analysis of the soil samples in the laboratory were carried out by the Office of Pedological and Agrochemical Studies Cluj Napoca. The soil samples were taken to the laboratory and conditioned for analysis by drying in well-ventilated rooms or in rooms equipped with heating systems up to a temperature of 40 °C, after which they were sieved to a particle size of less than 2 mm. Soil analyses were performed according to the standardized methods: pH was determined potentiometrically in aqueous suspension (10 g of soil/25 mL of bi-distillated water, with a combined pH electrode glass–calomel) [40,41]. Granulometric analysis was performed using the Kacinski method [42]. The content of carbonates was determined by Scheibler’s method, according to the European Standard SR EN ISO 10693:2014 [43].
As shown in Table 1, at the H site a cambisol soil was identified, whereas the soil types from F and S sites were cambisol and luvisol, respectively. Among the main differences of the soils were the pH values, indicating a higher acidity in F and S, the moisture content which was slightly higher in H and the characteristics of the granulometric distribution. On average, the soils could be characterized by a pH value of 6.14 ± 1.28, a moisture content value of 29.04 ± 6.09%, a hygroscopicity value of 8.03 ± 1.41% and shares of sand, silt and clay of 17.54 ± 14.09%, 13.40 ± 5.26% and 38.12 ± 6.60%, respectively.
Close to the soil profiles, rectangular testing areas were delimited by placing physical ground guiding marks (g) in the form of white plastic spheres supported by sticks inserted into the ground. These testing areas were perfectly straight, located on flat ground and about 20 m in length each. The ground guiding marks were placed in straight lines with the aim to guide the drivers when passing over the testing ground. Figure 1c shows the basic procedures used to place the ground guiding marks, Figure 1d shows a testing area after a couple of skidder passes and more details on the experimental design of the testing areas are given in Section 2.2.

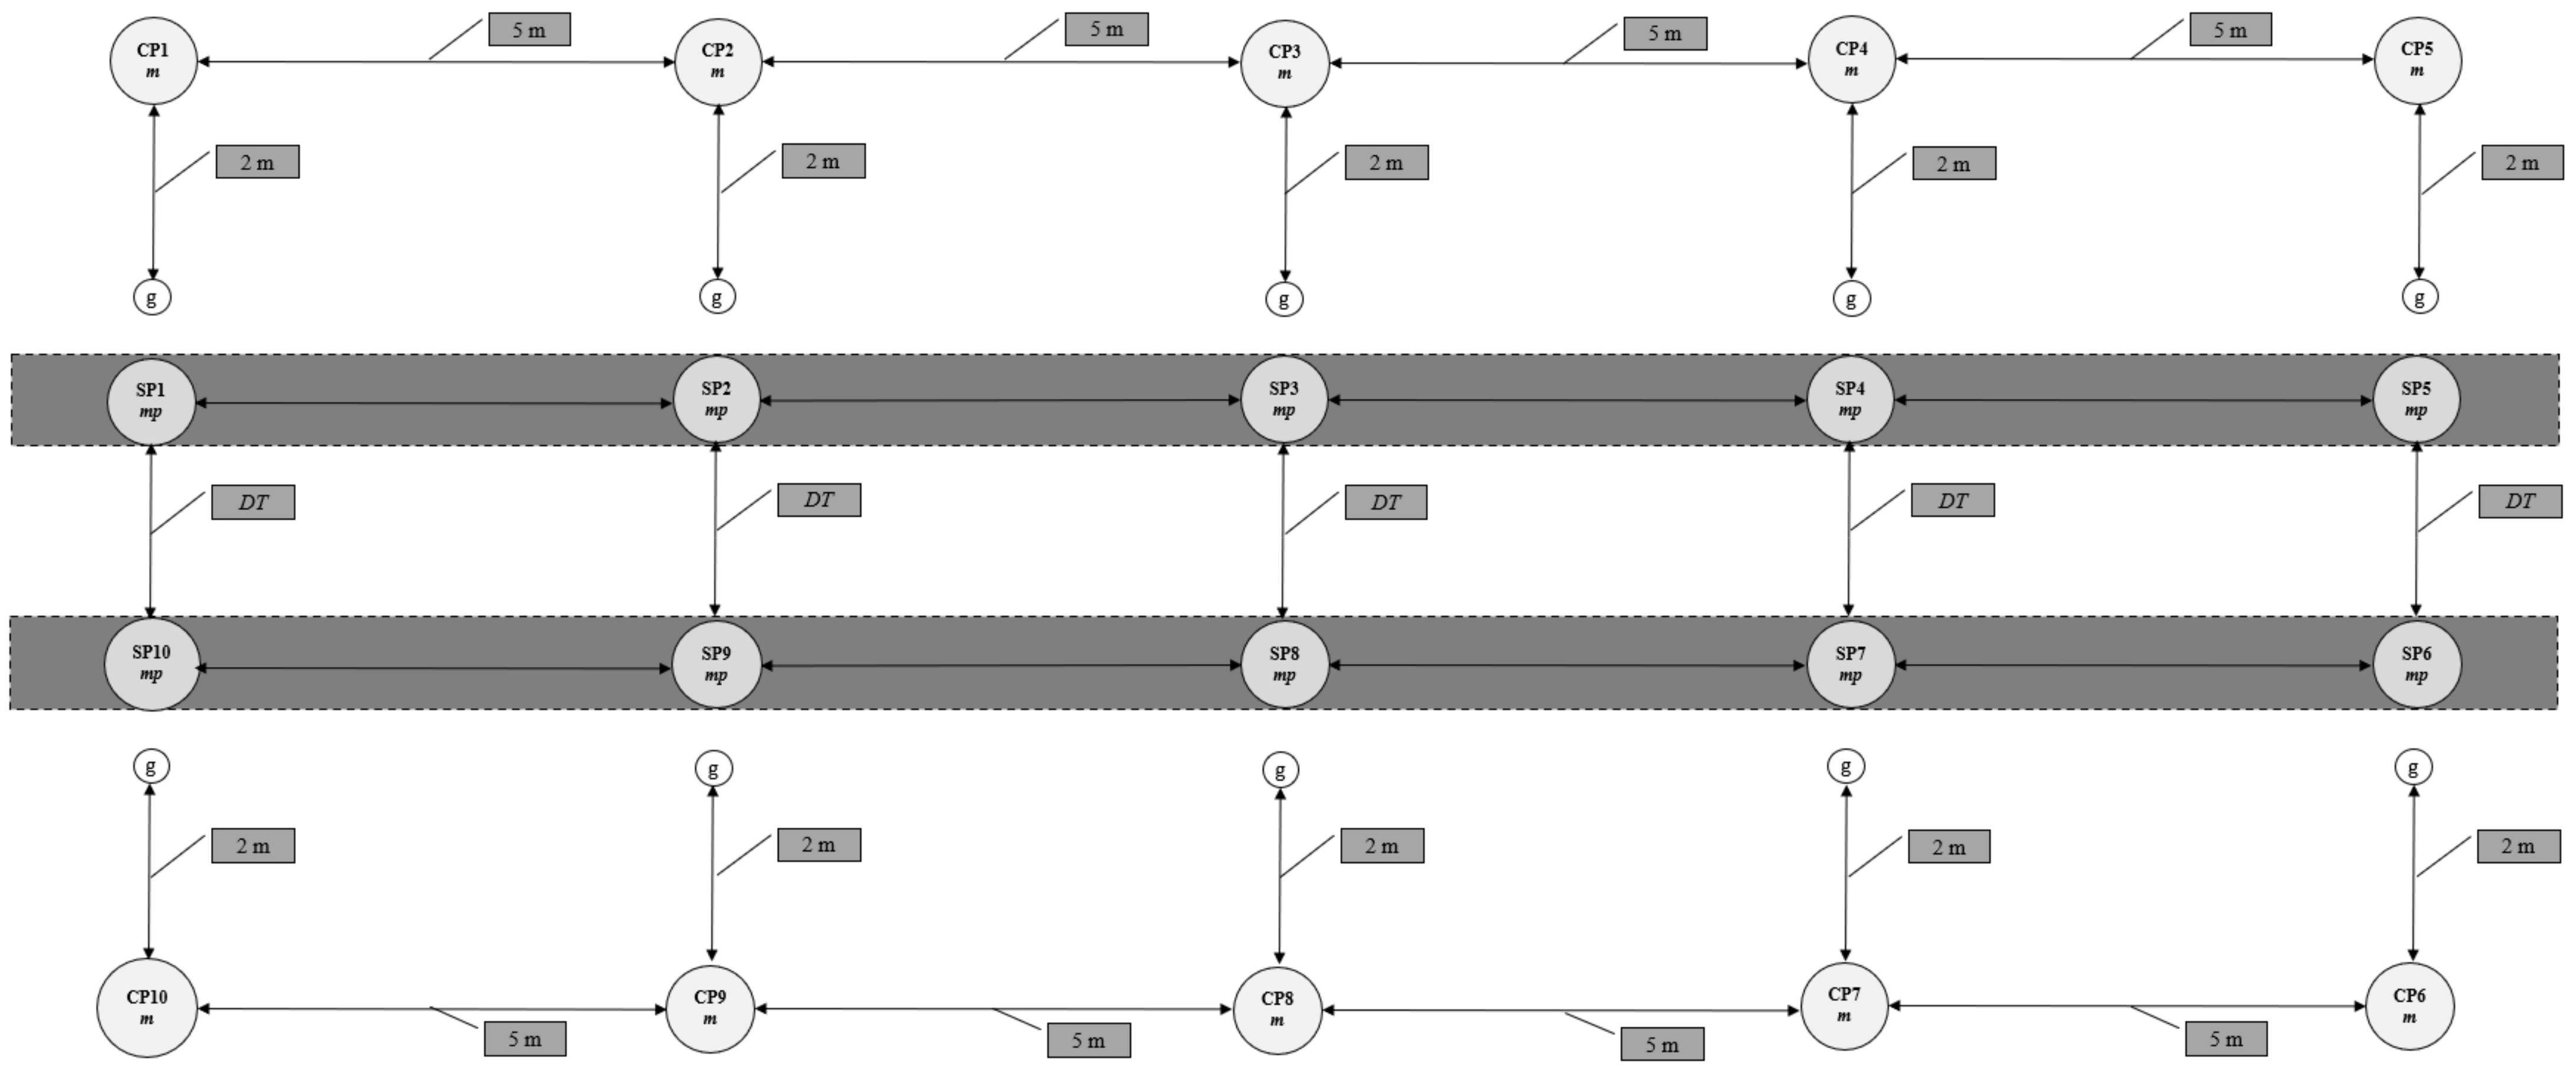
2.2. Experimental Design and Data Collection

Figure 2 shows the layout of the testing areas, with two types of sampling points. In each testing area, control points (hereafter CPs) were conceptually placed outside the guiding marks, and sampling points on the wheels’ footprints (hereafter sampling points on the skid trail, SPs) were set up inside the guiding marks. Control points were conceptually located 2 m away of the ground guiding marks, outside the testing area, in a direction that was perpendicular on the trail (Figure 2). In a straight line, on each side of the testing area, about 5 m was kept between the CPs and SPs. The distance between the wheels’ footprints (DT) was specific to the type of extraction means in each testing area (H, F and S). The location and number of sampling point were kept the same in each testing area, indicating the means used for extraction (m) and the pass after which a sample of penetration resistance was taken (p, p = 1, 2, 3, 4, 5, 10, 15). For each CP and m, where m = H, F or S, a measurement on the soil’s penetration resistance was taken, resulting in three control (reference) datasets taken from the undisturbed soils, each containing 10 observations. Then, for each SP, m and p, a measurement was taken on the wheel footprint in a range of ±1 m so as to avoid measuring in a previously sampled location. By this, for each means of extraction and pass, a dataset of exactly 10 measurements on penetration resistance (PR, MPa) was taken. In each testing area, CPs were used first for sampling by approaching them from outside the boundaries of the testing area, then, after each pass, SPs were used for sampling by approaching them from outside the ground guiding marks with the aim to avoid disturbance of the experimental ground.
Measurements on penetration resistance (RP, MPa) were taken by means of a Royal Eijkelkamp penetrologger equipped with an internal GPS [45]; the instrument features a weight of 3.4 kg and capability to take measurements up to 80 cm in depth. The manufacturer specifies a depth and force resolution of 1 cm and 1 N, respectively. For measurement, a cone with an area of 1 cm2 and a top angle of 60° was used, based on a project planned and uploaded into the instrument by the use of Eijkelkamp Penetroviewer software (version 6.08).
The payloads at H, F and S sites were controlled. The companies were asked about a typical payload in the given operational conditions and they were asked to load the cart and the machines accordingly. These were also checked against the permitted payloads as specified by the manufacturers. Typically, for horse logging the cart is loaded to an extent that permits the extraction without dropping the logs on the trail during the process. In our experiment, it was loaded with beech logs of about one meter in length each, accounting for a volume estimated at about 1.90 m3. The forwarder was loaded with 19 logs with a dominant length of about 5 m, equally shared between hornbeam and sessile oak and accounting for a volume of 13.77 m3. However, the hornbeam logs accounted only for a volume of about 3 m3. Finally, the skidder was loaded mostly with hornbeam tree lengths, accounting for a volume of 2.59 m3. All of these estimates are based on detailed manual measurements that were taken according to the procedure described in [46]. Then, we used the densities of fresh wood from [47] to estimate the weight of the payloads. Accordingly, the payloads of the H, F and S experiments were estimated at 1.8, 13.9 and 2.6 tons. Of course, one needs to account for the weight of the used extraction means. For references about the main technical characteristics of the used extraction means, the reader may check Table A1. Roughly, the mean loads per axle were of 1.2, 8.0 and 3.4 t at H, F and S sites, respectively. For the scope of this study, the assumption was that the size of the payload was an important feature in checking how the number of passes cause changes in the penetration resistance. At all the sites, the extraction means were driven over the testing areas at a constant and rather low speed, as usual in the regular operations. In all cases, driving formed a closed loop, starting with the first pass. Once the first pass was taken, the operation was interrupted to allow the measurements on the penetration resistance. The same procedure was applied for the second, third, fourth and fifth pass. Then, the closed loop was driven five times more. After the tenth pass a new set of measurements was taken, and the protocol was repeated once more to take the measurements after fifteen passes.

2.3. Data Processing and Statistical Analysis

As a first step, the data were summarized in Microsoft Excel sheets by exporting them from the penetrometer to a personal computer using the dedicated software. Then, the data were arranged based on the project planned with the software, and then the measurements taken in the field were labeled with codes to indicate the extraction means and soil disturbance category to which they belonged. As such, the measurement datasets were grouped based on the extraction means used (H, F, S), type of data (control or pass number, hereafter C or P) and the number of the sample point (1 to 10). Table 2 summarizes the features of the initial datasets.
To be able to detect natural changepoints in the control datasets (HC, FC and SC), while accounting for the variability in penetration resistance data at the same depth, subsets of 10 observations each (CP1 to CP10) taken at each centimeter in depth (from i = 0 to 65) were used to estimate the mean (hereafter x), standard deviation (hereafter s) and coefficient of variation (hereafter cv) of each centimeter in soil depth. Variation in values of x, s and cv was then plotted against the soil depth for the three control datasets, along with the absolute differences between For each of the studied extraction means, based on the data subsets standing for the mean values in control (C) and compacted soil, absolute differences were calculated to compare visually the changes induced in the soil penetration resistance following passes P1, P2, P3, P4, P5, P10 and P15. In a similar way, changes induced by passes were visually compared by plotting the absolute differences in penetration resistance between P1–C, P3–P2 and so on, up to P15–P10.
Based on the graphical representation of the control data (x, s and cv) against soil depth (0 to 65 cm), segments of relatively uniform behavior in penetration resistance were identified visually and used to divide the full soil depth into five characteristic layers: from 0 to 10, from 11 to 20, from 21 to 30, from 31 to 50 and from 51 to 65 cm in depth. Then, all the point observations of these layers were grouped based on the type of data and extraction means, forming the subsets for layer-level data comparison.
The statistical workflow used to compare the data included a check for normality in data which was performed by a Shapiro–Wilk test [48] to be able to select the most appropriate type of statistical comparison test. However, most of the layer-level datasets failed the normality assumption (Table A2, Table A3 and Table A4), hence a Mann–Whitney [49] comparison test was used to check if there were significant differences between the control and pass-level datasets. The Mann–Whitney test assumes that (i) there is a dependent variable measured on a continuous or ordinal scale, (ii) there is one independent variable that consists of two categorical groups and (iii) there is independence in observations [50]. In addition, the test requires a check for the distribution of scores to determine if the distributions of compared pairs have the same or a different shape [50]. As such, the test makes no assumptions about normality in data, the results are usually interpreted based on the results of a two-tailed test and they are complemented by a statistic called the effect size which characterizes the magnitude in difference between the compared variables.
The first three assumptions of the test were checked by the design of the study, while for the fourth one the rationale was that the distributions of the compared variables did not have the same shape, therefore the test was used to compare the differences between the distributions [50], although such comparisons were backed up by the magnitude of the medians. In this study, the test was run as a two-tailed test, and it used corrections for continuity and for ties [51]. The results of the tests were plotted in terms of the effect size along with the significance and indications on comparisons that suggest increases in the penetration resistance following a given number of passes. To complement the statistical comparisons, descriptive statistics of the compared variables were reported in the form of boxplots for all the tested options.
Statistical analysis and graphing were carried out in Microsoft Excel which was equipped with a copy of the Real Statistics add-in [52]. Real Statistics was used to run the Shapiro–Wilk and Mann–Whitney tests and to develop the boxplots of the compared variables. Regular functionalities of Microsoft Excel were used to process the data, calculate the differences and to develop the rest of the figures used in this study. Where relevant, the statistical tests assumed a confidence threshold of 95% (α = 0.05).

3. Results

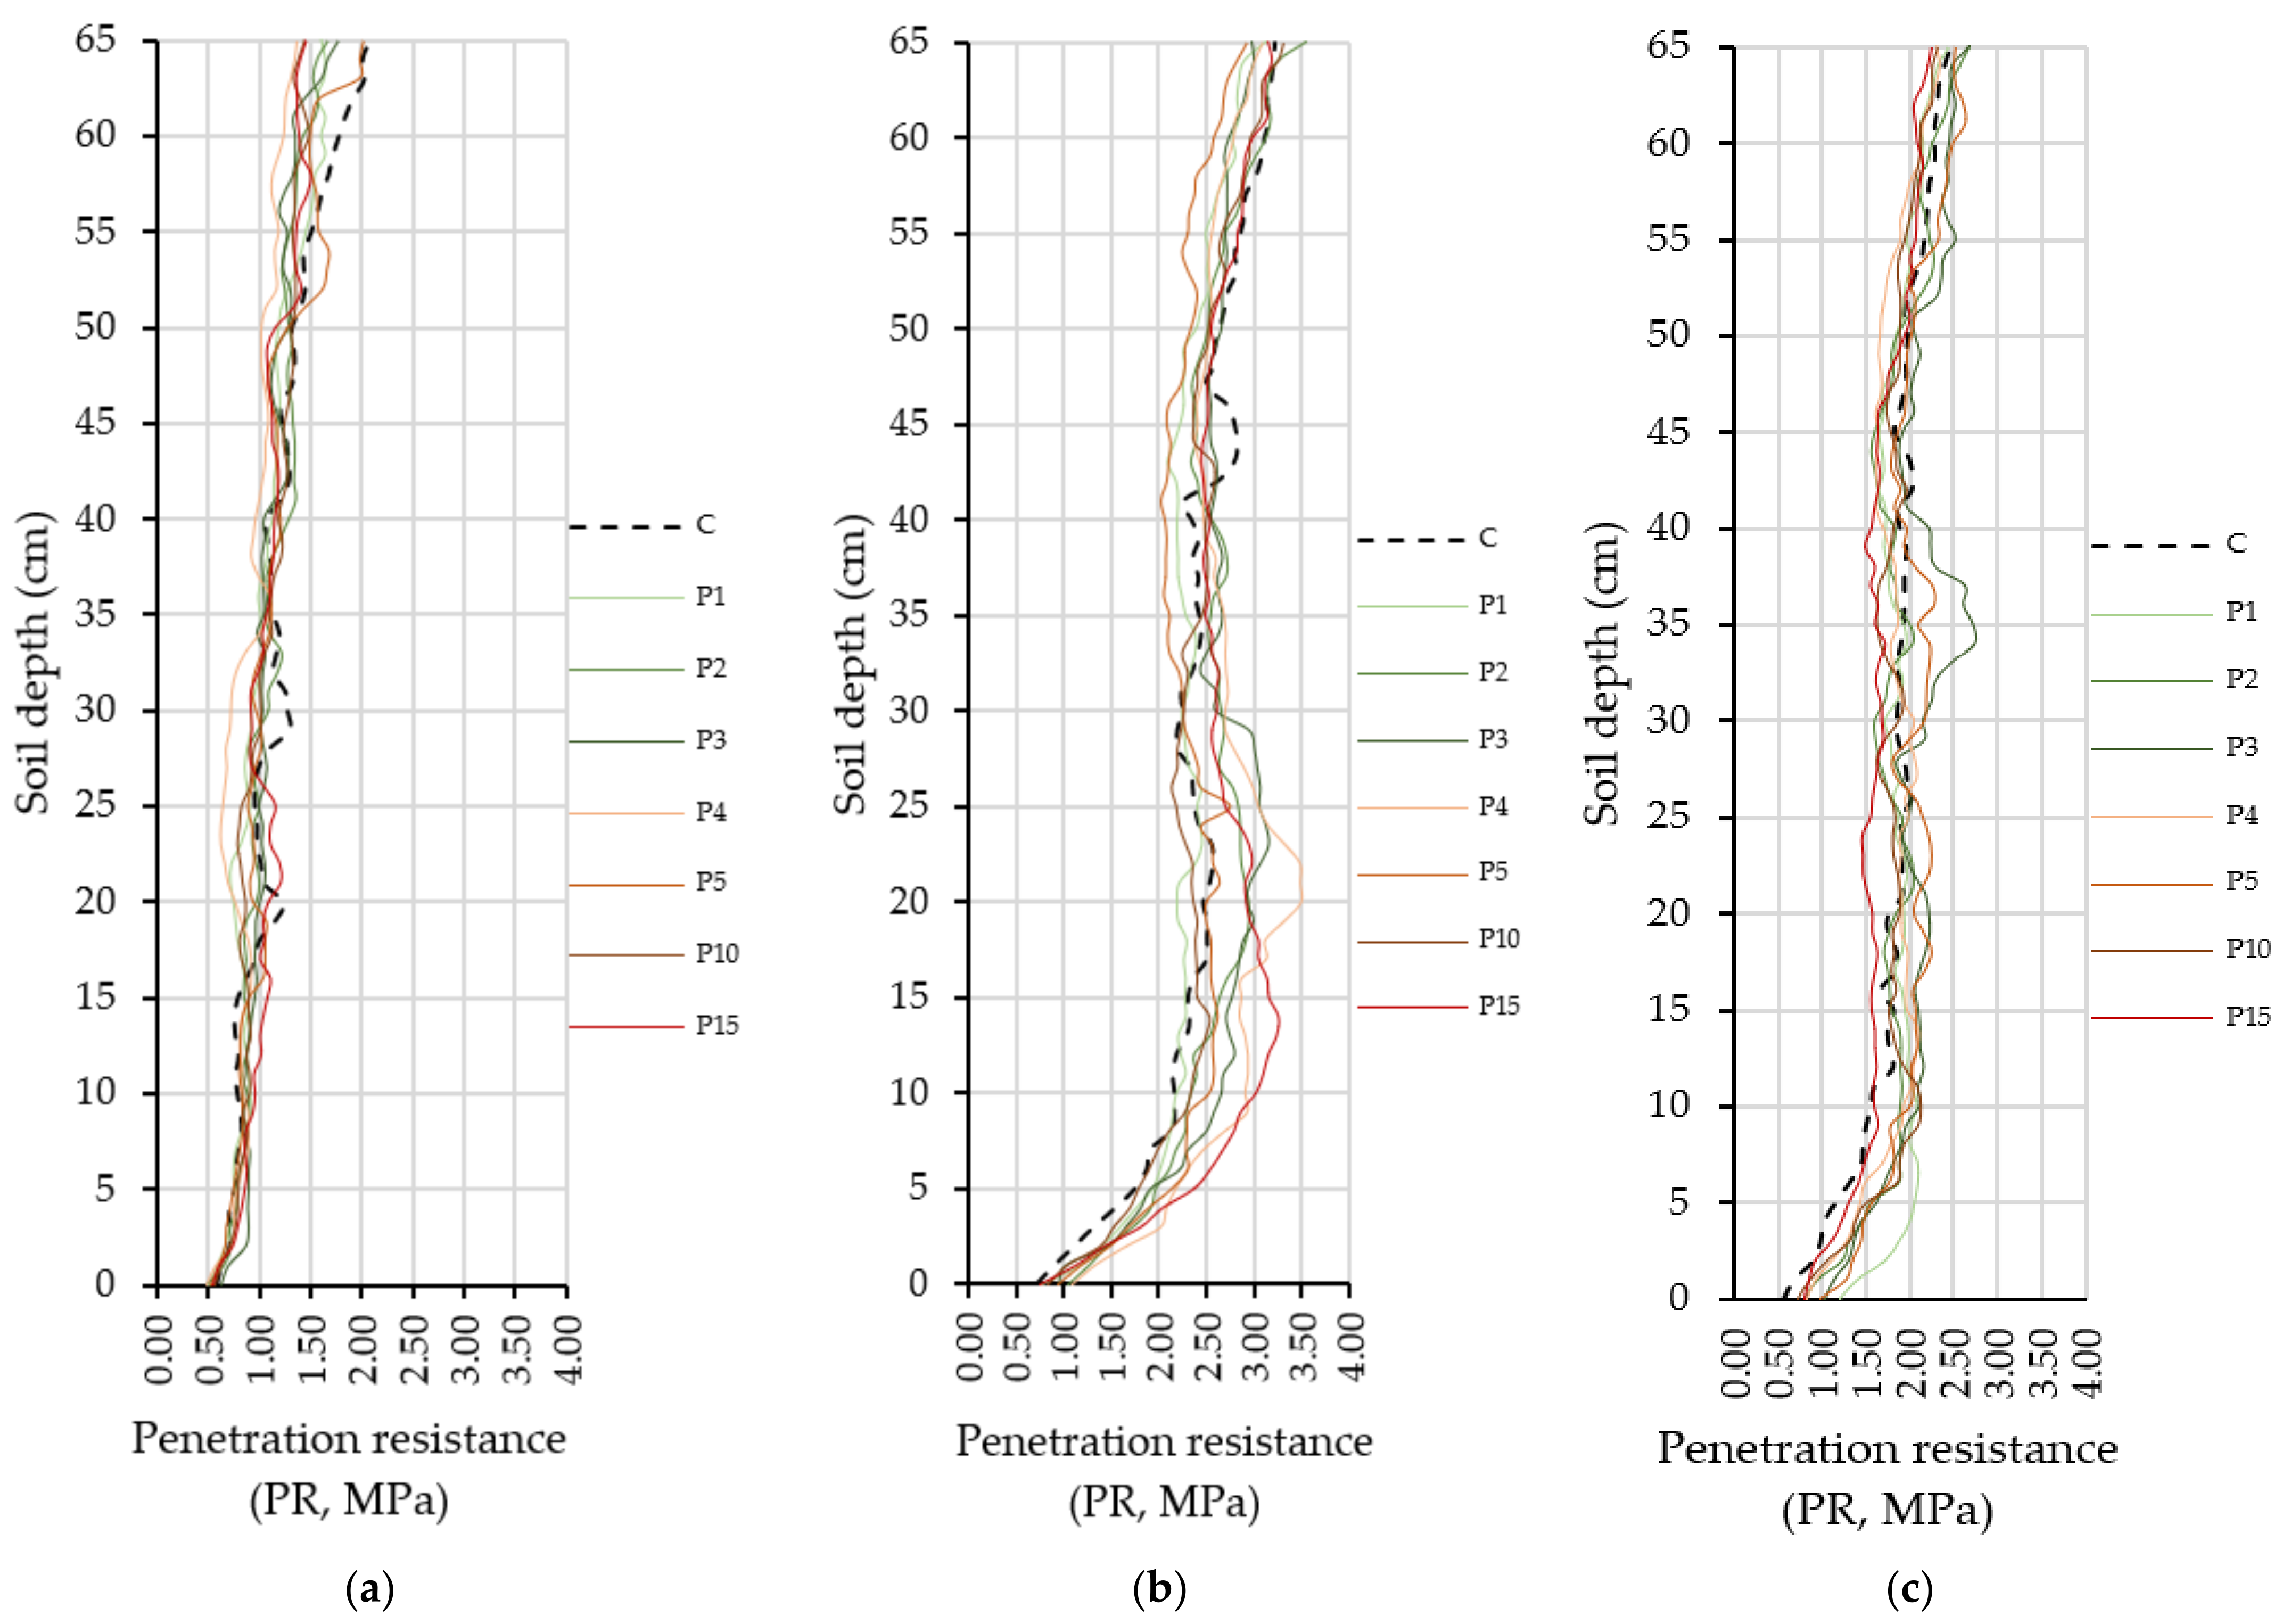
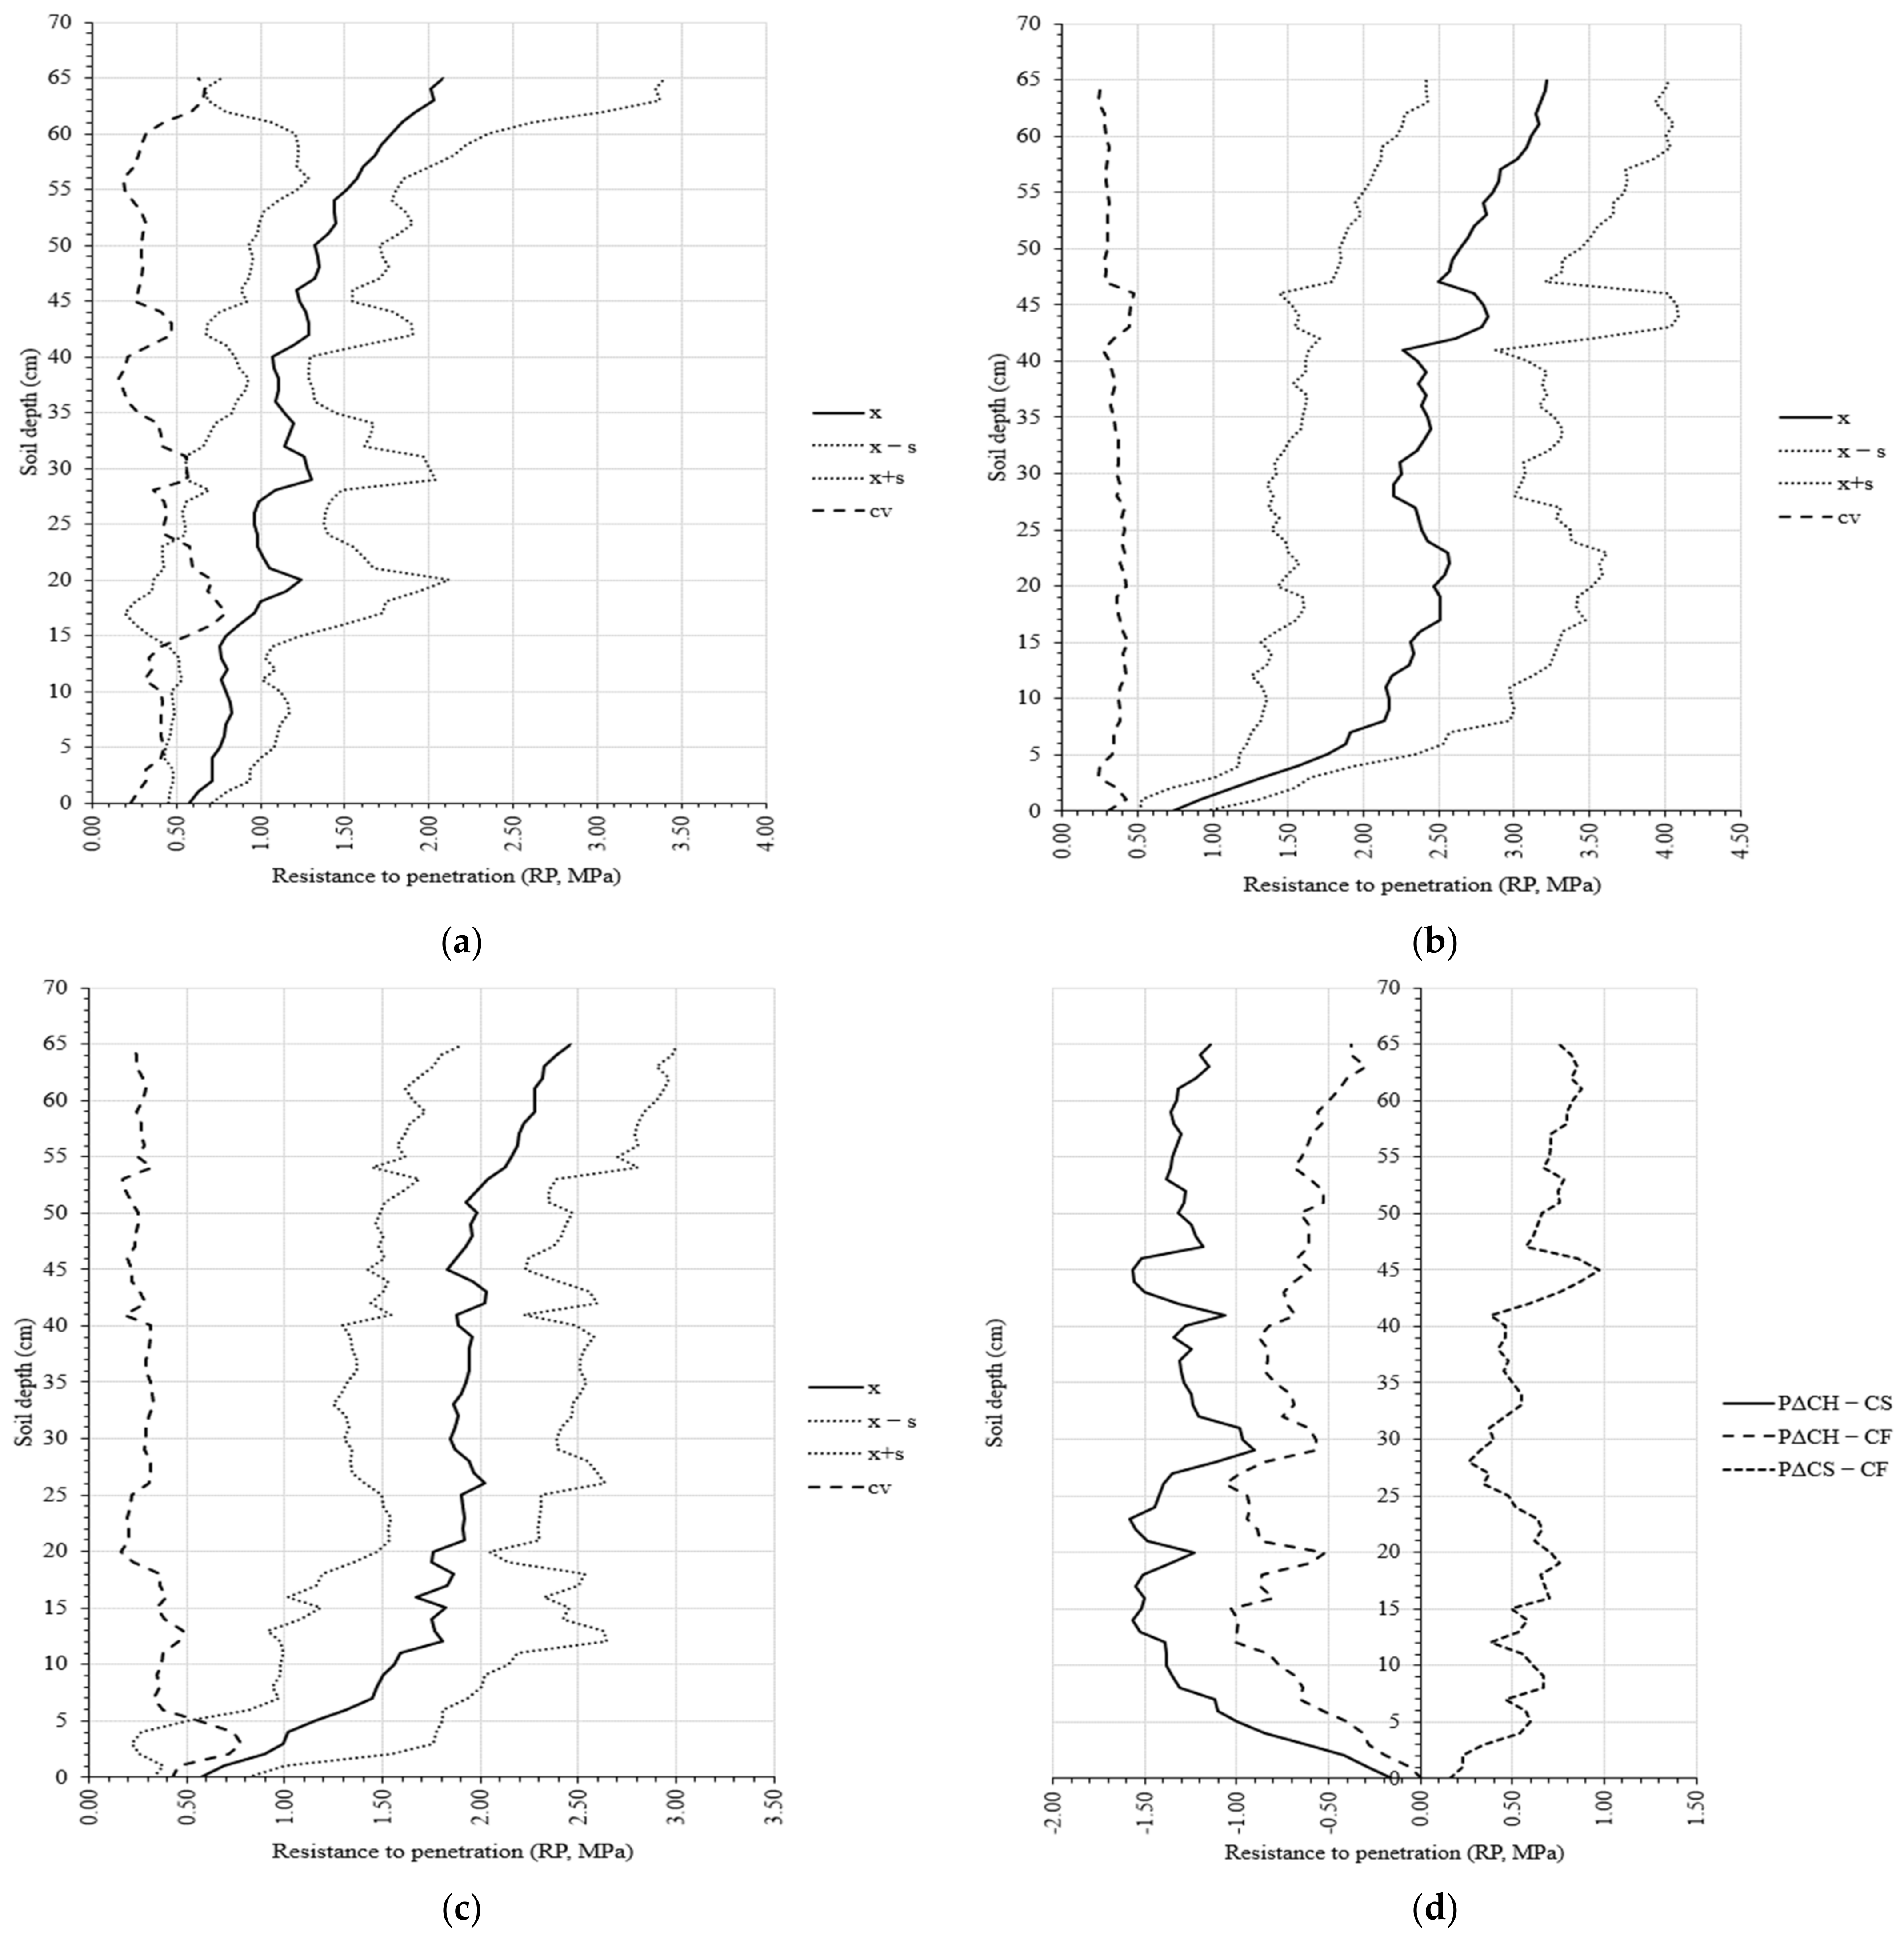
3.1. Penetration Resistance in the Natural Soil

Figure 2 summarizes the results on the variation in mean penetration resistance along the soils’ depth profile up to a depth of 65 cm. Although most of the data were available up to a depth of 80 cm, the choice of limiting the analysis of data in the depth range of 0 to 65 cm was based on the maximum length of available data, which for the forwarder control (CF) was 65 cm (Table 2). In the CH dataset, there was less variation in the mean penetration resistance for soil depths of 0 to 15, 22 to 27 and 29 to 40 cm (Figure 3a). In CS data, there were data segments with low variation in mean penetration resistance between 8 to 11, 17 to 22 and 33 to 41 cm (Figure 3b), while in the CF data, low variation in the mean penetration resistance was found between 12 to 39 and 45 to 53 cm (Figure 3c). Although the CH dataset did not show an evident changing point at 10 cm, this was the case of CS and CF data. A second changing point can be seen at 20 cm, which was most evident in the CH data, which was similar to the third changing point at 30 cm. In the depth layer of 31 to 50 cm, the mean penetration resistance was relatively constant at about 1.2 MPa in the CH dataset, 2.4 MPa in the CS dataset and 1.9 MPa in the CF dataset, with some variation between 40 and 45 cm in CS and CF datasets. Accordingly, the fourth changing point was set at 50 cm in all datasets. Then, between 51 and 65 cm, the mean penetration resistance started to increase in all control datasets.
The data subsets used to estimate the mean values at centimeter-level soil depths were characterized by a large dispersion, particularly beyond the first 5 cm of the topsoil. This can be seen in Figure 3a–c for CH, CS and CF where the standard deviation curves are added along with the coefficient of variation. The latter was uniform along the depth of the soil for the CS dataset (Figure 3b); however, it exceeded 25% for most of the soil depths of this dataset. In terms of uniformity, next in line was the CF dataset, with an increased coefficient of variation in the first 20 cm, followed by a trend similar to CS in the depth layer of 21 to 65 cm. The CH dataset showed the most variability and changing points in the values of the coefficient of variation (Figure 3a).
Figure 3d, on the other hand, shows the absolute differences in the mean penetration resistance as a function of the soil’s depth. These differences were computed based on the mean soil depth-related values of CH, CS and CF datasets, and they were used to compare the control datasets for each of the three possible data pairs (CH-CS, CH-CF and CS-CF). The data show that the lowest differences were between the CS and CF datasets, with a mean difference of 0.59 MPa (data not explicitly shown herein). Next in line, the lowest differences were between CH and CS datasets, with a mean difference of −0.66 MPa, and the largest differences were found between CH and CS datasets (mean difference of −1.25 MPa). Both the variation in the mean penetration resistance and the variability in the data used to estimate it may be related to the characteristics of the three soil types in H, S and F (Table 1). It is obvious that differences in the mean penetration resistance can be expected between these three soil types, as shown in Figure 3d. For instance, the minimum and maximum differences between CH and CS were found to be −0.15 and −1.58 MPa, at depths of 0 and 23 cm, respectively, and the mean penetration resistance in CH was lower than in CS along the entire sampled depth of the soil. Also, the minimum and maximum differences between CH and CF were found to be 0.01 and −1.01 MPa at depths of 0 and 15 cm, respectively; by comparing the two datasets, the mean penetration resistance in CH was lower than in CF along the entire sampled depth of the soil, except for the first point (0 cm). Finally, the minimum and maximum differences in the mean penetration resistance between CS and CF were found to be 0.16 and 0.97 MPa at depths of 0 and 45 cm, respectively. By comparing these datasets, the mean penetration resistance was found to be higher in CS than in CF along the entire sampled depth of the soil.

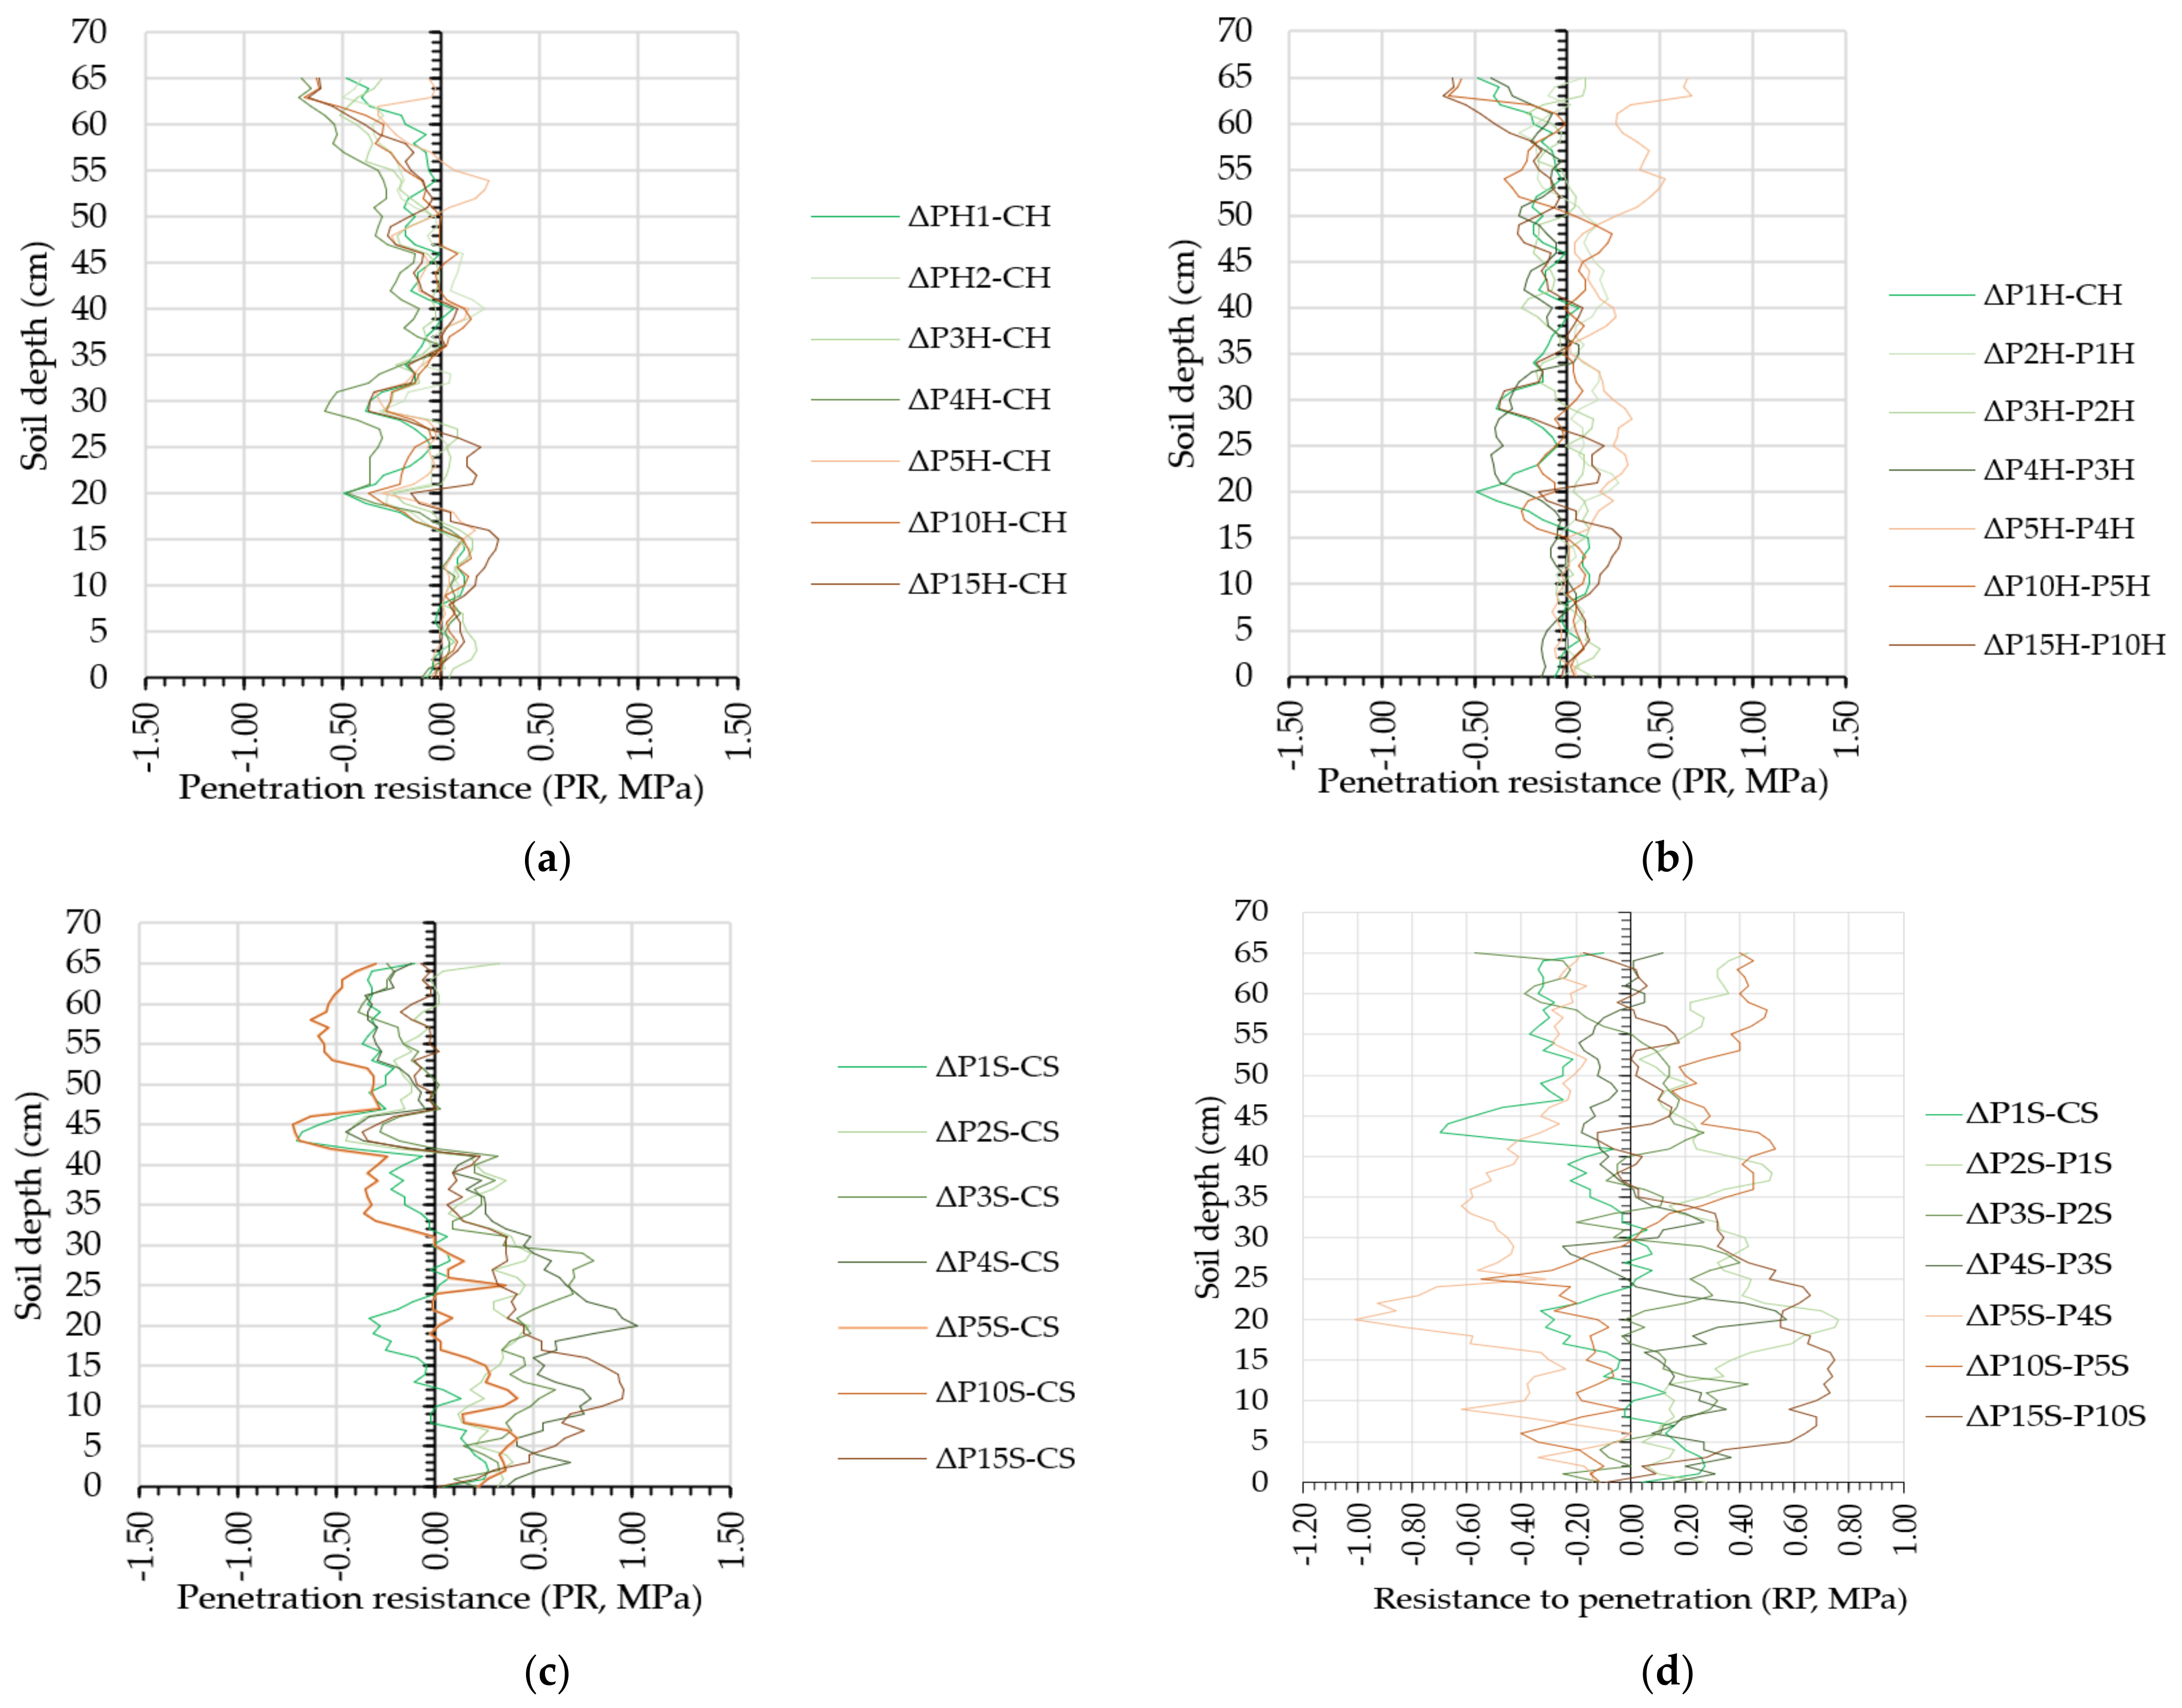
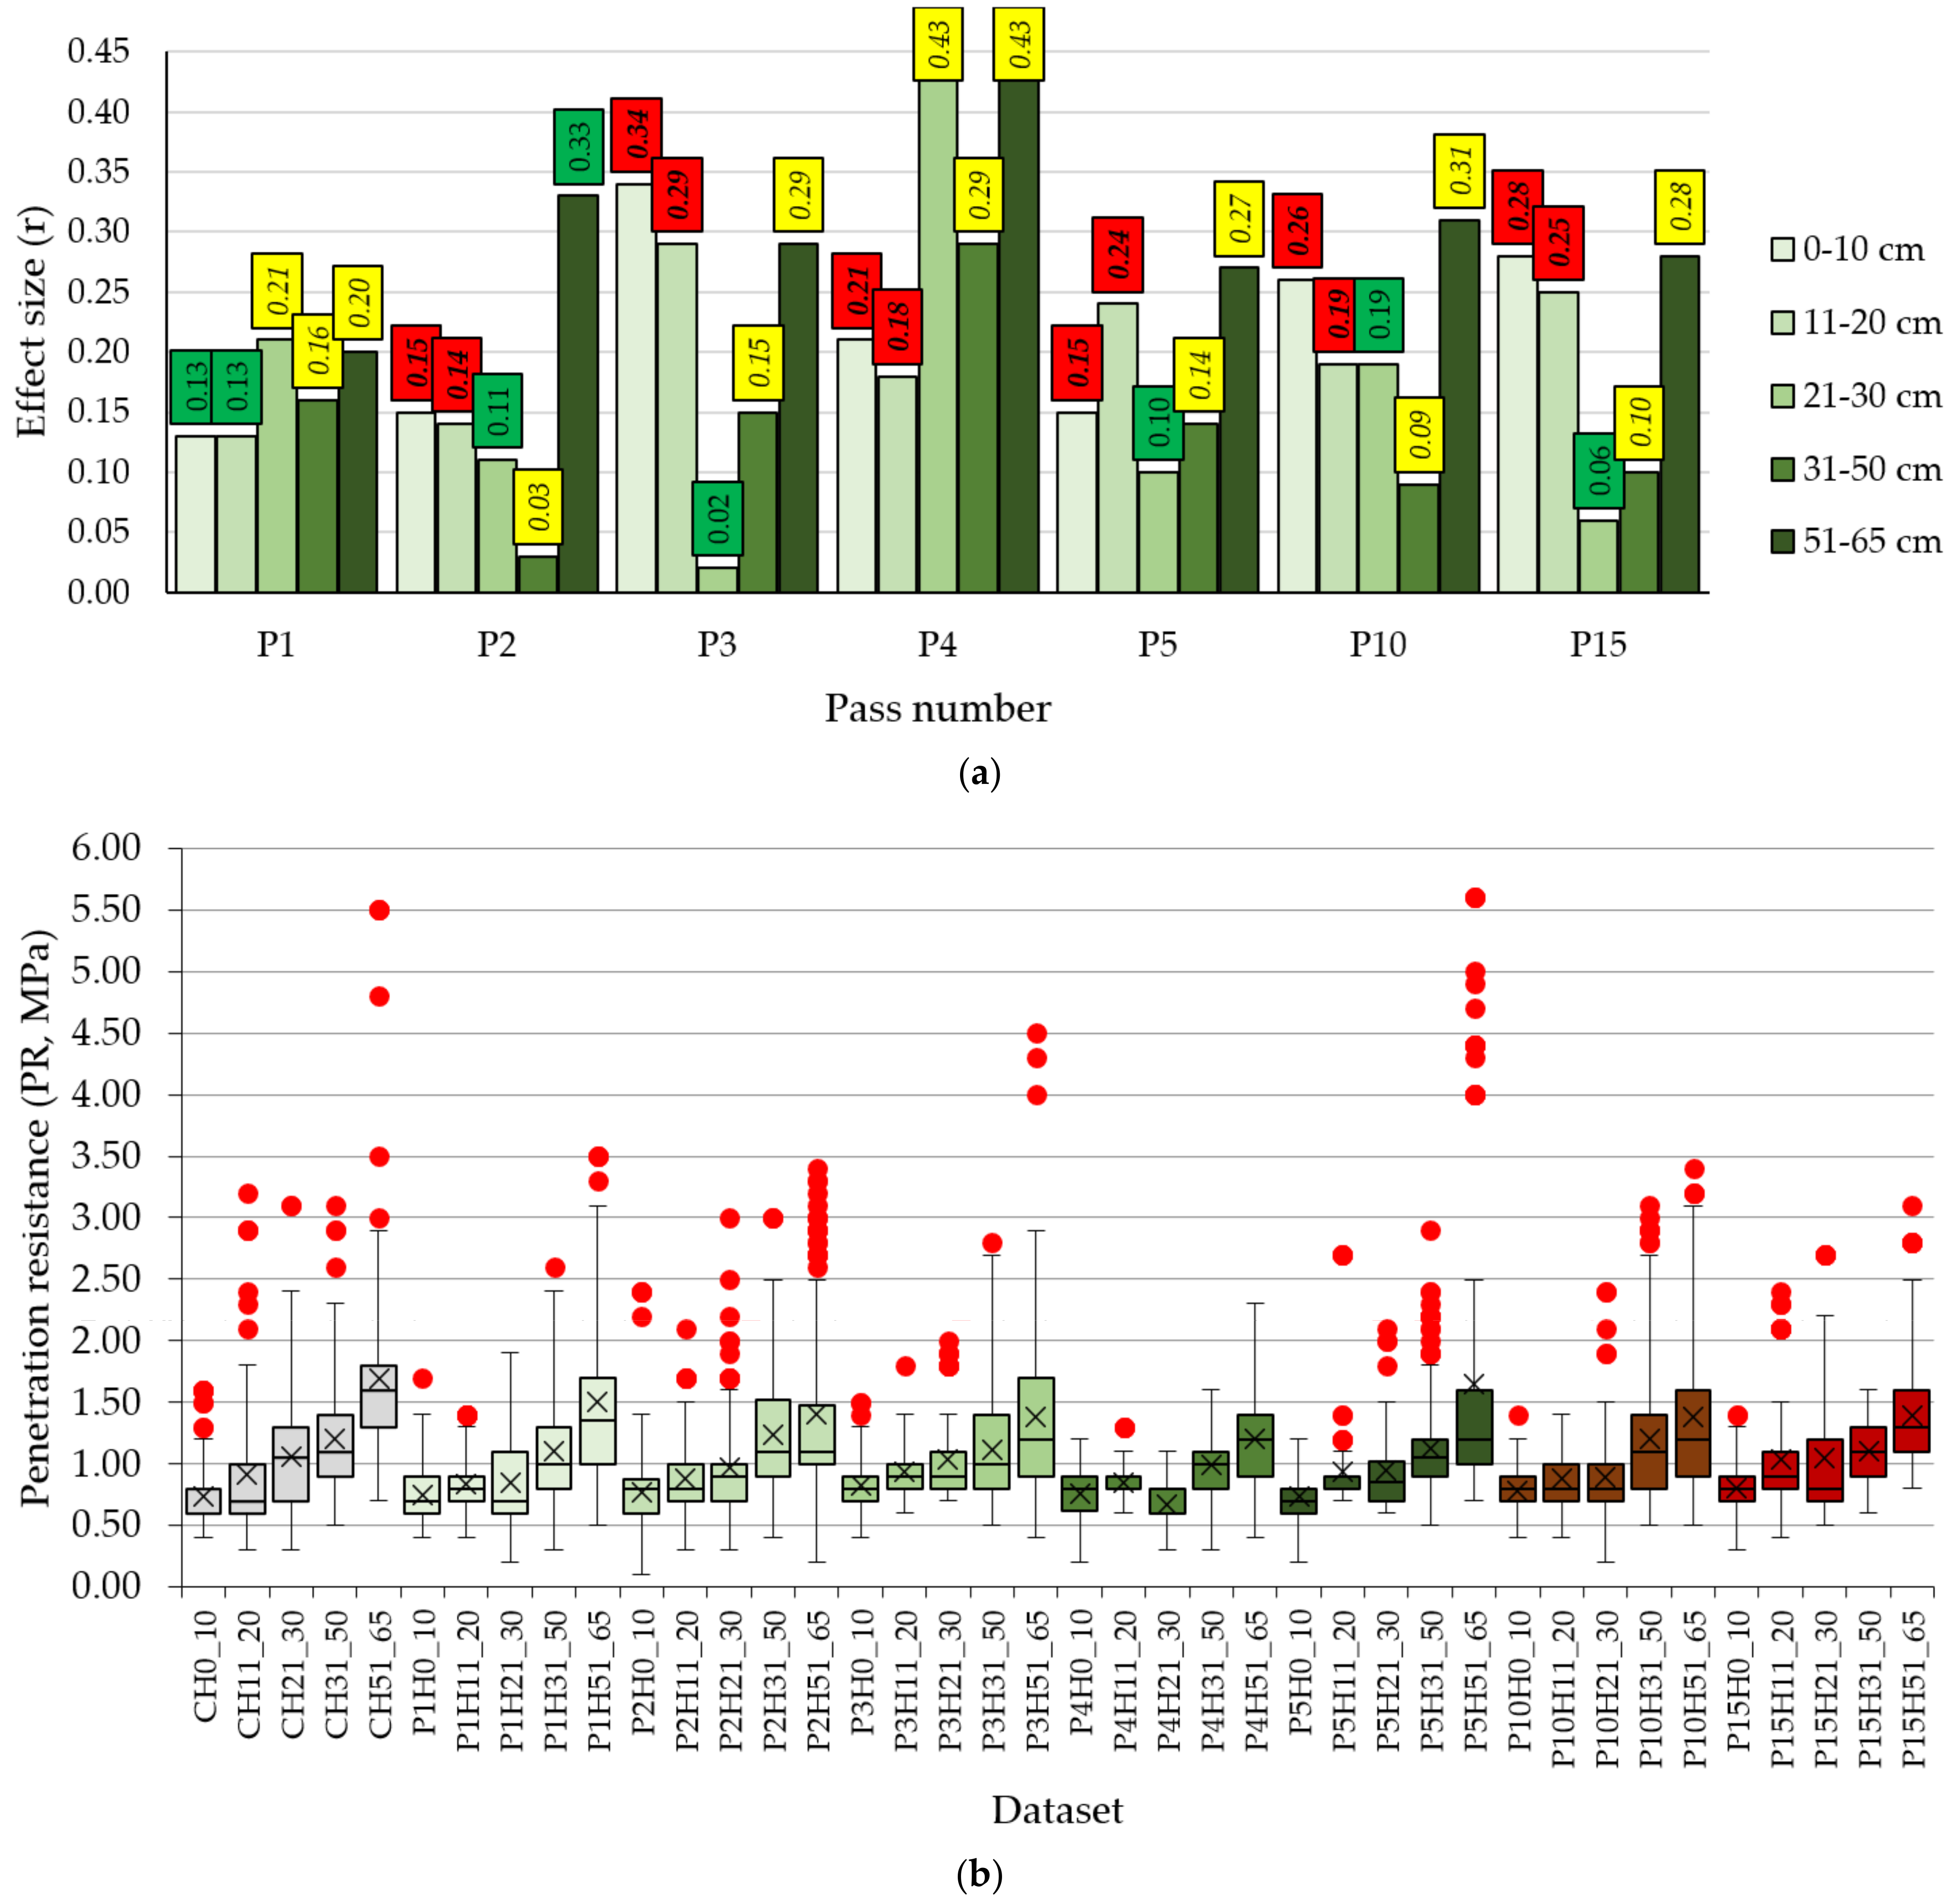
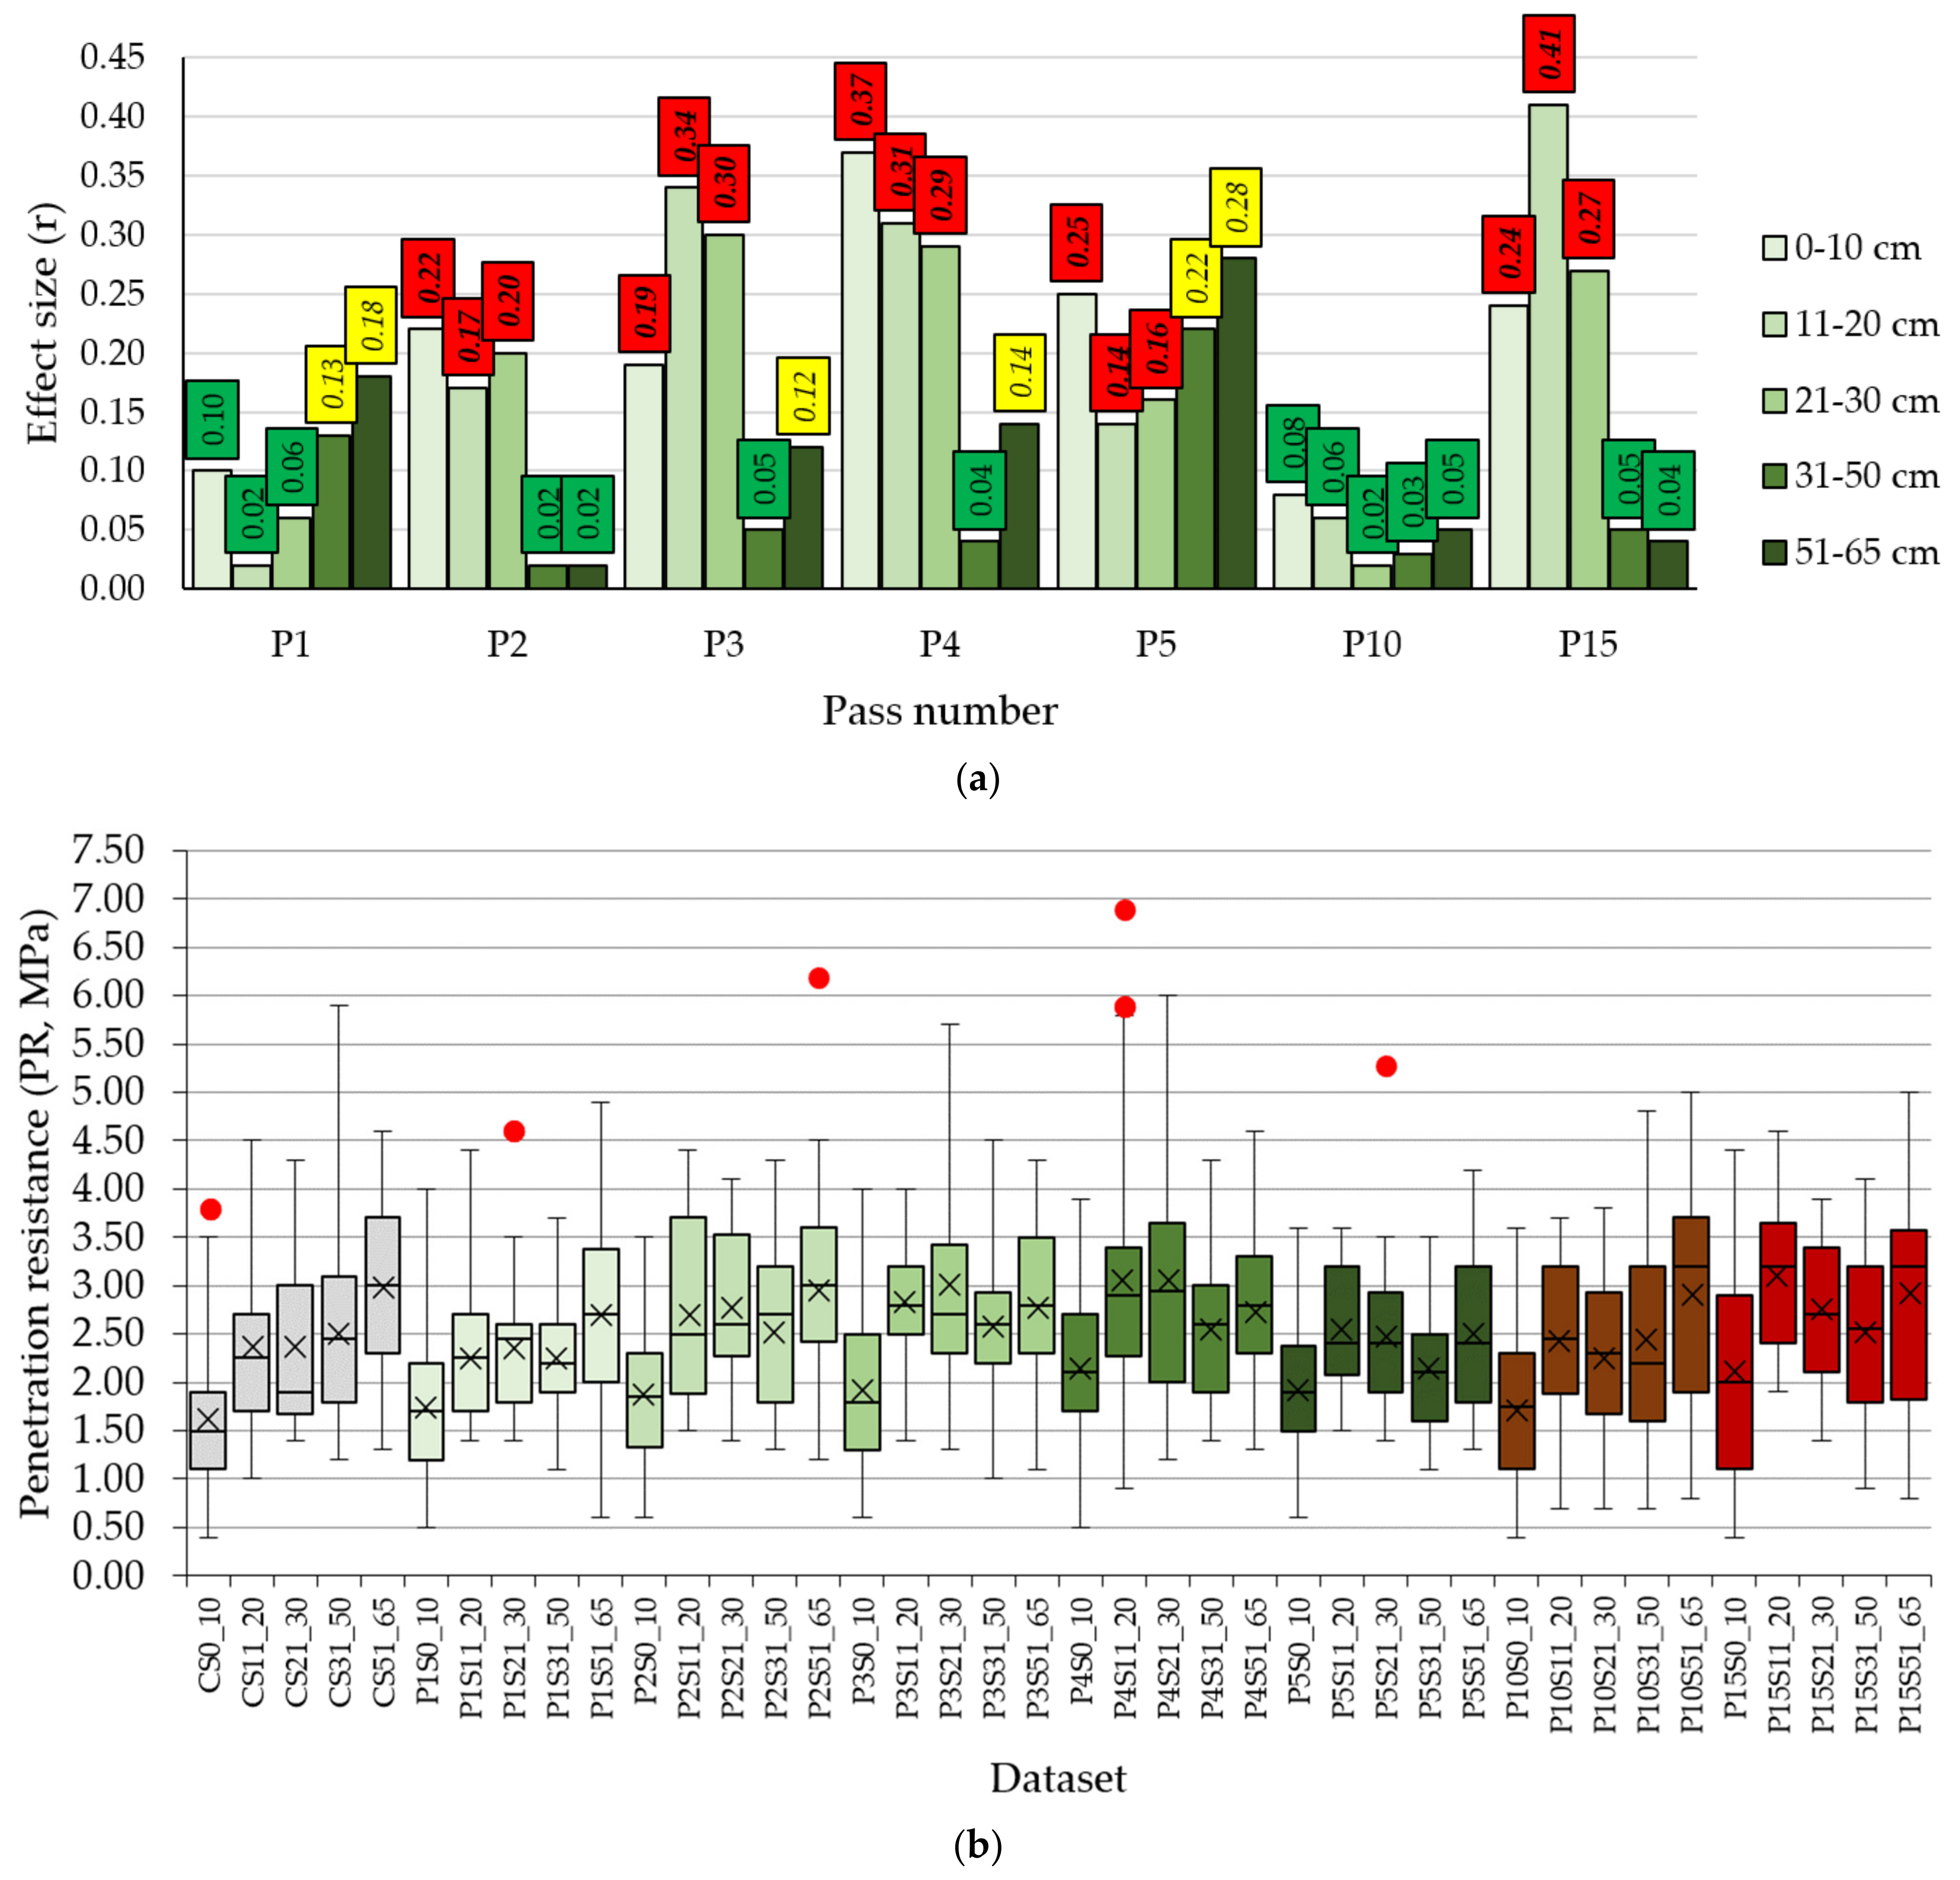
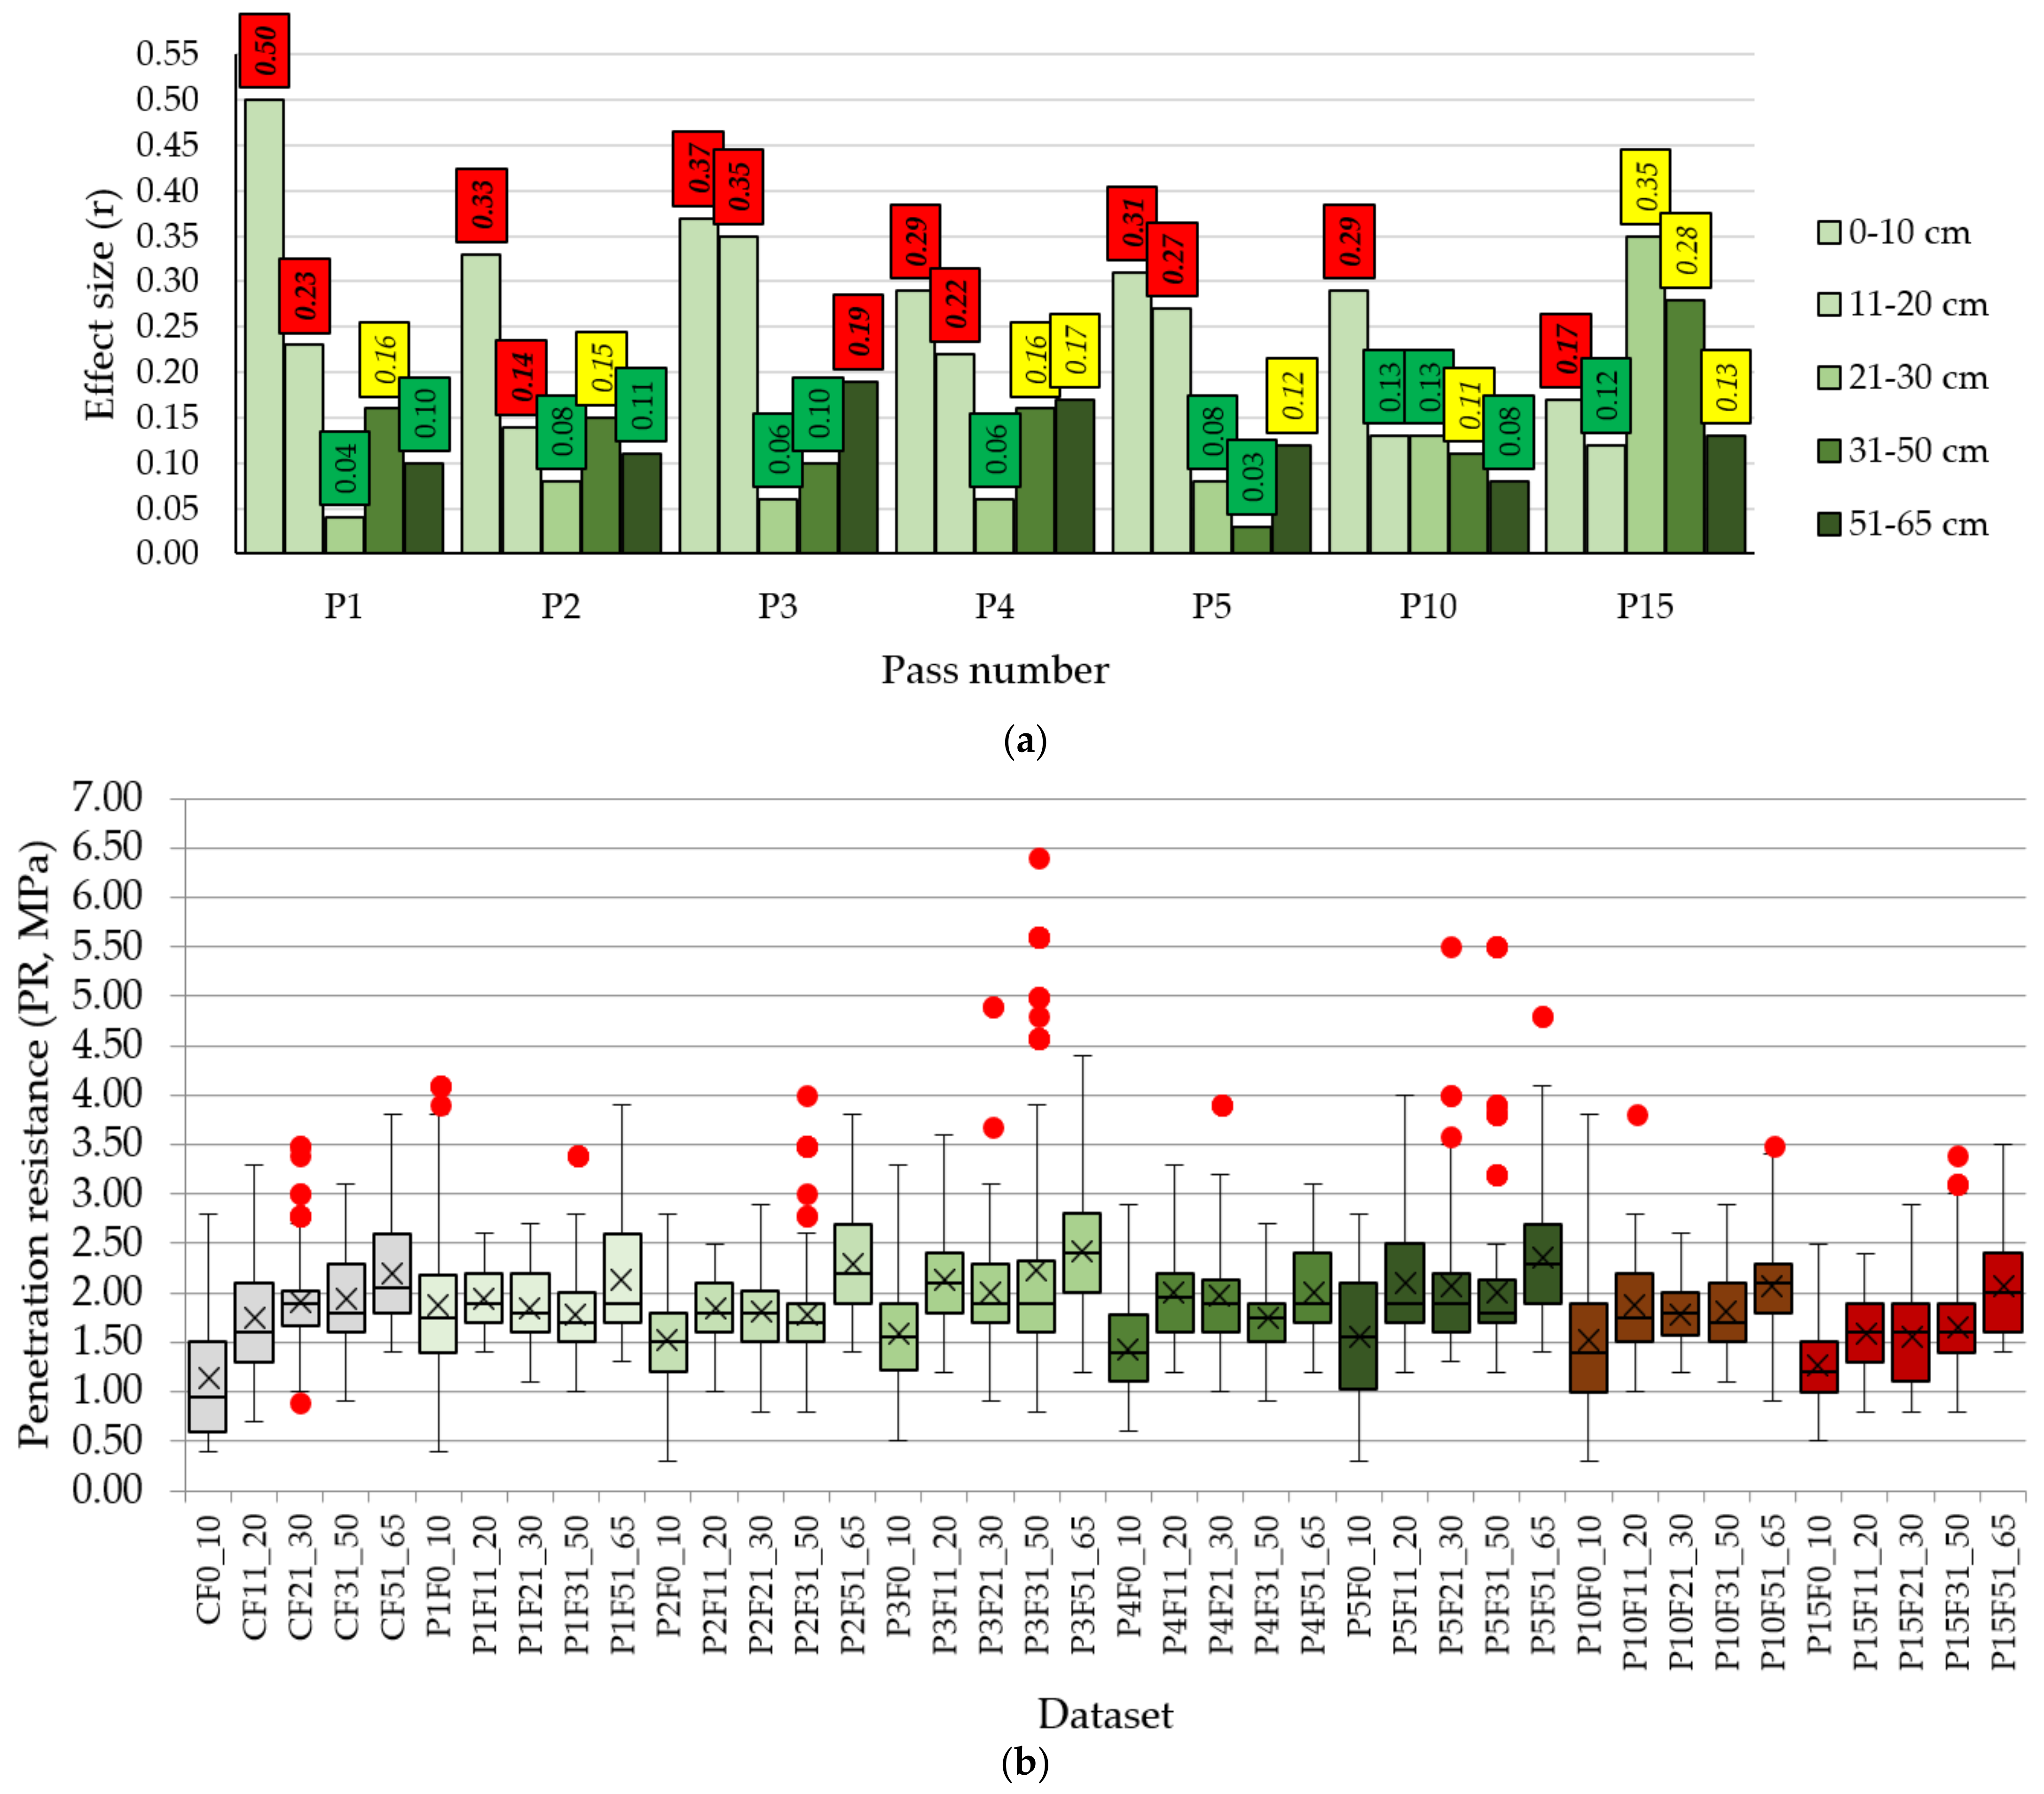
3.2. Changes in the Trafficked Soil

Figure 4 shows the results on differences in the mean penetration resistance by taking as a reference the control data and measurements taken after the first, second, third, fourth, fifth, tenth and fifteenth passes (panels on the left) and the differences in the mean penetration resistance by taking successive measurements (panels on the right).
As shown, in the H testing area, positive changes were found mostly in the first 15 cm of soil irrespective of the number of passes at which the measurements were taken (Figure 4a). These, however, increased the penetration resistance only to a small extent, with up to 0.28 MPa in this soil layer. Changes in the mean penetration resistance also occurred at depths of 20 to 25, 35 to 40 and 50 to 55 cm, but these appeared mostly after 10 to 15 passes and were minor. There was found a consistent soil loosening in the layers at depths of 20 to 35 and 45 to 65 cm. In the S testing area, important changes occurred in the first 30 cm of soil, and mostly after the second pass, and a consistent loosening appeared at a depth between 40 and 65 cm (Figure 4c). Finally, in the F testing area (Figure 4e), the changes were rather inconsistent, but they show a high increment in the first 10 cm of soil.
At the first pass with horses (Figure 4b), positive changes in the mean penetration resistance occurred in the first 15 cm of soil relative to the control data. The second pass did not contribute with positive changes but rather loosened the soil at a depth of 0 to 5 cm. The third pass increased the mean penetration resistance at depths of 20, 33 and 40 to 65 cm. The fourth pass did not bring positive changes, and the fifth pass produced higher changes at depths of 15 to 35 and 50 to 65 cm. Five more passes (P10) did not produce important changes relative to the first five passes in the mean penetration resistance, but the last five passes (P15) produced changes at depths of 10 to 15 and 20 to 25 cm relative to the first ten.
At the first pass with the skidder, minor positive changes in the mean penetration resistance occurred in the first 5 to 10 cm of soil. The second pass contributed to high increments at depths of 10 to 30 and 50 to 65 cm. The third pass added minor changes relative to the second, the fourth pass increased the penetration resistance at 20 cm and the fifth pass loosened the soil. The following five passes (P10) increased the penetration resistance at depths of 30 to 65 cm and the next five passes (P15) increased the penetration resistance significantly in the first 30 to 35 cm of the soil. Compared to horse logging the changes between measurements seem to be higher in magnitude.
Finally, the first pass with a forwarder produced the most important changes in the first 10 cm. In terms of magnitude, these were much higher as opposed to skidding and horse logging. The second pass did not produce high increments in the mean penetration resistance relative to the first one, but the third pass produced important changes at depths of 25 to 50 cm. The fourth pass did not bring important changes and the fifth pass increased the penetration resistance mostly between 30 and 65 cm. The next five passes (P10) seemed to loosen the soil relative to the first five, which also held true for the next five passes (P15).

3.3. Significance of Changes following the Tests

The data characterizing the samples of the delimited soil layers largely failed the normality tests, as shown in Table A2, Table A3 and Table A4. For that reason, it was not possible to use parametric comparison tests, and the Mann–Whitney test was used given the type of data used.
Figure 5 shows the results of the statistical comparison for the H testing area along with the main descriptive statistics of the datasets used for comparison. Figure 5a, for instance, shows the size effects found by the comparison tests as the main statistic for comparison, along with the significance of the tests given by a traffic light color code of the labels of the data. The same logic was kept for the graphical representation of the results in the case of F (Figure 6) and S (Figure 7) testing areas.
The first pass (P1) with horses produced no statistically significant changes in the first 20 cm of the soil and, in the rest of the profile, there were statistically significant changes but in the sense of a decreased penetration resistance compared to the control data (soil loosening). The second pass produced rather low effects but significant changes in the increment of penetration resistance in the first 20 cm of the soil, although their magnitude in difference was low (Figure 5b).
The trend was preserved for the third pass, where the first 20 cm of soil was affected by an increased penetration resistance; in this case, the effect size approached a moderate figure (0.34 and 0.29) for the first 20 cm of soil and both the significance of changes and the effect size were preserved for the following horse passes up to the fifteenth pass. As a rule, large effects and statistically significant differences between the compared distributions were found for the soil layer from 21 to 65 cm after the first and fourth passes and for the soil layer from 31 to 65 cm after the third, fifth, tenth and fifteenth passes. However, these datasets indicated lower median values in the compared datasets as opposed to the control data.
Similar to H data, the first skidder pass produced no significant differences in the mean penetration resistance. However, starting with the second pass, medium size effects as well as statistically significant changes were found for the first 30 cm of soil, which kept the trend with the following passes up to the fifth one. With the third and fourth passes the effect size increased, and following the fifteenth pass, it become large at soil depths of 11 to 20 cm.
The relative differences in the mean values were larger between the compared and control data in the case of the S testing area. In addition, it seems that there are likely to be increasingly larger size effects in the passes following the fifteenth one, particularly in the first 30 cm of soil.
Figure 7 shows the results of the comparison tests for the F testing area. A first finding was that the first pass of the forwarder produced the largest change in the first 10 cm of soil, which is indicated by a statistically significant difference and a large size effect.
The trend of having statistically significant differences in the first 20 cm of the soil was consistent following the next machine passes, up to the tenth pass. Following the tenth pass, significant differences were found in the first 10 cm of the soil.

4. Discussion

A thorough comparison of the changes in the penetration resistance is difficult to make since there was a sufficient variation in the soil physical properties from one testing site to another to provide heterogeneous control datasets. For instance, the moisture content of the soils in the test sites decreased in the order H–S–F, while the clay content decreased in the order H–F–S. This may seriously limit the interpretation of results when comparing between sites; still, it provides the means for interpretation of results for each particular site. Such interpretations may only characterize the local effects brought by a given extraction means on given soil characteristics as found in the natural state. What is clear is that the extracted payload increased in the order H–S–F, which is common sense given the capacity of the studied extraction means. While it approached the maximum for H and F, for S it was half of that allowable as specified by the machine manufacturer, and different results may have occurred when skidding timber from final fellings.
Horse logging produced small changes (although statistically significant in some cases) in all the considered soil layers. Taking, for instance, the first 30 cm of soil, the mean penetration resistance increased only marginally, irrespective of the number of passes. At this soil depth, the mean penetration resistance in the control data was 0.71 MPa. It increased by −0.03, 0.00, 0.06, −0.02, 0.01, 0.01 and 0.10 MPa after the first, second, third, fourth, fifth, tenth and fifteenth passes, meaning a maximum relative increment of 12.2% after the last pass. Beyond this soil depth the effects were particularly low. This means that at least fifteen passes may be sustained on the same trail without important changes in the penetration resistance, and probably without adverse effects on root development, results which are consistent with the low-impact findings of horse logging [14]. However, this extraction option has one main limitation, namely that of being fully manual, which means a low productivity in loading, transport (low moving speed) and unloading, which is further affected by its limited loading capacity. In other words, what can be extracted with this option at low speed in fifteen work cycles can be extracted with a forwarder, at much higher speed, in two work cycles. In addition, this option can only be used when there is no requirement to extract long logs or tree lengths.
Skidders are typically designed to extract long wood, and sometimes they may operate with high payloads [4]. This extraction option is not only important in terms of share in Romania but also around the world [53]. In this study, the machine was tested in the conditions of a thinning operation, which meant a higher number of tree lengths per load and a lower payload volume and mass per turn, which accounted for 2.6 tons. Despite being a four-wheeled machine, which is similar to the H experiment, the mass in the unloaded state seemed to be an important factor in causing changes in the soil, although only a part of the payload discharges directly on the wheels. For the same first 30 cm of soil, the mean penetration resistance in the control data was 1.97 MPa. It increased by 0.01, 0.29, 0.38, 0.61, 0.24, 0.08 and 0.62 MPa after the first, second, third, fourth, fifth, tenth and fifteenth passes, respectively, meaning a maximum relative increment of 31.5% after the last pass.
Finally, forwarders are designed to carry loads, which means that, in addition to their unloaded mass, which is high, the mass of the payload is distributed to the soil through the wheels. The main advantage of this option is that it is fully mechanized and may operate at increased speeds [54], typically being characterized by a high capacity. A high capacity combined with a higher operational speed and full mechanization brings important benefits in terms of economics, ergonomics and safety, but it may cause irreversible changes in soil in terms of compaction. In the first 30 cm of soil, the mean penetration resistance was found to be 1.44 MPa for the control data. It increased consistently during the first ten passes by 0.47, 0.23, 0.41, 0.26, 0.37, and 0.25 after the first, second, third, fourth, fifth and tenth passes, respectively, showing a maximum relative change of 32.6%, right after the first pass, which was close to that of the skidder after the last pass.
In terms of relative changes in soils’ penetration resistance, it is obvious that horse logging and lighter machines such as the skidder used in the tests cause less soil compaction and may allow several loaded passes until reaching the same effects that heavier machines may cause right after the first loaded passes. As a reference, H, S and F added on average to the control RP 0.07, 0.52 and 0.12 MPa, respectively, after 15 passes in the first 10 cm of the soil. It is difficult, however, to relate the changes found in this study with the real increments (or decrements) in bulk density of the soils and with eventual negative effects that may affect tree root development and growth. In addition, the soils from the test areas H, S and F had different depth profiles in terms of penetration resistance in their natural state, as well as in terms of granulometry and moisture contents. For that reason, to be able to accurately estimate the effects in vegetation decline, if any, studies should be designed and implemented to see how the penetration resistance relates to the loss of growth or other important processes specific to the variability of forest ecosystems [14].
Some studies found that the majority of roots of some tree species are found in soil layers where penetration resistance is up to 3 MPa, while a significant number of those roots are located in those parts of the soil where it is up to 2 MPa [55]. From this point of view, animal logging produced no important changes and the natural soil itself did not show a mean penetration resistance higher than 2 MPa (the value approached only at 65 cm in depth, see for reference Figure A1). In the case of the S site (Figure A1), the mean penetration resistance of natural soil approached a value of 2 MPa starting after the first 5 cm in depth and kept values between 2 and 2.5 MPa up to 40 cm in depth, beyond which it approached a value of 3 MPa. Skidding seemed to produce important changes between 5 and 30 cm in depth, with the mean penetration resistance sometimes exceeding 3 MPa. At the F testing site, the mean penetration resistance of the natural soil increased from 2 to 2.5 MPa from 20 to 65 cm in depth. Only following the third pass did the results indicate a change higher than 2 but less than 3 MPa at a depth of 30 to 40 cm.
Although this study was performed in controlled conditions in terms of payload and slope, it is worth mentioning some of the important limitations. First of all, the passes over the testing areas were carried out in a closed loop, which might not resemble the real operations in such cases in which the same trail is used for both empty and loaded turns. However, empty turns are less likely to produce additional stress over the soil, beyond that which the loaded turns may cause, particularly after a given number of passes. While the authors are quite confident in the accuracy of measurements, some caution should be exercised particularly for the last ones since there might be some effects on accuracy induced by increasing the number of measurements taken close together. The study was designed to avoid such errors by distributing the point measurements at a reasonable distance among them so as to limit the effect of loosening of the soil on the next measurement by the previous one. However, it was difficult to predict and control the changes in the soil caused by the measurements themselves. Another concern is that related to the depth of the measurements which in all cases took as a reference the surface of the soil. While the measurements taken over the natural soil reflect the real condition of that soil along the depth profile, some misalignment was characteristic in the comparisons since the ruts increased in depth with the number of passes. Therefore, the study compared the data taken in these conditions without any depth correction, an approach which is accepted in experiments such as that reported herein.

5. Conclusions

Based on the results of this study, one can conclude that animal logging produces rather insignificant changes irrespective of the number of passes, while skidding increasingly contributes to compaction in relation to the number of passes. In contrast, forwarding did affect to a great extent the topsoil right after the first passes. Based on the findings, it cannot be concluded that the levels in penetration resistance will affect the trees located nearby the experimental trails. Form this point of view, follow-up studies are needed to see how the soils would recover, particularly in the first 30 cm, and if there will be any effects on the trees. Given the heterogeneity in soil properties, local conditions and climate, timing of operations and diversity of options used to extract timber, further studies are needed to better understand soil compaction and how it may affect the trees in relation to the practices used to extract the timber.

Author Contributions

Conceptualization, S.A.B.; Data curation, M.F.P., G.O.F. and S.A.B.; Formal analysis, M.F.P., G.O.F. and S.A.B.; Funding acquisition, S.A.B.; Investigation, M.F.P. and G.O.F.; Methodology, M.F.P. and S.A.B.; Project administration, S.A.B.; Resources, M.F.P., G.O.F. and S.A.B.; Software, S.A.B.; Supervision, S.A.B.; Validation, M.F.P., G.O.F. and S.A.B.; Visualization, M.F.P., G.O.F. and S.A.B.; Writing—original draft, M.F.P., G.O.F. and S.A.B.; Writing—review and editing, S.A.B. All authors have read and agreed to the published version of the manuscript.

Funding

Part of this research aimed at collecting media footage for developing video tutorials on measuring the penetration resistance as a parameter in the evaluation of forest soil compaction following harvesting and it was supported by a project financed by Romanian Ministry of Education and Research, CNCS—UEFISCDI—PN-IV-P8-8.1-PRE-HE-ORG-2023-0141. Some concepts and graphics used in this work were developed in the Technodiversity project: Harmonizing European education in forest engineering by implementing an e-learning platform to support adaptation and evaluation of forest operations, for which information is available at: https://technodiversity-moodle.ibe.cnr.it/ (accessed on 10 June 2024). An APC waiver was received for this work.

Institutional Review Board Statement

Not applicable.

Informed Consent Statement

Not applicable.

Data Availability Statement

Data supporting this study may be made available by the corresponding author upon a reasonable request.

Acknowledgments

The authors acknowledge the support of the Department of Forest Engineering, Forest Management Planning and Terrestrial Measurements, Faculty of Silviculture and Forest Engineering, Transilvania University of Brasov for providing the equipment needed in this study. Also, the authors would like to thank the management of the Mureş Forest Directorate and the timber harvesting contractors for their logistical support during the field phase of the study.

Conflicts of Interest

The authors declare no conflicts of interest.

Appendix A

Table A1. Main technical features of the tested extraction means.
MeanSummary DescriptionUnloaded Weight (tons)
Horses
+
cart
Four-wheel cart, made of wood and a steel frame, with a maximum loading capacity of about 2 tons, which depends on the size and arrangement of the logs, tires used during the study are 195/70R14, weight: 500 kg, length 3.5 m, depth 50 cm, width 60 cm, horse weight 550 kg.0.6
ForwarderEight-wheel-drive specialized machine, with a maximum loading capacity of 16 tons, which depends on the size and arrangement of the logs. Brand: John Deere 10.10, tires used during the study: 2720/106, front tires width 34–14, rear tires width 24.5. Diesel engine of 115.5 kW, transmission: hydrostatic–mechanical, 2-speed gearbox. Gear bogie axles at the front and the rear. Hydromechanical differential lock at the front and the ear. 18.0
SkidderFour-wheel specialized machine. Brand: TAF 690 PE, with a maximum loading capacity of 5 tons, tires used during the study 18.4–26, external diameter 1450 mm, ballooning 465 mm, engine: Perkins 1104d-44t, 70 kW.7.5
Table A2. Results of the normality check of the delimited soil layers for testing area H.
DatasetDescriptionW—Statp-ValueOutcome
CH0-10Horse logging, control, soil layer from 0 to 10 cm in depth0.753624<0.001No
CH11-20Horse logging, control, soil layer from 11 to 20 cm in depth0.730276<0.001No
CH21-30Horse logging, control, soil layer from 21 to 30 cm in depth0.902987<0.001No
CH31-50Horse logging, control, soil layer from 31 to 50 cm in depth0.861223<0.001No
CH51-65Horse logging, control, soil layer from 51 to 65 cm in depth0.722706<0.001No
P1H0-10Horse logging, pass 1, soil layer from 0 to 10 cm in depth0.895026<0.001No
P1H11-20Horse logging, pass 1, soil layer from 11 to 20 cm in depth0.855186<0.001No
P1H21-30Horse logging, pass 1, soil layer from 21 to 30 cm in depth0.932094<0.001No
P1H31-50Horse logging, pass 1, soil layer from 31 to 50 cm in depth0.912371<0.001No
P1H51-65Horse logging, pass 1, soil layer from 51 to 65 cm in depth0.885944<0.001No
P2H0-10Horse logging, pass 2, soil layer from 0 to 10 cm in depth0.769865<0.001No
P2H11-20Horse logging, pass 2, soil layer from 11 to 20 cm in depth0.867089<0.001No
P2H21-30Horse logging, pass 2, soil layer from 21 to 30 cm in depth0.817071<0.001No
P2H31-50Horse logging, pass 2, soil layer from 31 to 50 cm in depth0.886358<0.001No
P2H51-65Horse logging, pass 2, soil layer from 51 to 65 cm in depth0.794401<0.001No
P3H0-10Horse logging, pass 3, soil layer from 0 to 10 cm in depth0.920714<0.001No
P3H11-20Horse logging, pass 3, soil layer from 11 to 20 cm in depth0.923701<0.001No
P3H21-30Horse logging, pass 3, soil layer from 21 to 30 cm in depth0.813737<0.001No
P3H31-50Horse logging, pass 3, soil layer from 31 to 50 cm in depth0.906402<0.001No
P3H51-65Horse logging, pass 3, soil layer from 51 to 65 cm in depth0.855369<0.001No
P4H0-10Horse logging, pass 4, soil layer from 0 to 10 cm in depth0.9642410.005No
P4H11-20Horse logging, pass 4, soil layer from 11 to 20 cm in depth0.850766<0.001No
P4H21-30Horse logging, pass 4, soil layer from 21 to 30 cm in depth0.940206<0.001No
P4H31-50Horse logging, pass 4, soil layer from 31 to 50 cm in depth0.971071<0.001No
P4H51-65Horse logging, pass 4, soil layer from 51 to 65 cm in depth0.948584<0.001No
P5H0-10Horse logging, pass 5, soil layer from 0 to 10 cm in depth0.9533320.001No
P5H11-20Horse logging, pass 5, soil layer from 11 to 20 cm in depth0.500010<0.001No
P5H21-30Horse logging, pass 5, soil layer from 21 to 30 cm in depth0.809513<0.001No
P5H31-50Horse logging, pass 5, soil layer from 31 to 50 cm in depth0.828511<0.001No
P5H51-65Horse logging, pass 5, soil layer from 51 to 65 cm in depth0.646207<0.001No
P10H0-10Horse logging, pass 10, soil layer from 0 to 10 cm in depth0.947203<0.001No
P10H11-20Horse logging, pass 10, soil layer from 11 to 20 cm in depth0.909640<0.001No
P10H21-30Horse logging, pass 10, soil layer from 21 to 30 cm in depth0.832280<0.001No
P10H31-50Horse logging, pass 10, soil layer from 31 to 50 cm in depth0.848009<0.001No
P10H51-65Horse logging, pass 10, soil layer from 51 to 65 cm in depth0.850861<0.001No
P15H0-10Horse logging, pass 15, soil layer from 0 to 10 cm in depth0.942074<0.001No
P15H11-20Horse logging, pass 15, soil layer from 11 to 20 cm in depth0.784041<0.001No
P15H21-30Horse logging, pass 15, soil layer from 21 to 30 cm in depth0.790054<0.001No
P15H31-50Horse logging, pass 15, soil layer from 31 to 50 cm in depth0.958199<0.001No
P15H51-65Horse logging, pass 15, soil layer from 51 to 65 cm in depth0.788169<0.001No
Table A3. Results of the normality check of the delimited soil layers for testing area S.
DatasetDescriptionW—Statp-ValueOutcome
CS0-10Skidding, control, soil layer from 0 to 10 cm in depth0.927460<0.001No
CS11-20Skidding, control, soil layer from 11 to 20 cm in depth0.938280<0.001No
CS21-30Skidding, control, soil layer from 21 to 30 cm in depth0.818967<0.001No
CS31-50Skidding, control, soil layer from 31 to 50 cm in depth0.907501<0.001No
CS51-65Skidding, control, soil layer from 51 to 65 cm in depth0.946184<0.001No
P1S0-10Skidding, pass 1, soil layer from 0 to 10 cm in depth0.9522660.001No
P1S11-20Skidding, pass 1, soil layer from 11 to 20 cm in depth0.915452<0.001No
P1S21-30Skidding, pass 1, soil layer from 21 to 30 cm in depth0.897632<0.001No
P1S31-50Skidding, pass 1, soil layer from 31 to 50 cm in depth0.9748400.001No
P1S51-65Skidding, pass 1, soil layer from 51 to 65 cm in depth0.9674260.001No
P2S0-10Skidding, pass 2, soil layer from 0 to 10 cm in depth0.9759370.044No
P2S11-20Skidding, pass 2, soil layer from 11 to 20 cm in depth0.897972<0.001No
P2S21-30Skidding, pass 2, soil layer from 21 to 30 cm in depth0.936113<0.001No
P2S31-50Skidding, pass 2, soil layer from 31 to 50 cm in depth0.925082<0.001No
P2S51-65Skidding, pass 2, soil layer from 51 to 65 cm in depth0.957938<0.001No
P3S0-10Skidding, pass 3, soil layer from 0 to 10 cm in depth0.9546980.001No
P3S11-20Skidding, pass 3, soil layer from 11 to 20 cm in depth0.9836250.252Yes
P3S21-30Skidding, pass 3, soil layer from 21 to 30 cm in depth0.912991<0.001No
P3S31-50Skidding, pass 3, soil layer from 31 to 50 cm in depth0.9724300.001No
P3S51-65Skidding, pass 3, soil layer from 51 to 65 cm in depth0.9675520.001No
P4S0-10Skidding, pass 4, soil layer from 0 to 10 cm in depth0.9732280.026No
P4S11-20Skidding, pass 4, soil layer from 11 to 20 cm in depth0.918078<0.001No
P4S21-30Skidding, pass 4, soil layer from 21 to 30 cm in depth0.9482740.001No
P4S31-50Skidding, pass 4, soil layer from 31 to 50 cm in depth0.968375<0.001No
P4S51-65Skidding, pass 4, soil layer from 51 to 65 cm in depth0.9641850.001No
P5S0-10Skidding, pass 5, soil layer from 0 to 10 cm in depth0.9827590.167Yes
P5S11-20Skidding, pass 5, soil layer from 11 to 20 cm in depth0.932247<0.001No
P5S21-30Skidding, pass 5, soil layer from 21 to 30 cm in depth0.937213<0.001No
P5S31-50Skidding, pass 5, soil layer from 31 to 50 cm in depth0.960442<0.001No
P5S51-65Skidding, pass 5, soil layer from 51 to 65 cm in depth0.952326<0.001No
P10S0-10Skidding, pass 10, soil layer from 0 to 10 cm in depth0.9660260.007No
P10S11-20Skidding, pass 10, soil layer from 11 to 20 cm in depth0.9510030.001No
P10S21-30Skidding, pass 10, soil layer from 21 to 30 cm in depth0.9615310.005No
P10S31-50Skidding, pass 10, soil layer from 31 to 50 cm in depth0.942539<0.001No
P10S51-65Skidding, pass 10, soil layer from 51 to 65 cm in depth0.950297<0.001No
P15S0-10Skidding, pass 15, soil layer from 0 to 10 cm in depth0.9565880.001No
P15S11-20Skidding, pass 15, soil layer from 11 to 20 cm in depth0.940025<0.001No
P15S21-30Skidding, pass 15, soil layer from 21 to 30 cm in depth0.944214<0.001No
P15S31-50Skidding, pass 15, soil layer from 31 to 50 cm in depth0.952136<0.001No
P15S51-65Skidding, pass 15, soil layer from 51 to 65 cm in depth0.950648<0.001No
Table A4. Results of the normality check of the delimited soil layers for testing area F.
DatasetDescriptionW—Statp-ValueOutcome
CF0-10Forwarding, control, soil layer from 0 to 10 cm in depth0.902264<0.001No
CF11-20Forwarding, control, soil layer from 11 to 20 cm in depth0.944645<0.001No
CF21-30Forwarding, control, soil layer from 21 to 30 cm in depth0.894580<0.001No
CF31-50Forwarding, control, soil layer from 31 to 50 cm in depth0.947589<0.001No
CF51-65Forwarding, control, soil layer from 51 to 65 cm in depth0.939408<0.001No
P1F0-10Forwarding, pass 1, soil layer from 0 to 10 cm in depth0.891729<0.001No
P1F11-20Forwarding, pass 1, soil layer from 11 to 20 cm in depth0.9513260.001No
P1F21-30Forwarding, pass 1, soil layer from 21 to 30 cm in depth0.9652900.010No
P1F31-50Forwarding, pass 1, soil layer from 31 to 50 cm in depth0.904832<0.001No
P1F51-65Forwarding, pass 1, soil layer from 51 to 65 cm in depth0.921543<0.001No
P2F0-10Forwarding, pass 2, soil layer from 0 to 10 cm in depth0.9634800.004No
P2F11-20Forwarding, pass 2, soil layer from 11 to 20 cm in depth0.9668090.013No
P2F21-30Forwarding, pass 2, soil layer from 21 to 30 cm in depth0.9828560.220Yes
P2F31-50Forwarding, pass 2, soil layer from 31 to 50 cm in depth0.859852<0.001No
P2F51-65Forwarding, pass 2, soil layer from 51 to 65 cm in depth0.9676870.001No
P3F0-10Forwarding, pass 3, soil layer from 0 to 10 cm in depth0.9756650.041No
P3F11-20Forwarding, pass 3, soil layer from 11 to 20 cm in depth0.9551230.002No
P3F21-30Forwarding, pass 3, soil layer from 21 to 30 cm in depth0.867124<0.001No
P3F31-50Forwarding, pass 3, soil layer from 31 to 50 cm in depth0.760003<0.001No
P3F51-65Forwarding, pass 3, soil layer from 51 to 65 cm in depth0.9795700.025No
P4F0-10Forwarding, pass 4, soil layer from 0 to 10 cm in depth0.9751220.037No
P4F11-20Forwarding, pass 4, soil layer from 11 to 20 cm in depth0.937307<0.001No
P4F21-30Forwarding, pass 4, soil layer from 21 to 30 cm in depth0.882888<0.001No
P4F31-50Forwarding, pass 4, soil layer from 31 to 50 cm in depth0.9764590.002No
P4F51-65Forwarding, pass 4, soil layer from 51 to 65 cm in depth0.953716<0.001No
P5F0-10Forwarding, pass 5, soil layer from 0 to 10 cm in depth0.9646330.005No
P5F11-20Forwarding, pass 5, soil layer from 11 to 20 cm in depth0.907568<0.001No
P5F21-30Forwarding, pass 5, soil layer from 21 to 30 cm in depth0.813867<0.001No
P5F31-50Forwarding, pass 5, soil layer from 31 to 50 cm in depth0.677712<0.001No
P5F51-65Forwarding, pass 5, soil layer from 51 to 65 cm in depth0.920883<0.001No
P10F0-10Forwarding, pass 10, soil layer from 0 to 10 cm in depth0.883488<0.001No
P10F11-20Forwarding, pass 10, soil layer from 11 to 20 cm in depth0.9496870.001No
P10F21-30Forwarding, pass 10, soil layer from 21 to 30 cm in depth0.9761910.067No
P10F31-50Forwarding, pass 10, soil layer from 31 to 50 cm in depth0.960990<0.001No
P10F51-65Forwarding, pass 10, soil layer from 51 to 65 cm in depth0.9768900.012No
P15F0-10Forwarding, pass 15, soil layer from 0 to 10 cm in depth0.9638580.004No
P15F11-20Forwarding, pass 15, soil layer from 11 to 20 cm in depth0.9795010.122Yes
P15F21-30Forwarding, pass 15, soil layer from 21 to 30 cm in depth0.9559660.002No
P15F31-50Forwarding, pass 15, soil layer from 31 to 50 cm in depth0.939592<0.001No
P15F51-65Forwarding, pass 15, soil layer from 51 to 65 cm in depth0.920231<0.001No
Figure A1. Mean penetration resistance as a function of the soil depth in control (C) and after the first (P1), second (P2), third (P3), fourth (P4), fifth (P5), tenth (P10) and fifteenth (P15) pass: (a) testing site H; (b) testing site S; (c) testing site F.
Applsci 14 05117 g0a1

References

  1. Technodiversity—Harmonizing European Education in Forest Engineering by Implementing an e-learning Platform to Support Adaptation and Evaluation of Forest Operations. Available online: https://technodiversity-moodle.ibe.cnr.it/ (accessed on 22 April 2024).
  2. Marchi, E.; Chung, W.; Visser, R.; Abbas, D.; Nordfjell, T.; Mederski, P.S.; McEwan, A.; Brink, M.; Laschi, A. Sustainable forest operations (SFO): A new paradigm in a changing world and climate. Sci. Total Environ. 2018, 634, 1385–1397. [Google Scholar] [CrossRef]
  3. Heinimann, H.R. Forest operations engineering and management—The ways behind and ahead of a scientific discipline. Croat. J. For. Eng. 2007, 28, 107–121. [Google Scholar]
  4. Oprea, I. Tehnologia Exploatării Lemnului; Transilvania University Press: Braşov, Romania, 2008; ISBN 978-973-598-301-7. [Google Scholar]
  5. Jourgholami, M.; Ghassemi, T.; Labelle, E.R. Soil physio-chemical and biological indicators to evaluate the restoration of compacted soil following reforestation. Ecol. Indic. 2019, 101, 102–110. [Google Scholar] [CrossRef]
  6. Hansson, L.; Šimůnek, J.; Ring, E.; Bisho, K.; Gärdenäs, A.I. Soil compaction effects on root-zone hydrology and vegetation in boreal forest clearcuts. Soil Sci. Soc. Am. J. 2019, 83, 105–115. [Google Scholar] [CrossRef]
  7. Jourgholami, M.; Fathi, K.; Labelle, E.R. Effects of foliage and traffic intensity on runoff and sediment in skid trails after trafficking in a deciduous forest. Eur. J. For. Res. 2018, 137, 223–235. [Google Scholar] [CrossRef]
  8. Abari, M.E.; Majnounian, B.; Malekian, A.; Jourgholami, M. Effects of forest harvesting on runoff and sediment characteristics in the Hyrcanian forests, northern Iran. Eur. J. For. Res. 2017, 136, 375–386. [Google Scholar] [CrossRef]
  9. Labelle, E.R.; Jaeger, D. Soil compaction caused by cut-to-length forest operations and possible short-term natural rehabilitation of soil density. Soil Sci. Soc. Am. J. 2011, 75, 2314–2329. [Google Scholar] [CrossRef]
  10. Rab, M.A. Recovery of soil physical properties from compaction and soil profile disturbance caused by logging of native forest in Victorian Central Highlands, Australia. For. Ecol. Manag. 2004, 191, 329–340. [Google Scholar] [CrossRef]
  11. Mohieddinne, H.; Brasseur, B.; Spicher, F.; Gallet-Moron, E.; Buridant, J.; Kobaissi, A.; Horen, H. Physical recovery of forest soil after compaction by heavy machines, revealed by penetration resistance over multiple decades. For. Ecol. Manag. 2019, 449, 117472. [Google Scholar] [CrossRef]
  12. Naghdi, R.; Solgi, A.; Zenner, E.K.; Behjou, F.K. Soil physical properties degrade further on skid trails in the year following operations. J. For. Res. 2018, 29, 93–101. [Google Scholar] [CrossRef]
  13. Jourgholami, M.; Majnounian, B. Effects of wheeled cable skidder on rut formation in skid trail—A case study in Hyrcanian forest. J. For. Res. 2011, 22, 465–469. [Google Scholar] [CrossRef]
  14. Picchio, R.; Mederski, P.S.; Tavankar, F. How and How Much, Do Harvesting Activities Affect Forest Soil, Regeneration and Stands? Curr. For. Rep. 2020, 6, 115–128. [Google Scholar] [CrossRef]
  15. Naghdi, R.; Solgi, A.; Zenner, E.K.; Tsioras, P.A.; Nikooy, M. Soil disturbance caused by ground-based skidding at different soil moisture conditions in Northern Iran. Int. J. For. Eng. 2016, 27, 169–178. [Google Scholar] [CrossRef]
  16. Naghdi, R.; Solgi, A.; Labelle, E.R.; Nikooy, M. Combined effects of soil texture and machine operating trail gradient on changes in forest soil physical properties during ground-based skidding. Pedosphere 2020, 30, 508–516. [Google Scholar] [CrossRef]
  17. Parkhurst, B.M.; Aust, W.M.; Bolding, M.C.; Barrett, S.M.; Carter, E.A. Soil response to skidder trafficking and slash application. Int. J. For. Eng. 2018, 29, 31–40. [Google Scholar] [CrossRef]
  18. Solgi, A.; Naghdi, R.; Nikooy, M. Effects of skidder on soil compaction, forest floor removal and rut formation. Madera Bosques 2015, 21, 147–155. [Google Scholar]
  19. Labelle, E.R.; Jaeger, D. Quantifying the use of brush mats in reducing forwarder peak loads and surface contact pressures. Croat. J. For. Eng. 2012, 33, 249–274. [Google Scholar]
  20. Elaoud, A.; Chehaibi, S. Soil compaction due to tractor traffic. J. Fail. Anal. Prev. 2011, 11, 539–545. [Google Scholar] [CrossRef]
  21. Allman, M.; Jankovský, M.; Allmanová, Z. The cone index is a weak predictor of soil disturbance on forest soils of the Western Carpathians. J. Sustain. For. 2018, 37, 38–45. [Google Scholar] [CrossRef]
  22. Kleibl, M.; Klvač, R.; Pohořalý, J. Impact of forest operation on soil compaction–San Rossore case study. Acta Univ. Agric. Silvic. Mendel. Brun. 2015, 63, 1133–1140. [Google Scholar] [CrossRef]
  23. Aroca-Fernández, M.J.; Bravo-Fernández, J.A.; García-Viñas, J.I.; Serrada, R. Soil compaction and productivity evolution in a harvested and grazed mediterranean Scots Pine (Pinus sylvestris L.) forest. Forests 2024, 15, 451. [Google Scholar] [CrossRef]
  24. Han, S.K.; Han, H.S.; Page-Dumroese, D.S.; Johnson, L.R. Soil compaction associated with cut-to-length and whole-tree harvesting of a coniferous forest. Can. J. For. Res. 2009, 39, 976–989. [Google Scholar] [CrossRef]
  25. Lardy, J.M.; DeSutter, T.M.; Daigh, A.L.; Meehan, M.A.; Staricka, J.A. Effects of soil bulk density and water content on penetration resistance. Agric. Environ. Lett. 2022, 7, e20096. [Google Scholar] [CrossRef]
  26. Thomas, P.; Mondal, S.; Roy, D.; Meena, M.; Aggarwal, B.; Sharma, A.; Behera, U.; Das, T.; Jatav, R.; Chakraborty, D. Exploring the relationships between penetration resistance, bulk density and water content in cultivated soils. J. Agr. Phy. 2020, 20, 22–29. [Google Scholar]
  27. Solgi, A.; Najafi, A. The impacts of ground-based logging equipment on forest soil. J. For. Sci. 2014, 60, 28–34. [Google Scholar] [CrossRef]
  28. Dudáková, Z.; Allman, M.; Merganič, J.; Merganičová, K. Machinery-induced damage to soil and remaining forest stands—Case study from Slovakia. Forests 2020, 11, 1289. [Google Scholar] [CrossRef]
  29. Brais, S. Persistence of soil compaction and effects on seedling growth in northwestern Quebec. Soil Sci. Soc. Am. J. 2001, 65, 1263–1271. [Google Scholar] [CrossRef]
  30. Cudzik, A.; Brennensthul, M.; Białczyk, W.; Czarnecki, J. Damage to soil and residual trees caused by different logging systems applied to late thinning. Croat. J. For. Eng. 2017, 38, 83–95. [Google Scholar]
  31. Cambi, M.; Grigolato, S.; Neri, F.; Picchio, R.; Marchi, E. Effects of forwarder operation on soil physical characteristics: A case study in the Italian alps. Croat. J. For. Eng. 2016, 37, 233–239. [Google Scholar]
  32. Mousavi, F.; Abdi, E.; Ghalandarayeshi, S.; Page-Dumroese, D.S. Modeling unconfined compressive strength of fine-grained soils: Application of pocket penetrometer for predicting soil strength. Catena 2021, 196, 104890. [Google Scholar] [CrossRef]
  33. Allman, M.; Dudáková, Z.; Jankovský, M.; Vlčková, M.; Juško, V.; Tomčík, D. Soil compaction after increasing the number of wheeled tractors passes on forest soils in west Carpathians. Forests 2022, 13, 109. [Google Scholar] [CrossRef]
  34. Picchio, R.; Neri, F.; Petrini, E.; Verani, S.; Marchi, E.; Certini, G. Machinery-induced soil compaction in thinning two pine stands in central Italy. For. Ecol. Manag. 2012, 285, 38–43. [Google Scholar] [CrossRef]
  35. Nikooy, M.; Ahrari, S.; Salehi, A.; Naghdi, R. Effects of rubber-tired skidder and farm tractor on physical properties of soil in plantation areas in the north of Iran. J. For. Sci. 2015, 61, 393–398. [Google Scholar] [CrossRef]
  36. IRUM. 2024. Available online: https://www.irum.ro/en/machinery/skidder/ (accessed on 21 April 2024).
  37. Moskalik, T.; Borz, S.A.; Dvorák, J.; Ferencik, M.; Glushkov, S.; Muiste, P.; Lazdinš, A.; Styranivsky, O. Timber harvesting methods in Eastern European countries: A review. Croat. J. For. Eng. 2017, 38, 231–241. [Google Scholar]
  38. Results of the National Forest Inventory, Cycle II. Available online: https://roifn.ro/site/rezultate-ifn-2/ (accessed on 26 April 2024).
  39. Naghdi, R.; Solgi, A.; Zenner, E.K.; Najafi, A.; Salehi, A.; Nikooy, M. Compaction of forest soils with heavy logging machinery. Silva Balc. 2017, 18, 25–39. [Google Scholar]
  40. Wu, W.; Liu, H.-B. Estimation of soil pH with geochemical indices in forest soils. PLoS ONE 2019, 14, e0223764. [Google Scholar] [CrossRef]
  41. Lawesson, J.E. pH optima for Danish forest species compared with Ellenberg reaction values. Folia Geobot. 2003, 38, 403–418. [Google Scholar] [CrossRef]
  42. Loveland, P.J.; Whalley, W.R. Particle size analysis. In Soil Analysis: Physical Methods; Smith, K.A., Mullins, C.E., Eds.; Marcel Dekker: New York, NY, USA, 1991; pp. 271–328. [Google Scholar] [CrossRef]
  43. EN ISO 10693:2014; European Standard SR. Soil Quality—Determination of Carbonate Content. Volumetric Method Slovenian Institute for Standardization: Ljubljana, Slovenia, 2014. Available online: https://standards.iteh.ai/catalog/standards/sist/99b348a4-b022-4d66-be02-a6d916e6dfba/sist-en-iso-10693-2014 (accessed on 25 April 2024).
  44. STAS 1243/88; Teren de Fundare. Clasificarea si Identificarea Pamânturilor. ASRO: București, Romania, 2005. Available online: https://magazin.asro.ro/ro/standard/17929 (accessed on 25 April 2024).
  45. Royal Eijkelkamp Digital Penetrometers. 2024. Available online: https://www.royaleijkelkamp.com/media/mgwgnlga/penetrologger_e.pdf (accessed on 19 April 2024).
  46. Niţă, M.D.; Borz, S.A. Accuracy of a smartphone-based freeware solution and two shape reconstruction algorithms in log volume measurements. Comp. Elect. Agric. 2023, 205, 107653. [Google Scholar] [CrossRef]
  47. Fresh and Dried Density of Wood Per Species. Available online: https://www.rombadconstruct.ro/densitatea-lemnului-pe-specii.html (accessed on 21 April 2024).
  48. Shapiro, S.S.; Wilk, M.B. An analysis of variance test for normality (complete samples). Biometrika 1965, 52, 591–611. [Google Scholar] [CrossRef]
  49. Mann, H.B.; Whitney, D.R. On a test of whether one of two random variables is stochastically larger than the other. Ann. Math. Stat. 1947, 18, 50–60. [Google Scholar] [CrossRef]
  50. Laerd Statistics. Assumptions of the Mann Whitney Test. Available online: https://statistics.laerd.com/statistical-guides/mann-whitney-u-test-assumptions.php (accessed on 19 April 2024).
  51. Mann-Whitney Test for Independent Samples. Available online: https://real-statistics.com/non-parametric-tests/mann-whitney-test (accessed on 19 April 2024).
  52. Real Statistics for Excel. Available online: https://real-statistics.com/real-statistics-release-8-6/ (accessed on 19 April 2024).
  53. Lundbäck, M.; Häggström, C.; Nordfjell, T. Worldwide trends in methods for harvesting and extracting industrial roundwood. Int. J. For. Eng. 2021, 32, 202–215. [Google Scholar] [CrossRef]
  54. Borz, S.A.; Marcu, M.V.; Cataldo, M.F. Evaluation of an HSM 208F 14tone HVT-R2 forwarder prototype under conditions of steep-terrain low-access forests. Croat. J. For. Eng. 2021, 42, 185–200. [Google Scholar] [CrossRef]
  55. Sinnett, D.; Morgan, G.; Williams, M.; Hutchings, T.R. Soil penetration resistance and tree root development. Soil Use Manag. 2008, 24, 273–280. Available online: https://bsssjournals.onlinelibrary.wiley.com/doi/abs/10.1111/j.1475-2743.2008.00164.x (accessed on 22 April 2024). [CrossRef]
Figure 1. Study sites and description of the extraction means: (a)—location of the sites at national level, (b)—description of the extraction means, (c)—an example of preparing a sampling area, (d)—an example of the sampling area after a few passes, (e)—an example of soil sampling pit used to characterize the main properties of the soil in the sampling area. Note: graphical schemes used to describe the means shown in panel (b) are taken from the learning resources of the Technodiversity project [1].
Applsci 14 05117 g001
Figure 2. Main features of the testing areas: CP1 to CP10 stand for control sampling points that had the same location in all of the n testing areas, where n = 3 (H, F or S); SP1 to SP10 stand for sampling points on the skid trails and had the same location in all of the n testing areas, where n = 3 (H, F or S); g stands for a physical ground guiding mark; DT stands for the distance between the centers of the wheels’ footprints which depended on the extraction means used and increased in the order H, S, F; m stands for the means used for extraction, m = H, F or S; p stands for the number of passes counted until a measurement on penetration resistance was taken, p = 1, 2, 3, 4, 5, 10, 15.
Applsci 14 05117 g002
Figure 3. Variation in the mean (x), standard deviation (s) and coefficient of variation (cv) of the penetration resistance along the sampled soil depth, and absolute differences in the mean penetration resistance between the datasets: (a) Horse logging control dataset (CH); (b) Skidding control dataset (CS); (c) Forwarding control dataset (CF); (d) Absolute differences between the mean penetration resistance in natural soils between the sites of horse logging and skidding (ΔCH-CS), horse logging and forwarding (ΔCH-CF) and skidding and forwarding (ΔCS-CF).
Applsci 14 05117 g003
Figure 4. Differences (Δ) in the mean penetration resistance between the control (C) and measurements taken after the first (P1), second (P2), third (P3), fourth (P4), fifth (P5), tenth (P10) and fifteenth (P15) passes (left panels, (a,c,e)), and differences (Δ) in penetration resistance based on the measurements taken successively (right panels, (b,d,f)). Legend: H—horse logging, S—skidding, F—forwarding.
Applsci 14 05117 g004aApplsci 14 05117 g004b
Figure 5. Results of the comparison tests and the main descriptive statistics of the H datasets: (a) results of the comparison tests taking as a reference the control data on soil layer depths; (b) main descriptive statistics of the datasets used for comparison. Note: in panel (a) the effect size is indicated in the data labels along with three types of text formatting and a traffic light color coding in which the normal text indicates no difference, text given in italics indicates a significant difference, text given in bold italics indicates a significant difference where the median values estimated based on control were lower than those of the compared data, green indicates no differences, yellow indicates higher median values in control data and red indicates higher median values in the compared data; in panel (b) red dots stand for the outlier values found by the statistical software used. Legend: C—control, H—horse logging, P1 to P15—pass 1 to pass 15.
Applsci 14 05117 g005
Figure 6. Results of the comparison tests and the main descriptive statistics of the S datasets: (a) results of the comparison tests taking as a reference the control data on soil layer depths; (b) main descriptive statistics of the datasets used for comparison. Note: in panel (a) the effect size is indicated in the data labels along with three types of text formatting and a traffic light color coding in which the normal text indicates no difference, text given in italics indicates a significant difference, text given in bold italics indicates a significant difference where the median values estimated based on control were lower than those of the compared data, green indicates no differences, yellow indicates higher median values in control data and red indicates higher median values in the compared data; in panel (b) red dots stand for the outlier values found by the statistical software used. Legend: C—control, S—skidding, P1 to P15—pass 1 to pass 15.
Applsci 14 05117 g006
Figure 7. Results of the comparison tests and the main descriptive statistics of the F datasets: (a) results of the comparison tests taking as a reference the control data on soil layer depths; (b) main descriptive statistics of the datasets used for comparison. Note: in panel (a) the effect size is indicated in the data labels along with three types of text formatting and a traffic light color coding in which the normal text indicates no difference, text given in italics indicates a significant difference, text given in bold italics indicates a significant difference where the median values estimated based on control were lower than those of the compared data, green indicates no differences, yellow indicates higher median values in control data and red indicates higher median values in the compared data; in panel (b) red dots stand for the outlier values found by the statistical software used. Legend: C—control, F—forwarding, P1 to P15—pass 1 to pass 15.
Applsci 14 05117 g007
Table 1. Main properties of the soil samples.
Study SiteSoil Type 1Soil
Horizons
Main PropertiesGranulometry (%)
pHMC
(%)
Hy
(%)
CaCO3 (%)>0.2 mm
(Coarse Sand, %)
0.2–0.02 mm
(Fine Sand, %)
0.02–0.01 mm
(Coarse Silt, %)
0.01–0.0002 mm
(Fine Silt, %)
<0.0002 mm
(Clay, %)
HCambisolAo7.5638.357.582.03.1234.066.4721.0635.29
Bv7.6836.388.782.23.7030.297.1020.3338.58
C7.7430.458.403.44.0627.3510.9019.5938.10
C(R)7.8229.729.384.04.1427.5910.6118.6339.03
FCambisolAo4.6228.578.75-5.2333.623.5515.2042.40
Bvw4.8123.627.08-0.5132.5411.6520.4534.85
Bv5.3125.926.31-0.5235.0812.6519.7532.00
C5.3924.169.82-0.2525.157.8514.0052.75
SLuvisolAo5.3137.515.04-8.8533.9011.3017.0528.90
El5.6123.758.50-9.3431.569.6016.2533.25
Bt5.6521.018.66-5.5229.586.9013.8044.20
1 Classification according to the World Reference Base for Soil Resources. Note: for particle size analysis (granulometry) the International Standard STAS 1243/88 [44] and World Reference Base for Soil Resources (WRB) were used, MC stands for the moisture (water) content, Hy stands for hygroscopicity, CaCO3 stands for the content of carbonates.
Table 2. Main features of the initial datasets and codes used to abbreviate them in this study.
Extraction MeansType of DataNumber of Measurements TakenUsable Probe Depth (cm)Abbreviation of the Dataset
Horse Control1080HC
HorsePass #11080HP1
HorsePass #21080HP2
HorsePass #31080HP3
HorsePass #41080HP4
HorsePass #51080HP5
HorsePass #101080HP10
HorsePass #151080HP15
ForwarderControl1065FC
ForwarderPass #11080FP1
ForwarderPass #21080FP2
ForwarderPass #31080FP3
ForwarderPass #41080FP4
ForwarderPass #51080FP5
ForwarderPass #101080FP10
ForwarderPass #151080FP15
SkidderControl1080SC
SkidderPass #11080SP1
SkidderPass #21080SP2
SkidderPass #31080SP3
SkidderPass #41080SP4
SkidderPass #51080SP5
SkidderPass #101080SP10
SkidderPass #151080SP15
Disclaimer/Publisher’s Note: The statements, opinions and data contained in all publications are solely those of the individual author(s) and contributor(s) and not of MDPI and/or the editor(s). MDPI and/or the editor(s) disclaim responsibility for any injury to people or property resulting from any ideas, methods, instructions or products referred to in the content.

