
Quality of Winter Wheat Flour from Different Sowing and Nitrogen Management Strategies: A Case Study in Northeastern Poland

Abstract
:1. Introduction
2. Materials and Methods
2.1. Field Experiment
2.2. Flour Quality
2.3. Rheological Properties of Dough and Bread Quality
2.4. Weather Conditions
2.5. Statistical Analysis
3. Results
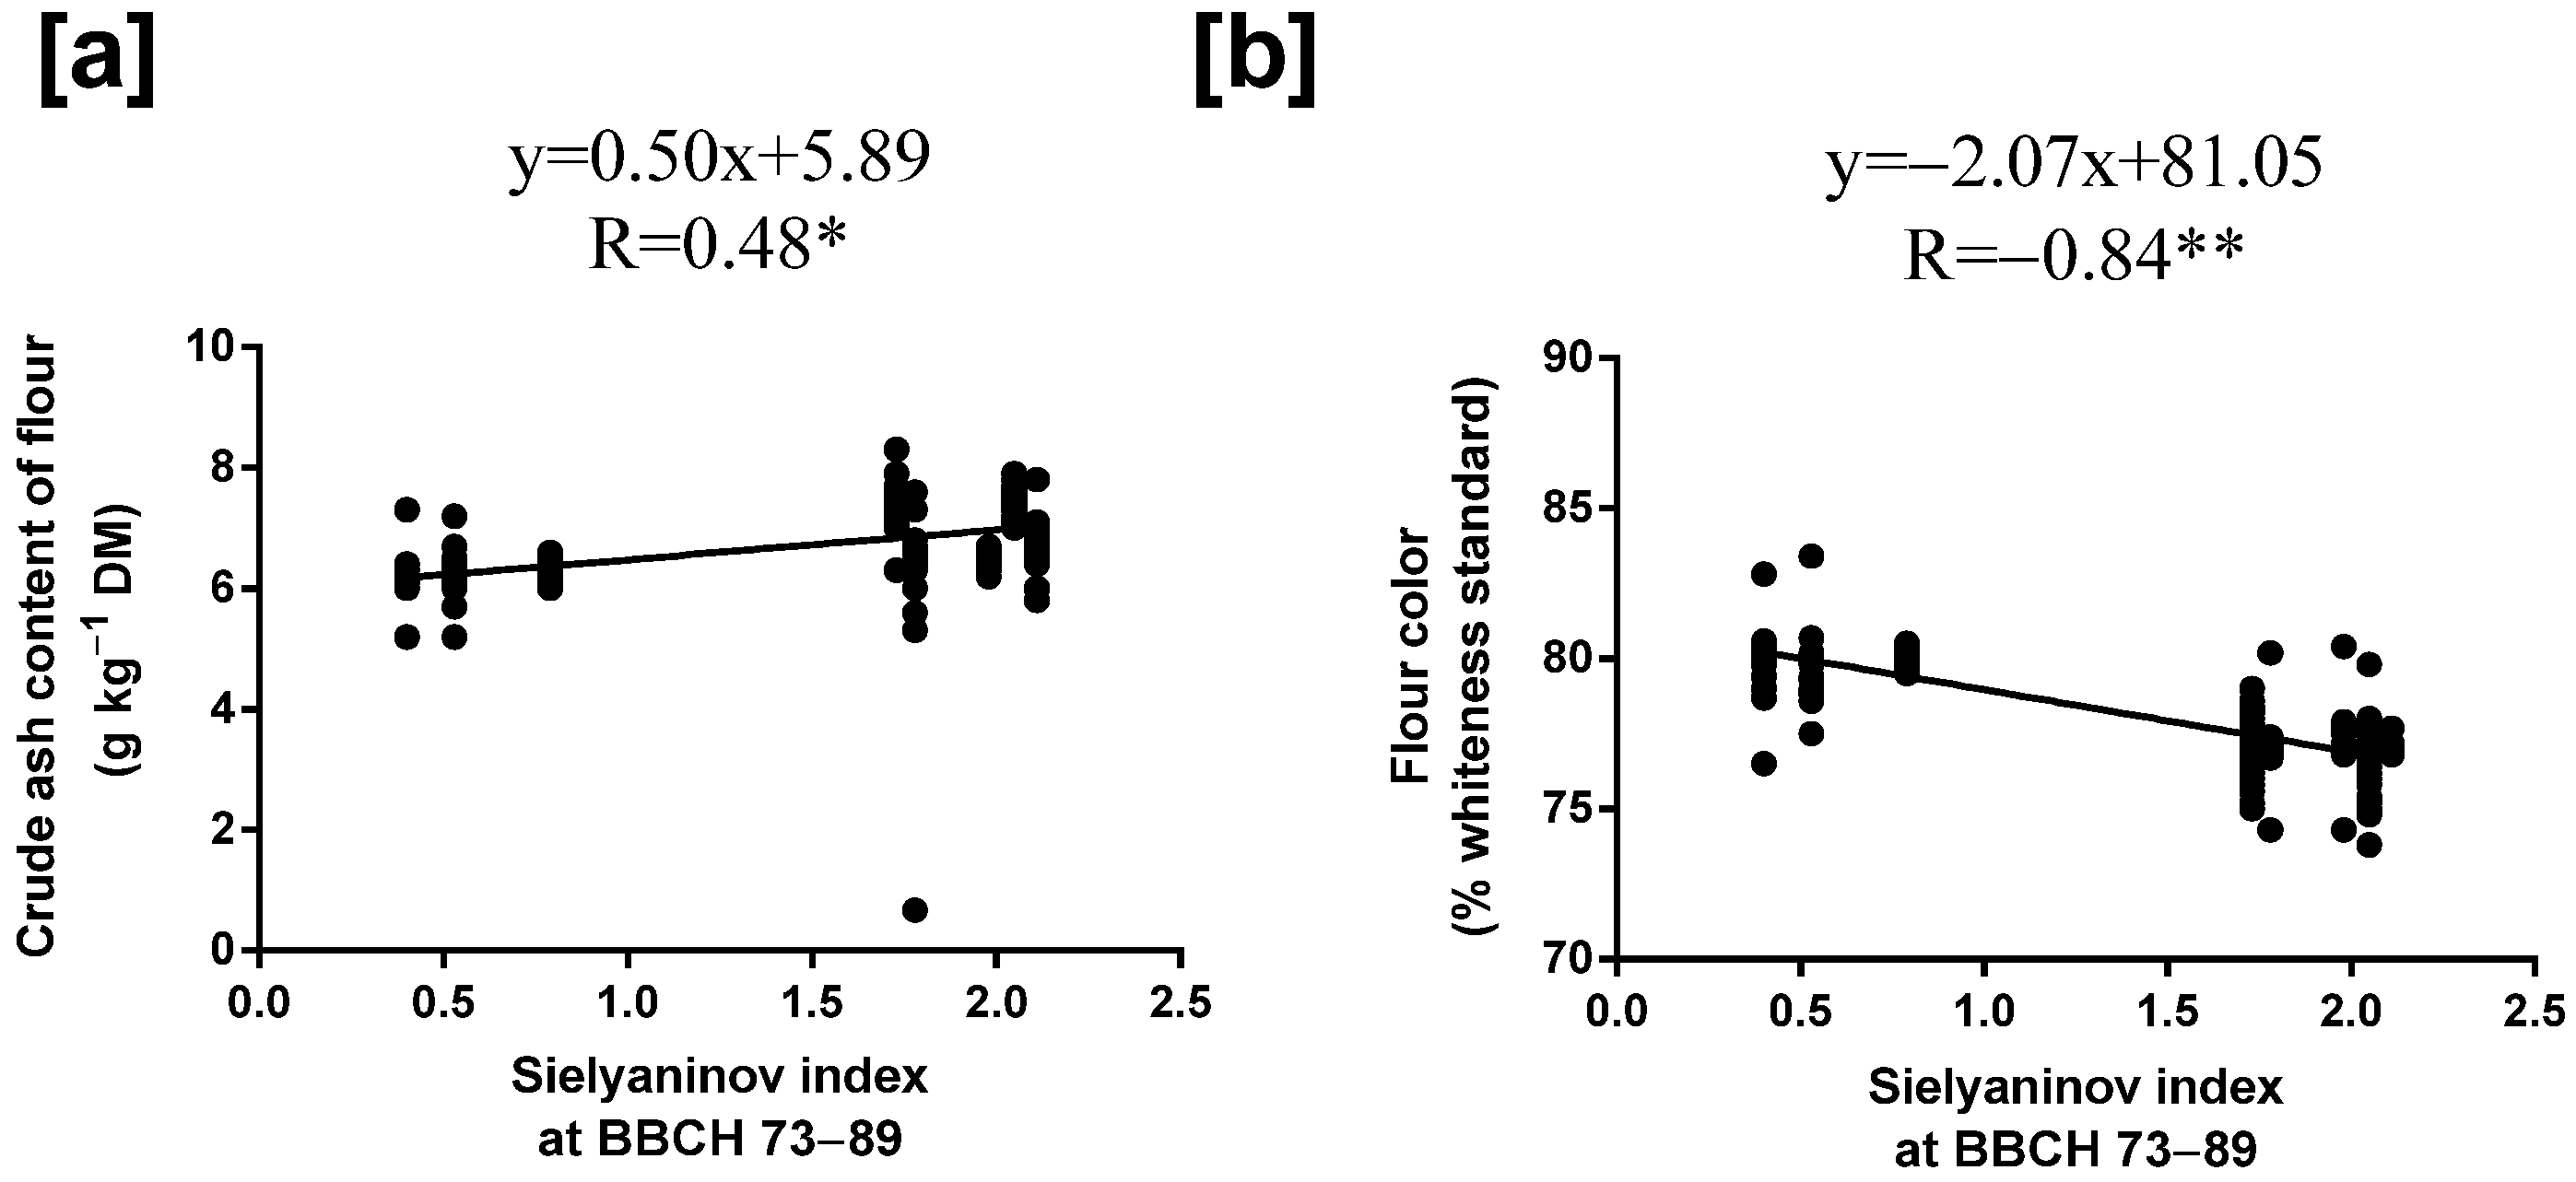
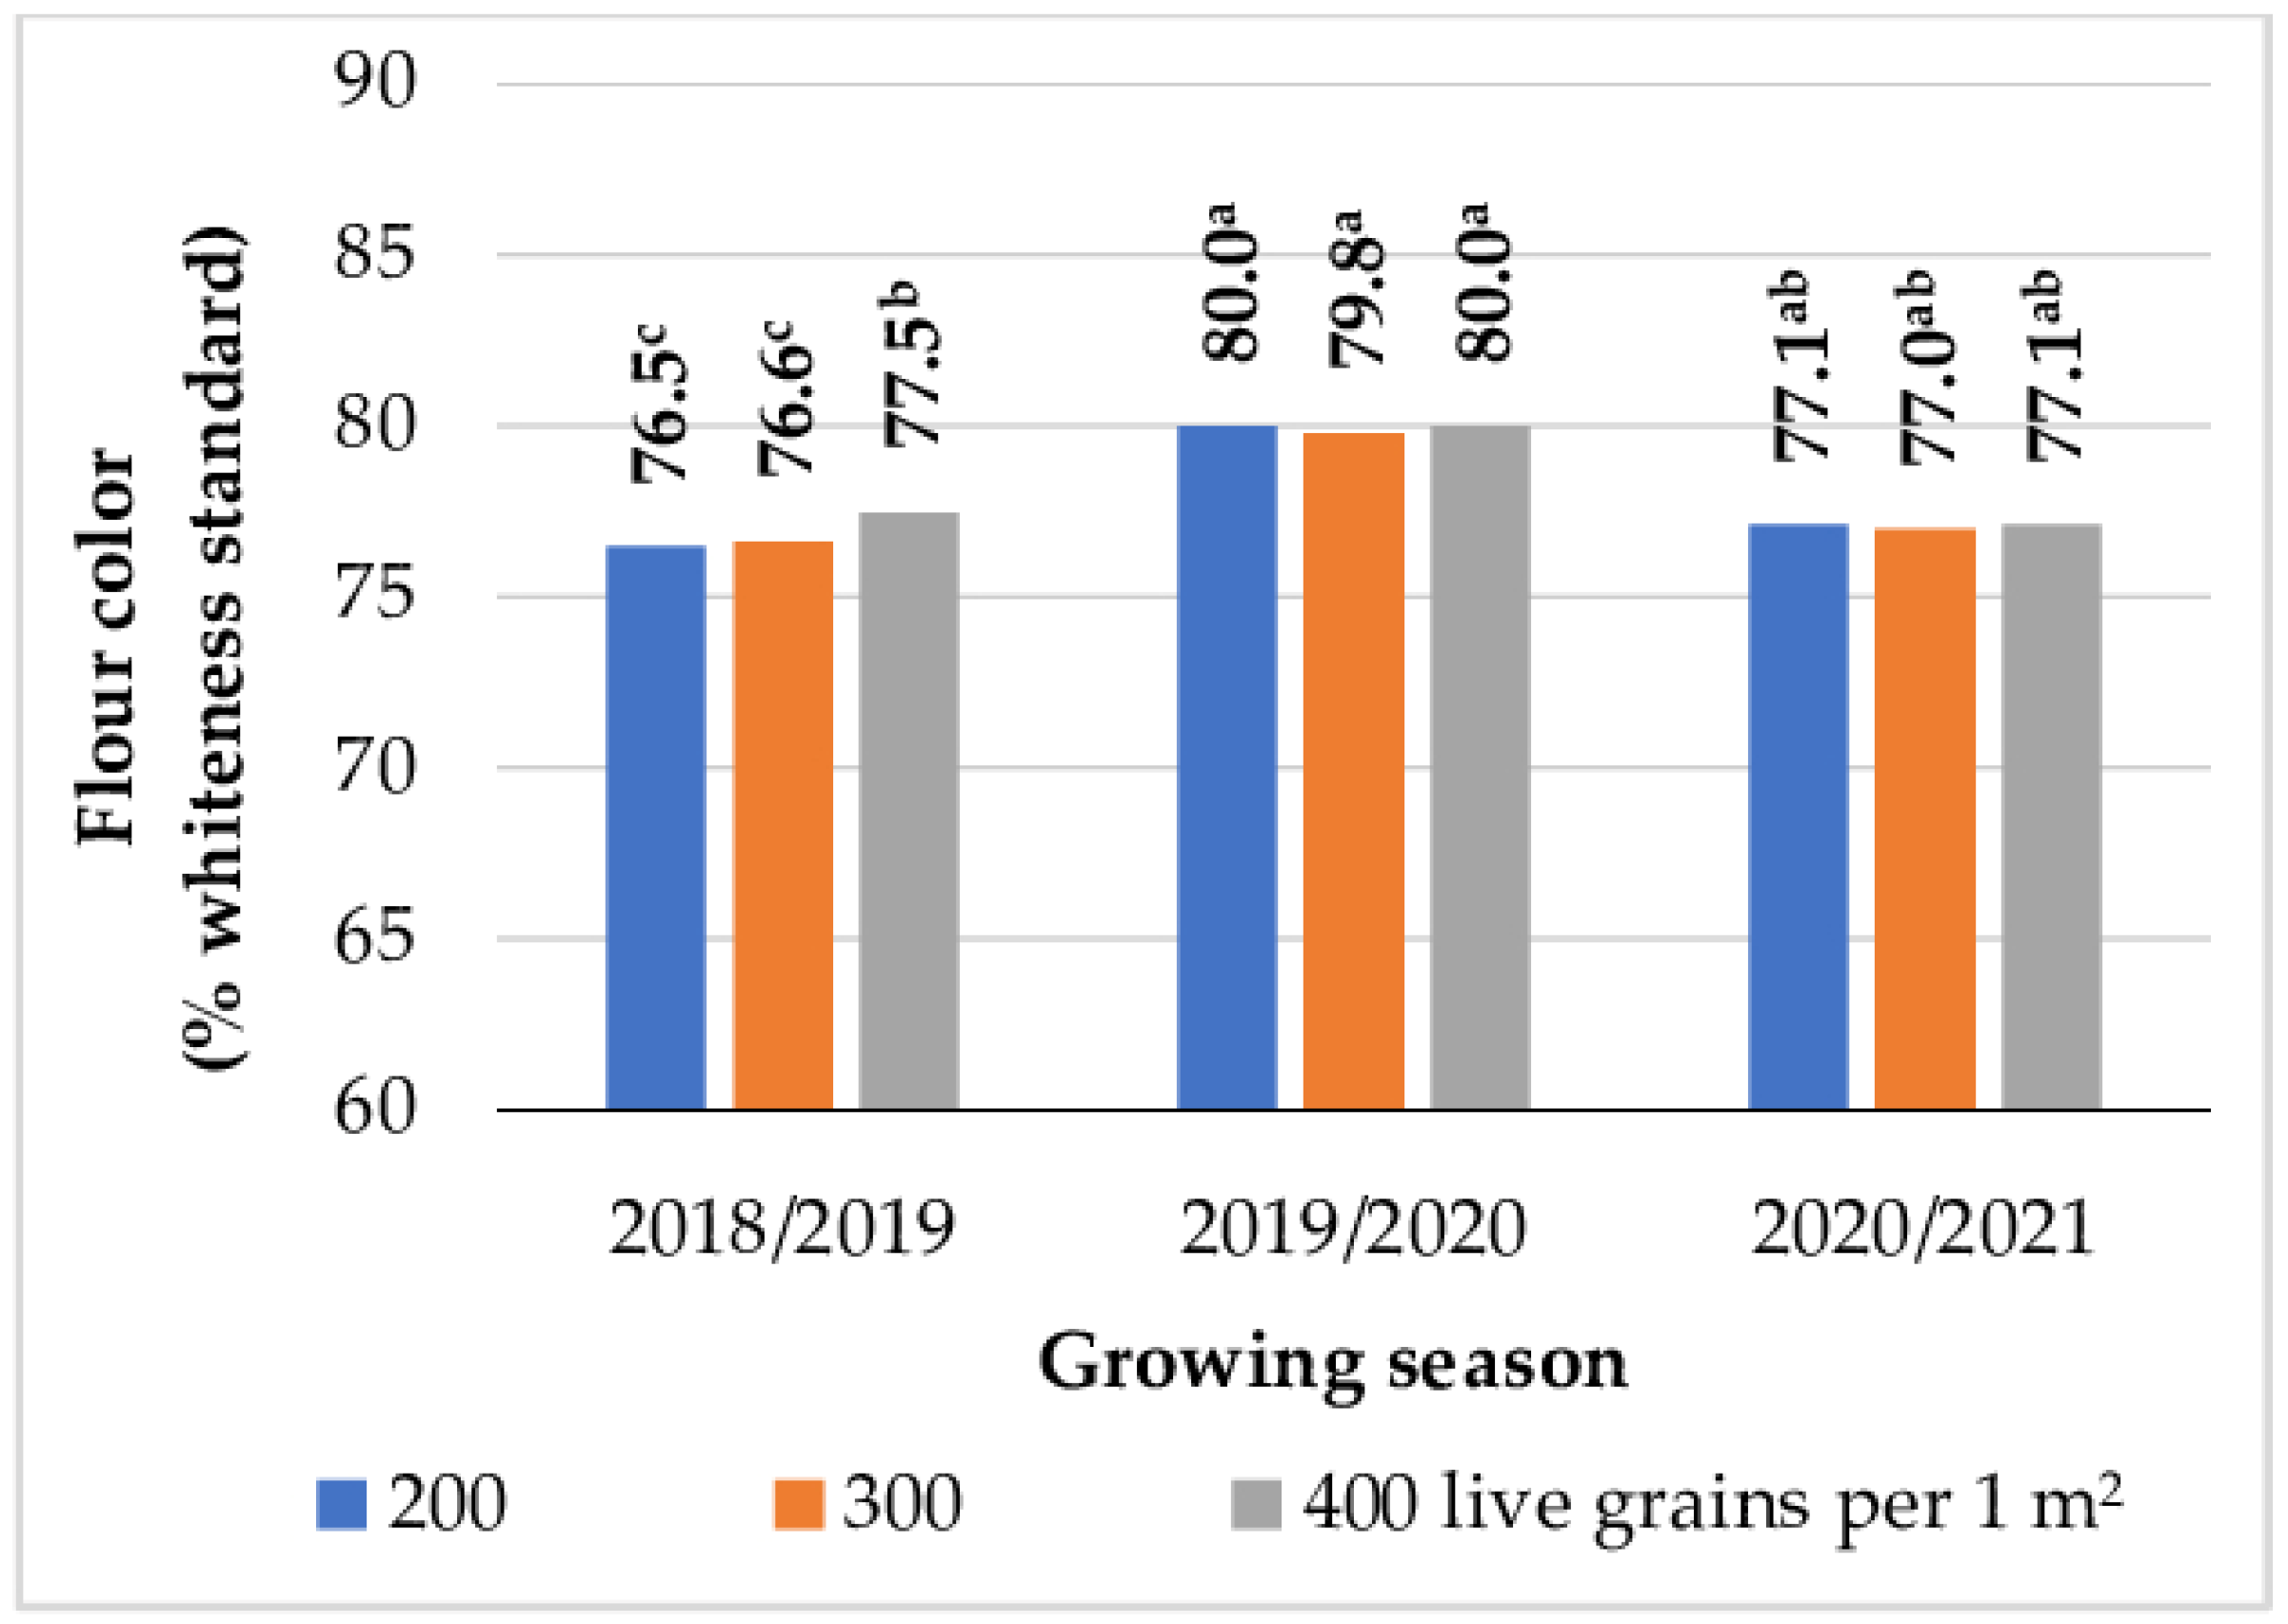
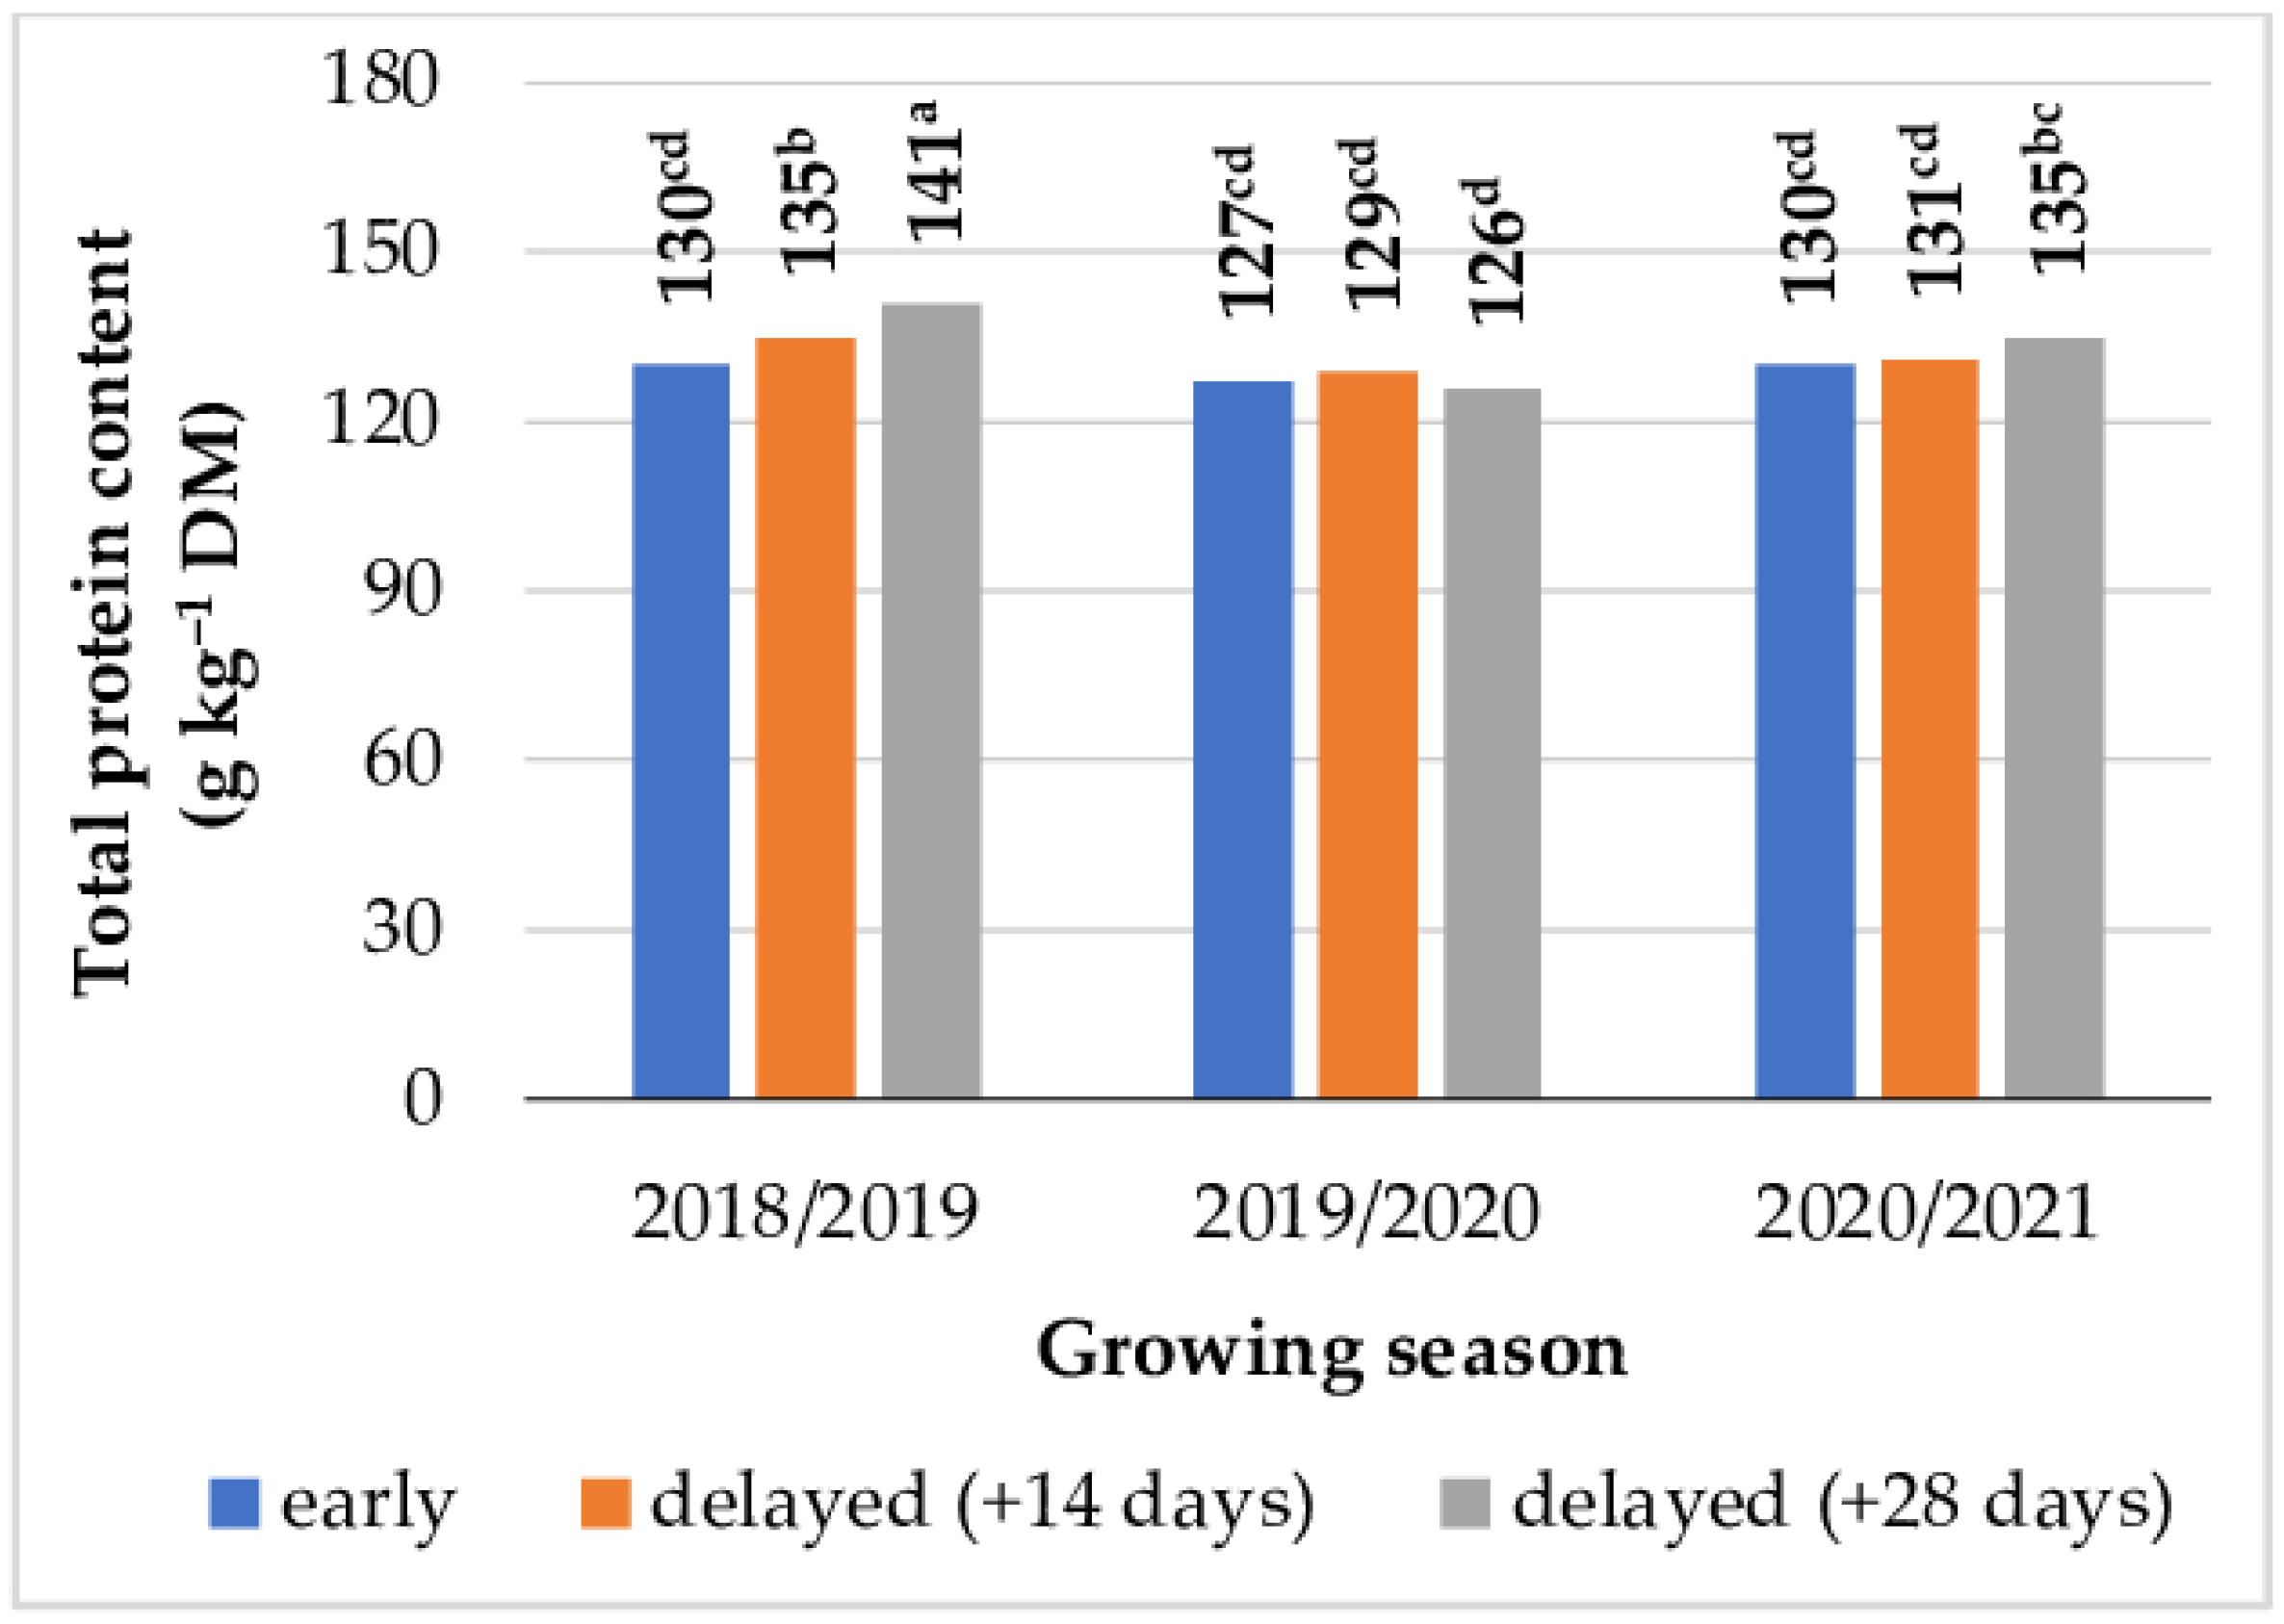
3.1. Flour Quality
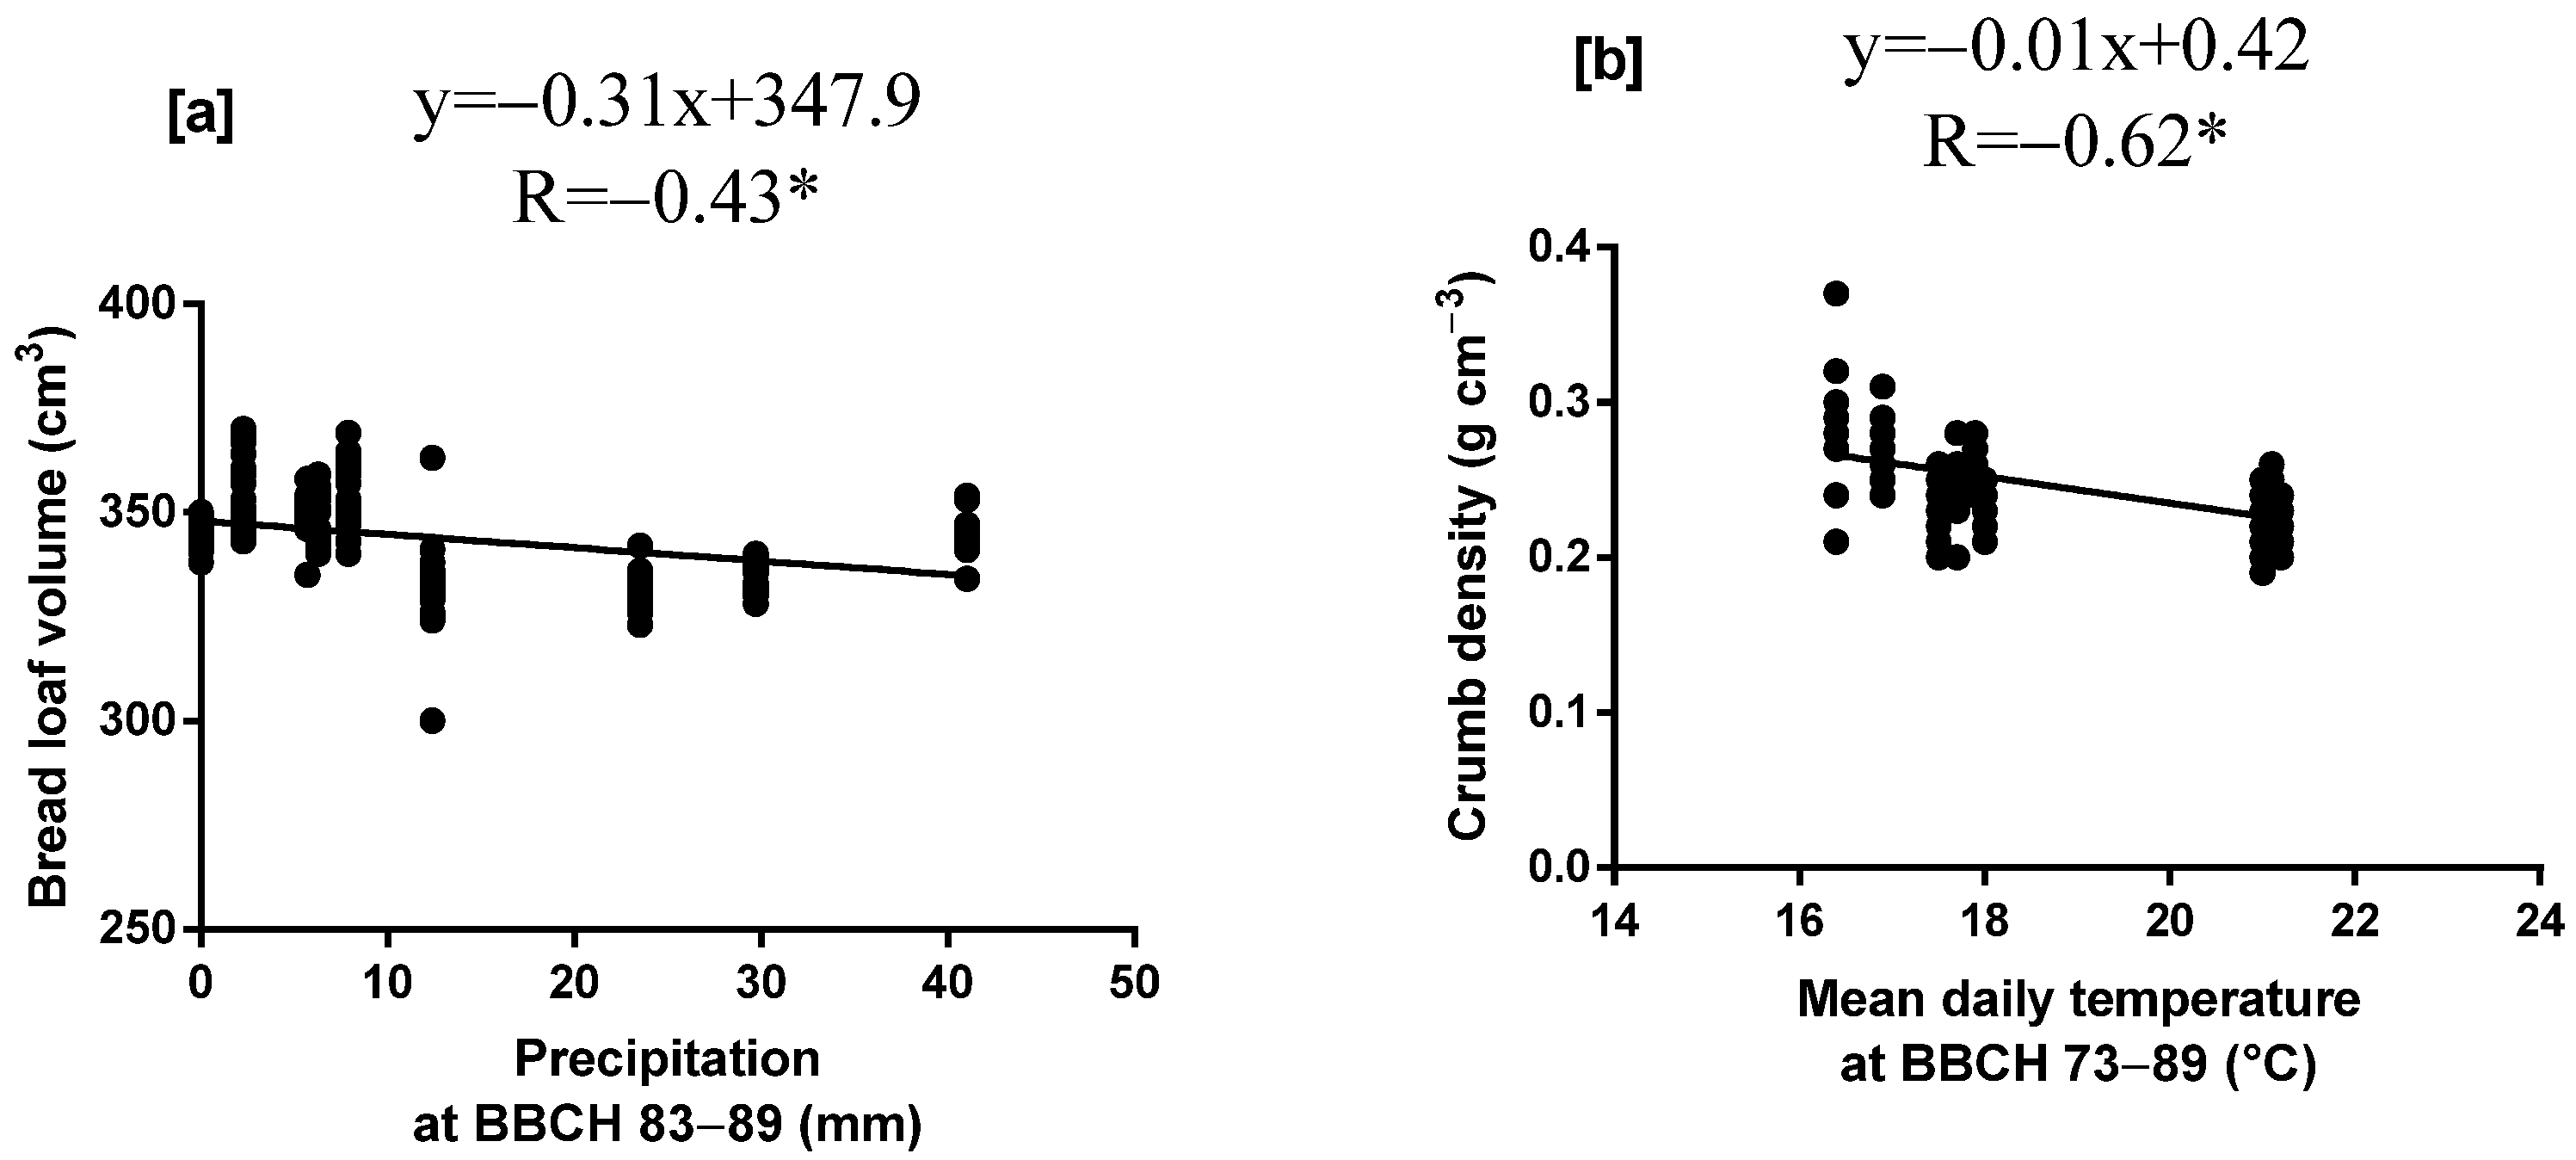
3.2. Rheological Properties of Dough and Bread Quality
4. Discussion
4.1. Flour Quality
4.2. Rheological Properties of Dough and Bread Quality
5. Conclusions
Supplementary Materials
Author Contributions
Funding
Institutional Review Board Statement
Informed Consent Statement
Data Availability Statement
Acknowledgments
Conflicts of Interest
References
- Godfray, H.C.J.; Beddington, J.R.; Crute, I.R.; Haddad, L.; Lawrence, D.; Muir, J.F.; Pretty, J.; Robinson, S.; Thomas, S.M.; Toulmin, C. Food security: The challenge of feeding 9 billion people. Science 2010, 327, 812–818. [Google Scholar] [CrossRef]
- Foley, J.A.; Ramankutty, N.; Brauman, K.A.; Cassidy, E.S.; Gerber, J.S.; Johnston, M.; Mueller, N.D.; O’Connell, C.; Ray, D.K.; West, P.C.; et al. Solutions for a cultivated planet. Nature 2011, 478, 337–342. [Google Scholar] [CrossRef]
- Ray, D.K.; Mueller, N.D.; West, P.C.; Foley, J.A. Yield trends are insufficient to double global crop production by 2050. PLoS ONE 2013, 8, e66428. [Google Scholar] [CrossRef]
- Fischer, E.M.; Sedláček, J.; Hawkins, E.; Knutti, R. Models agree on forced response pattern of precipitation and temperature extremes. Geophys. Res. Lett. 2014, 41, 8554–8562. [Google Scholar] [CrossRef]
- Islam, S.M.F.; Karim, Z. World’s demand for food and water: The consequences of climate change. In Desalination-Challenges and Opportunities; Farahani, M.H.D.A., Vatanpour, V., Taheri, A., Eds.; IntechOPen: London, UK, 2019; pp. 225–240. [Google Scholar]
- Shiferaw, B.; Smale, M.; Braun, H.J.; Duveiller, E.; Reynolds, M.; Muricho, G. Crops that feed the world 10. Past successes and future challenges to the role played by wheat in global food security. Food Secur. 2013, 5, 291–317. [Google Scholar] [CrossRef]
- Bernas, J.; Koppensteiner, L.J.; Tichá, M.; Kaul, H.P.; Klimek-Kopyra, A.; Euteneuer, P.; Moitzi, G.; Neugschwandtner, R.W. Optimal environmental design of nitrogen application rate for facultative wheat using life cycle assessment. Eur. J. Agron. 2023, 146, 126813. [Google Scholar] [CrossRef]
- Jaskulska, I.; Jaskulski, D.; Gałęzewski, L.; Knapowski, T.; Kozera, W.; Wacławowicz, R. Mineral composition and baking value of winter wheat grain under varied environmental and agronomic conditions. J. Chem. 2018, 2018, 5013825. [Google Scholar] [CrossRef]
- Jarecki, W.; Czernicka, M. Yield and quality of winter wheat (Triticum aestivum L.) depending on multi-component foliar fertilization. J. Elem. 2022, 27, 559–567. [Google Scholar] [CrossRef]
- Jarecki, W. Effects of sowing date variation on winter wheat (Tritium aestivum L.) quality and grain yield. J. Elem. 2023, 28, 1089–1100. [Google Scholar] [CrossRef]
- Šramková, Z.; Gregova, E.; Šturdik, E. Chemical composition and nutritional quality of wheat grain. Acta Chim. Slovaca 2009, 2, 115–138. [Google Scholar]
- Al-Saleh, A.; Brennan, C.S. Bread wheat quality: Some physical, chemical and rheological characteristics of Syrian and English bread wheat samples. Foods 2012, 1, 3–17. [Google Scholar] [CrossRef] [PubMed]
- Budzyński, W. Common wheat. In Wheats—Common, Spelt, Durum. Cultivation and Uses; Budzyński, W., Ed.; PWRiL: Poznań, Poland, 2012; 328p. (In Polish) [Google Scholar]
- Barak, S.; Mudgil, D.; Khatkar, B.S. Biochemical and functional properties of wheat gliadins: A review. Crit. Rev. Food Sci. Nutr. 2015, 55, 357–368. [Google Scholar] [CrossRef] [PubMed]
- Podolska, G.; Aleksandrowicz, E.; Szafrańska, A. Bread making potential of Triticum aestivum and Triticum spelta species. Open Life Sci. 2020, 15, 30–40. [Google Scholar] [CrossRef]
- Rothkaehl, J. Wheat grain for human consumption—Marketing and processing. In Wheats—Common, Spelt, Durum. Cultivation and Uses; Budzyński, W., Ed.; PWRiL: Poznań, Poland, 2012; pp. 235–264. (In Polish) [Google Scholar]
- Zhai, S.; Liu, J.; Xu, D.; Wen, W.; Yan, J.; Zhang, P.; Wan, Y.; Cao, S.; Hao, Y.; Xia, X. A Genome-wide association study reveals a rich genetic architecture of flour color-related traits in bread wheat. Front. Plant Sci. 2018, 9, 1136. [Google Scholar] [CrossRef] [PubMed]
- Rodrighero, M.B.; Caires, E.F.; Lopes, R.B.; Zielinski, A.A.; Granato, D.; Demiate, I.M. Wheat technological quality as affected by nitrogen fertilization under a no-till system. Acta Sci. Technol. 2015, 37, 175–181. [Google Scholar] [CrossRef]
- Yildirim, A.; Atasoy, A. Quality characteristics of some durum wheat varieties grown in the Southeastern Anatolia Region of Turkey (GAP). Harran J. Agric. Food Sci. 2020, 24, 420–431. [Google Scholar] [CrossRef]
- Wei, Y. Cereal and Food Quality; Shanxi People Press: Taiyuan, China, 2002. [Google Scholar]
- Kulkarni, S.D.; Acharya, R.; Nair, A.G.C.; Rajurkar, N.S.; Reddy, A.V.R. Determination of elemental concentration profiles in tender wheatgrass (Triticum aestivum L.) using instrumental neutron activation analysis. Food Chem. 2006, 95, 699–707. [Google Scholar] [CrossRef]
- Piironen, V.; Salmenkallio-Marttila, M. Micronutrients and phytochemicals in wheat grain. In Wheat: Chemistry and Technology; American Association of Cereal Chemists: St Paul, MN, USA, 2009; pp. 179–222. [Google Scholar]
- Czaja, T.; Sobota, A.; Szostak, R. Quantification of ash and moisture in wheat flour by Raman spectroscopy. Foods 2020, 9, 280. [Google Scholar] [CrossRef]
- Zhygunov, D.; Barkovska, Y.; Yehorshyn, Y.; Zhyhunova, H.; Barikian, K. Type 600 wheat-spelt, flour with improved bakery properties. Food Sci. Technol. 2020, 14, 53–62. [Google Scholar] [CrossRef]
- Li, Y.Q.; Zhu, R.J.; Tian, J.C. Influence of wheat protein contents and fractions on dough rheological properties as determined by using a reconstitution method. Agric. Sci. China 2008, 7, 395–404. [Google Scholar] [CrossRef]
- Trevisan, S.; Khorshidi, A.S.; Scanlon, M.G. Relationship between nitrogen functionality and wheat flour dough rheology: Extensional and shear approaches. Food Res. Int. 2022, 162, 112049. [Google Scholar] [CrossRef] [PubMed]
- Cichoń, Z.; Ptak, M. Analysis of the quality of selected wheat flour types. Zesz. Nauk. Akad. Ekon. Krakowie 2005, 678, 89–102. (In Polish) [Google Scholar]
- Simón, M.R.; Fleitas, M.C.; Castro, A.C.; Schierenbeck, M. How foliar fungal diseases affect nitrogen dynamics, milling, and end-use quality of wheat. Front. Plant Sci. 2020, 11, 569401. [Google Scholar] [CrossRef]
- Ellmann, T. Effect of plant protection, nitrogen fertilization and date of harvest on yield of winter wheat. Fragm. Agron. 2011, 28, 15–25. [Google Scholar]
- Fu, B.X.; Wang, K.; Dupuis, B. Predicting water absorption of wheat flour using high shear-based GlutoPeak test. J. Cereal Sci. 2017, 76, 116–121. [Google Scholar] [CrossRef]
- Puhr, D.P.; D’appolonia, B.L. Effect of baking absorption on bread yield, crumb moisture, and crumb water activity. Cereal Chem. 1992, 69, 582. [Google Scholar]
- Guttieri, M.J.; Bowen, D.; Gannon, D.; O’Brien, K.; Souza, E. Solvent retention capacities of irrigated soft white spring wheat flours. Crop Sci. 2001, 41, 1054–1061. [Google Scholar] [CrossRef]
- Li, J.; Zhu, Y.; Yadav, M.P.; Li, J. Effect of various hydrocolloids on the physical and fermentation properties of dough. Food Chem. 2019, 271, 165–173. [Google Scholar] [CrossRef]
- Marchetti, L.; Cardós, M.; Campaña, L.; Ferrero, C. Effect of glutens of different quality on dough characteristics and breadmaking performance. LWT-Food Sci. Technol. 2012, 46, 224–231. [Google Scholar] [CrossRef]
- Amjid, M.R.; Shehzad, A.; Hussain, S.; Shabbir, M.A.; Khan, M.R.; Shoaib, M. A comprehensive review on wheat flour dough rheology. Pak. J. Food Sci. 2013, 23, 105–123. [Google Scholar]
- Aydoğan, S.; Şahin, M.; Akçacık, A. Relationships between farinograph parameters and bread volume, physicochemical traits in bread wheat flours. Crop Sci. 2015, 3, 14–18. [Google Scholar]
- Menkinoska, M.; Blazhevska, T.; Stamatovsk, V. Determination of rheological properties with farinograf and extensigraf of bio-fortified flour. Proc. Univ. Ruse 2018, 57, 22–25. [Google Scholar]
- Różyło, R.; Laskowski, J.; Dziki, D. Physical properties of wheat bread baked from dough with different parameters. Acta Agrophys. 2011, 18, 421–430. (In Polish) [Google Scholar]
- Dziki, D.; Siastała, M.; Laskowski, J. Changes in physical properties of wheat bread as a result of soy flour addition. Acta Agrophys. 2010, 15, 91–100. (In Polish) [Google Scholar]
- Sahi, S.S.; Little, K.; Ananingsih, V.K. Quality control. In Bakery Products Science and Technology; John Wiley & Sons, Ltd.: Chichester, UK, 2014; pp. 489–509. [Google Scholar]
- Švec, I.; Hrušková, M. Modelling of wheat, flour, and bread quality parameters. Sci. Agric. Bohem. 2009, 40, 58–66. [Google Scholar]
- Muste, S.; Modoran, C.; Man, S.; Mureşan, V.; Birou, A. The influence of wheat genotype on its quality. J. Agroaliment. Process. Technol. 2010, 16, 99–103. [Google Scholar]
- Jankowski, K.J.; Budzyński, W.S.; Kijewski, Ł.; Dubis, D.; Lemański, M. Flour quality, the rheological properties of dough and the quality of bread made from the grain of winter wheat grown in a continuous cropping system. Acta Sci. Pol. Agric. 2014, 13, 3–18. [Google Scholar]
- Jankowski, K.J.; Kijewski, L.; Dubis, B. Milling quality and flour strength of the grain of winter wheat grown in monoculture. Rom. Agric. Res. 2015, 32, 191–200. [Google Scholar]
- Szafrańska, A.; Cacak-Pietrzak, G.; Sułek, A. Influence of nitrogen fertilization and retardants on the baking value of winter wheat. Electron. J. Pol. Agric. Univ. EJPAU Agron. 2008, 11, 28. [Google Scholar]
- Sułek, A.; Cacak-Pietrzak, G.; Wyzinska, M.; Nieróbca, A. influence of nitrogen fertilization on the yields and grain quality of winter wheat under different environmental conditions. Int. J. Agric. Biol. Eng. 2019, 13, 127–133. [Google Scholar]
- Geisslitz, S.; Longin, C.F.H.; Scherf, K.A.; Koehler, P. Comparative study on gluten protein composition of ancient (einkorn, emmer and spelt) and modern wheat species (durum and common wheat). Foods 2019, 8, 409. [Google Scholar] [CrossRef] [PubMed]
- Andersson, A.; Johansson, E.; Oscarson, P. Nitrogen redistribution from the roots in post-anthesis plants of spring wheat. Plant Soil 2005, 269, 321–332. [Google Scholar] [CrossRef]
- Andersson, A.; Johansson, E. Nitrogen partitioning in entire plants of different spring wheat cultivars. J. Agron. Crop Sci. 2006, 192, 121–131. [Google Scholar] [CrossRef]
- Stankowski, S.; Rutkowska, A. Winter wheat grain and flour quality traits as affected by the nitrogen fertilization dose and date. Acta Sci. Pol. Agric. 2006, 5, 53–61. (In Polish) [Google Scholar]
- Rozbicki, J.; Ceglińska, A.; Gozdowski, D.; Jakubczak, M.; Cacak-Pietrzak, G.; Mądry, W.; Golba, J.; Piechociński, M.; Sobczyński, M.; Studnicki, M.; et al. Influence of the cultivar, environment and management on the grain yield and bread-making quality in winter wheat. J. Cereal Sci. 2015, 61, 126–132. [Google Scholar] [CrossRef]
- Warechowska, M.; Stępień, A.; Wojtkowiak, K.; Nawrocka, A. The impact of nitrogen fertilization strategies on selected qualitative parameters of spring wheat grain and flour. Pol. J. Nat. Sci. 2019, 34, 199–212. [Google Scholar]
- Souza, E.J.; Martin, J.M.; Guttieri, M.J.; O’brien, K.M.; Habernicht, D.K.; Lanning, S.P.; McLean, R.; Carlson, G.R.; Talbert, L.E. Influence of genotype, environment, and nitrogen management on spring wheat quality. Crop Sci. 2004, 44, 425–432. [Google Scholar] [CrossRef]
- Dennett, A.L.; Trethowan, R.M. Milling efficiency of triticale grain for commercial flour production. J. Cereal Sci. 2013, 57, 527–530. [Google Scholar] [CrossRef]
- Joubert, M.; Lullien-Pellerin, V.; Morel, M.H. Impact of durum wheat grain composition on semolina yield and pasta quality. In Proceedings of the 15th European Young Cereal Scientists and Technologists Workshop (EYCSTW), Milan/Bergamo, Italy, 26 April 2016. [Google Scholar]
- Souza, T.M.; Prando, A.M.; de Miranda, M.Z.; Hirooka, E.Y.; Zucareli, C. Kernel chemical composition and flour quality of wheat in response to nitrogen sources and doses. Rev. Agrar. 2019, 12, 528–541. [Google Scholar] [CrossRef]
- Siddiqi, R.A.; Singh, T.P.; Rani, M.; Sogi, D.S.; Bhat, M.A. Diversity in grain, flour, amino acid composition, protein profiling, and proportion of total flour proteins of different wheat cultivars of North India. Front. Nutr. 2020, 7, 141. [Google Scholar] [CrossRef]
- Banach, J.K.; Majewska, K.; Żuk-Gołaszewska, K. Effect of cultivation system on quality changes in durum wheat grain and flour produced in North-Eastern Europe. PLoS ONE 2021, 16, e0236617. [Google Scholar] [CrossRef] [PubMed]
- Hong, S.; Park, J.; Lee, G.E.; Yoon, Y.M.; Kang, C.S.; Park, C.S. Effects of nitrogen fertilization on o-free, Korean wheat cultivar reduced ω-5 gliadin, on agronomic traits and noodle properties. Korean Soc. Breed. Sci. 2023, 55, 126–136. [Google Scholar] [CrossRef]
- Saint Pierre, C.; Peterson, C.J.; Ross, A.S.; Ohm, J.B.; Verhoeven, M.C.; Larson, M.; Hoefer, B. White wheat grain quality changes with genotype, nitrogen fertilization, and water stress. Agron. J. 2008, 100, 414–420. [Google Scholar] [CrossRef]
- Valdés Valdés, C.; Estrada-Campuzano, G.; Martinez Rueda, C.G.; Domínguez López, A.; Solis-Moya, E.; Villanueva Carvajal, A. Grain and flour wheat quality modified by genotype, availability of nitrogen, and growing season. Int. J. Agron. 2020, 2020, 1974083. [Google Scholar] [CrossRef]
- Keres, I.; Alaru, M.; Koppel, R.; Altosaar, I.; Tosens, T.; Loit, E. The combined effect of nitrogen treatment and weather conditions on wheat protein-starch interaction and dough quality. Agriculture 2021, 11, 1232. [Google Scholar] [CrossRef]
- Majewska, K. Classification and synthesis of wheat grain gluten proteins. Żyw. Nauk. Technol. Jakość 1999, 6, 15–25. (In Polish) [Google Scholar]
- Blandino, M.; Marinaccio, F.; Reyneri, A. Effect of late-season nitrogen fertilization on grain yield and on flour rheological quality and stability in common wheat, under different production situations. Ital. J. Agron. 2016, 11, 107–113. [Google Scholar] [CrossRef]
- Xue, C.; Matros, A.; Mock, H.P.; Mühling, K.H. Protein composition and baking quality of wheat flour as affected by split nitrogen application. Front. Plant Sci. 2019, 10, 642. [Google Scholar] [CrossRef]
- Guerrini, L.; Napoli, M.; Mancini, M.; Masella, P.; Cappelli, A.; Parenti, A.; Orlandini, S. Wheat grain composition, dough rheology, and bread quality as affected by nitrogen and sulfur fertilization and seeding density. Agronomy 2020, 10, 233. [Google Scholar] [CrossRef]
- Jańczak-Pieniążek, M.; Buczek, J.; Jarecki, W.; Bobrecka-Jamro, D. Effect of high nitrogen doses on yield, quality, and chemical composition of grain of winter wheat cultivars. J. Elem. 2020, 25, 1005–1017. [Google Scholar]
- Cesevičienė, J.; Gorash, A.; Liatukas, Ž.; Armonienė, R.; Ruzgas, V.; Statkevičiūtė, G.; Jaškūnė, K.; Brazauskas, G. Grain yield performance and quality characteristics of waxy and non-waxy winter wheat cultivars under high and low-input farming systems. Plants 2022, 11, 882. [Google Scholar] [CrossRef]
- Zende, N.B.; Sethi, H.N.; Karunakar, A.P.; Jiotode, D.J. Effect of sowing time and fertility levels on yield and quality of durum wheat genotypes. Res. Crops 2005, 6, 194–196. [Google Scholar]
- Otteson, B.N.; Mergoum, M.; Ransom, J.K. Seeding rate and nitrogen management on milling and baking quality of hard red spring wheat genotypes. Crop Sci. 2008, 48, 749–755. [Google Scholar] [CrossRef]
- Caglar, O.; Bulut, S.; Karaoglu, M.M.; Kotancilar, H.G.; Ozturk, A. Quality response of facultative wheat to winter sowing, freezing sowing and spring sowing at different seeding rates. J. Anim. Vet. Adv. 2011, 10, 3368–3374. [Google Scholar] [CrossRef]
- Zecevic, V.; Boskovic, J.; Knezevic, D.; Micanovic, D. Effect of seeding rate on grain quality of winter wheat. Chil. J. Agric. Res. 2014, 74, 23–28. [Google Scholar] [CrossRef]
- Soofizada, Q.; Pescatore, A.; Guerrini, L.; Fabbri, C.; Mancini, M.; Orlandini, S.; Napoli, M. Effects of nitrogen plus sulfur fertilization and seeding density on yield, rheological parameters, and asparagine content in old varieties of common wheat (Triticum aestivum L.). Agronomy 2022, 12, 351. [Google Scholar] [CrossRef]
- Wilcox, J.; Makowski, D. A meta-analysis of the predicted effects of climate change on wheat yields using simulation studies. Field Crops Res. 2014, 156, 180–190. [Google Scholar] [CrossRef]
- Pakrooh, P.; Kamal, M.A. Modeling the potential impacts of climate change on wheat yield in Iran: Evidence from national and provincial data analysis. Ecol. Model. 2023, 486, 110513. [Google Scholar] [CrossRef]
- Farooq, A.; Farooq, N.; Akbar, H.; Hassan, Z.U.; Gheewala, S.H. A critical review of climate change impact at a global scale on cereal crop production. Agronomy 2023, 13, 162. [Google Scholar] [CrossRef]
- Zahra, N.; Hafeez, M.B.; Wahid, A.; Al Masruri, M.H.; Ullah, A.; Siddique, K.H.; Farooq, M. Impact of climate change on wheat grain composition and quality. J. Sci. Food Agric. 2023, 103, 2745–2751. [Google Scholar] [CrossRef]
- Nóia Júnior, R.d.S.; Deswarte, J.-C.; Cohan, J.-P.; Martre, P.; van Der Velde, M.; Lecerf, R.; Webber, H.; Ewert, F.; Ruane, A.C.; Slafer, G.A.; et al. The extreme 2016 wheat yield failure in France. Glob. Chang. Biol. 2023, 29, 3130–3146. [Google Scholar] [CrossRef] [PubMed]
- Ainsworth, E.A.; Ort, D.R. How do we improve crop production in a warming world? Plant Physiol. 2010, 154, 526–530. [Google Scholar] [CrossRef] [PubMed]
- Xiao, D.; Tao, F.; Liu, Y.; Shi, W.; Wang, M.; Liu, F.; Shuai, Z.; Zhu, Z. Observed changes in winter wheat phenology in the North China Plain for 1981–2009. Int. J. Biometeorol. 2013, 57, 275–285. [Google Scholar] [CrossRef] [PubMed]
- Xiao, D.; Moiwo, J.P.; Tao, F.; Yang, Y.; Shen, Y.; Xu, Q.; Liu, J.; Liu, F. Spatiotemporal variability of winter wheat phenology in response to weather and climate variability in China. Mitig. Adapt. Strateg. Glob. Chang. 2015, 20, 1191–1202. [Google Scholar] [CrossRef]
- Kusunose, Y.; Rossi, J.J.; van Sanford, D.A.; Alderman, F.D.; Anderson, J.A.; Chai, Y.; Gerullis, M.K.; Jagadish, S.V.K.; Paul, P.A.; Tack, S.B.; et al. Sustaining productivity gains in the face of climate change: A research agenda for US wheat. Glob. Chang. Biol. 2023, 29, 926–934. [Google Scholar] [CrossRef]
- Qiao, S.; Harrison, S.P.; Prentice, I.C.; Wang, H. Optimality-based modelling of wheat sowing dates globally. Agric. Syst. 2023, 206, 103608. [Google Scholar] [CrossRef]
- Alignan, M.; Roche, J.; Bouniols, A.; Cerny, M.; Mouloungui, Z.; Merah, O. Effects of genotype and sowing date on phytostanol–phytosterol content and agronomic traits in wheat under organic agriculture. Food Chem. 2009, 117, 219–225. [Google Scholar] [CrossRef]
- Ahmed, M.; Hassan, F. Response of spring wheat (Triticum aestivum L.) quality traits and yield to sowing date. PLoS ONE 2015, 10, e0126097. [Google Scholar] [PubMed]
- Guzmán, C.; Autrique, J.E.; Mondal, S.; Singh, R.P.; Govindan, V.; Morales-Dorantes, A.; Posadas-Romano, G.; Crossa, J.; Ammar, K.; Peña, R.J. Response to drought and heat stress on wheat quality, with special emphasis on bread-making quality, in durum wheat. Field Crops Res. 2016, 186, 157–165. [Google Scholar] [CrossRef]
- Tahir, I.S.; Nakata, N.; Ali, A.M.; Mustafa, H.M.; Saad, A.S.I.; Takata, K.; Ishikawa, N.; Abdalla, O.S. Genotypic and temperature effects on wheat grain yield and quality in a hot irrigated environment. Plant Breed. 2006, 125, 323–330. [Google Scholar] [CrossRef]
- Li, Y.F.; Wu, Y.; Hernandez-Espinosa, N.; Peña, R.J. Heat and drought stress on durum wheat: Responses of genotypes, yield, and quality parameters. J. Cereal Sci. 2013, 57, 398–404. [Google Scholar] [CrossRef]
- Johansson, E.; Kuktaite, R.; Andersson, A.; Prieto-Linde, M.L. Protein polymer build-up during wheat grain development: Influences of temperature and nitrogen timing. J. Sci. Food Agric. 2005, 85, 473–479. [Google Scholar] [CrossRef]
- Labuschagne, M.T.; Elago, O.; Koen, E. The influence of temperature extremes on some quality and starch characteristics in bread, biscuit and durum wheat. J. Cereal Sci. 2009, 9, 84–189. [Google Scholar] [CrossRef]
- Hrušková, M.; Švec, I. Wheat hardness in relation to other quality factors. Czech J. Food Sci. 2009, 27, 240–248. [Google Scholar] [CrossRef]
- Knapowski, T.; Ropińska, P.; Kazek, M.; Wenda-Piesik, A. Flour and bread quality of spring wheat cultivars (Triticum aestivum L.) sown at facultative and spring sowing dates. Acta Sci. Pol. Agric. 2018, 17, 133–142. [Google Scholar]
- Dong, S.; Zhang, X.; Chu, J.; Zheng, F.; Fei, L.; Dai, X.; He, M. Optimized seeding rate and nitrogen topdressing ratio for simultaneous improvement of grain yield and bread-making quality in bread wheat sown on different dates. J. Sci. Food Agric. 2021, 102, 360–369. [Google Scholar] [CrossRef]
- Lachutta, K.; Jankowski, K.J. An agronomic efficiency analysis of winter wheat at different sowing strategies and nitrogen fertilizer rates: A case study in northeastern Poland. Agriculture 2024, 14, 442. [Google Scholar] [CrossRef]
- Lachutta, K.; Jankowski, K.J. The quality of winter wheat grain at different sowing strategies and nitrogen fertilizer rates: A case study in northeastern Poland. Agriculture 2024, 14, 552. [Google Scholar] [CrossRef]
- PN-EN ISO 5530-1:2015-01; Wheat Flour—Physical Characteristics of Doughs. Part 1. Determination of Water Absorption and Rheological Properties Using a Farinograph. Polish Committee for Standardization: Warszawa, Poland, 2015. (In Polish)
- Klockiewicz-Kamińska, E.; Brzeziński, W.J. Method of evaluation and quality-based classification of cultivars. Wiadomości Odmianozn. 1997, 67, 3–18. (In Polish) [Google Scholar]
- TIBCO Software Inc. Statistica (Data Analysis Software System), Version 13; TIBCO Software Inc.: Palo Alto, CA, USA, 2017. [Google Scholar]
- Ozturk, A.; Aydin, F. Effect of water stress at various growth stages on some quality characteristics of winter wheat. J. Agron. Crop Sci. 2004, 190, 93–99. [Google Scholar] [CrossRef]
- Egesel, C.O.; Kahriman, F.S.T.L.; Baytekin, H. Interrelationships of flour quality traits with grain yield in bread wheat and choosing suitable cultivars. Anadolu J. Agric. Sci. 2009, 24, 76–83. [Google Scholar]
- Adeel, M.; Nazir, A.; Aziz, H. Impact of sowing dates and terminal heat stress on wheat grain flour physical and chemical properties. Jammu Kashmir J. Agric. 2022, 2, 25–34. [Google Scholar] [CrossRef]
- Garrido-Lestache, E.; López-Bellido, R.J.; López-Bellido, L. Effect of N rate, timing, and splitting and N type on bread-making quality in hard red spring wheat under rainfed Mediterranean conditions. Field Crops Res. 2004, 85, 213–236. [Google Scholar] [CrossRef]
- Munsif, F.; Arif, M.; Ali, K.; Jan, M.T.; Khan, M.J. Influence of planting dates on grain quality of different wheat cultivars in dual-purpose system. Int. J. Agric. Biol. 2015, 17, 945–952. [Google Scholar] [CrossRef]
- Biel, W.; Stankowski, S.; Sobolewska, M.; Sadkiewicz, J.; Jaroszewska, A.; Pużyński, S. Effect of selected agronomic factors on the baking quality of winter spelt strains and cultivars (Triticum aestivum ssp. spelta L.) in comparison with common wheat (Triticum aestivum ssp. vulgare). Rom. Agric. Res. 2016, 33, 251–258. [Google Scholar]
- Caglar, O.; Yildiz, G.; Karaoglu, M.M.; Ozturk, A.; Bulut, S. The effects of sowing times and seeding rates on the farinograph parameters and color of facultative kirik wheat. Fresenius Environ. Bull. 2023, 32, 2918–2924. [Google Scholar]
- Wieser, H. Chemistry of gluten proteins. Food Microbiol. 2007, 24, 15–119. [Google Scholar] [CrossRef]
- Bagulho, A.S.; Costa, R.; Almeida, A.S.; Pinheiro, N.; Moreira, J.; Gomes, C.; Coco, J.; Costa, A.; Coutinho, J.; Maçãs, B. Influence of year and sowing date on bread wheat quality under Mediterranean conditions. Emir. J. Food Agric. 2015, 27, 186–199. [Google Scholar] [CrossRef]
- Balla, K.; Veisz, O. Changes in the quality of cereals in response to heat and drought stress. Acta Agron. Óvar. 2007, 49, 451–455. [Google Scholar]
- Geleta, B.; Atak, M.; Baenziger, P.S.; Nelson, L.A.; Baltenesperger, D.D.; Eskridge, K.M.; Shipman, M.J.; Shelton, D.R. Seeding rate and genotype effect on agronomic performance and end-use quality of winter wheat. Crop Sci. 2002, 42, 827–832. [Google Scholar]
- Mikos-Szymańska, M.; Podolska, G. The effects of sowing date and seeding rate on spelt and common wheat protein composition and characteristics. Qual. Assur. Saf. Crops Foods 2016, 8, 289–300. [Google Scholar] [CrossRef]
- Hao, R.; Noor, H.; Wang, P.; Sun, M.; Noor, F.; Ullah, S.; Gao, Z. Combined effects of starch sucrose content and planting density on grain protein content of winter wheat (Triticum aestivum L.). J. Food Nutr. Res. 2022, 10, 321–331. [Google Scholar]
- Madan, H.S.; Munjal, R. Effect of split doses of nitrogen and seed rate on protein content, protein fractions and yield of wheat. J. Agric. Biol. Sci. 2009, 4, 26–31. [Google Scholar]
- Johansson, E.; Prieto-Linde, M.L.; Svensson, G. Influence of nitrogen application rate and timing on grain protein composition and gluten strength in Swedish wheat cultivars. J. Plant Nutr. Soil Sci. 2004, 167, 345–350. [Google Scholar] [CrossRef]
- Rossmann, A.; Pitann, B.; Mühling, K.H. Splitting nitrogen applications improves wheat storage protein composition under low N supply. J. Plant Nutr. Soil Sci. 2019, 182, 347–355. [Google Scholar] [CrossRef]
- Luo, C.; Branlard, G.; Griffin, W.B.; McNeil, D.L. The effect of nitrogen and sulphur fertilisation and their interaction with genotype on wheat glutenins and quality parameters. J. Cereal Sci. 2000, 31, 185–194. [Google Scholar] [CrossRef]
- Haile, D.; Nigussie, D.; Ayana, A. Nitrogen use efficiency of bread wheat: Effects of nitrogen rate and time of application. J. Soil Sci. Plant Nutr. 2012, 12, 389–410. [Google Scholar]
- Linlaud, N.E.; Puppo, M.C.; Ferrero, C. Effect of hydrocolloids on water absorption of wheat flour and farinograph and textural characteristics of dough. Cereal Chem. 2009, 86, 376–382. [Google Scholar] [CrossRef]
- Sapirstein, H.; Wu, Y.; Koksel, F.; Graf, R. A study of factors influencing the water absorption capacity of Canadian hard red winter wheat flour. J. Cereal Sci. 2018, 81, 52–59. [Google Scholar] [CrossRef]
- Zhang, Z.; Jia, D.; Wang, D.; Zhou, N.; Xing, Z.; Xu, K.; Wei, H.; Guo, B.; Zhang, H. Starch and dough-related properties of wheat (Triticum aestivum L.) exposed to varying temperatures and radiances after anthesis. Agronomy 2023, 13, 1069. [Google Scholar] [CrossRef]
- Maningat, C.C.; Seib, P.A.; Bassi, S.D.; Woo, K.S.; Lasater, G.D. Wheat starch: Production, properties, modification and uses. In Starch; Academic Press: Cambridge, MA, USA, 2009; pp. 441–510. [Google Scholar]
- Huang, X.; Zhou, X.; Liu, X.; Zhong, W.; Wang, X.; Ju, Z.; Yin, Y.; Xin, Q.; Liu, N.; Liu, X.; et al. Structural and physicochemical effects on the starch quality of the high-quality wheat genotype caused by delayed sowing. Front. Nutr. 2024, 11, 1389745. [Google Scholar] [CrossRef] [PubMed]
- Zang, Y.; Yao, H.; Ran, L.; Zhang, R.; Duan, Y.; Yu, X.; Xiong, F. Physicochemical properties of wheat starch under different sowing dates. Starch-Stärke 2022, 74, 2100290. [Google Scholar] [CrossRef]
- Chen, Y.; Yang, P.; Li, H. Simulation study on effects of planting density and sowing date on grain quality of winter wheat. J. Agric. Sci. Technol. 2023, 24, 143–153. [Google Scholar]
- Han, H.; Yang, W. Influence of uniconazole and plant density on nitrogen content and grain quality in winter wheat in South China. Plant Soil Environ. 2009, 55, 159–166. [Google Scholar] [CrossRef]
- de Pelegrin, A.J.; Carvalho, I.R.; Ferrari, M.; Nardino, M.; Szareski, V.J.; Meira, D.; Wartha, C.A.; Follman, D.N.; de Pelegrin, C.M.G.; Gutkoski, L.C.; et al. Evaluation of solvent retention capacity of wheat (Triticum aestivum L.) flour depending on genotype and different timing of nitrogenous fertilizer application. Afr. J. Agric. Res. 2016, 11, 4389–4394. [Google Scholar]
- Gawęda, D.; Gawęda, M.; Chojnacka, S.; Sobolewska, M.; Łukasz, J.; Hury, G.; Wesołowska-Trojanowska, M. Evaluation of the technological quality of grain and flour of two spelt wheat (Triticum aestivum ssp. spelta L.) cultivars grown under different conditions of crop protection and seeding rate. Appl. Ecol. Environ. Res. 2019, 17, 4377–4395. [Google Scholar] [CrossRef]
- Nakano, H.; Morita, S. Effects of seeding rate and nitrogen application rate on grain yield and protein content of the bread wheat cultivar ‘Minaminokaori’ in southwestern Japan. Plant Prod. Sci. 2009, 12, 109–115. [Google Scholar] [CrossRef]
- Gaile, Z.; Ruza, A.; Kreita, D.; Paura, L. Yield components and quality parameters of winter wheat depending on tillering coefficient. Agron. Res. 2017, 15, 79–93. [Google Scholar]
- Mosanaei, H.; Ajamnorozi, H.; Dadashi, M.R.; Faraji, A.; Pessarakli, M. Improvement effect of nitrogen fertilizer and plant density on wheat (Triticum aestivum L.) seed deterioration and yield. Emir. J. Food Agric. 2017, 29, 899–910. [Google Scholar] [CrossRef]
- Shevkani, K.; Singh, N.; Bajaj, R.; Kaur, A. Wheat starch production, structure, functionality and applications—A review. Int. J. Food Sci. Technol. 2017, 52, 38–58. [Google Scholar] [CrossRef]
- Zhang, Y.; Zhang, G. Starch content and physicochemical properties of green wheat starch. Int. J. Food Prop. 2019, 22, 1463–1474. [Google Scholar] [CrossRef]
- Zhang, Y.; Dai, X.; Jia, D.; Li, H.; Wang, Y.; Li, C.; Xu, H.; He, M. Effects of plant density on grain yield, protein size distribution, and breadmaking quality of winter wheat grown under two nitrogen fertilisation rates. Eur. J. Agron. 2016, 73, 1–10. [Google Scholar] [CrossRef]
- Fleitas, M.C.; Schierenbeck, M.; Gerard, G.S.; Dietz, J.I.; Golik, S.I.; Campos, P.E.; Simón, M.R. How leaf rust disease and its control with fungicides affect dough properties, gluten quality and loaf volume under different N rates in wheat. J. Cereal Sci. 2018, 80, 119–127. [Google Scholar] [CrossRef]
- Kunkulberga, D.; Linina, A.; Ruza, A. Effect of nitrogen fertilization on protein content and rheological properties of winter wheat wholemeal. In Proceedings of the 3th Baltic Conference on Food Science and Technology “FOOD, NUTRITION, WELL-BEING”, Jelgava, Latvia, 2–3 May 2019; pp. 88–92. [Google Scholar]
- Lagrain, B.; Wilderjans, E.; Glorieux, C.; Delcour, J.A. Importance of gluten and starch for structural and textural properties of crumb from fresh and stored bread. Food Biophys. 2012, 7, 173–181. [Google Scholar] [CrossRef]
- Knapowski, T.; Ralcewicz, M. Evaluation of qualitative features of Mikon cultivar winter wheat grain and flour depending on selected agronomic factors. Electron. J. Pol. Agric. Univ. EJPAU Agron. 2004, 7, 1–12. [Google Scholar]
- Knapowski, T.; Ralcewicz, M. Estimation of the quality parameters of winter wheat grain and flour in response to different nitrogen rates. Ann. UMCS Sec. E 2004, 59, 959–968. (In Polish) [Google Scholar]


| Parameter | Crude Ash Content (g kg−1 DM) | Color (% Whiteness Standard) | Total Protein Content (g kg−1 DM) | Water Absorption Capacity (%) |
|---|---|---|---|---|
| Growing season | ||||
| 2018/2019 | 7.4 a | 76.9 b | 135 a | 62.2 a |
| 2019/2020 | 6.3 c | 79.9 a | 127 c | 57.7 c |
| 2020/2021 | 6.6 b | 77.1 b | 129 b | 59.2 b |
| Sowing date, mean for 2018–2021 | ||||
| Early | 6.8 | 78.0 | 129 b | 59.2 b |
| Delayed (+14 days) | 6.7 | 77.9 | 130 b | 59.5 ab |
| Delayed (+28 days) | 6.7 | 77.9 | 132 a | 60.3 a |
| Sowing density (live grains m−2), mean for 2018–2021 | ||||
| 200 | 6.8 | 77.9 b | 132 a | 59.6 |
| 300 | 6.8 | 77.8 b | 130 ab | 59.4 |
| 400 | 6.7 | 78.2 a | 129 b | 60.0 |
| Split spring N rate (kg ha−1), mean for 2018–2021 | ||||
| 40 + 100 | 6.8 | 77.8 b | 132 a | 59.7 |
| 70 + 70 | 6.7 | 78.0 ab | 130 ab | 60.0 |
| 100 + 40 | 6.7 | 78.1 a | 129 b | 59.3 |
| Parameter | Development Time (min) | Stability (min) | Degree of Softening (jB) | Bread Loaf Volume (cm3) | Crumb Density (g cm−3) |
|---|---|---|---|---|---|
| Growing season | |||||
| 2018/2019 | 3.5 b | 5.2 c | 60.5 a | 333 b | 0.27 a |
| 2019/2020 | 3.7 a | 9.0 a | 38.4 c | 350 a | 0.24 b |
| 2020/2021 | 3.5 b | 7.8 b | 45.2 b | 347 a | 0.23 c |
| Sowing date, mean for 2018–2021 | |||||
| Early | 3.5 b | 7.4 b | 48.2 a | 343 | 0.25 a |
| Delayed (+14 days) | 3.5 b | 6.3 c | 53.5 a | 343 | 0.24 b |
| Delayed (+28 days) | 3.7 a | 8.4 a | 42.4 b | 344 | 0.24 b |
| Sowing density (live grains m−2), mean for 2018–2021 | |||||
| 200 | 3.6 | 7.2 b | 49.5 | 342 b | 0.25 |
| 300 | 3.5 | 7.0 b | 47.9 | 342 b | 0.25 |
| 400 | 3.5 | 7.8 a | 46.7 | 347 a | 0.24 |
| Split spring N rate (kg ha−1), mean for 2018–2021 | |||||
| 40 + 100 | 3.6 | 7.1 b | 48.9 | 345 | 0.24 |
| 70 + 70 | 3.5 | 7.3 ab | 48.7 | 343 | 0.25 |
| 100 + 40 | 3.5 | 7.7 a | 46.5 | 343 | 0.25 |
Disclaimer/Publisher’s Note: The statements, opinions and data contained in all publications are solely those of the individual author(s) and contributor(s) and not of MDPI and/or the editor(s). MDPI and/or the editor(s) disclaim responsibility for any injury to people or property resulting from any ideas, methods, instructions or products referred to in the content. |
© 2024 by the authors. Licensee MDPI, Basel, Switzerland. This article is an open access article distributed under the terms and conditions of the Creative Commons Attribution (CC BY) license (https://creativecommons.org/licenses/by/4.0/).
Share and Cite
Lachutta, K.; Jankowski, K.J. Quality of Winter Wheat Flour from Different Sowing and Nitrogen Management Strategies: A Case Study in Northeastern Poland. Appl. Sci. 2024, 14, 5167. https://doi.org/10.3390/app14125167
Lachutta K, Jankowski KJ. Quality of Winter Wheat Flour from Different Sowing and Nitrogen Management Strategies: A Case Study in Northeastern Poland. Applied Sciences. 2024; 14(12):5167. https://doi.org/10.3390/app14125167
Chicago/Turabian StyleLachutta, Krzysztof, and Krzysztof Józef Jankowski. 2024. "Quality of Winter Wheat Flour from Different Sowing and Nitrogen Management Strategies: A Case Study in Northeastern Poland" Applied Sciences 14, no. 12: 5167. https://doi.org/10.3390/app14125167