The Stiffness Change in Pre-Stressed Concrete T-Beams during Their Life-Cycle Based on a Full-Scale Destructive Test
Abstract
:1. Introduction
2. Experimental Program
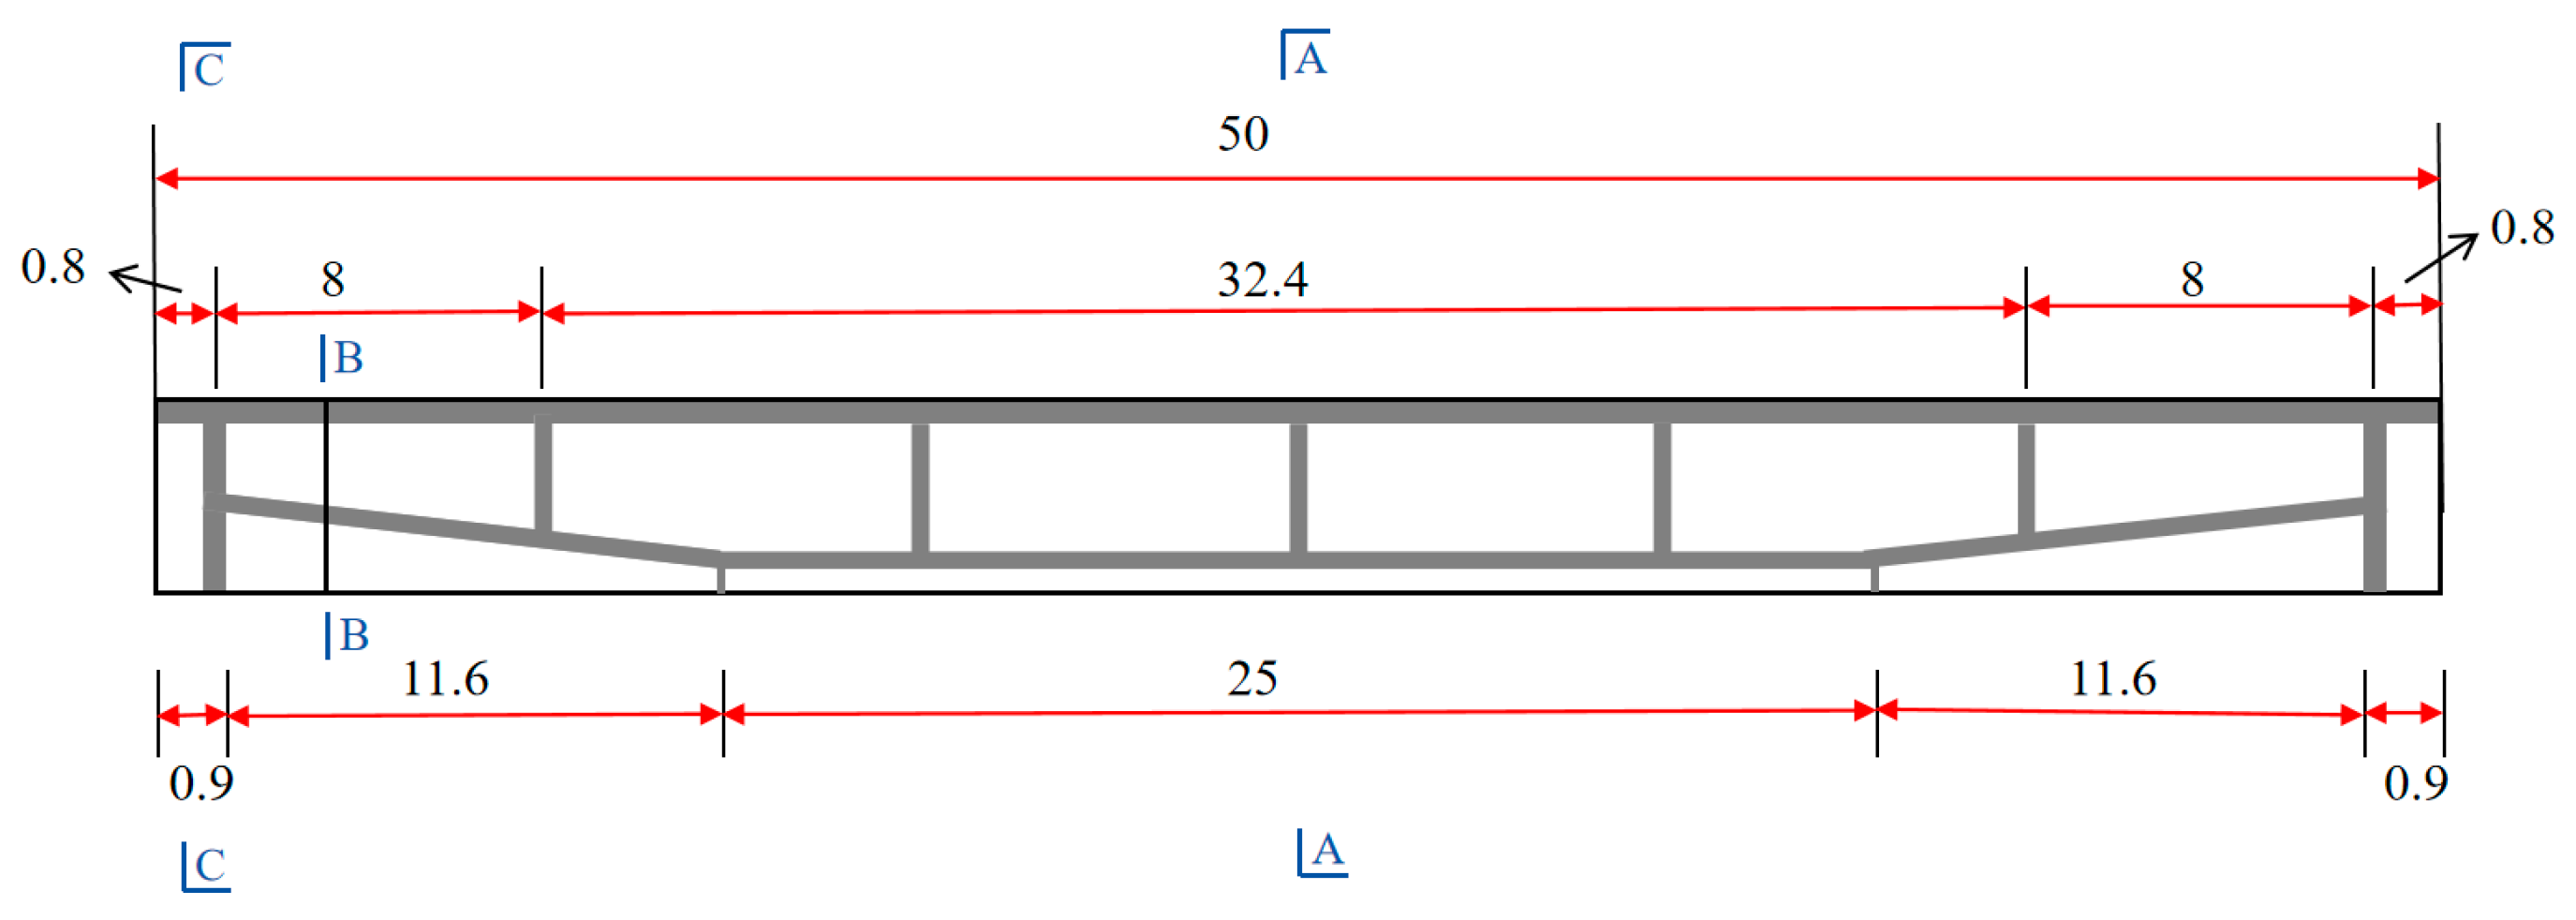
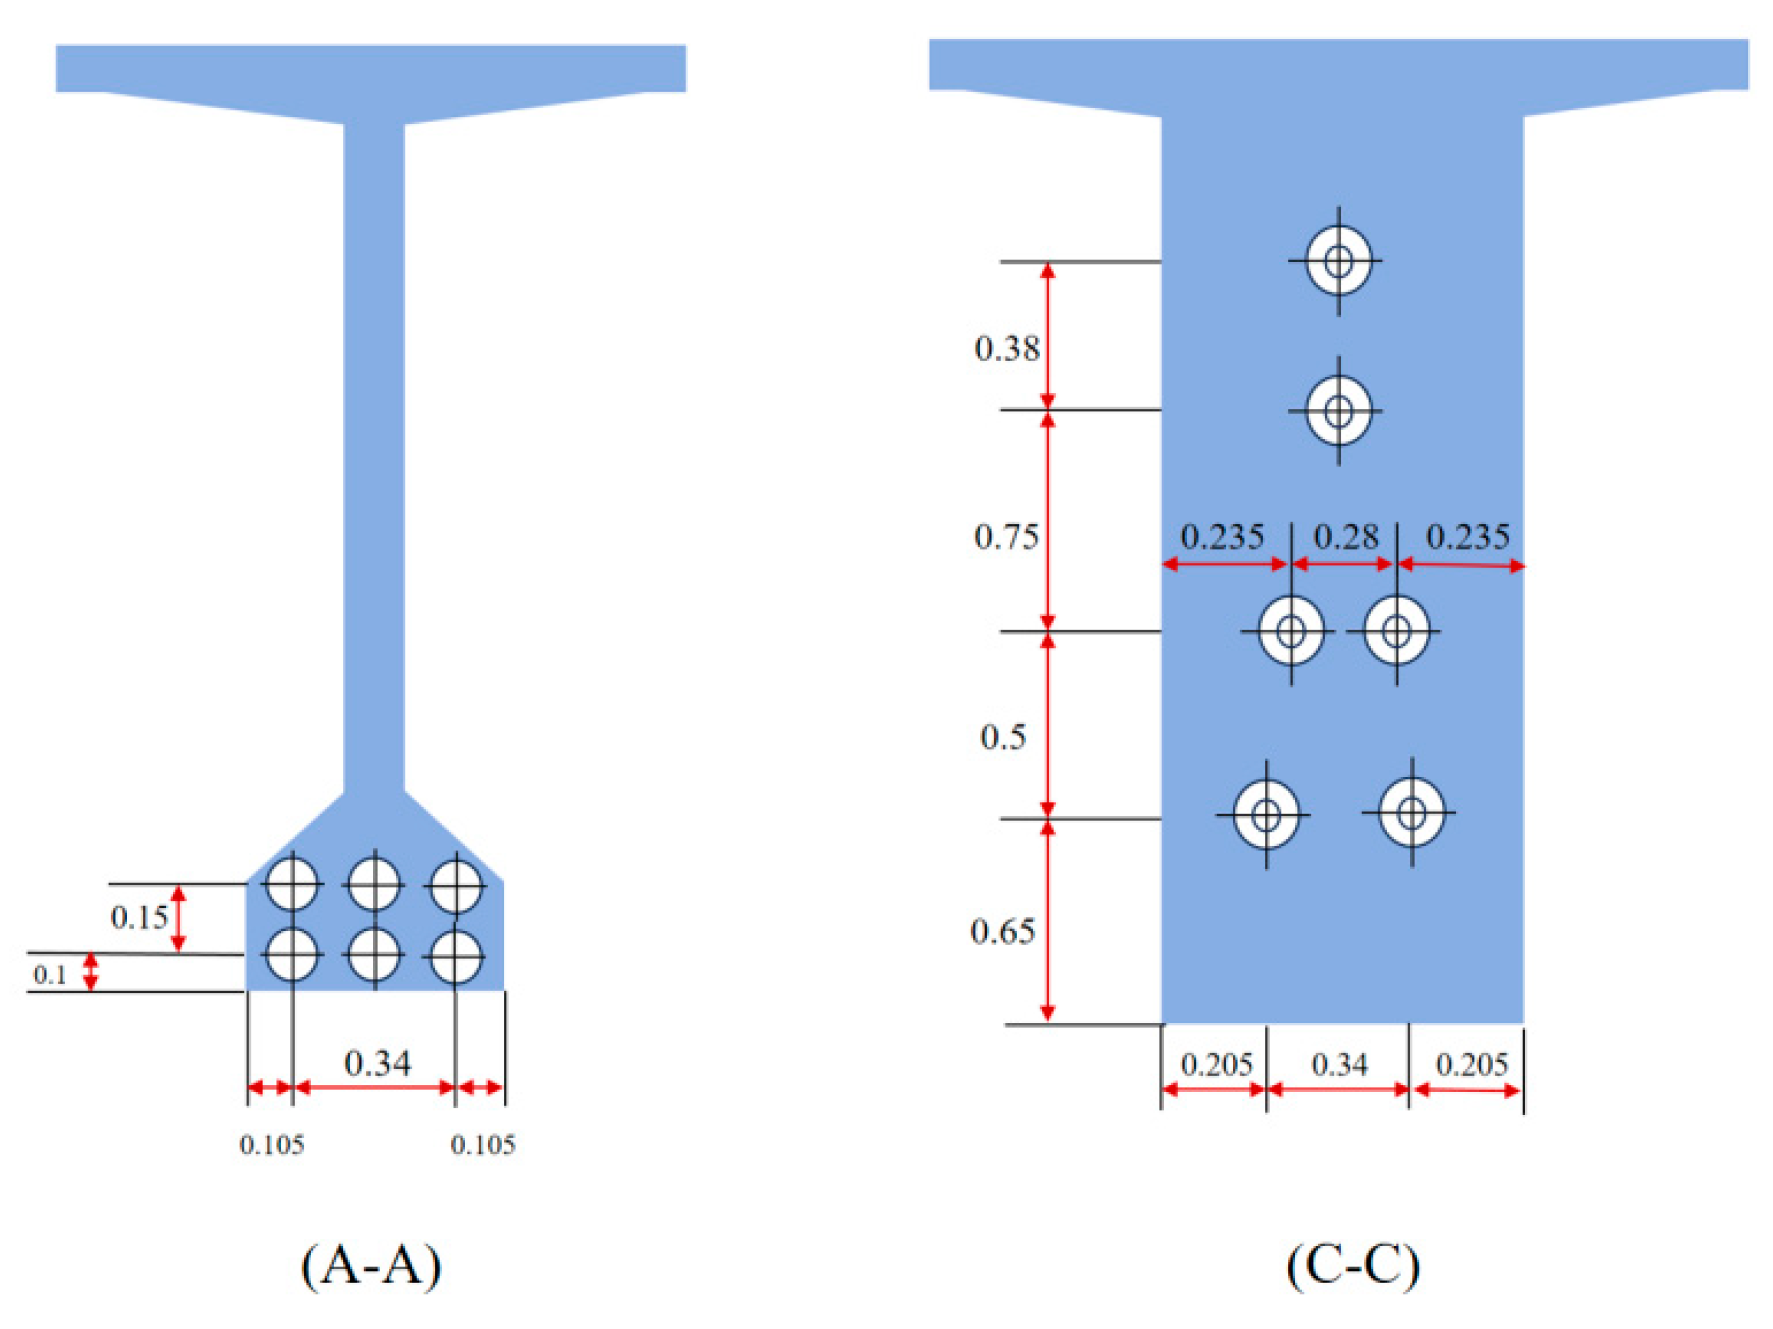
2.1. Test Beam
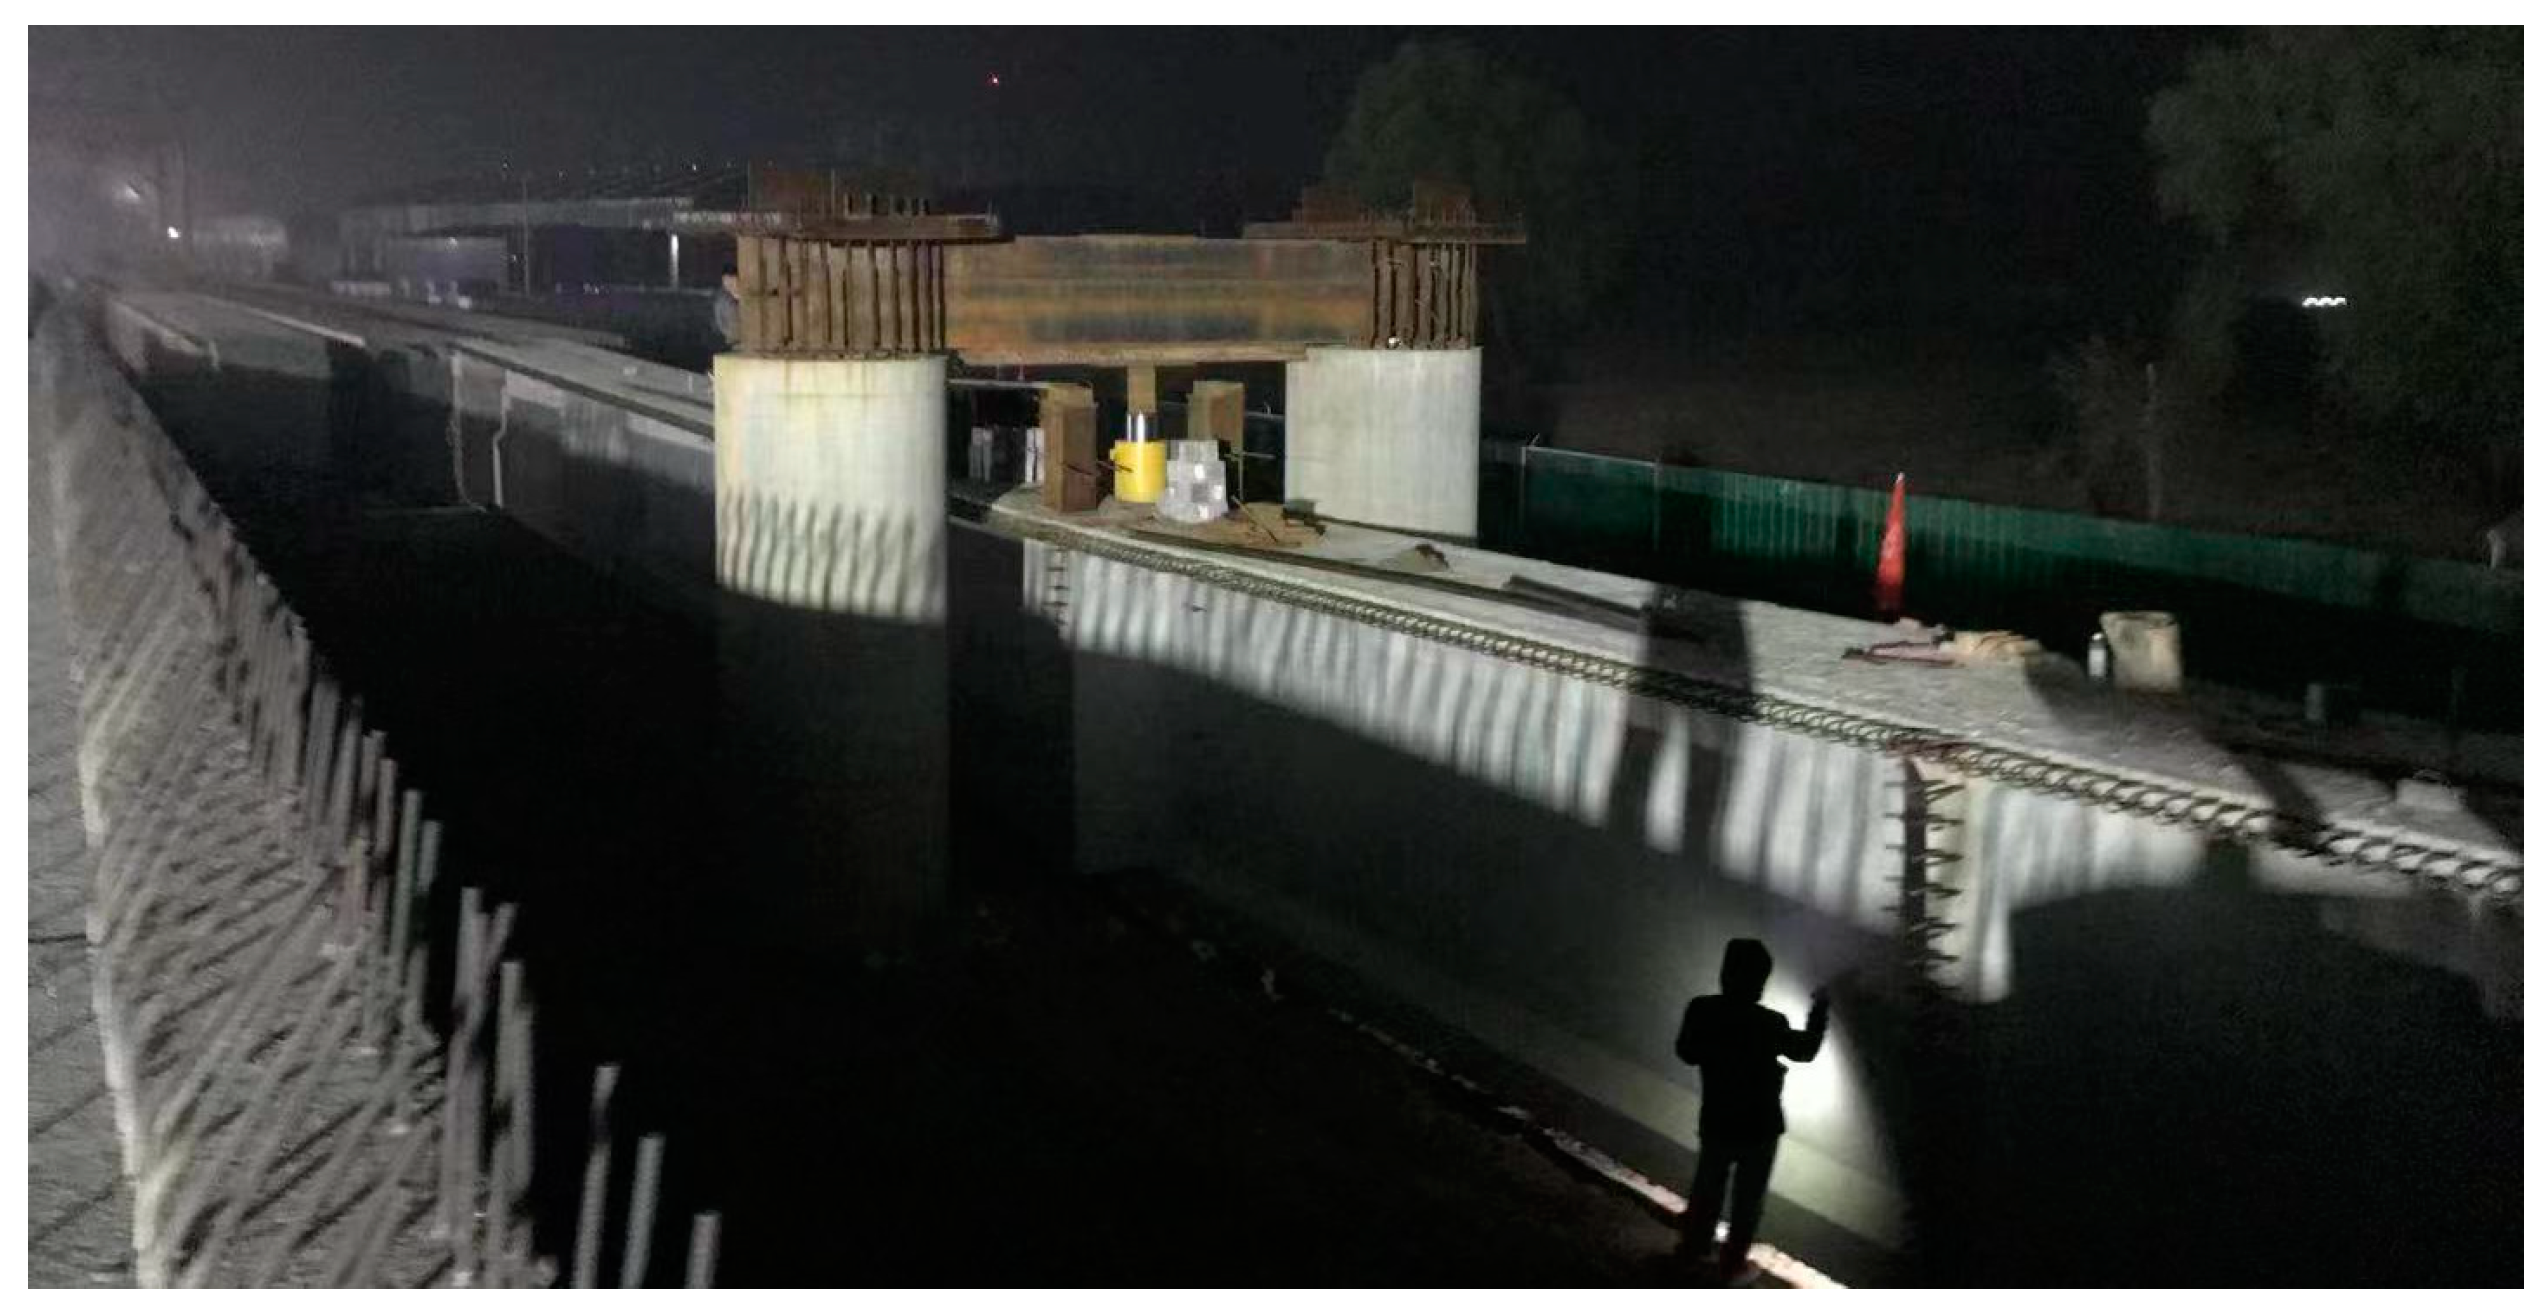
2.2. Loading Device and Measurement Point Layout
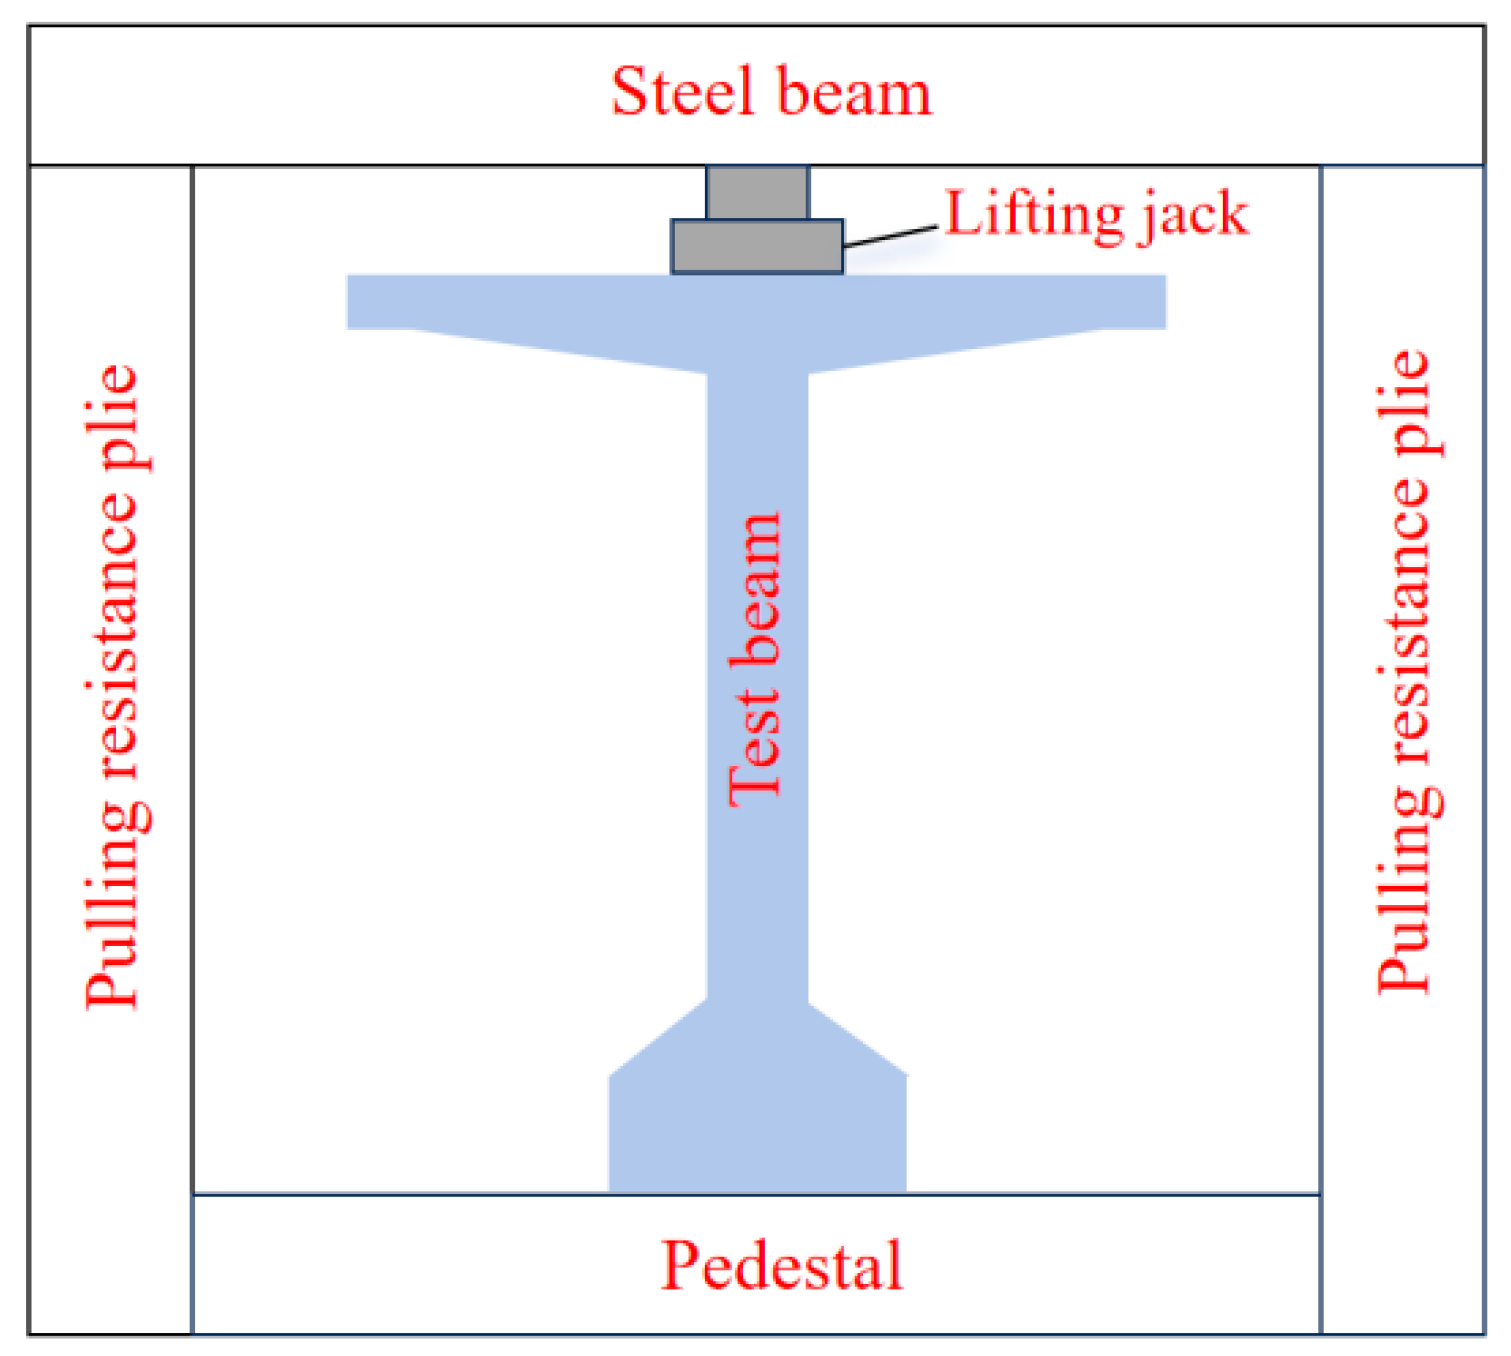
2.2.1. Loading Device
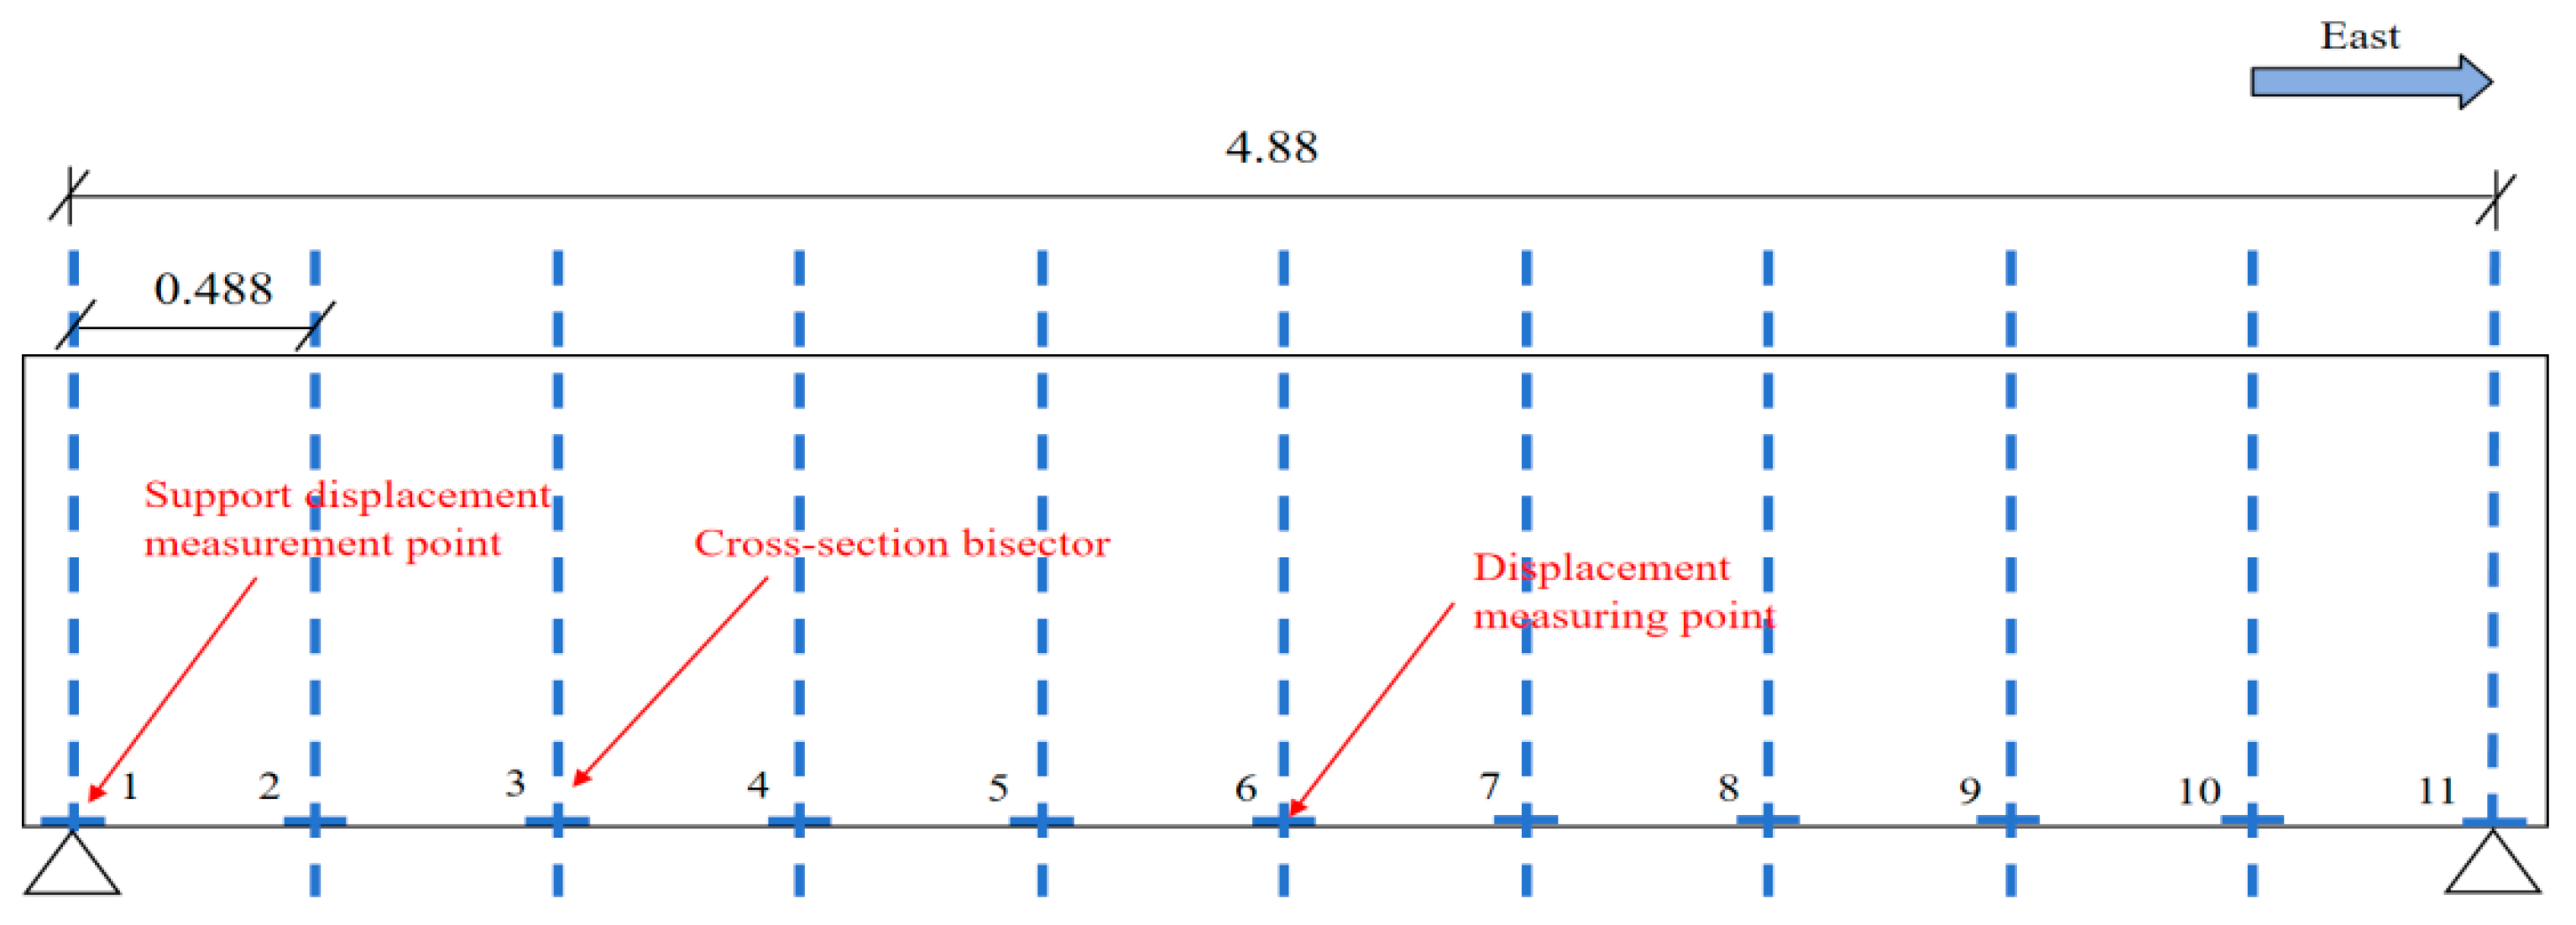
2.2.2. Layout of Deflection Measurements
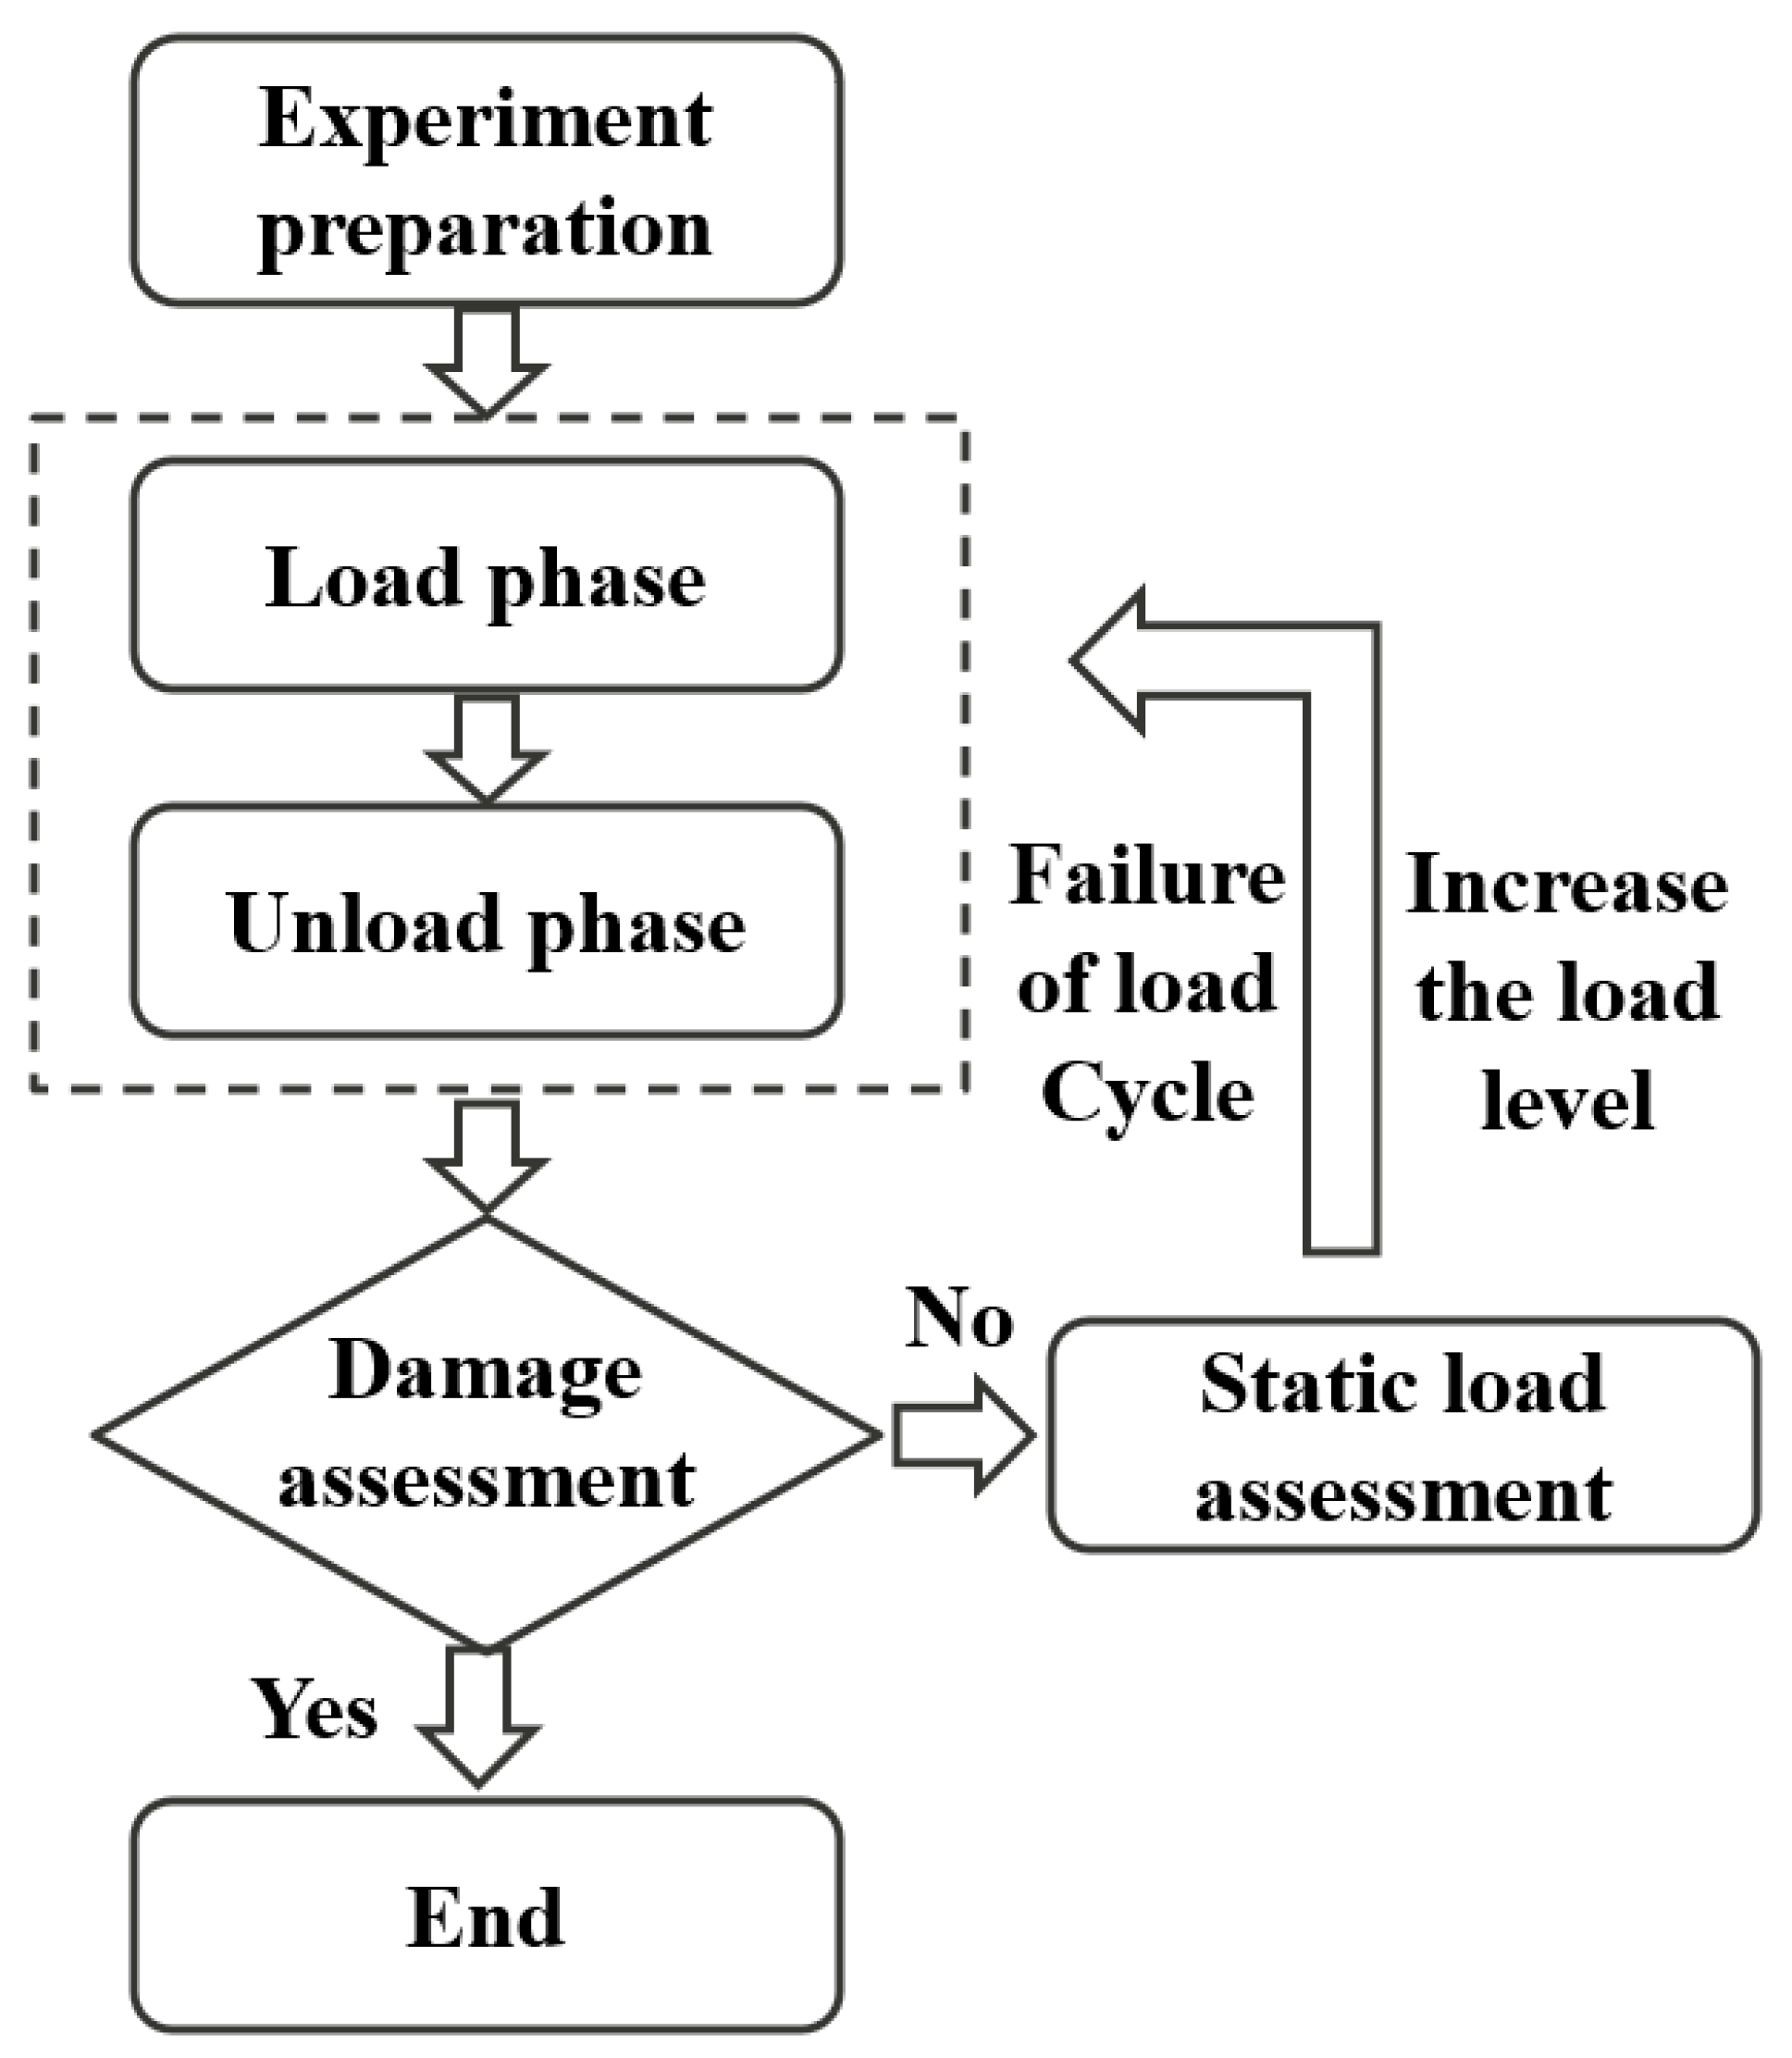
2.3. Load Program
2.3.1. Load Level
2.3.2. Dynamic and Static Load Test Loading Efficiency
3. Experimental Results and Analysis
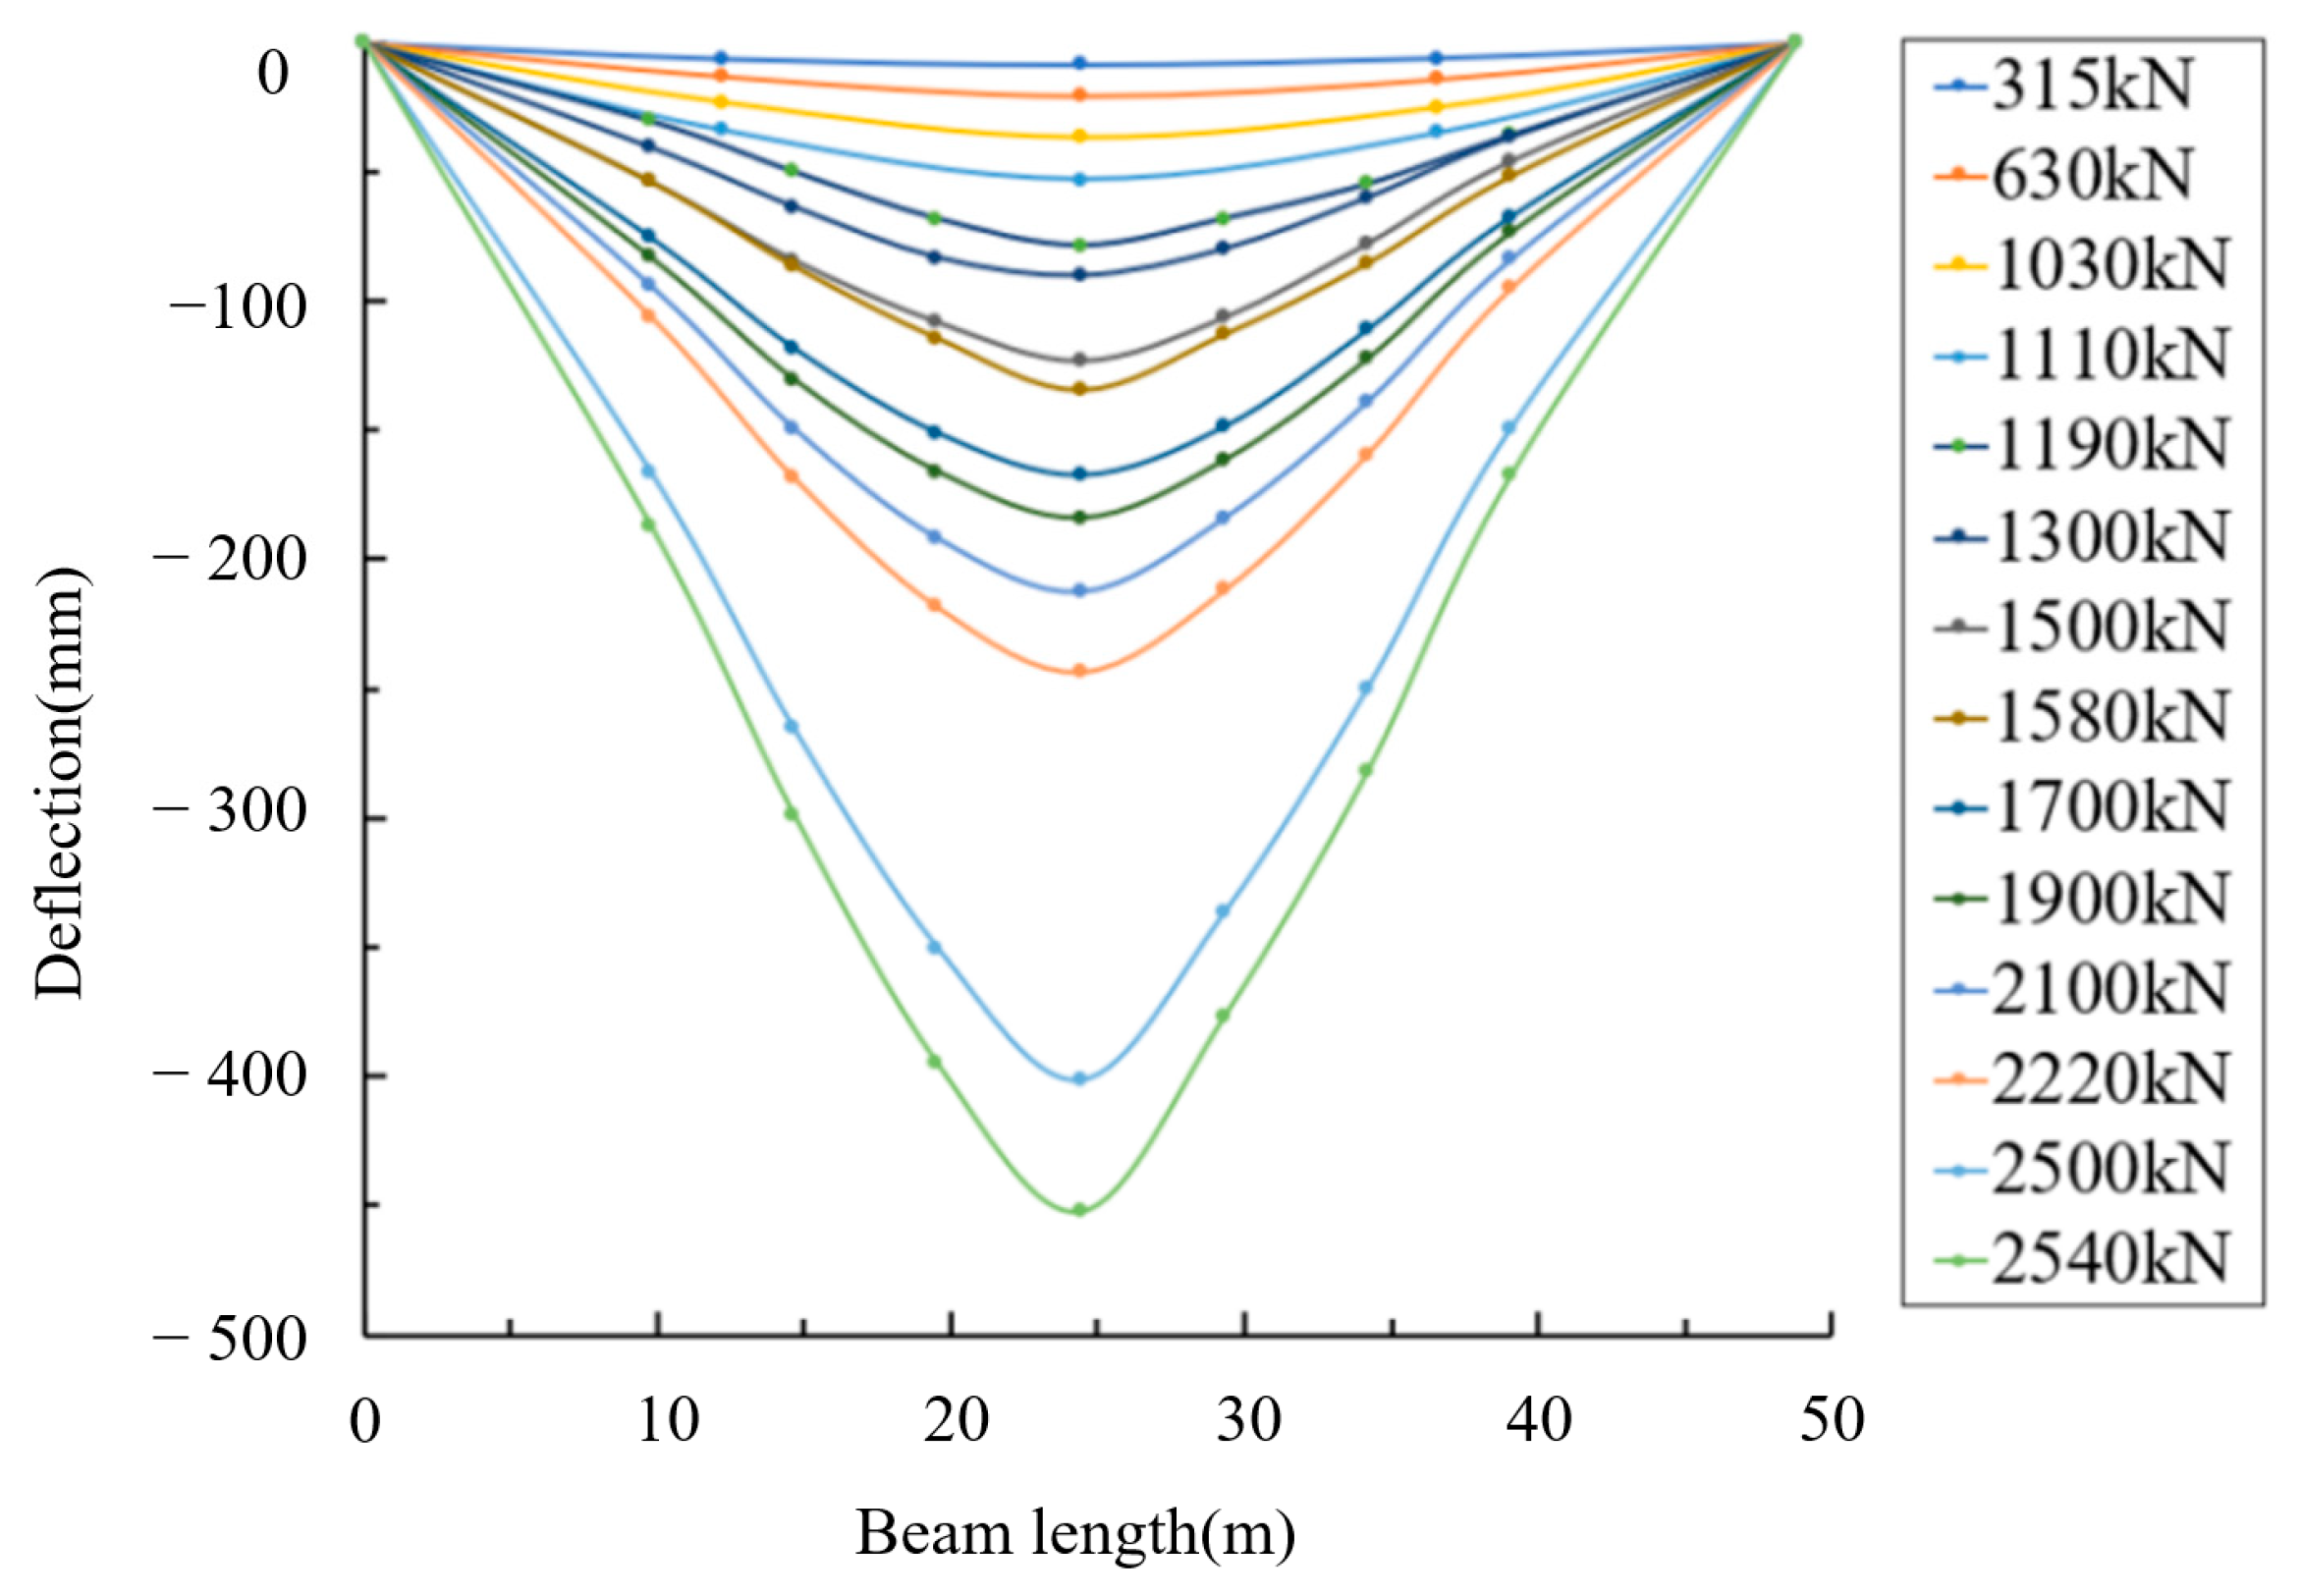
3.1. Experimental Results
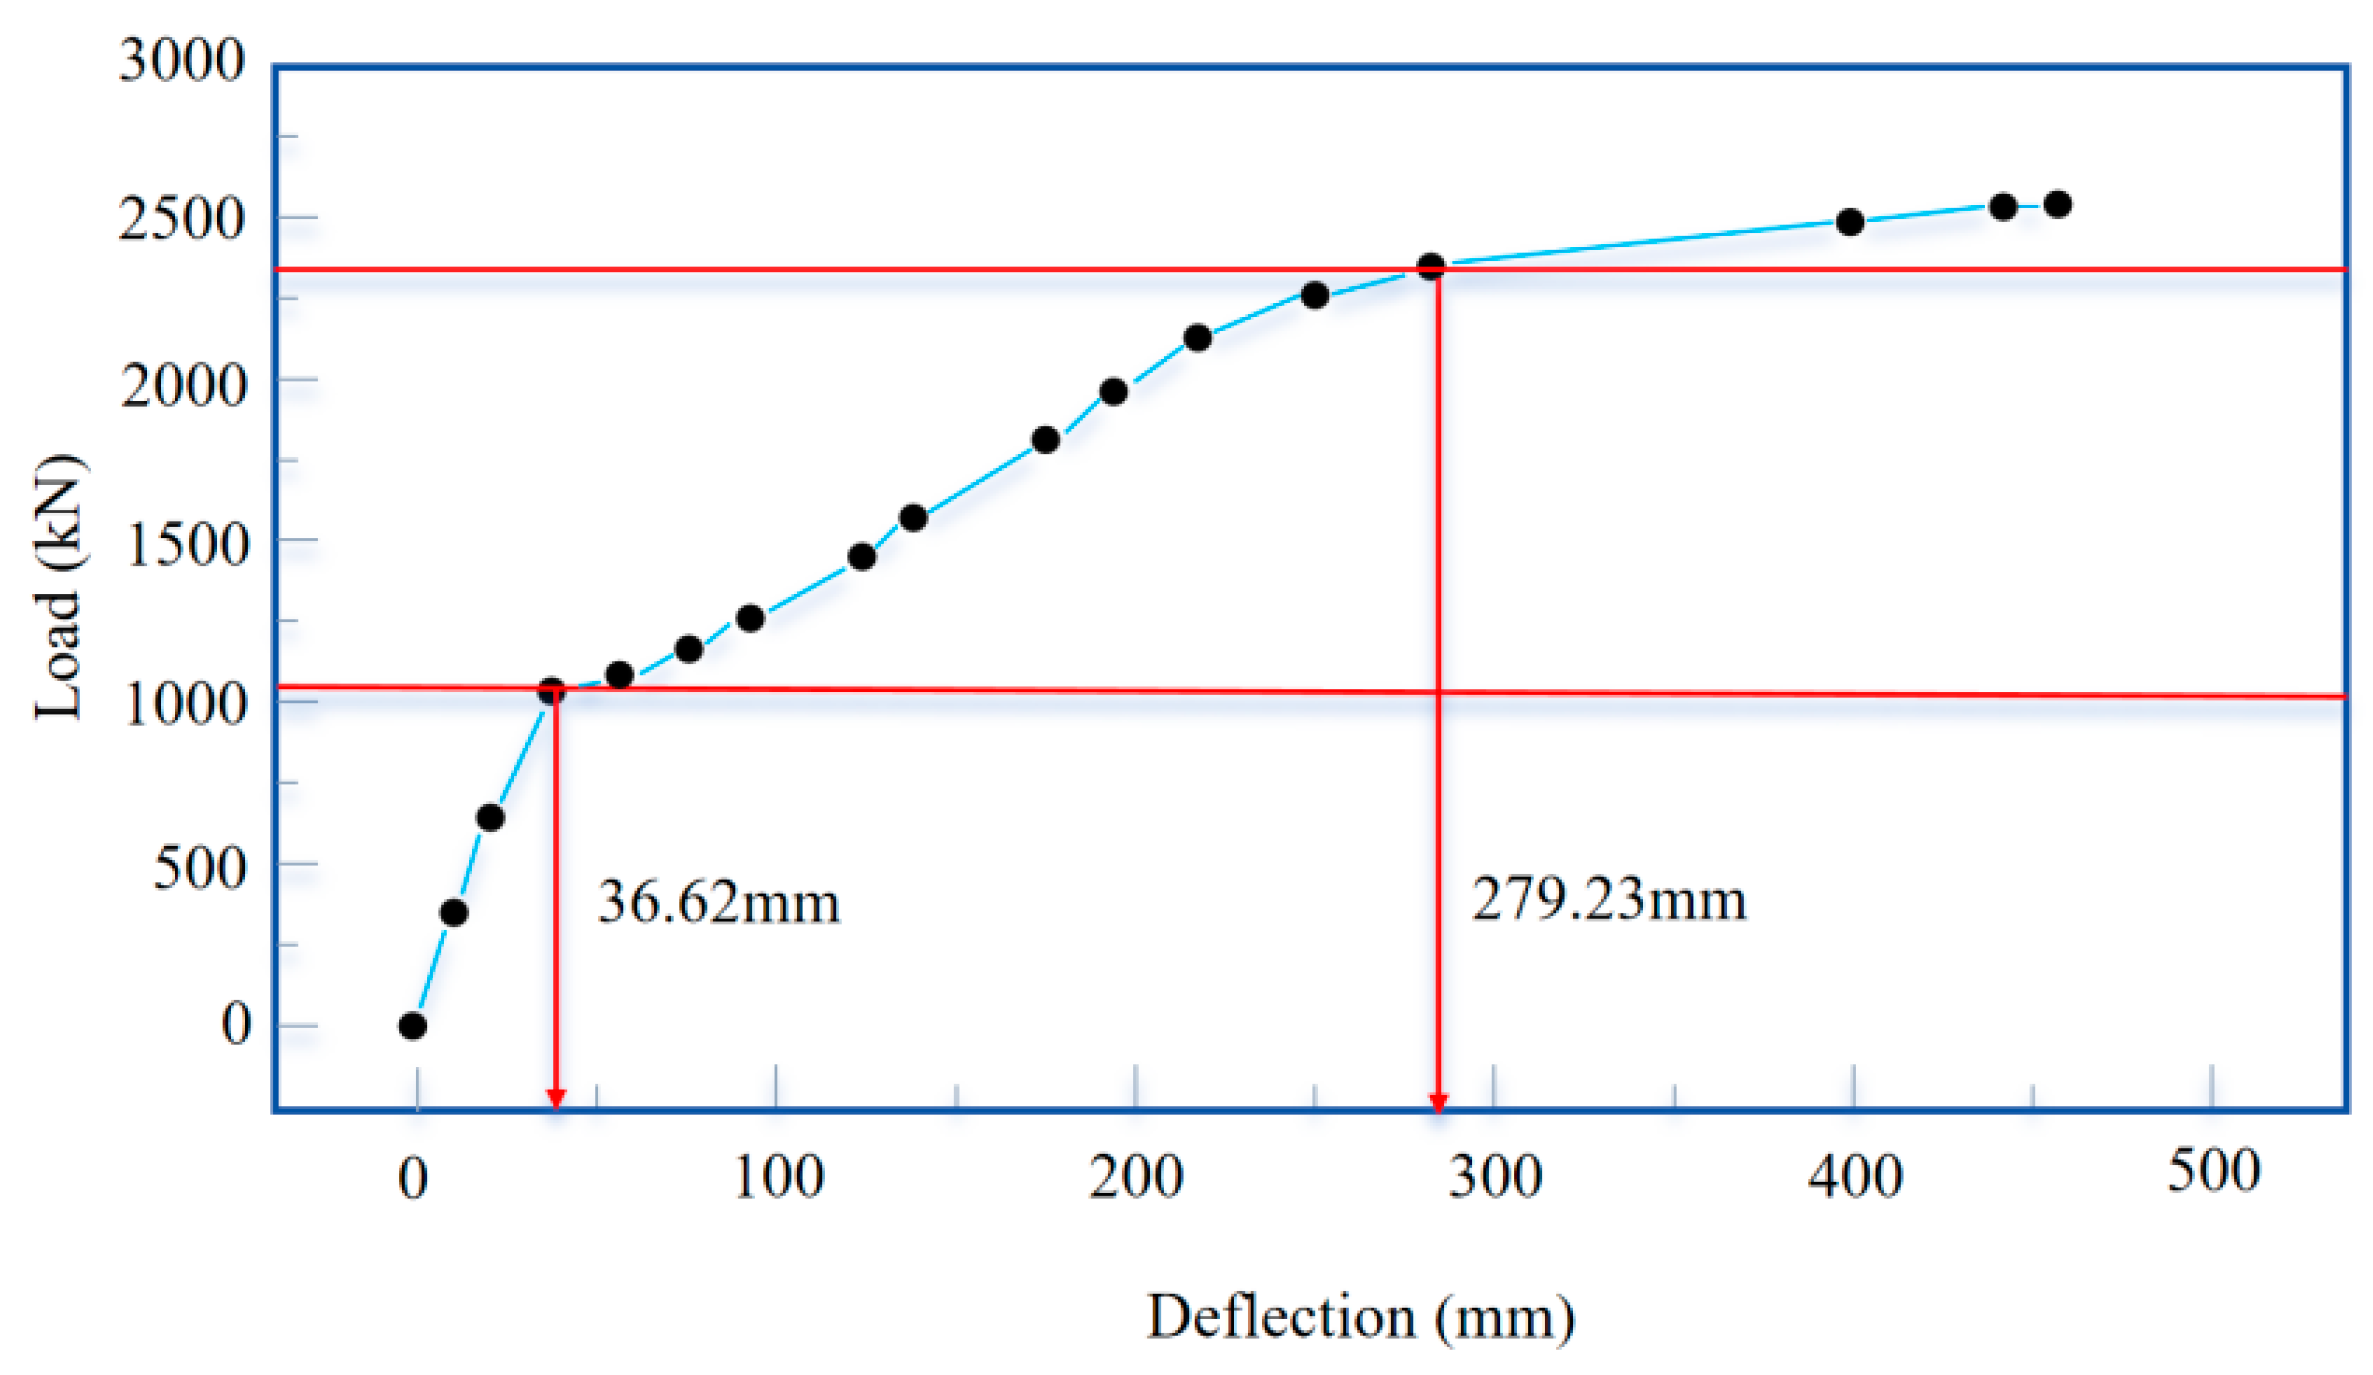
3.2. Load–Deflection Analysis
- (1)
- Complete linear stage: During the initial stage of loading, when the load value is small, the deflection of the beam increases gradually. The load–deflection curve shows a linear relationship between the deflections and the applied load. The slope of the load–deflection curve is the highest during this stage. No cracks are observed, and the stiffness of the T-beam remains essentially unchanged. The material in the T-beam does not reach the yield state.
- (2)
- Incomplete linear stage: With the increase in the cyclic loads, the structural carrying capacity gradually decreases. In this process, the deflection verification factor shows an exponential growth trend as the cyclic load value increases. This indicates that, under the criterion of deflection verification factor assessment, the structural carrying capacity fails to meet the requirements for normal use. When the load reached 1030 kN, the deflection at the mid-span section of the beam reached 36.62 mm, marking the occurrence of the first inflection point on the load–deflection curve. At this point, the test beam emitted a continuous sound, and cracks began to appear at the bottom of the beam’s mid-span section. Crack dispersion was observed predominantly within the 2.5 m vicinity of the mid-span of the beam, exhibiting a skewed orientation. The average crack width was approximately 0.08 mm, with the maximum crack width measuring 0.12 mm, which corresponded to the cracking load. This cracking load of 1030 kN was almost equal to the predicted cracking load. After the first inflection point, the deflection continued to change linearly with the load, but the slope of the load–deflection curve decreased, indicating a decrease in stiffness. The cracks gradually propagated towards the two ends of the beam as the load increased during this stage.
- (3)
- Non-linear stage: As the load further increased to 2380 kN, the deflection at the mid-span section of the beam reached 279.32 mm, marking the occurrence of the second inflection point on the load–deflection curve. The rate of deflection growth accelerated, indicating that the beam has entered the plastic stage. At a load of 2550 kN, the deflection at the mid-span section reached 473.28 mm. At this point, the crack height at the mid-span section is close to the top of the beam, and the maximum crack width was measured at 4.7 mm. A sound was heard from the pre-stress breaking, and the tensile steel bars in the beam began to yield. The test was concluded at this stage.
4. The Predicted Stiffness
4.1. Equivalent Stiffness
4.2. Short-Term Stiffness
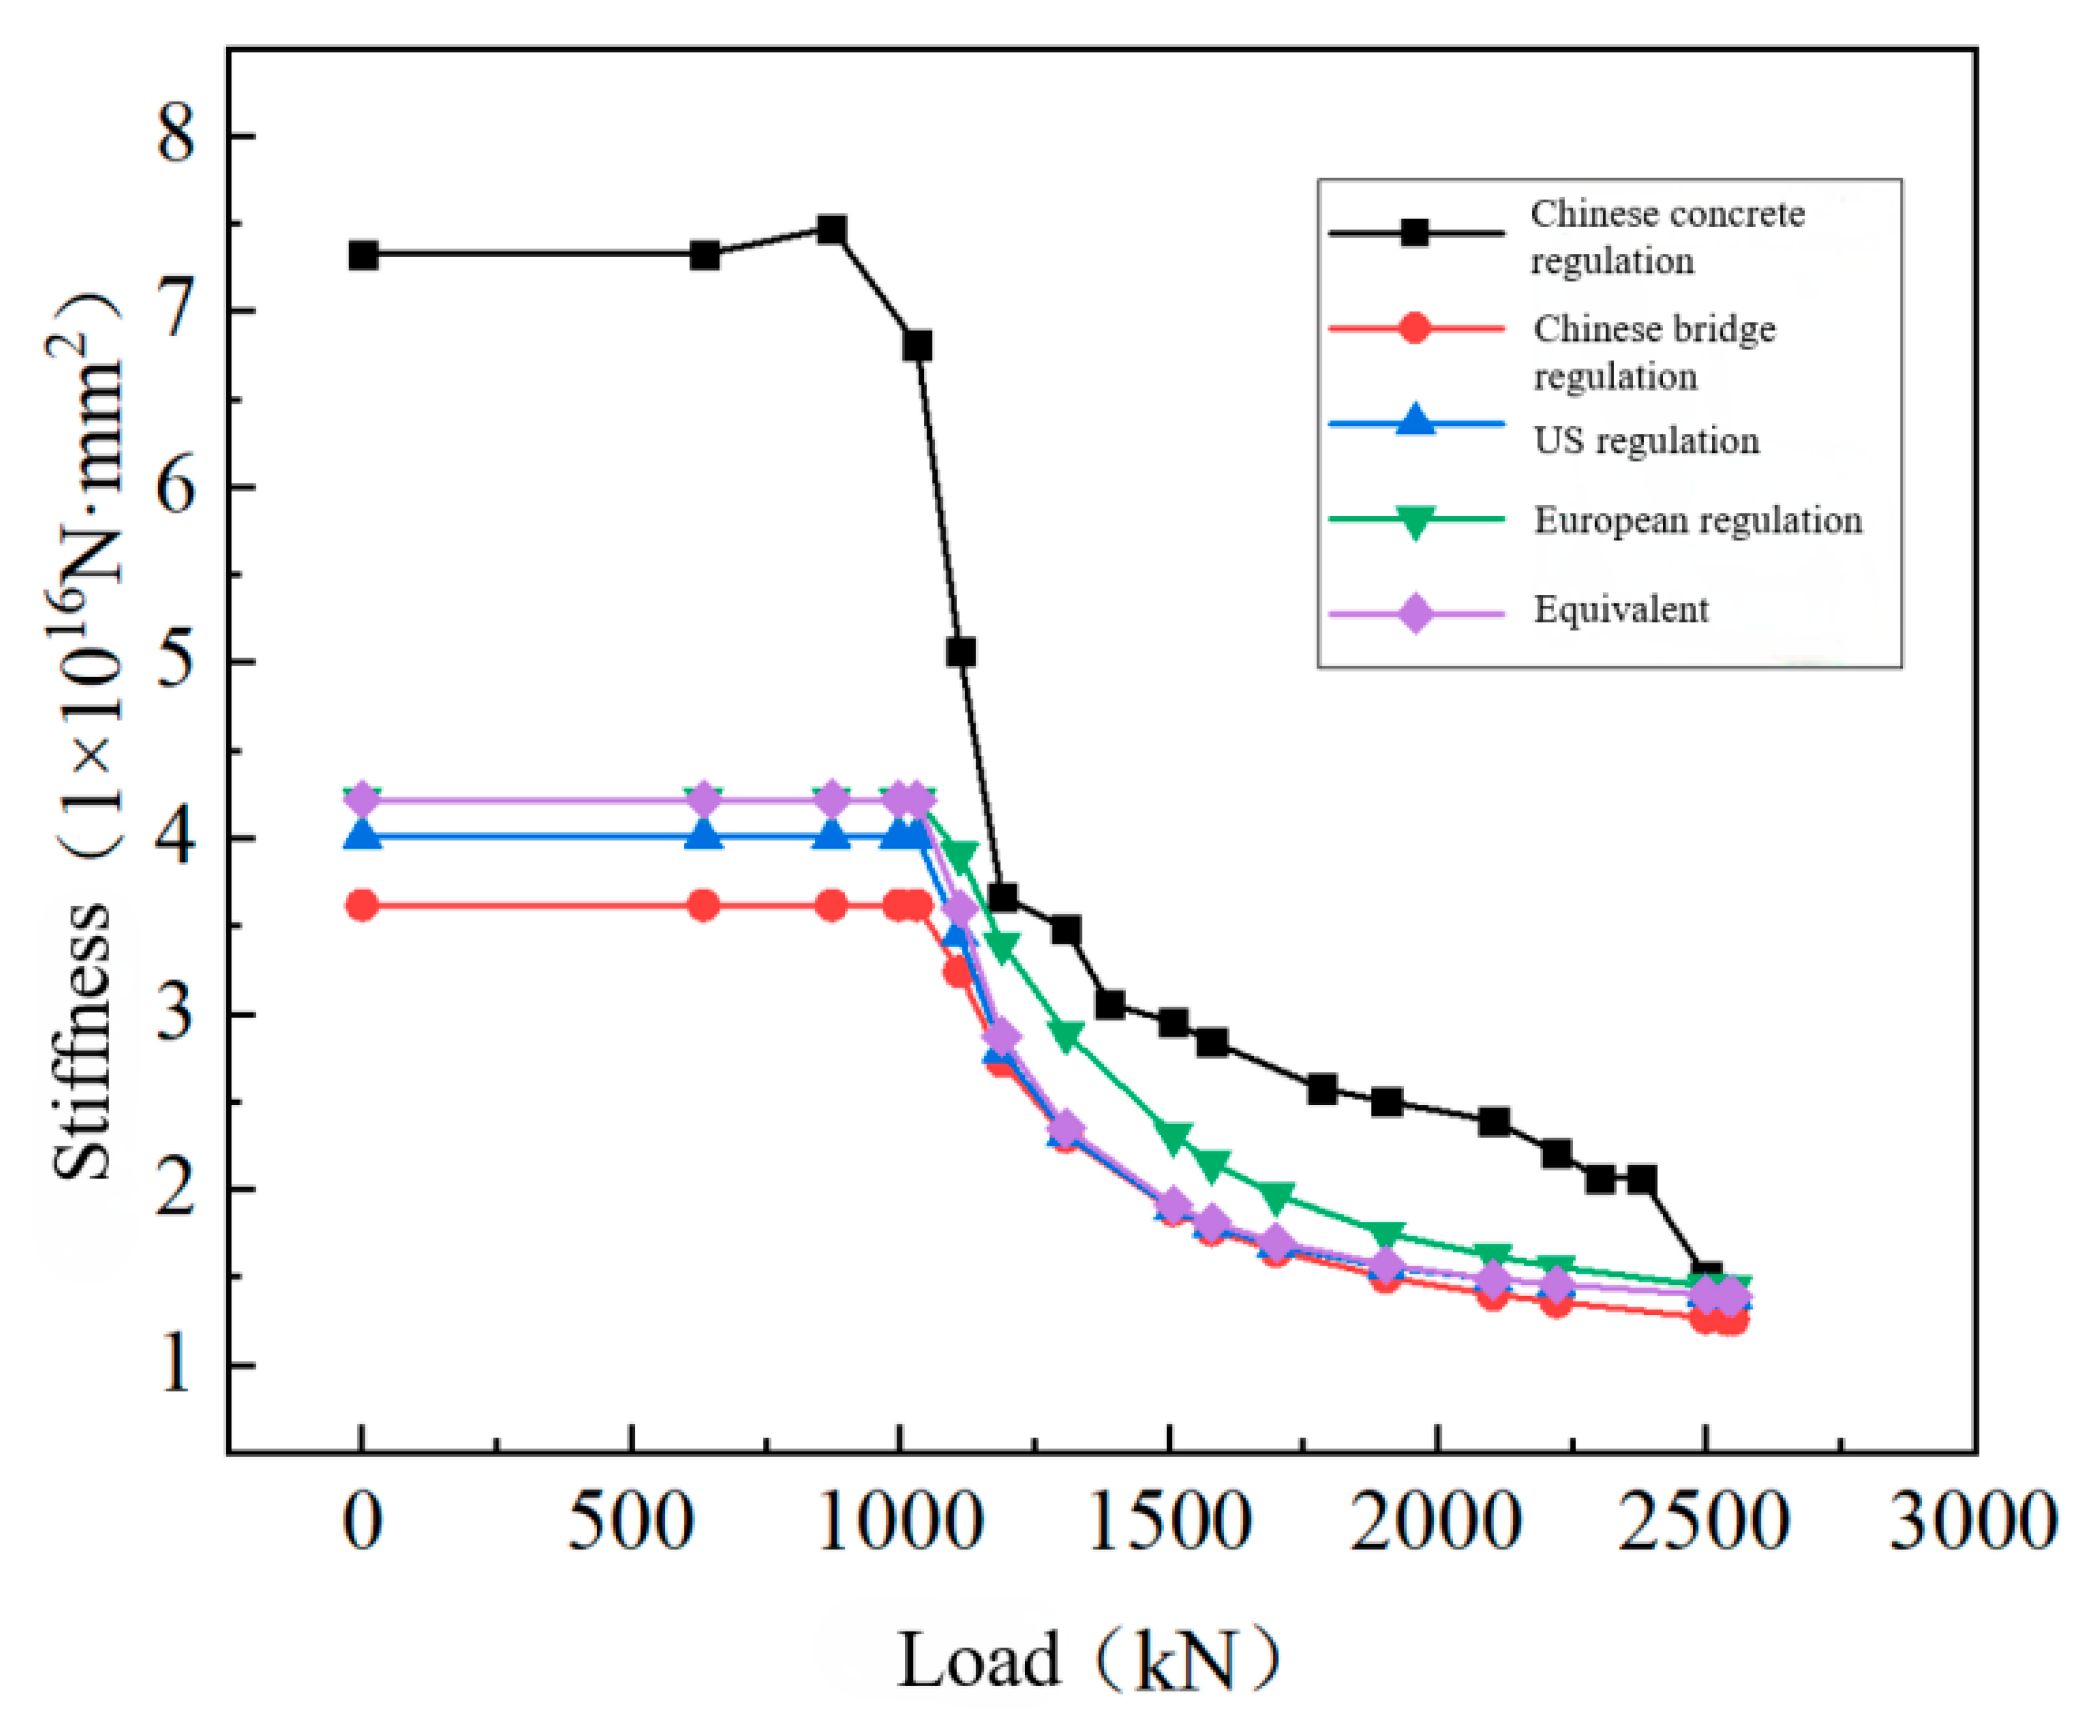
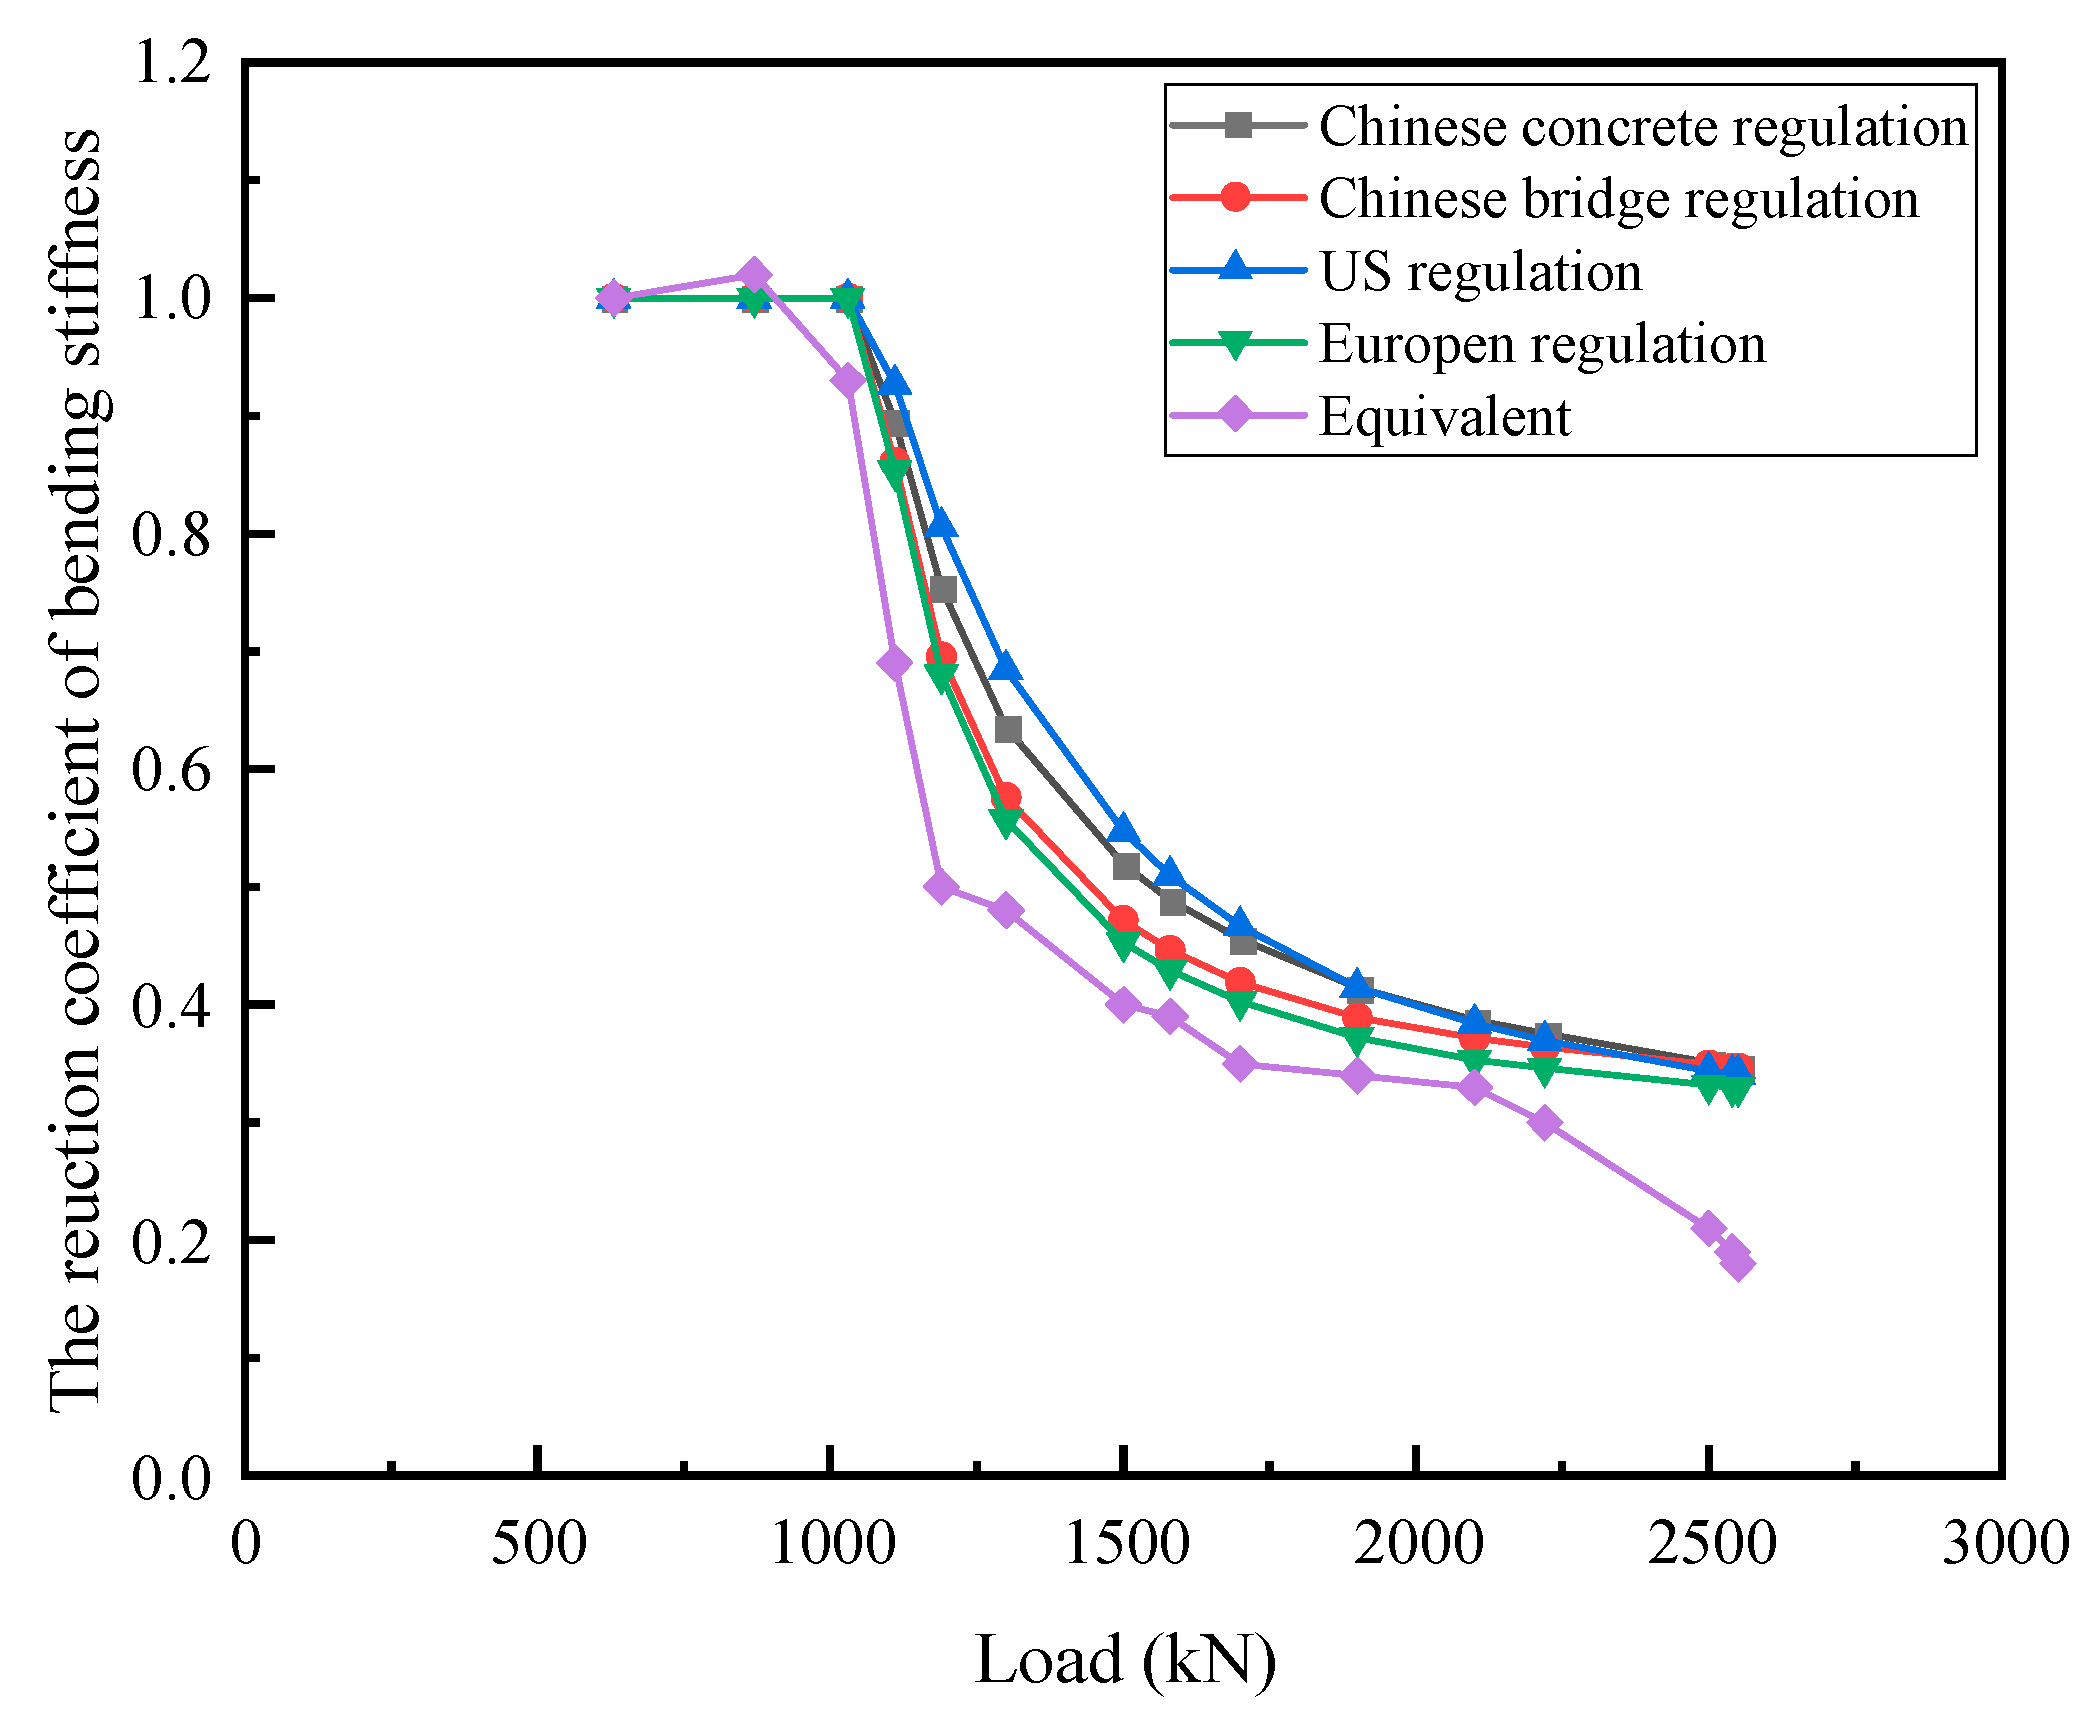
4.3. Comparison of the Results
5. Back-Calculation of Piecewise Stiffness
5.1. System Identification Method
- (1)
- Apply the load to the actual beam, and measure the deflections of the beam with known load values.
- (2)
- Establish a mechanical model of the beam, for which the finite element model was adopted. Input the piecewise seed moduli and the load in step (1), and the calculated deflections can be obtained at the same position as the measured deflections.
- (3)
- According to the parameter adjustment algorithm, the input moduli of the model will be gradually adjusted, aimed at matching the calculated deflection to the measured deflection. The adjusted moduli will be accepted until the errors between the calculated deflections and measured deflections reach an acceptable range.
5.2. Segmented Stiffness Inverse Calculation Method
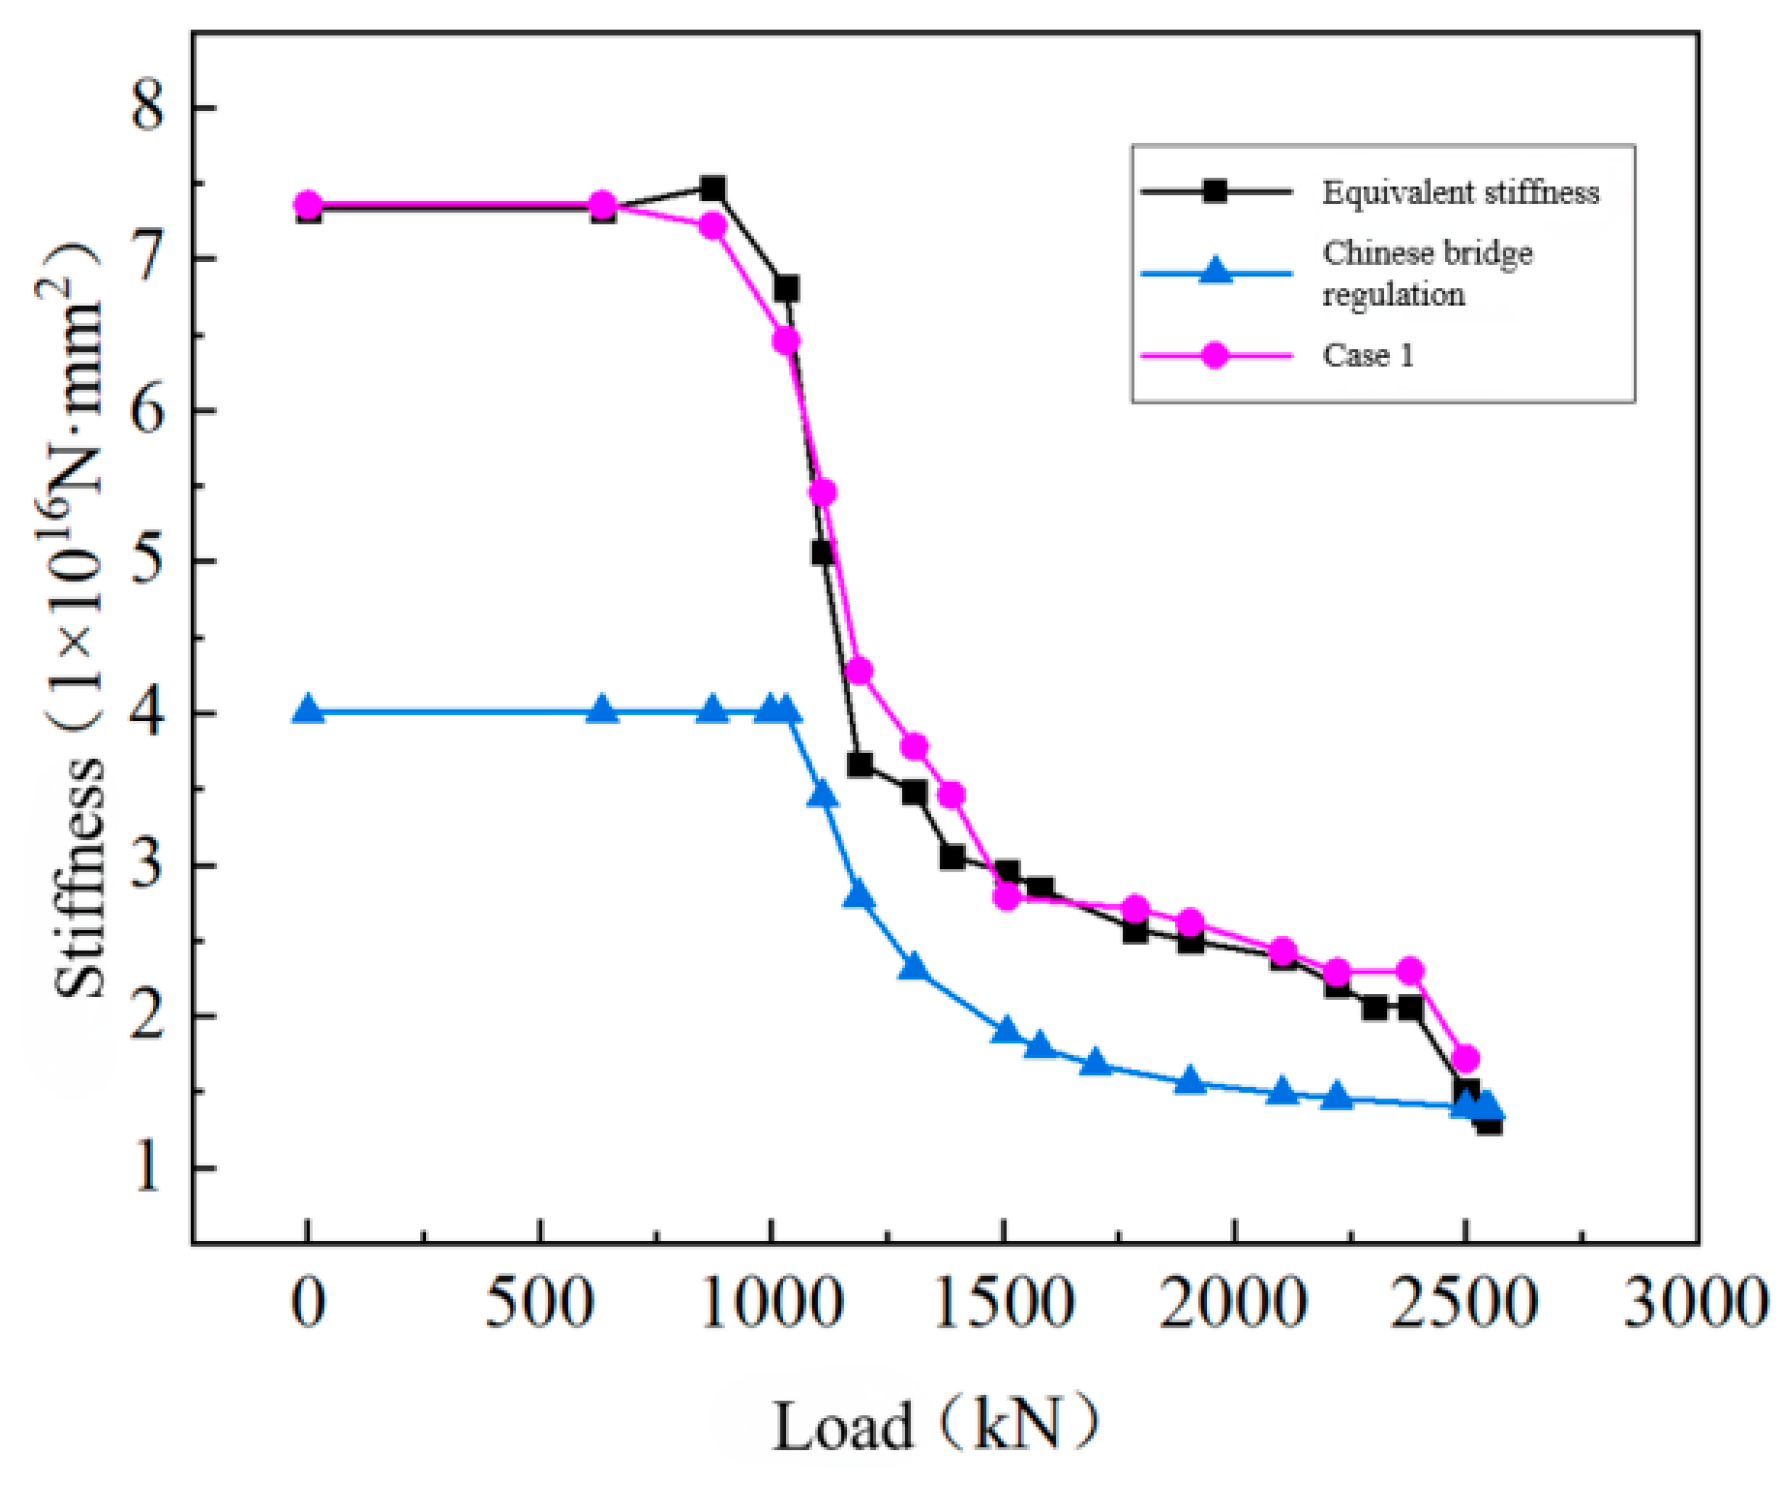
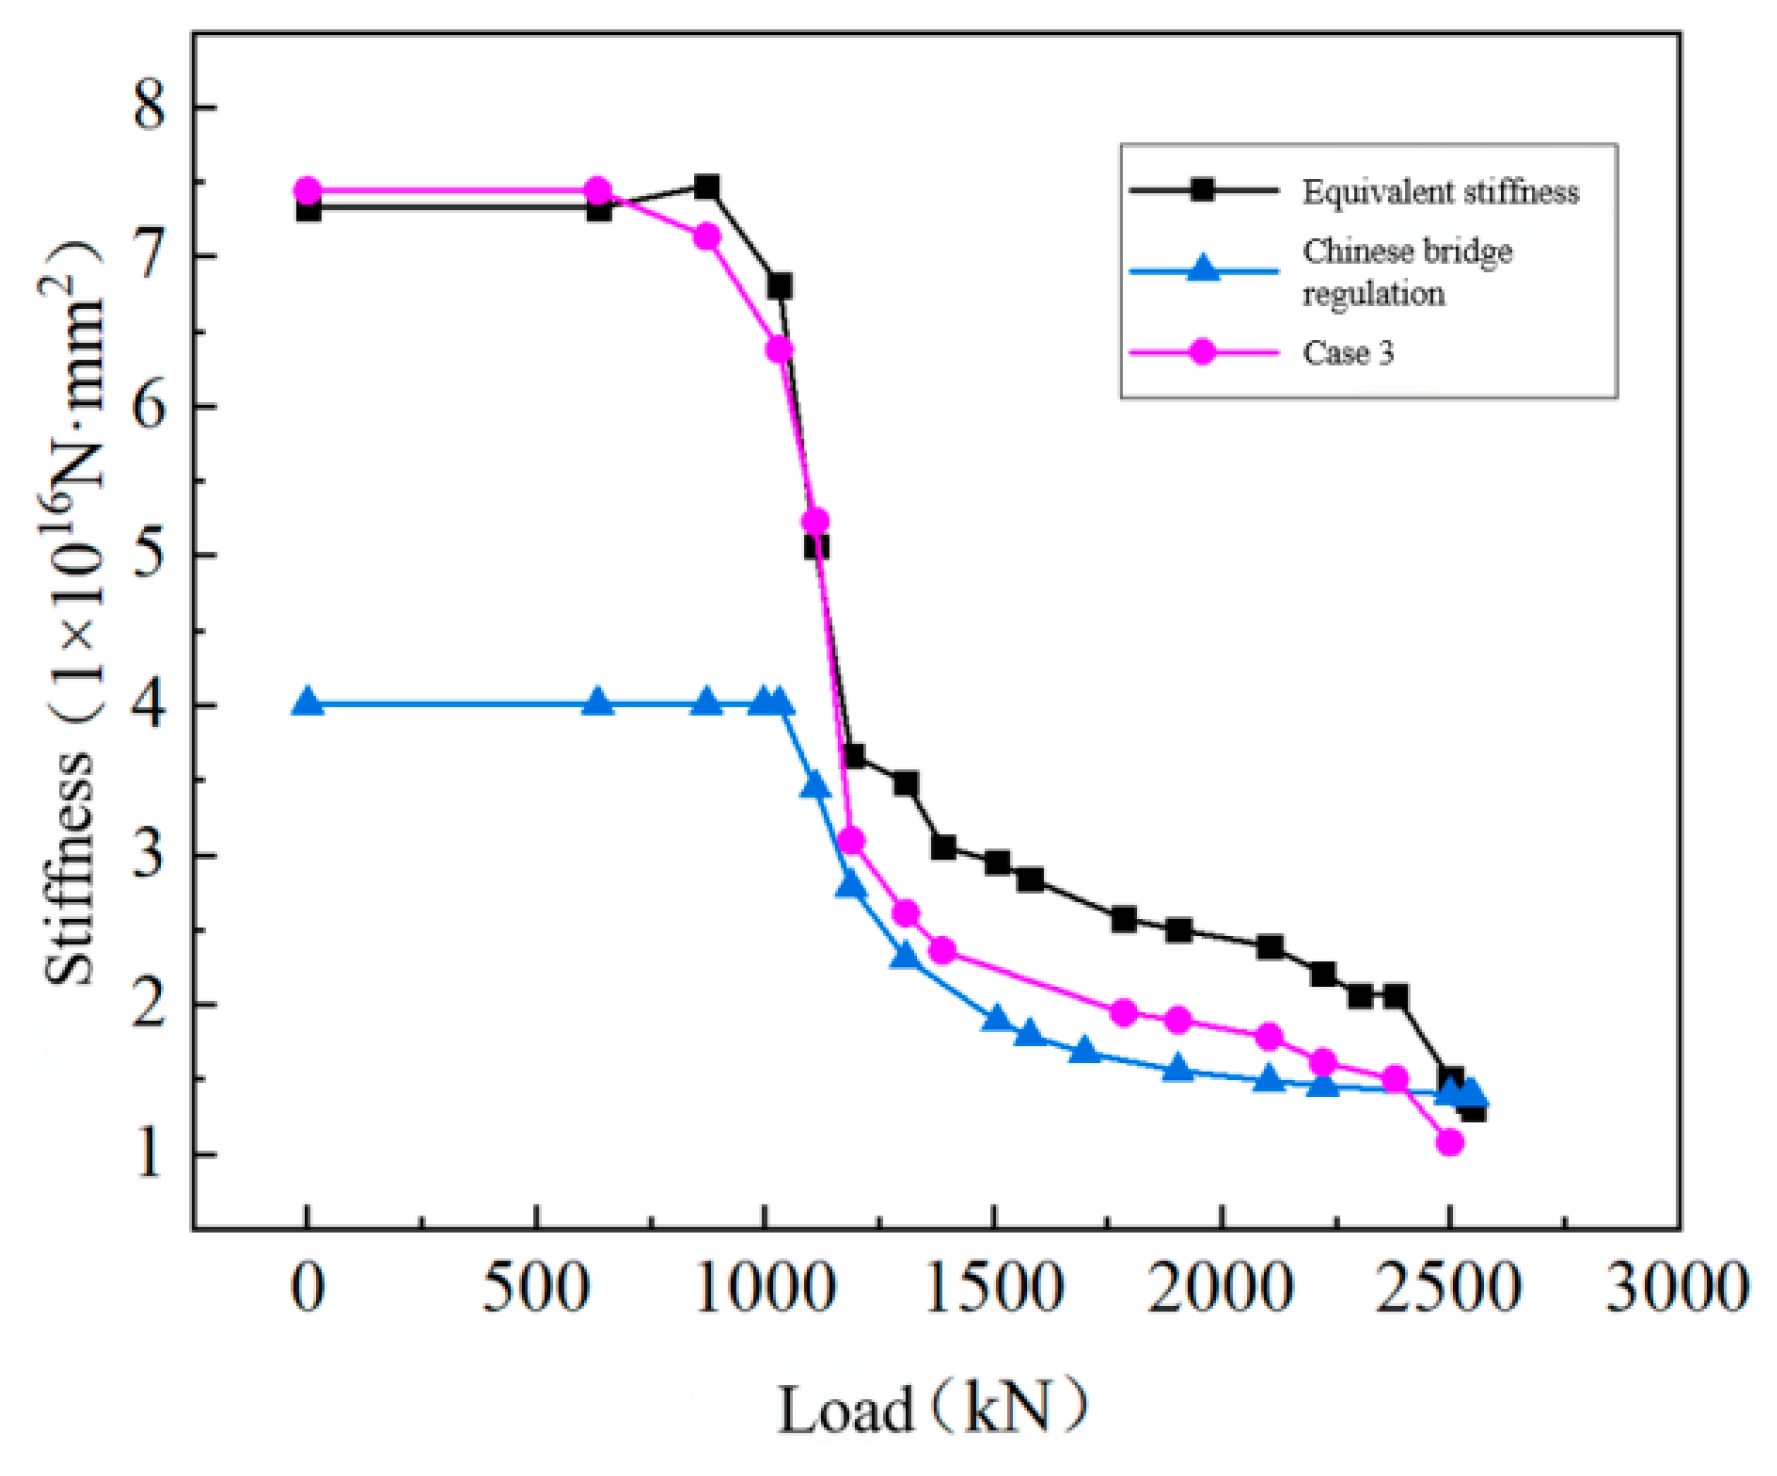
5.3. Comparison of the Calculation Results
6. Conclusions
- Before crack initiation, the stiffness remains constant. However, during the early stage of crack extension, the stiffness of the T-beam in the crack region decreases significantly. At this point, the stiffness of this area decreased by 31% compared to the initial value. As the crack continues to extend, the stiffness will gradually decrease until the beam ultimately fails or the steel undergoes tensile yielding.
- By comparing different standards and experimental data, we identified the applicable scope of different methods. When considering the beam as a whole, it is reasonable to use the equivalent stiffness as its overall stiffness before cracks form in the prefabricated concrete T-beam. Calculating the short-term stiffness of the mid-span section according to the specific code can effectively reflect the damage situation of the cracked section and is more suitable for the non-linear stage.
- The segmented stiffness prediction method based on system identification predicts the stiffness of T-beams by using multipoint deflection back-calculation. The stiffness obtained by segmented reverse prediction can effectively reflect the damage state of each segmented section throughout the entire failure test process. This method provides valuable insights into the extent of damage in each segment and helps to evaluate the overall structural integrity of the beam.
Author Contributions
Funding
Data Availability Statement
Conflicts of Interest
References
- He, S.H.; Zhao, X.M.; Ma, J.; Zhao, Y.; Qi, X.Z. Review of highway bridge inspection and condition assessment. China J. Highw. Transp. 2017, 30, 63. [Google Scholar]
- Guo, Z.; Shi, X. Principles and Analysis of Reinforced Concrete; Tsinghua University Press Co., Ltd.: Beijing, China, 2003. [Google Scholar]
- GB 50010Ministry of Housing and Urban Rural Development of the People’s Republic of China—2010 Code for Design of Concrete Structures, China Construction Industry Press: Beijing, China, 2011.
- JTG G 3362; Ministry of Communications of the PRC—2018 Design Code for Reinforced Concrete and Prestressed Concrete Bridges and Culverts on Highways. People’s Communications Publishing House: Beijing, China, 2018.
- Institute A C. ACI 318-11; Building Code Requirements for Structural Concrete and Commentary. ACI Committee Institute: Farmington Hills, MI, USA, 2011.
- Standardization E C F. EN 1992-1-1:2004 Eurocode 2; Design of Concrete Structures-Part 1-1: General Rules and Rules for Buildings. European Committee for Standardization: Brussels, Belgium, 2004.
- Hu, Z.; Wang, Y.; Hu, Z.; Liu, C.; Dai, T. Test Study of Flexural Stiffness of Prestressed Concrete Beams with Cracks. Bridge Constr. 2012, 42, 37–43. [Google Scholar]
- Ismail, Z.; Kuan, K.K.; Yee, K.S.; Chao, O.Z. Examining the trend in loss of flexural stiffness of simply supported RC beams with various crack severity using model updating. Measurement 2014, 50, 43–49. [Google Scholar] [CrossRef]
- Ye, J.; Zhang, F. Stiffness degeneration model of prestressed concrete continuous box girder after cracking. China J. Highw. Transp. 2007, 20, 67. [Google Scholar]
- Xu, X.; Zhang, F.; Wei, C. Stiffness damage assement of prestressed concrete box-girder after cracking. Eng. Mech. 2015, 32, 95–102. [Google Scholar]
- Du, J.; Liu, X. Calculation of deflection and crack width in unbonded partially prestressed concrete beams. China J. Highw. Transp. 2000, 13, 70. [Google Scholar]
- Zhang, Z.; Gu, S. Calculation of effective stiffness after cracking of reinforced concrete beams. Tianjin Constr. Sci. Technol. 2022, 32, 25–30. [Google Scholar]
- Du, J.; Wang, J.; Wei, J.; Li, Y.; Niu, H. Methods for calculating cracking moment and flexural stiffness of recycled concrete beams. China J. Highw. Transp. 2019, 32, 93. [Google Scholar]
- Du, M.; Su, X. Stiffness unity of concrete beams considering tensile strain lagging of prestressing tendons. J. Huazhong Univ. Sci. Technol. (Nat. Sci. Ed.) 2017, 45, 45–50. [Google Scholar]
- Zhou, Y.; Wang, Y.Y. Calculation Method on Flexural Stiffness of Reinforced Concrete Short Beam Strengthened by CFRP. China Civ. Eng. J. 2020, 53, 9–20. [Google Scholar]
- Wang, C.; Wang, S.; Zhao, T.; Duan, L.; Wang, X. Flexural behavior tests of full-scale concrete T girders with steel-UHPFRC composite strengthening. J. Chang. Univ. (Nat. Sci. Ed.) 2018, 38, 117–126. [Google Scholar]
- Yu, Z.; He, S.; Ren, L.; Liu, D. Research on Residual Bearing Capacity Calculation Method and Changing Law of Damaged Prestressed Concrete Box Girder. China J. Highw. Transp. 2021, 34, 242. [Google Scholar]
- Wang, C.; Shen, Y.; Zou, Y.; Li, T.; Feng, X. Stiffness degradation characteristics destructive testing and finite-element analysis of prestressed concrete t-beam. Comput. Model. Eng. Sci. 2018, 114, 75–93. [Google Scholar]
- A Review of Academic Research on Bridge Engineering in China, 2021. J. China Highw. 2021, 34, 1–97.
- JTG D60-2004; General Specifications for Design of Highway Bridges and Culverts. Ministry of Transport of the People’s Republic of China: Beijing, China, 2015.
- CJJ 11-2011; Code for Design of Urban Bridges. Ministry of Housing and Urban Rural Development of the People’s Republic of China: Beijing, China, 2012.
- Deng, M.; Xu, J.; Zhao, B. System identification method for reinforced concrete beam structure status. J. Zhengzhou Univ. Light Ind. 2004, 2, 34–36. [Google Scholar]
- Yao, H. Analysis of the Full-Scale Static and Dynamic Stiffness Test Process of Precast Prestressed Concrete Box Girders. Ph.D. Thesis, Chang’an University, Changan, China, 2020. [Google Scholar]






| Loading Steps | Number of Loading Cycles | Value at the End of Each Loading (kN) | Loading Description |
|---|---|---|---|
| 1 | / | 0 | Self-weight |
| 2 | / | 315 | Preloading in three stages |
| 3 | 1 | 630 | 0–315: Single loading; 315–630: About 100 kN per stage |
| 5 | 2 | 1030 | 0–630: About 300 kN per stage; 630–800: About 100 kN per stage; 800–Cracking: About 800 kN per stage |
| 6 | 3 | 1110 | 0–630: About 300 kN per stage; 630–1110: About 100 kN per stage |
| 7 | 4 | 1190 | 0–630: About 300 kN per stage; 630–1190: About 100 kN per stage |
| 8 | 5 | 1300 | 0–917: About 300 kN per stage; 917–1300: About 100 kN per stage |
| 10 | 5 | 1500 | 0–917: About 300 kN per stage; 917–1500: About 100 kN per stage |
| 11 | 7 | 1580 | 0–1190: About 300 kN per stage; 1190–1580: About 100 kN per stage |
| 12 | 8 | 1700 | 0–1500: About 300 kN per stage; 1508–1700: About 100 kN per stage |
| 14 | 9 | 1900 | 0–1780: About 300 kN per stage; 1780–1900: About 100 kN per stage |
| 16 | 10 | 2100 | 0–1780: About 300 kN per stage; 1780–2100: About 100 kN per stage |
| 17 | 11 | 2220 | 0–2100: About 300 kN per stage; 2100–2220: About 100 kN per stage |
| 20 | 12 | 2500 | 0–2100: About 300 kN per stage; 2100-Steel reinforcement yield: About 80 kN per stage; Steel reinforcement yield–2500: About 40 kN per stage |
| 21 | 13 | 2540 | 0–2100: About 300 kN per stage; 2100–2300: About 100 kN per stage; 2300–2500: About 80 kN per stage; 2500–2540: About 40 kN per stage |
| 22 | 14 | 2550 | 0–2100: About 300 kN per stage; 2100–2300: About 100 kN per stage; 2300–2500: About 80 kN per stage; 2500–2540: About 40 kN per stage; 2550–Failure of T-beam |
| Design Bending Moment (kN·m) | Experimental Bending Moment (kN·m) | Loading Efficiency | |
|---|---|---|---|
| Experimental T-beam | 7594.5 | 7746.4 | 1.02 |
| Load (kN) | Deflection (mm) | Stiffness (1 × 10¹⁶ N·mm2) | Reduction Coefficient |
|---|---|---|---|
| 630 | −20.82 | 7.33 | 1.00 |
| 870 | −28.18 | 7.47 | 1.02 |
| 1030 | −36.62 | 6.81 | 0.93 |
| 1110 | −53.03 | 5.07 | 0.69 |
| 1190 | −78.52 | 3.67 | 0.50 |
| 1300 | −90.29 | 3.49 | 0.48 |
| 1500 | −122.95 | 2.95 | 0.40 |
| 1580 | −134.63 | 2.84 | 0.39 |
| 1700 | −167.24 | 2.58 | 0.35 |
| 1900 | −183.85 | 2.50 | 0.34 |
| 2100 | −212.54 | 2.39 | 0.33 |
| 2220 | −243.47 | 2.21 | 0.30 |
| 2300 | −269.44 | 2.07 | 0.28 |
| 2500 | −401.33 | 1.51 | 0.21 |
| 2540 | −452.24 | 1.36 | 0.19 |
| 2550 | −473.28 | 1.30 | 0.18 |
| Load (kN) | Short-Term Bending Stiffness (1016 N·mm2) | Reduction Coefficients | ||||||
|---|---|---|---|---|---|---|---|---|
| Ref. [3] | Ref. [4] | Ref. [5] | Ref. [6] | Ref. [3] | Ref. [4] | Ref. [5] | Ref. [6] | |
| 630 | 3.62 | 4.01 | 4.22 | 4.22 | 1.00 | 1.00 | 1.00 | 1.00 |
| 870 | 3.62 | 4.01 | 4.22 | 4.22 | 1.00 | 1.00 | 1.00 | 1.00 |
| 1030 | 3.62 | 4.01 | 4.22 | 4.22 | 1.00 | 1.00 | 1.00 | 1.00 |
| 1110 | 3.24 | 3.45 | 3.91 | 3.60 | 0.90 | 0.86 | 0.93 | 0.85 |
| 1190 | 2.73 | 2.79 | 3.40 | 2.87 | 0.75 | 0.70 | 0.81 | 0.68 |
| 1300 | 2.30 | 2.31 | 2.89 | 2.35 | 0.64 | 0.58 | 0.68 | 0.56 |
| 1500 | 1.88 | 1.89 | 2.31 | 1.91 | 0.52 | 0.47 | 0.55 | 0.45 |
| 1580 | 1.77 | 1.79 | 2.15 | 1.81 | 0.49 | 0.45 | 0.51 | 0.43 |
| 1700 | 1.65 | 1.68 | 1.97 | 1.70 | 0.46 | 0.42 | 0.47 | 0.40 |
| 1900 | 1.50 | 1.56 | 1.75 | 1.57 | 0.41 | 0.39 | 0.41 | 0.37 |
| 2100 | 1.40 | 1.49 | 1.62 | 1.49 | 0.39 | 0.37 | 0.38 | 0.35 |
| 2220 | 1.36 | 1.46 | 1.56 | 1.46 | 0.38 | 0.36 | 0.37 | 0.35 |
| 2500 | 1.27 | 1.40 | 1.45 | 1.40 | 0.35 | 0.35 | 0.34 | 0.33 |
| 2540 | 1.26 | 1.39 | 1.44 | 1.39 | 0.35 | 0.35 | 0.34 | 0.33 |
| 2550 | 1.26 | 1.39 | 1.44 | 1.39 | 0.35 | 0.35 | 0.34 | 0.33 |
| Condition Category | Description |
|---|---|
| Case1 | Considering the beam as a whole, the entire beam has the same modulus. |
| Case2 | Divide the beam into two sections, with units 1–13 as the first section including mid-span and elements 14–25 as the second section. During the back-calculation, output two moduli of each section separately. |
| Case3 | Divide the beam into three sections, with elements 1–8 as the first section, elements 9–17 as the second section, and elements 18–25 as the third one. During the back-calculation, output three moduli of each section separately. |
Disclaimer/Publisher’s Note: The statements, opinions and data contained in all publications are solely those of the individual author(s) and contributor(s) and not of MDPI and/or the editor(s). MDPI and/or the editor(s) disclaim responsibility for any injury to people or property resulting from any ideas, methods, instructions or products referred to in the content. |
© 2024 by the authors. Licensee MDPI, Basel, Switzerland. This article is an open access article distributed under the terms and conditions of the Creative Commons Attribution (CC BY) license (https://creativecommons.org/licenses/by/4.0/).
Share and Cite
Hu, B.; Cai, Y.; Liu, H.; Wu, W.; He, B. The Stiffness Change in Pre-Stressed Concrete T-Beams during Their Life-Cycle Based on a Full-Scale Destructive Test. Appl. Sci. 2024, 14, 5200. https://doi.org/10.3390/app14125200
Hu B, Cai Y, Liu H, Wu W, He B. The Stiffness Change in Pre-Stressed Concrete T-Beams during Their Life-Cycle Based on a Full-Scale Destructive Test. Applied Sciences. 2024; 14(12):5200. https://doi.org/10.3390/app14125200
Chicago/Turabian StyleHu, Bin, Yingchun Cai, Heng Liu, Wenqi Wu, and Baixue He. 2024. "The Stiffness Change in Pre-Stressed Concrete T-Beams during Their Life-Cycle Based on a Full-Scale Destructive Test" Applied Sciences 14, no. 12: 5200. https://doi.org/10.3390/app14125200
APA StyleHu, B., Cai, Y., Liu, H., Wu, W., & He, B. (2024). The Stiffness Change in Pre-Stressed Concrete T-Beams during Their Life-Cycle Based on a Full-Scale Destructive Test. Applied Sciences, 14(12), 5200. https://doi.org/10.3390/app14125200


