Article

Adaptive Detection and Classification of Brain Tumour Images Based on Photoacoustic Imaging

School of Physics and Information Technology, Shaanxi Normal University, Xi’an 710119, China
*
Author to whom correspondence should be addressed.
Appl. Sci. 2024, 14(12), 5270; https://doi.org/10.3390/app14125270
Submission received: 17 May 2024 / Revised: 15 June 2024 / Accepted: 17 June 2024 / Published: 18 June 2024
(This article belongs to the Special Issue AI-Based Biomedical Signal Processing)

Abstract

:
A new imaging technique called photoacoustic imaging (PAI) combines the advantages of ultrasound imaging and optical absorption to provide structural and functional details of tissues. It has broad application prospects in the accurate diagnosis and treatment monitoring of brain tumours. However, the existing photoacoustic image classification algorithms cannot effectively distinguish benign tumours from malignant tumours. To address this problem, the YoLov8-MedSAM model is proposed in this research to provide precise and adaptable brain tumour identification and detection segmentation. Additionally, it employs convolutional neural networks (CNNs) to classify and identify tumours in order to distinguish between benign and malignant variations in PAI. The experimental results show that the method proposed in this study not only effectively detects and segments brain tumours of various shapes and sizes but also increases the accuracy of brain tumour classification to 97.02%. The method provides richer and more valuable diagnostic information to the clinic and effectively optimizes the diagnosis and treatment strategy of brain tumours.

1. Introduction

Malignant tumours of the brain are one of the major fatal diseases in humans worldwide [1,2]. In recent years, the incidence of brain tumours has continued to rise, posing a serious threat to human brain health [3,4]. According to the international authoritative medical journal The Lancet’s global brain tumour data, there is high morbidity and mortality from brain tumours worldwide [5]. The therapeutic effects of brain tumours largely depend on the accurate judgement of the benign or malignant nature of the tumour during early detection [6,7,8]. Therefore, the correct classification of brain tumour detection is an important part of diagnosis and treatment.
Currently, the main methods of detecting brain tumours include computed tomography (CT) and magnetic resonance imaging (MRI). Physicians can see and evaluate the location, size, and morphological characteristics of tumours with the aid of these precise structural images of the brain [9,10]. However, CT scans are associated with risks of radiation exposure and allergy to contrast agents [11], as well as relatively low image resolution, and MRI scans are not conducive to urgent diagnostic needs due to the inability to provide immediate images from prolonged scanning time [12], resulting in delayed or inadequate treatment, particularly in emergency situations such as first aid. PAI, as a non-invasive imaging technique based on acoustic and optical principles, is important in the detection and diagnosis of brain tumours [13,14].
Brain tumour image detection and classification methods mainly include traditional algorithms and deep learning methods. Threshold-based segmentation algorithms and hand-designed feature-based methods are traditional image detection segmentation algorithms that need to rely on predefined rules and features and the lack of adaptivity to the image. He et al. [15] proposed a new method for MR brain image segmentation based on 2D corpus callosum segmentation, which is semiautonomous and requires a user interruption to initialise the seed contour for correct segmentation. The proposed method has less computational time and relies on sufficient intensity selection using a Canny edge detection operator. Li et al. [16] proposed an unsupervised MRI segmentation method based on Self-Organising Feature Mapping (SOFM), which is combined with a Markov Random Field (MRF) model to extract the redundant spatial pixel region information. By combining MRF and SOFM, it is possible to accurately detect MR abnormal regions in the image.
Deep learning methods have been widely used in brain tumour detection and classification. Neelum et al. [17] used pre-trained Inception-v3 and DenseNet201 deep learning models to extract features by concatenation with the help of the softmax classifier for the brain tumour detection and classification task. Ahmad Habbie et al. [18] acquired MRI T1-weighted images and used a semiautomated segmentation method to analyse the likelihood of brain tumours using an active contour model, and the data showed that the edge-free morphologically active contour (MGAC) outperformed the other methods in terms of performance. DR. Akey Sungheetha and Rajesh Sharma R [19], on the other hand, applied Gabor transform as well as soft clustering and hard clustering techniques to detect the edges of CT and MRI images, and K-mean clustering was used to group the similar features and represent the histogram attributes of the images with fuzzy c-means. Jiayao Zhang et al. [14] proposed an SVM algorithm based on SIFT feature extraction and K-mean clustering for classifying and recognising photoacoustic breast cancer images while applying deep learning algorithms. AlexNet and GoogLeNet achieved recognition accuracies of about 87.69% and 91.18%, respectively. Traditional algorithms need to rely on predefined rules and features and lack adaptability to images [20]. In deep learning algorithms, there are problems of low recognition accuracy, high training complexity, and inapplicability to polymorphic target detection and recognition.
To address this problem, this paper proposes the YoLov8-MedSAM model for the adaptive detection segmentation of brain tumour images, which can effectively distinguish brain tumours from normal brain tissue and provide more comprehensive morphological features of tumours. The segmented brain tumours were classified and identified using a CNN [21,22,23,24]. The experimental results show that in a single classification method, when a CNN is directly used to extract features and classify and identify photoacoustic brain tumour images, it may lead to a decrease in classification accuracy due to the large amount of irrelevant information contained in the images. The brain tumour information is extracted by applying the model presented in this paper to detect the segmentation of the simulated generated photoacoustic brain tumour images. The CNN is then used to classify and identify the brain tumour, with a significantly higher accuracy rate than with the traditional methods.

2. Materials and Methods

2.1. An Overview of the Framework

The overall framework proposed in this paper is shown in Figure 1, including four steps of photoacoustic image generation, deep learning image detection segmentation, image classification, and result analysis, which are comprehensively applied to brain tumour diagnosis. Firstly, brain tumour images are simulated using k-wave [25]; secondly, brain tumour images are detected and segmented using YoLov8-MedSAM to segment the desired tumour portion; next, the segmented brain tumours are classified and identified using CNNs to classify the brain tumours into different types; and finally, the results of the deep learning model are evaluated and validated.

2.2. Photoacoustic Simulation Image

The k-wave employs the K-wave pseudo-spectral method for modelling the propagation and reconstruction process of photoacoustic waves in various media. For each image in the dataset, a homogeneous medium is defined with a grid size of 256 × 256 pixels for the initial photoacoustic source, a sound velocity of 1500 m/s, and an attenuation coefficient of 0.75 d B / ( M H z · c m), similar to that of soft tissue in vivo. The sensor array has 128 equally spaced detectors on a circle with a radius of 100 pixels to receive the photoacoustic waves, and a built-in function of k-wave is used to simulate the sampling of photoacoustic pressure. Images were reconstructed from the simulated photoacoustic time series data using the time reversal (TR) method, as shown in Figure 2.
Using k-wave simulation to obtain detailed information about tissue structure and density from CT and MRI, the images are processed, and their grey value information is used to define the initial pressure distribution during the simulation process, thus generating photoacoustic contrast from CT or MRI, as shown below: Firstly, the original images are loaded and processed, and the initial pressure distributions are defined based on their information mapping. Secondly, the simulation parameters are set up, defining the geometry and medium parameters of the acoustic field, the position of the transducers, and the number of them. Then, the simulation process is run, and the time evolution of the acoustic field in a 2D homogeneous medium is calculated using a simulation function that returns the time series recorded at the detector positions defined by the sensor mask when the time loop is completed. Finally, the time-varying pressures recorded on the detector array are reconstructed to obtain a simulated photoacoustic image.

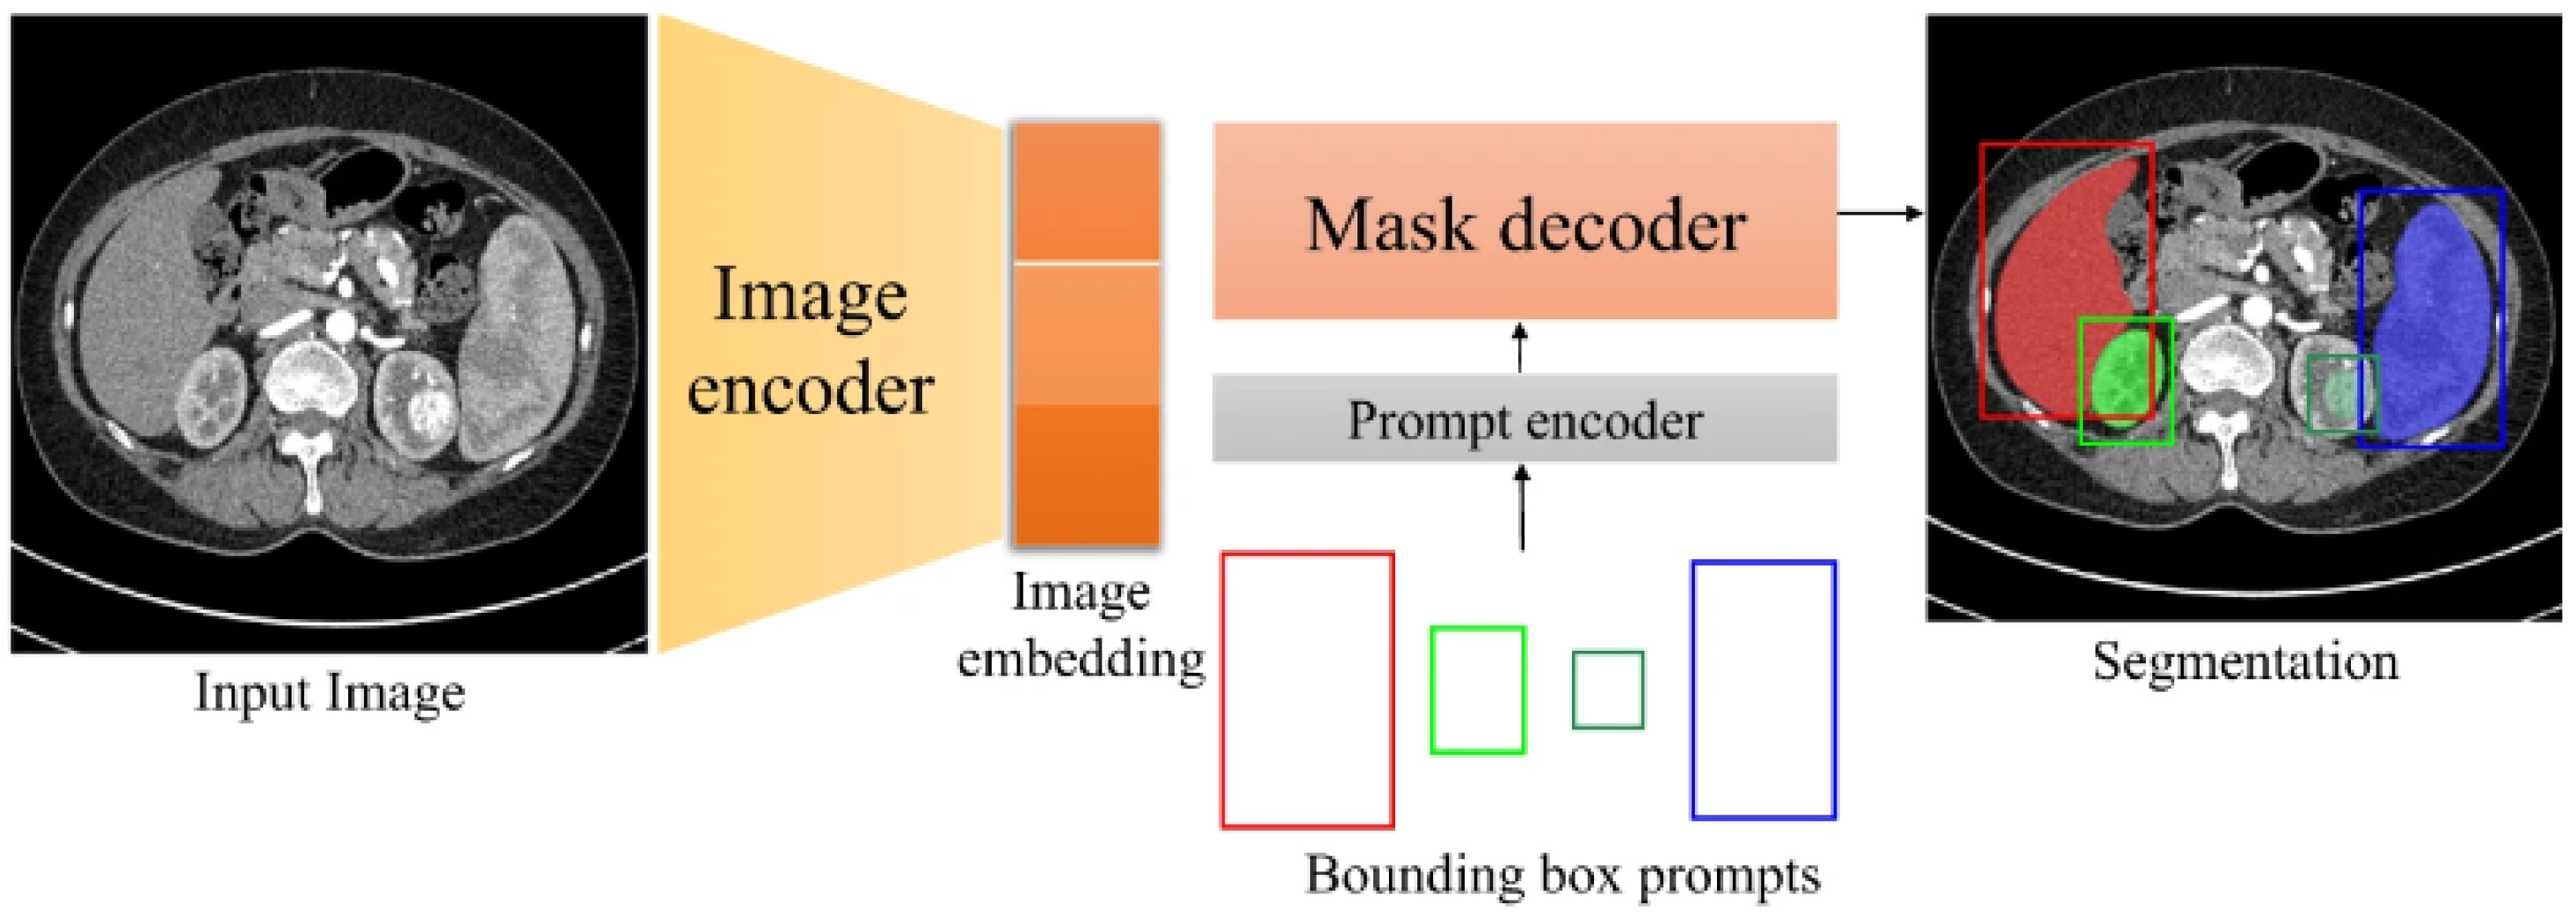
2.3. Deep Learning Algorithm for Brain Tumour Detection Segmentation

Brain tumour detection segmentation is a key task in medical imaging analysis. Existing detection segmentation methods suffer from the lack of effective adaptivity to adequately adapt to different scenes and data feature changes. The YoLov8-MedSAM model proposed in this paper is based on the YoLov8 algorithm [26,27,28] for the target detection of photoacoustic brain tumour images which accurately locates and labels brain tumour regions and subsequently uses the MedSAM model to directly segment the labelled regions with different brain tumour sizes and shapes without the need to input the user-drawn bounding box. The YoLov8-MedSAM model proposed in this paper can effectively solve the problem of the lack of adaptivity of existing methods, achieve the accurate detection and segmentation of photoacoustic brain tumour images, and provide an efficient and reliable auxiliary tool for medical imaging diagnosis, and its model overview diagram is shown in Figure 3.
YOLOv8 is an advanced neural network architecture for target detection, known for its efficient real-time detection and accuracy [26]. Its core architecture consists of a deep convolutional neural network, which combines multi-scale feature fusion and an attention mechanism to achieve accurate target localisation with precision, and the network structure is shown in Figure 4. The YOLO model [29] is different from the two-stage detectors of the R-CNN family, and the single detector is more focused on predicting the position and category of the object at the same time, which can be focused on predicting both the position and category of objects at the same time and achieve faster and high detection accuracy, which is suitable for various application scenarios of real-time target detection tasks.
The YoLov8 model [28,30,31] consists of four components: input, Backbone, Neck, and Head. Among them, Backbone is responsible for feature extraction and employs the C2f module and SPPF for feature fusion [32]; Neck employs FPN and PAN to achieve multi-scale feature fusion; the Head component switches from an anchor-based to an anchor-free approach and uses task-oriented allocators to perform positive–negative sample matching. The YoLov8 model ultimately achieves small, medium, and large target accurate prediction.
MedSAM is a deep learning-based medical image segmentation network that is a fine-tuning of the network architecture of SAM [26]. MedSAM incorporates convolutional neural networks (CNNs) and Recurrent Neural Networks (RNNs) and introduces state-of-the-art techniques such as dense connectivity and attention mechanisms. As the first basic model in the field of general purpose medical image segmentation, MedSAM is able to accurately identify and describe important regions in medical images, such as tumours or other tissue lesions, and the model includes specific components and ways of interaction of neural grids and neural networks. The model follows the network architecture in SAM and includes an image encoder, a cue encoder, and a mask decoder, as shown in Figure 5. The image encoder maps the input image to a high-dimensional image embedding space, the cue encoder converts the user-drawn bounding box into a feature representation by positional encoding, and finally, the mask decoder fuses the image embedding and the cue features using cross-attention. The network uses pre-trained convolutional neural networks (e.g., ResNet, VGG, or U-Net) to capture the features underlying medical images. The network has the ability to accurately segment lesion regions and extract key feature information, providing physicians with an efficient and reliable diagnostic aid.

2.4. Deep Learning Algorithms for Brain Tumour Classification

A convolutional neural network (CNN) as an image classification algorithm has the ability to abstract and generalise image features with efficient computational performance, which can effectively extract features from photoacoustic brain tumour images, retain spatial information, and use large-scale data for end-to-end learning to achieve accurate classification tasks. The CNN classification algorithm [15,23,33] used in this paper shows the best results in classifying photoacoustic brain tumour images, and its network structure consists of a convolutional layer, a pooling layer, and a fully connected layer [34]. The convolutional layer is the core component of a CNN which extracts the local features of an image by sliding a convolutional kernel over the input image to perform convolutional operations. The spatial invariance of the features can be extracted using a maximum pooling layer. After multiple convolutional and pooling layers, the resulting feature map is spread into a one-dimensional vector, which is then classified by a fully connected layer. After the final fully connected layer, the output is usually transformed into a probability distribution representing the probability of each category using the softmax function.

3. Results and Discussion

3.1. Experimental Data

This research used the Brain Tumor Dataset provided by Ultralytics, which is a large dataset containing rich image and object annotation information. The 1041 brain tumour images from this database used in this research were screened from this dataset and contained 506 images of benign tumours and 535 images of malignant tumours of different locations, shapes, and sizes. These images are presented in JPEG format and cover medical images from MRI and CT scans, and each image is equipped with information about the presence, location, and characteristics of the brain tumour with corresponding annotation data.
The brain tumour dataset, after image preprocessing, annotation, and data enhancement, was divided into training, validation, and test sets at a ratio of 7:2:1, which were fed into the k-wave simulation model to obtain the brain tumour PAI. Subsequently, the YoLov8-MedSAM model was used for the automatic detection and segmentation of brain tumour regions. Finally, the CNN model was used to classify and identify the brain tumour regions, and the labels were divided into two categories: “positive” and “negative”.

3.2. Indicators for Model Evaluation

3.2.1. Accuracy, Precision, Recall, Confusion Matrix, Sensitivity, Dice Coefficient, and Specificity

Accuracy is the proportion of correctly predicted pixels to the total pixels, while precision is a measure of the model’s ability to avoid false positives, where TP (true positive) predicts the number of positive classes as positive classes, i.e., correct prediction, true is 0, and prediction is also 0, FN (False Negative) predicts the number of positive classes as negative classes, i.e., incorrect prediction, true is 0, and prediction is 1, FP (false positive) predicts the number of negative classes as positive classes, i.e., incorrect prediction, true is 1, and prediction is 0, and TN (true negative) predicts the negative class as the number of negative classes, i.e., correct prediction, true 1 and prediction 1.
a c c u r a c y = T P + T N T P + F N + F P + T N
p r e c i s i o n = T P T P + F P
Recall emphasises the ability of the model to find all targets.
r e c a l l = T P T P + F N
Sensitivity [27], also known as recall, measures the model’s ability to identify positive examples. It is defined as the proportion of all true positive cases that are correctly predicted as positive by the model, and Specificity measures the model’s ability to identify negative cases. It is defined as the proportion of all true negative examples that are correctly predicted as negative by the model. The Dice coefficient is an ensemble similarity measure function that is typically used to calculate the similarity of two samples.
S e n s i t i v i t y = T P T P + F N
S p e c i f i c i t y = T N F P + T N
Dice = 2 × T P 2 × T P + F P + F N

3.2.2. F1 Confidence Level

The F1 confidence level [28] is the reconciled average of precision and recall and is a balanced evaluation metric that combines model accuracy and the checking rate. In the F1 curve, the horizontal axis indicates the range of variation in the threshold, and the vertical axis indicates the F1 score under the corresponding threshold.

3.3. Detection and Segmentation Experiment Results and Analysis

In this experiment, the YoLov8-MedSAM model is used to achieve fast, accurate, and automatic brain tumour region detection and segmentation. The model inputs the preprocessed photoacoustic brain tumour image into the YOLOv8 target detection model, which outputs the photoacoustic brain tumour image with block diagrams, and then the output of YOLOv8 is used as the input of MedSAM to achieve faster and higher quality segmentation operation and the accurate segmentation of brain tumour regions. The corresponding photoacoustic brain tumour image segmentation map can be obtained directly after detection by the YoLov8-MedSAM model. The model is able to effectively handle variations in different sizes and tumour shapes, adapt to changing image conditions by self-adjusting the internal parameters and convolution kernel, and accurately segment the tumour region.
As shown in Figure 6, the YoLov8-MedSAM detection segmentation model is able to accurately segment tumour regions with different locations, shapes, and sizes, and the model can better remove useless information from brain tumour images and identify benign and malignant brain tumours more effectively. In Figure 6a, the morphology of the malignant tumour shows tiny and irregular features, and the complexity of its edges increases significantly, showing features such as tiny lobes, irregular protrusions and tiny depressions, etc. Such morphological features reflect the heterogeneity of the internal tissues of the tumour and the complexity of its structure, and the model shows the high-resolution perception of the tumour edges and the precision localisation of the edges of the tumour by accurately identifying and segmenting these complicated features. In Figure 6b, it can be intuitively observed that the malignant tumour presents a complex edge morphology, showing irregular contours with features such as branches, sharp protrusions, and discontinuous edges. The model accurately segments these edge features and effectively retains the edge detail information, demonstrating a high degree of sensitivity and resolution to the tumour morphology. In Figure 6c,d, the morphology of benign tumours shows smooth features, and the complexity of their edges is significantly reduced with clear contours, which intuitively shows that the model better segments benign tumours, and the subsequent classification of these tumours has a good basis. In summary, the model proposed in this paper can effectively delineate the boundary between the tumour tissue and the surrounding normal tissue, has good segmentation accuracy and a sensitive recognition of microstructures, and can continuously optimise the prediction strategy according to the actual segmentation results to improve the adaptability to new samples.
Figure 7 shows the confusion matrix of the trained YoLov8-MedSAM model in different categories (“positive” and “negative”), reflecting its detection performance. The model shows the best recognition performance in the “positive” category of brain tumours, followed by the “negative” category. The confusion value for the “negative” category is 0.09, indicating a high level of confusion with the background. The “positive” category has a confusion value of 0.06, indicating a relatively low level of confusion with the background. This confusion may be due to the small size of some of the tumour labels in the ‘negative’ category, which makes them easier to confuse with the background.
By looking at the F1 confidence curve graph in Figure 8, it can be seen that the three curves represent different categories. These curves all show a trend of increasing and then decreasing, where the negative sample category curve performs well at lower confidence thresholds, but the performance gradually decreases as the threshold increases. By analysing the F1 confidence curve graphs, we find that the model’s performance on different categories varies with the confidence threshold and reaches the best performance under a specific threshold, indicating that the model is more capable of identifying negative sample categories.
Figure 9 shows the box and mask loss maps of the YoLov8-MedSAM model in this study during the training and validation phases, aiming to assess the reliability of the model training process. From the figure, it can be observed that the bounding box (box_loss), classification (cls_loss), and distribution focus (dfl_loss) loss maps present a similar structure in training and validation. The results show that the bounding box loss value decreases to around 0.9 or so within 100 epochs during training and validation. Similarly, the other classification and distribution focus loss values show a similar trend. These results show that the loss values during training and validation are close to each other, indicating that the model has good generalisation ability. The model demonstrated robustness and reliability during training and validation, providing strong support for it to be a powerful tool in the field of brain tumour detection and segmentation in practical applications.
As seen in Table 1, the Dice Score for background is 88.07%, which means that the model is better at segmenting the background region, and almost all of the background is correctly identified with an accuracy of 96.52%, which further confirms the Dice Score results. The Dice Score for tumours is 81.35, which means that the model’s segmentation of the tumour region is relatively slightly inferior, and some tumours may be missed, or non-tumour regions are incorrectly labelled as tumours. Taken together, although the Dice Score of the tumour region is low, the model has a high accuracy in tumour identification, which can reach 94.23%.

3.4. CNN Classification Experiment Results and Analysis

In this experiment, a convolutional neural network (CNN) was used to classify and identify photoacoustic brain tumour images. The experiment was designed to compare the classification results of the original image with the segmented tumour region in order to assess the impact of the segmentation algorithm on the classification recognition. The experimental results are shown in Table 2, and the recall of the original image is lower than that of the segmented image, indicating that the method proposed in this paper is more likely to enable the CNN to detect and identify the brain tumour information. The precision, recall, and accuracy of brain tumour image classification after the detection of segmentation were significantly improved over the original brain tumour image. Among them, the accuracy rate is improved by 2.09%, recall rate by 0.73%, and precision rate by 1.33%, which shows the effectiveness of the method proposed in this paper.
Figure 10 shows the results of CNN classification training, where Figure 10a is the classification of photoacoustic brain tumour images, and Figure 10b is the classification of segmented brain tumour images. In the original photoacoustic brain tumour as in Figure 10a, the confusion between the “positive” category and the “negative” category was 0.04, and the confusion between the “negative” category and the “Positive” category was 0.08, however, in the segmented classification as in Figure 10b, the confusion between “Positive” category and “Negative” category was 0.02, “Negative” category and “Negative” category was 0.02, and “Negative” category and “Negative” category were 0.08, and “Negative” category was 0.08. category is 0.02, and the confusion between the “negative” and “positive” categories is 0.04. By comparing the results of Figure 10a,b, it can be observed that, under the same classification model, the binary classification confusion value of the segmented brain tumour image is reduced as compared to Figure 10a. This indicates that the segmented brain tumour image highlights the information related to the tumour more and removes the background information that is not related to the tumour, which makes the features obtained by the model in the learning process more salient and discriminative. Therefore, the segmented brain tumour image shows significant improvement on the classification task compared to the original image.
According to Table 3, it can be seen that Specificity (Specificity) reflects the ability of the method to correctly identify non-tumour tissues, which increased from 92.31% to 96.08%, indicating a reduction in the false alarm rate and an enhanced ability to differentiate between normal brain tissues. Sensitivity, on the other hand, measured the ability to correctly detect tumours and improved from 94.07% to 98.03%, showing the enhanced ability of the proposed method in identifying tumours. It shows that the method proposed in this paper can provide a more reliable diagnostic tool in the application of photoacoustic imaging.
Table 4 lists the various current methods for brain tumour classification, and upon comparison, it is found that the method proposed in this paper has a significant improvement in classification accuracy. As the dataset used is different from other studies, the simulated photoacoustic tumour images are used for classification and compared with the method of this paper, and the results show that the accuracy of the method of this paper is significantly improved. The simulation of brain tumour images using the k-wave toolbox provides a new approach to the current phenomenon of the scarcity of medical data, and the image preprocessing performed in this paper greatly optimises the input image data and prevents the overfitting problem.

4. Conclusions

In this paper, the YoLov8-MedSAM model is proposed to achieve the adaptive detection and segmentation of photoacoustic brain tumour regions. The algorithm is able to efficiently identify and categorise tumour locations without pixel-level annotation by combining deep learning and medical image processing approaches. The experimental results show that the detection, segmentation, and classification processing of brain tumour images by the model proposed in this paper can improve the recognition and classification accuracy of brain tumours. Among them, the accuracy of the CNN classification results is improved by 3.01%, the recall rate is improved by 2.97%, and the precision rate is improved by 2.90%.
In summary, the model proposed in this paper provides an efficient and accurate new method for the automatic detection and segmentation of photoacoustic brain tumour regions. The model not only helps to improve the diagnosis and treatment of brain tumours but also can provide doctors with more convenient and efficient data processing tools, which has important clinical application value. The study in this paper proposes the YoLov8-MedSAM model, which, from the experimental results, is still to be improved for photoacoustic brain tumour detection segmentation, and the model still needs to be optimised.
The research in this paper still has limitations. For one thing, the different types of brain tumours were not studied in detail. To overcome this limitation, we plan to delve into the knowledge of relevant brain tumour types in future work. On the other hand, the performance of the YoLov8-MedSAM model on unseen data may be limited especially in the medical field, where the cross-institutional performance may be degraded by different hospital equipment and imaging conditions; we plan to use more brain tumour data to train the model and continuously optimise the model in future work to overcome this limitation. Therefore, we plan to collect more photoacoustic image data in future work and further annotate and optimise the data to improve the training effectiveness and generalisation ability of the deep learning model. Meanwhile, we plan to conduct more clinical experiments and validations in our future work to apply our method to clinical practice and evaluate its effectiveness and application prospects in real clinical environments. This will contribute more to further development and clinical applications in the field of photoacoustic image processing.

Author Contributions

Conceptualisation, Y.C.; methodology, Y.C.; software, Y.C.; validation, Y.C., R.H., Y.J., S.Y., Y.L. and J.Z.; data curation, Y.C.; writing—original draft preparation, Y.C.; writing—review and editing, Y.C., R.H., S.Y., Y.L., J.Z. and Y.J.; visualisation, R.H. and Y.J.; supervision, H.C.; funding acquisition, H.C. All authors have read and agreed to the published version of the manuscript.

Funding

This research was funded by National Natural Science Foundation of China (grant numbers 12374440).

Institutional Review Board Statement

Not applicable.

Informed Consent Statement

Not applicable.

Data Availability Statement

The original contributions presented in the study are included in the article, further inquiries can be directed to the corresponding author.

Acknowledgments

Our heartfelt thanks go to all those who have provided sincere and selfless support in the writing of this paper, especially my cohort Ruonan He and Yufei Jiang.

Conflicts of Interest

The authors declare no conflicts of interest.

References

  1. Focusing on brain tumours and brain metastasis. Nat. Rev. Cancer 2020, 20, 1. [CrossRef] [PubMed]
  2. Li, R. Precise intraoperative brain tumor classification. Nat. Biotechnol. 2023, 41, 1521. [Google Scholar] [CrossRef] [PubMed]
  3. Iyer, V.R.; Kuo, J.S. Emerging Frontiers of Therapeutic Strategies for Brain Tumors: A NeuroMolecular Medicine Special Issue Introduction. Neuromolecular Med. 2022, 24, 1–2. [Google Scholar] [CrossRef] [PubMed]
  4. Solar, P.; Hendrych, M.; Barak, M.; Valekova, H.; Hermanova, M.; Jancalek, R. Blood-Brain Barrier Alterations and Edema Formation in Different Brain Mass Lesions. Front. Cell. Neurosci. 2022, 16, 922181. [Google Scholar] [CrossRef] [PubMed]
  5. Kumaria, A. Tumor treating fields in pediatric brain tumors: Overcoming challenges. Childs Nerv. Syst. 2022, 38, 1847–1848. [Google Scholar] [CrossRef] [PubMed]
  6. Bruschi, M.; Grill, J.; Guerrini-Rousseau, L. Pediatric brain tumors as a developmental disease. Curr. Opin. Oncol. 2021, 33, 608–614. [Google Scholar] [CrossRef] [PubMed]
  7. Miller, K.D.; Ostrom, Q.T.; Kruchko, C.; Patil, N.; Tihan, T.; Cioffi, G.; Fuchs, H.E.; Waite, K.A.; Jemal, A.; Siegel, R.L.; et al. Brain and other central nervous system tumor statistics, 2021. CA Cancer J. Clin. 2021, 71, 381–406. [Google Scholar] [CrossRef] [PubMed]
  8. Wang, Y.; Wang, Z.; Hua, C.; Xu, Y.; Li, Y.; Zhao, G. Primary malignant brain tumors following systemic malignancies: A population-based analysis. Neuroepidemiology 2023, 56, 452–459. [Google Scholar] [CrossRef] [PubMed]
  9. Al-Kadi, O.S.; Almallahi, I.; Abu-Srhan, A.; Abushariah, A.M.M.; Mahafza, W. Unpaired MR-CT brain dataset for unsupervised image translation. Data Brief 2022, 42, 108109. [Google Scholar] [CrossRef] [PubMed]
  10. Juan, W.Y. Generating Synthesized Computed Tomography (CT) from Magnetic Resonance Imaging Using Cycle-Consistent Generative Adversarial Network for Brain Tumor Radiation Therapy. Int. J. Radiat. Oncol. Biol. Phys. 2021, 111, E111–E112. [Google Scholar] [CrossRef]
  11. Romano, M.; Bravin, A.; Mittone, A.; Eckhardt, A.; Barbone, G.E.; Sancey, L.; Dinkel, J.; Bartzsch, S.; Ricke, J.; Alunni-Fabbroni, M.; et al. A Multi-Scale and Multi-Technique Approach for the Characterization of the Effects of Spatially Fractionated X-ray Radiation Therapies in a Preclinical Model. Cancers 2021, 13, 4953. [Google Scholar] [CrossRef] [PubMed]
  12. Khan, M.K.H.; Guo, W.; Liu, J.; Dong, F.; Li, Z.; Patterson, T.A.; Hong, H. Machine learning and deep learning for brain tumor MRI image segmentation. Exp. Biol. Med. 2023, 248, 1974–1992. [Google Scholar] [CrossRef] [PubMed]
  13. Qiu, T.; Lan, Y.; Gao, W.; Zhou, M.; Liu, S.; Huang, W.; Zeng, S.; Pathak, J.L.; Yang, B.; Zhang, J. Photoacoustic imaging as a highly efficient and precise imaging strategy for the evaluation of brain diseases. Quant. Imaging Med. Surg. 2021, 11, 2169–2186. [Google Scholar] [CrossRef] [PubMed]
  14. Zhang, J.; Chen, B.; Zhou, M.; Lan, H.; Gao, F. Photoacoustic Image Classification and Segmentation of Breast Cancer: A Feasibility Study. IEEE Access 2019, 7, 5457–5466. [Google Scholar] [CrossRef]
  15. He, Q.; Duan, Y.; Miles, J.; Takahashi, N. A Context-Sensitive Active Contour for 2D Corpus Callosum Segmentation. Int. J. Biomed. Imaging 2007, 2007, 024826. [Google Scholar] [CrossRef] [PubMed]
  16. Li, Y.; Chi, Z. MR brain image segmentation based on self-organizing map network. Int. J. Inf. Technol. 2005, 11, 45–53. [Google Scholar]
  17. Noori, M.; Bahri, A.; Mohammadi, K. Attention-guided version of 2D UNet for automatic brain tumor segmentation. In Proceedings of the 2019 9th International Conference on Computer and Knowledge Engineering (ICCKE), Mashhad, Iran, 24–25 October 2019; pp. 269–275. [Google Scholar]
  18. Thias, A.H.; Al Mubarok, A.F.; Handayani, A.; Danudirdjo, D.; Rajab, T.E. Brain tumor semi-automatic segmentation on MRI T1-weighted images using active contour models. In Proceedings of the 2019 International Conference on Mechatronics, Robotics and Systems Engineering (MoRSE), Bali, Indonesia, 4–6 December 2019; pp. 217–221. [Google Scholar]
  19. Sungheetha, A.; Sharma, R. Gtikf-gabor-transform incorporated k-means and fuzzy c means clustering for edge detection in ct and mri. J. Soft Comput. Paradig. 2020, 2, 111–119. [Google Scholar] [CrossRef]
  20. Lan, H.; Duan, T.; Zhong, H.; Zhou, M.; Gao, F. Photoacoustic classification of tumor model morphology based on support vector machine: A simulation and phantom study. IEEE J. Sel. Top. Quantum Electron. 2018, 25, 1–9. [Google Scholar] [CrossRef]
  21. Al-Galal, S.A.Y.; Alshaikhli, I.F.T.; Abdulrazzaq, M.M.; Hassan, R. Brain Tumor MRI Medical Images Classification Model Based on CNN (BTMIC-CNN). J. Eng. Sci. Technol. 2022, 17, 4410–4432. [Google Scholar]
  22. Ayadi, W.; Elhamzi, W.; Charfi, I.; Atri, M. Deep CNN for brain tumor classification. Neural Process. Lett. 2021, 53, 671–700. [Google Scholar] [CrossRef]
  23. Haq, A.U.; Li, J.P.; Kumar, R.; Ali, Z.; Khan, I.; Uddin, M.I.; Agbley, B.L.Y. MCNN: A multi-level CNN model for the classification of brain tumors in IoT-healthcare system. J. Ambient Intell. Humaniz. Comput. 2023, 14, 4695–4706. [Google Scholar] [CrossRef]
  24. Kasukurthi, A.; Paleti, L.; Brahmaiah, M.; Sree, C.S. Enhanced CNN Model for Brain Tumor Classification. Int. J. Comput. Sci. Netw. Secur. 2022, 22, 143–148. [Google Scholar] [CrossRef]
  25. Treeby, B.E.; Cox, B.T. k-Wave: MATLAB toolbox for the simulation and reconstruction of photoacoustic wave fields. J. Biomed. Opt. 2010, 15, 021314. [Google Scholar] [CrossRef]
  26. Ma, J.; He, Y.; Li, F.; Han, L.; You, C.; Wang, B. Segment anything in medical images. Nat. Commun. 2024, 15, 654. [Google Scholar] [CrossRef]
  27. Reis, D.; Kupec, J.; Hong, J.; Daoudi, A. Real-time flying object detection with YOLOv8. arXiv 2023, arXiv:2305.09972. [Google Scholar]
  28. Uygun, T.; Ozguven, M.M. Determination of tomato leafminer: Tuta absoluta (Meyrick) (Lepidoptera: Gelechiidae) damage on tomato using deep learning instance segmentation method. Eur. Food Res. Technol. 2024, 250, 1837–1852. [Google Scholar] [CrossRef]
  29. Hussain, M. YOLO-v1 to YOLO-v8, the Rise of YOLO and Its Complementary Nature toward Digital Manufacturing and Industrial Defect Detection. Machines 2023, 11, 677. [Google Scholar] [CrossRef]
  30. Latif, G. DeepTumor: Framework for Brain MR Image Classification, Segmentation and Tumor Detection. Diagnostics 2022, 12, 2888. [Google Scholar] [CrossRef]
  31. Redmon, J.; Divvala, S.; Girshick, R.; Farhadi, A. You only look once: Unified, real-time object detection. In Proceedings of the IEEE Conference on Computer Vision and Pattern Recognition, Las Vegas, NV, USA, 27–30 June 2016; pp. 779–788. [Google Scholar]
  32. Oshino, S.; Kato, A.; Wakayama, A.; Taniguchi, M.; Hirata, M.; Yoshimine, T. Magnetoencephalographic analysis of cortical oscillatory activity in patients with brain tumors: Synthetic aperture magnetometry (SAM) functional imaging of delta band activity. Neuroimage 2007, 34, 957–964. [Google Scholar] [CrossRef]
  33. Tiwari, P.; Pant, B.; Elarabawy, M.M.; Abd-Elnaby, M.; Mohd, N.; Dhiman, G.; Sharma, S. CNN Based Multiclass Brain Tumor Detection Using Medical Imaging. Comput. Intell. Neurosci. 2022, 2022, 1830010. [Google Scholar] [CrossRef]
  34. Mukkapati, N.; Anbarasi, M. Brain tumor classification based on enhanced CNN model. Rev. Intell. Artif. 2022, 36, 125. [Google Scholar] [CrossRef]
Figure 1. A flowchart of the overall framework.
Applsci 14 05270 g001
Figure 2. Photoacoustic imaging image reconstruction.
Applsci 14 05270 g002
Figure 3. An overview of the YoLov8-MedSAM model.
Applsci 14 05270 g003
Figure 4. YOLOv8 network architecture.
Applsci 14 05270 g004
Figure 5. MedSAM network architecture overview (image taken from [29]).
Applsci 14 05270 g005
Figure 6. Plot of YoLov8-MedSAM detection segmentation results. Figures (ad) are brain tumors of different shapes and locations, where Figures (a,b) are malignant tumors, and Figures (c,d) are benign tumors.
Applsci 14 05270 g006
Figure 7. YoLov8-MedSAM detection confusion matrix.
Applsci 14 05270 g007
Figure 8. The detection of F1 confidence in the YoLov8-MedSAM Model.
Applsci 14 05270 g008
Figure 9. The detection results of the YoLov8-MedSAM model.
Applsci 14 05270 g009
Figure 10. Classification confusion matrix. (a) Description of classification of photoacoustic brain tumour images; (b) description of classification of segmented brain tumour images.
Applsci 14 05270 g010
Table 1. Segmentation results of YoLov8-MedSAM model.
Accuracy (%)Dice Score (%)
Background96.5288.07
Brain tumour94.2381.35
Table 2. Results of CNN classification.
Precision (%)Recall (%)Binary Accuracy (%)
Original imageall94.1294.0794.01
positive96.0392.31
negative92.2195.83
Segmented imageall97.0297.0497.02
positive96.0898.03
negative97.9696.05
Table 3. Photoacoustic brain tumour image classification assessment metrics.
Specificity (%)Sensitivity (%)
CNN classification92.3194.07
Methods in this paper CNN classification96.0898.03
Table 4. A comparison of the proposed method with others.
MethodDataAccuracy (%)
Deep convolutional neural network modelBraTS96.30
Support Vector Machine (SVM) AlgorithmsPhotoacoustic tumour images90.00
GoogLeNet modelBreast cancer images91.18
AlexNet modelBreast cancer images87.69
K-means algorithmsPhotoacoustic breast cancer images82.14
Deep convolutional neural network modelPhotoacoustic brain tumour images94.01
The methods proposed in this paperPhotoacoustic brain tumour images97.02
Disclaimer/Publisher’s Note: The statements, opinions and data contained in all publications are solely those of the individual author(s) and contributor(s) and not of MDPI and/or the editor(s). MDPI and/or the editor(s) disclaim responsibility for any injury to people or property resulting from any ideas, methods, instructions or products referred to in the content.

