Article

Using an Uptake Enhancer to Mitigate Nitrogen Leaching While Enhancing Uptake Efficiency

Faculty of Natural Sciences, Department of Soil, Crop and Climate Sciences, University of the Free State, Bloemfontein 9301, South Africa
*
Author to whom correspondence should be addressed.
Appl. Sci. 2024, 14(12), 5271; https://doi.org/10.3390/app14125271
Submission received: 21 May 2024 / Revised: 15 June 2024 / Accepted: 17 June 2024 / Published: 18 June 2024
(This article belongs to the Special Issue Crop Yield and Nutrient Use Efficiency)

Abstract

:
Nitrogen (N) has the most crucial influence on raising agricultural productivity of all other plant nutrients given to crops. However, 50% of the N given to crops is dissipated to the environment globally, resulting in environmental concerns due to leaching. Current research shows that intensive agricultural production systems, which are still used in a large proportion around the world, are prone to N loss. This study aimed to investigate the effect of uptake enhancer applications on N movement in the soil profile based on 10 cm depth intervals, as well as its effects on N uptake and vegetative growth of oats at 4-week intervals over a 16-week period, using sandy soil as a growing medium. Oats were cultivated in a glasshouse setting in polyvinyl chloride (PVC) columns of 60 cm in height. Six treatments were employed at the 3rd leaf growth stage, and each was replicated four times. The experiment had a constructive and a destructive part, which was employed to monitor crop N uptake at four growth stages. Analyses of soil and plant samples were carried out in all the growth stages. The treatments containing the uptake enhancer prevented N from leaching, particularly at the top 20 cm soil depth, with impressive reductions of 194% at 0–10 cm depth and 186% at 10–20 cm depth, during the first 4 weeks after planting. The uptake enhancer also promoted early vegetative growth and crop performance with 15%. In conclusion, the study revealed that employing the uptake enhancer can improve the efficacy of N fertilizer, thereby reducing the application rate of the fertilizer in agroecosystems.

1. Introduction

Nitrogen is a critical element for plant growth and plays a pivotal role in various physiological processes. As a result, its availability often limits plant productivity. Consequently, mechanisms of N uptake and acquisition have garnered a lot of research interest. The plant’s ability to absorb and assimilate N can have a profound influence on a range of growth and development traits. For example, N application substantially affects agronomic traits in oats, such as plant height, grain yield, and milling quality [1]. Nitrogen is crucial for plant growth and development as it is a key component of amino acids, proteins, cell walls, membranes, and nucleic acids [2,3]. Moreover, N is linked to chlorophyll formation, the green pigment responsible for photosynthesis, which enables plants to harness sunlight and convert it into energy-rich compounds. Its deficiency leads to stunted growth, reduced photosynthesis and leaf area, accelerated senescence, and decreased productivity. As an essential nutrient, N is central to plant metabolism, being present in vital organic compounds, including amino acids, proteins, nucleic acids, and phytohormones.
Despite N being one of the most abundant elements on Earth (especially as atmospheric N gas (N2) in the atmosphere), N deficiency is the most prevalent nutritional problem affecting crops worldwide [4]. One of the causes of limitations in N is the remarkably high nutritional requirements by plants, as N is the most abundant nutrient in most plant tissues [5]. Plants absorb N in the inorganic form either as nitrate (NO3-) or ammonium (NH4+) [6]. However, there are low inorganic N levels in the soil and a high fraction of soil N in organic form, which is inaccessible to plants and thus contributes to N deficiency [7]. In fact, only 0.00024% of N on Earth is considered accessible for plant usage [5].
Plants often face challenges due to living in dynamic and complex ecosystems [8], which in turn impact their N uptake. Several environmental factors, such as precipitation, temperature, wind, soil type, and pH, affect N uptake. These stressors have a negative impact on N assimilation in the plant tissues, lower N uptake, and greatly decreased crop yields. For assimilation, nitrate needs to be reduced into ammonium ions, followed by its assimilation into amino acids. This reduction occurs in roots as well as shoots. In contrast, ammonium is less mobile in the soil and can be directly absorbed into amino acids [9]. The ratio of these two types of N and how readily they are absorbed by the soil have a big impact on N uptake efficiency.
To achieve adequate crop production levels and meet global food demands, 85–90 million metric tons of N fertilizers are added annually to the soil [10]; consequently, the global demand for agricultural N fertilizer continues to escalate [11]. On the other hand, plants have poor N absorption, absorbing only 40–50% of a given amount or even less [12,13,14]. The remainder is dissipated into the wider environment, contributing to a range of ecological and human health effects [15,16,17]. Nitrogen transported to freshwater from agricultural soils is estimated to be 39–95 Tg yearly [18]. Furthermore, N-based fertilizers are thought to be the worst polluters of water.
Excessive N fertilizer application has economic and ecological expenses in addition to the tremendous environmental consequences of fertilizer production. The sources of N used in fertilizers are linked to oil prices, and the more volatile the oil market is, the more the fertilizer price fluctuates [19]. As a result, N fertilizer is costly to produce and is the second most expensive input for farmers after fuel, resulting in significant economic losses. Thus, it is evident that crop uptake must be enhanced to ensure long-term agricultural production. Less fertilizer N may be required if fertilization is carefully managed, yet grain yields and protein may be maintained or improved [20].
A study conducted by Fernández and Eichert [21] suggested that improved wetting of foliar fertilizer on the leaves increases the probability of foliar fertilizer uptake. They added that lower wetting leads to lower absorption rates of the fertilizer formulation. To improve the effectiveness of foliar absorption, adding adjuvants to the fertilizer formulation is often necessary [21]. Adjuvants are defined as any material added to a spray solution to enhance the absorption of the spray’s active ingredient, whether the spray is a fertilizer, herbicide, or pesticide or to alter the properties of the spray [22]. When dealing with adjuvants, identifying the specific products available and their primary function is key. Adjuvants can be broadly categorized into several types based on their use, including wetter-spreaders, stickers, emulsifiable oils, foliar nutrients, and compatibility agents. Among these, nearly half of the available products are wetter-spreaders or stickers, with emulsifiable oils, foliar nutrients, and compatibility agents accounting for another third of the registrations.
Consequently, even though there are 17 categories of adjuvants, 80% of the array of products available are in only five categories. Seven of the categories comprise trivial uses with minor purposes. Of the major uses, all but foliar nutrients, buffers, drift retardants, and possibly oils usually depend on surfactants to perform their major function. It is, therefore, important to understand the role of the surfactant chemical or principal active ingredients in performing the functions expected of an adjuvant and to be able to read the active ingredient statement on the label when comparing adjuvants and selecting the one most appropriate for your specific situation. This research focused on a product that is classified as a penetrant/uptake enhancer because it is categorized as a compound that penetrates the skin of a plant. By examining the efficacy and mechanisms of this uptake enhancer, the study aimed to evaluate the performance of the uptake enhancer added to (NH4) (NO3) fertilizer in increasing N uptake and preventing N losses in the soil profile during and after the vegetative period.
In this study, we hypothesized that using an uptake enhancer can significantly increase N uptake while reducing N leaching in the soil profile. By improving the mechanisms of N absorption and assimilation in the plant root system, this uptake enhancer will thus lead to better N retention in the soil and more efficient utilization by the plant, which will then result in increased crop yields and reduced environmental impact.

2. Materials and Methods

2.1. Experimental Site and Materials

The study was conducted in the laboratories and glasshouses of the Department of Soil, Crop, and Climate Sciences at the University of the Free State in Bloemfontein (29°07′ S, 26°11′ E), South Africa. The greenhouse temperature was maintained at 23/15 ± 2 °C during the day and nighttime, respectively. The study was carried out in August 2022 over a period of 16 weeks using a sandy loam soil type as a growing medium to investigate the effect of soil on the movement of N in combination with the uptake enhancer. PVC columns of 60 cm in height (made up of six 10 cm rings taped on top of each other) were used to conduct the experiment. The PVC columns were then closed at the bottom using 2 μm netting to prevent the soil from passing through the bottom during the duration of the experiment. Four replicated PVC columns of each treatment were placed together in a container to collect leachate during the experiment. Each PVC column was packed with 5 kg of sandy soil to obtain a bulk density of 1000 kg m−3. For irrigation purposes, field water capacity was maintained by applying gravimetric methods until harvest. To do this, the columns were irrigated with distilled water until saturation to ensure maximum water-holding capacity and then weighed. Following a 48 h drying period, the columns were reweighed to determine water loss due to evaporation and transpiration. This weighing process was repeated every two days to ensure that the soil remained at field water capacity. The calculated differences in weight from one period to the next allowed us to precisely monitor water loss and maintain optimal soil moisture levels by refilling the lost water. Three oats seeds (cultivar SSH4817—with a medium to long growth season, suited for grazing and hay production, high biomass, and good regrowth) were planted per column, spaced about 3 cm apart, whereafter thinning was carried out at the two-leaf growth stage and only one plant was left to grow in each PVC column. Early thinning was carried out to avoid the possible future complication during root mass measurement. The experiment was subjected to a complete randomized block design, with six different treatments and four replicates per treatment. One part of the experiment was constructive to enable measurements of leaching at five depth intervals. Another part of the experiment was employed for destructive purposes, entailing the monitoring of crop N uptake at four growth stages. For this purpose, additional PVC columns were added to include sampling at four growth stages. PVC columns were moved around randomly within the blocks every 4 to 5 days to expose the crops to the same conditions that could apply to different areas in the glasshouse and to prevent possible issues like shading or ventilation.

2.2. Pre-Planting Soil Sampling and Analysis

The topsoil of a fine sandy loam, originating from a plinthic Luvisol [23] was used in these pot trials. The fertility status of the soil was, in general, excellent, according to local guidelines [24] with a pH (H2O) of 7.2, total N of 0.06%, extractable P of 9 mg kg−1 and exchangeable K of 165 mg kg−1. No additional fertilizer was thus needed other than the treatments described below.

2.3. Treatment

The influence of uptake enhancer on the uptake of N by oats was investigated using different treatment combinations: crop vs. no crop, fertilizer vs. no fertilizer, and uptake enhancer vs. no uptake enhancer. A summary of the six treatment combinations used is given in Table 1. Ammonium nitrate fertilizer was used with a N content of 21% [ANO 21% (268.8 g L−1 of N)].
Since the potential of the uptake enhancer to increase the uptake of N was studied, only a quarter of the optimal dosage of the fertilizer per hectare was applied to measure the uptake enhancer’s effectiveness on N uptake. The required volume of liquid fertilizer and uptake enhancer was applied as soon as there was enough plant material to use for measurements (3–4 weeks after emergence—growth stage 13) [25]. The different applications were carried out by pipetting the required volume of both fertilizer and uptake enhancer close to the stem of the crop at the soil surface, then adding 50 mL of water to wash the product to the root area where nutrient uptake could take place. This method ensures the treatments are applied more accurately and with each column receiving the same amount of fertilizer.

2.4. Experimental Procedure

The experiment investigated the effect of uptake enhancer application on N leaching, based on 10 cm soil depth intervals, and vegetative growth of oats over a 16-week period. The study used a fine sandy loam soil, originating from a plinthic Luvisol [23]. To protect germinating seed roots and avoid fertilizer damage, the soil columns were initially filled up to a depth of 50 cm. Subsequently, the fertilizer was diluted in 50,000 L ha−1 of distilled water and precisely applied directly into the soil at planting. Following the fertilizer application, a 7 cm layer of soil was added over the fertilized layer, leaving a 3 cm gap for water application. To monitor the uptake of N by oats as influenced by different uptake enhancer treatments, destructive harvesting was carried out three times before maturity, at growth stage 13, 33, and 55, and lastly at harvest, which occurred at growth stage 97 [26]. The different sets of data were thus collected at 4-week intervals (weeks 4, 8, 12, and 16), respectively.

2.5. Sampling and Analyses

2.5.1. Sampling and Analyses of Soil

The soil samples from the PVC columns were collected to analyze possible N leaching through a profile. This was carried out by separating the columns at 0–10, 10–20, 20–30, 30–40, and 40–50 cm to quantify possible N leaching at these respective soil depths. The samples were then air-dried and sieved for further analysis. Total N was determined for each dried sample by a dry combustion method adapted from Nelson and Sommers [27] with a TruSpec Leco CN analyzer (LECO Corp., St. Joseph, MI, USA).

2.5.2. Sampling and Analyses of Plant Samples

Plant data were collected every four weeks after treatment application up to harvest, encompassing morphological parameters (plant height, above-ground plant measurements, root measurements, and leaf area), physiological parameters (leaf chlorophyll content), and yield component measurements (number of panicles per plant, number of seeds per panicle, number of seeds per plant, total yield, and plant analysis for N). Plant height was measured during the vegetative growth phase and after anthesis using a measuring tape. At harvest, all fresh and dry mass (FM and DM) of above-ground parts and roots were measured using a weighing balance (Multitech, GF-3000, Osaka, Japan). Root volume was measured using the water displacement method [28]. Total leaf area per plant was measured using an LI-3100 Area meter (LI-COR, Lincoln, NE, USA). Leaf chlorophyll content was determined non-destructively using a portable CCM-200 plus (Opti-Science, Inc., Hudson, NH, USA) by taking three measurements from the leaf tip to base and averaging them. The uppermost and fully expanded leaves were selected for measurement to determine the optimum chlorophyll content. All readings were completed within 1 h to minimize errors caused by the diurnal pattern of photosynthesis [29]. The number of panicles per plant were counted twice, at week 12 and 16, while the number of seeds per panicle as well as seeds per plant were counted at the maturity stage. Dried seeds’ mass was determined using a digital scale, and the yield was expressed as yield per plant. Plant N content was assayed using a TruSpec Leco CN Analyzer (LECO Corp., St. Joseph, MI, USA), every 4 weeks.

2.6. Statistical Analysis of Data

Analysis of variance (ANOVA) was performed on all data using the IBM SPSS Statistics version 29 software package (SPSS Inc. IBM Corp., Armonk, NY, USA). All measured parameters were subjected to a two-way ANOVA to determine significant differences between the two main effects (treatment and soil depth) and their interaction at 95% confidence level (p < 0.05). All data were tested for normality (Shapiro–Wilk test) and homogeneity of variance (Levene’s test) before carrying out the ANOVAs.

2.7. Ethical Approval

The study was approved by the Environment and Biosafety Research Ethics Committee (EBREC) No. UFS-ESD2023/0092.

3. Results

3.1. Effect of Uptake Enhancer Application on N Distribution

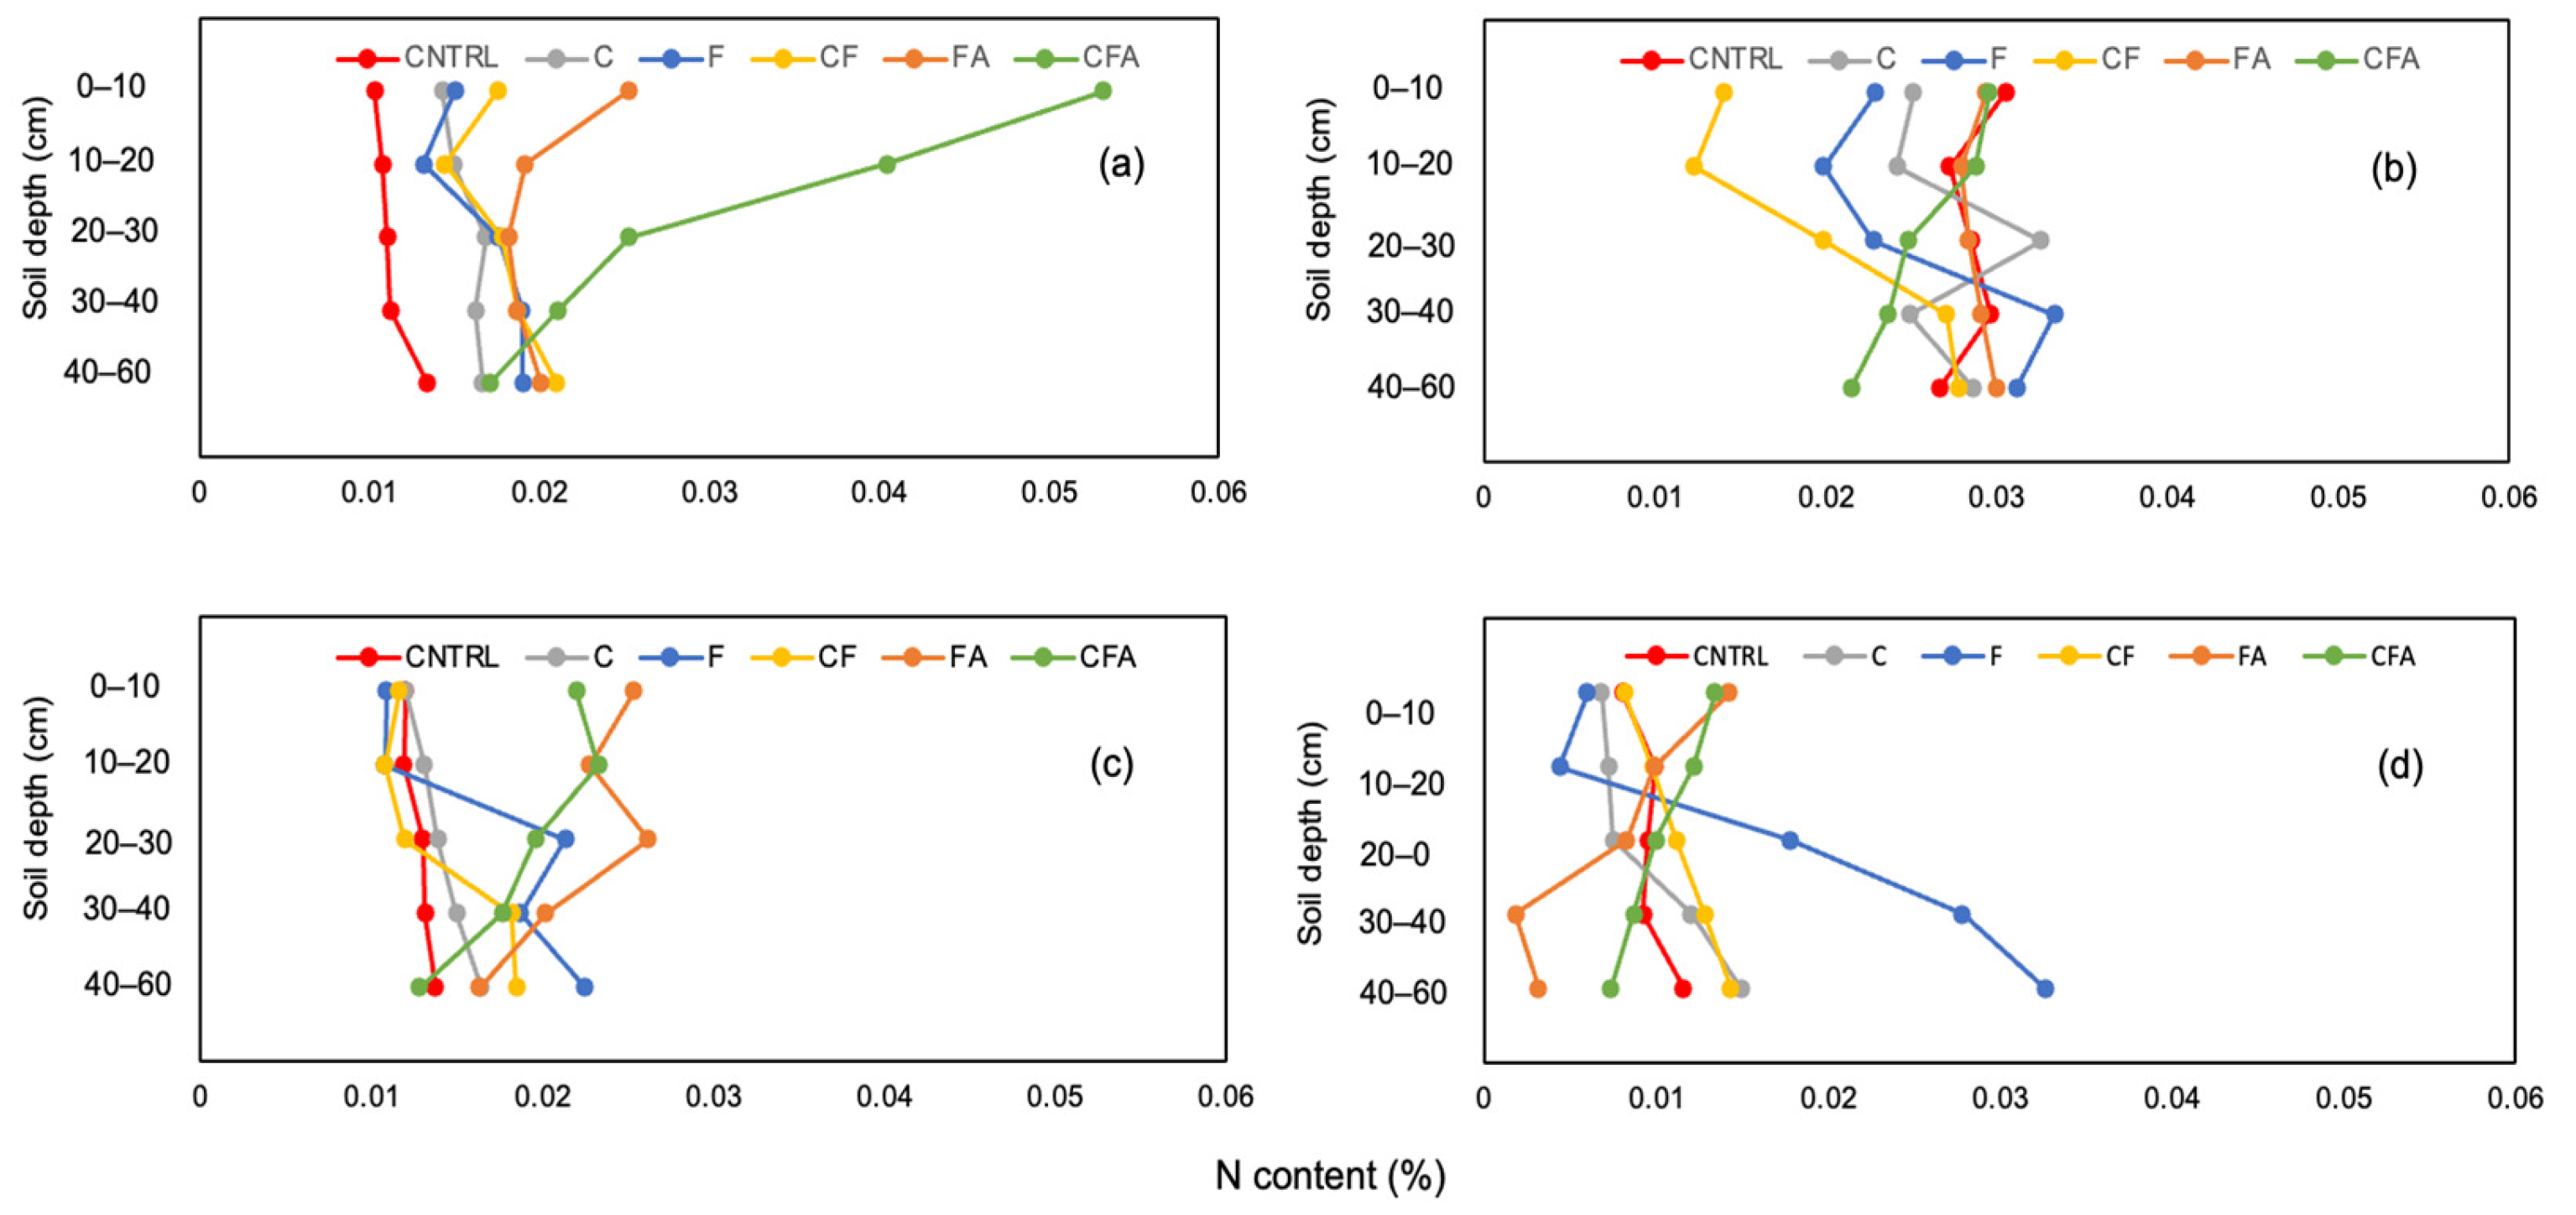
3.1.1. Effect of Uptake Enhancer Application on N Distribution through a Soil Profile

The effect of uptake enhancer application on N distribution through the soil profile at all four growth stages is presented in Table 2. Significant differences in N content between the treatments were found in all the respective soil layers for sampling time 1. The CFA treatment had the most N in the upper soil layers compared to the other treatments, followed by treatment FA. Except for the CFA treatment, all the treatments showed slightly increased N content with soil depth, especially below the 10–20 cm soil layer. As expected, the lowest N content was found in the control treatment (CNTRL), which also showed no significant differences in N content across the soil depths.
For sampling time 2 at 8 weeks, the only soil layers not showing significant differences between the treatments were the bottom soil layers (30–40 cm and 40–50 cm). Treatment CFA showed the most stable N content at the 0–20 cm soil layer. All other treatments showed an increase in N content with soil depth, except for treatments FA and CNTRL, which demonstrated a straight-line trend, which shows that the soil could not retain the N.
Almost all treatments exhibited significant differences within their soil depths for sampling time 3 at 12 weeks, except for the CNTRL treatment, which did not show any significant differences throughout the soil profile. For the two upper soil layers (0–10 cm and 10–20 cm), the CFA treatment, as well as treatment FA, had significantly higher N values than the other treatments without the uptake enhancer. In fact, the reference treatments (CNTRL and C) showed a free flow of N through the soil profile.
For the final sampling time at 16 weeks, significant differences between treatments were found in all soil layers. The CFA treatment, as well as treatment FA, again had more N in the upper soil layers compared to the other treatments without the uptake enhancer and showed a declining trend for N with soil depth. All other treatments showed an increase in N content with soil depth. The F treatment stood out, showing a sharp increase in N beyond the 10–20 cm soil layer, indicating N leaching.

3.1.2. Effect of Uptake Enhancer Application on N Distribution Patterns

The effect of uptake enhancer application on N distribution patterns at all four growth stages is presented in Figure 1a–d. The first sampling time (week 4) in Figure 1a, showed a high N level, which subsequently declined over time, as seen by the declining trend from the first to the fourth sampling time. Treatments with the uptake enhancer (FA and CFA) exhibited the highest N content in the upper soil layers and the lowest in the deeper soil layers for all four sampling periods. Conversely, the N concentration increased with a soil depth in treatments that had no uptake enhancer (F and CF).
In week 4, the CFA treatment showed the highest N content (0.053%) in the upper soil layer, 3-fold more compared to the N content in the deeper soil layer (0.017%), indicating an effective start in N uptake (Figure 1a). Conversely, the F treatment showed minimal retention in the upper soil layer. By week 8, the CFA treatment maintained stable N content in the upper soil layer, whereas other treatments began to show increased N leaching with soil depth (Figure 1b). By week 16, at harvest, the CFA treatment maintained N levels in the upper soil layer (Figure 1d). Conversely, the F treatment displayed extensive N leaching beyond the 10–20 cm soil depth, and the CNTRL and C treatments exhibited poor N retention, with N freely flowing through the soil profile. At 40–50 cm, the CFA and CF treatments had the lowest N content indicating almost no leaching to these deeper soil layers. Conversely, the F treatment showed the highest N content at the deeper soil layers, indicating that extensive N leaching took place.

3.2. Effect of Uptake Enhancer Application on Vegetative Growth of Oats

The effect of uptake enhancer application on oats morphological parameters is presented in Table 3.

3.2.1. Morphological Parameters

Plant Height

No significant differences were found when comparing the treatments within each harvesting time except for week eight, which showed that the control (treatment C) differed significantly from the CF and F treatments. As expected, oats showed an increasing trend in plant height with time, with the control treatment being constantly the shortest in height. In all four sampling times, CFA treatments consistently were the tallest in plant height compared to other treatments. Week 8 showed the most significant impact of the uptake enhancer with a 15% increase compared to treatment C, followed by week 16, which also increased by another 5%.

Above-Ground FM and DM

Surprisingly, week 8 showed a significant decline in above-ground FM and DM in the CFA treatment. However, by weeks 12 and 16, an increase in plant available N and a subsequent absorption led to an increasing trend in the above-ground FM and DM of the oats in the CFA treatment when compared to the C treatment, although not statistically significant. At week 12, the FM in the CFA treatment exhibited an increase of 23% compared to the CNTRL treatment. By week 16, this increasing trend rose to 35% in dry mass compared to the control. Notably, the CF treatment had the highest DM, which is slightly higher than the CFA treatment by 4%.

Root Measurements

The root volume of oats exhibited consistent and statistically significant increases each week where N was applied, particularly in the CFA treatment, except for the first 8 weeks, which did not show any statistical significance. The uptake enhancer’s impact on the root volume of oats was highest at week 12, with a remarkable 108% increase compared to treatment C. This significant effect persisted in week 16, with a substantial 101% increase. The root mass of oats also showed a noticeable increase, particularly from the 8th week, even though week 8 was not statistically significant. The DM of oats increased significantly by 144% in the CFA treatment at 12 weeks when compared to all other sampling times.

Leaf Area

As expected, there was a declining trend in the leaf area of oats with time, starting from the 8th week; although, none of the sampling times were statistically significant. The leaf area showed a discernible increase when N was applied with treatment CF and CFA, except for week 8, which showed an opposite trend, with C having the highest increase in leaf area.

3.2.2. Physiological Parameters and Yield Component Measurements

The effect of uptake enhancer application on oats physiological and yield parameters is presented in Table 4.
While oats displayed a declining trend in leaf chlorophyll content over time, a significant boost attributed to the uptake enhancer emerged at week 8, yet consistently higher chlorophyll content resulted from fertilizer application with the enhancer across all sampling times. Additionally, the application of fertilizer and uptake enhancer at weeks 12 and 16 generally increased both panicle fresh weight (FM) and dry matter (DM), with significance observed only at week 16. Notably, the DM of panicles in the CFA treatment surpassed that of treatment C by 81% and 41% at weeks 12 and 16, respectively.

Number of Seeds per Plant

While statistical significance was observed for seed numbers among treatments at week 16, indicating a difference between treatment groups, week 12 showed no statistically significant differences; however, there was still a notable difference between treatment C and CFA. Adding the uptake enhancer increased the seed numbers of oats in weeks 12 and 16, with week 12 showing a 36% increase and week 16 demonstrating a 47% increase compared to treatment C.

Total Yield

Even though the influence of the fertilizer and uptake enhancer was notable at both sampling times, it was only significant at week 16. Adding the uptake enhancer increased the seed mass of oats in both weeks 12 and 16. Week 12 had a 41% increase in seed mass, with treatment CF displaying the highest increase of 89%. On the other hand, the CFA treatment had a slightly lower increase of 81% in week 12. Week 16 demonstrated the highest increase in seed mass, with a 41% increase in the CFA treatment.

Plant Analysis for N

Although not statistically significant, there was a trend of decreasing N content in oats over time. Notably, the uptake enhancer had a substantial and consistent impact in all the sampling times, demonstrating its impact on N uptake by the plant.

4. Discussion

4.1. Effect of Uptake Enhancer on N Distribution through a Soil Profile

The application of the uptake enhancer in sandy soil profiles has provided significant insight into the N distribution in nutrient management. At the initial sampling time (4 weeks), the CFA treatment demonstrated the highest significant increases in N content in the upper soil layers where crops mainly acquire nutrients, preventing N leaching by 194% at 0–10 cm soil depth and 186% at 10–20 cm soil depth. Conversely, the lowest N content was found in the CNTRL treatment across all depths, with no significant variations across depths due to the nature of the soil. Nitrogen availability in the early stages of growth is greatly influenced by soil structure and texture. Sandy soil profiles frequently show rapid drainage, which may cause nutrients to leach more quickly. Additionally, N is mobile and tends to disperse relatively evenly across the soil profile in well-drained soils, which reduces the variation in its availability across soil depths [30]. These findings demonstrate how well the uptake enhancer can retain N in the upper soil layers and prevent it from leaching. The results are in line with the study conducted by Baratella et al. [31], which showed the positive impact of an uptake enhancer on nutrient distribution and retention in various soil types.
At week 8, significant differences between treatments were observed across the upper soil layers (0–20 cm), particularly treatment CFA, which maintained stable N content in the upper soil layers. In contrast, the other treatments exhibited higher leaching of N at deeper soil depths (mainly below 20 cm). The FA treatment proved less effective without a crop, while the CFA treatment significantly reduced leaching. According to Smith et al. [32], uptake enhancers are crop-dependent, so crops should be added to enhance their effectiveness.
The impact of uptake enhancer treatment was further observed at weeks 12 and 16, with significant differences across soil depths of most treatments, except for the CNTRL treatment. These findings collectively highlight the importance of uptake enhancer application in improving N retention, particularly in the upper soil layers, which are crucial for crop nutrient uptake.
When comparing N distribution at different sampling times, the CFA treatment consistently surpassed other treatments in retaining N in the upper soil across all growth stages, minimizing leaching and facilitating better N uptake by oats. Though less than the CFA treatment, the FA treatment also had excellent results, demonstrating the adjuvant’s beneficial effects when combined with fertilizer. Treatments with the uptake enhancer exhibited the highest N content in the upper soil layers and the lowest in the deeper soil layers. Conversely, the N concentration increased with soil depth in treatments that had no uptake enhancer. These findings are supported by observed variations in N content across sampling times, which reflect the complex interactions between soil characteristics, nutrient availability, and plant physiology [33]. The use of the uptake enhancer can greatly improve N retention in the root zone, thereby reducing leaching and promoting more efficient use of N by crops.

4.2. Effect of Uptake Enhancer Application on Vegetative Growth

The results at week 8 exhibited a significant impact of the uptake enhancer application, with the CFA treatment showing a remarkable 15% increase in plant height compared to the C treatment (Table 3). This significant increase in oat height is due to the essential role of N for plant biological processes, significantly impacting cell division and meristematic activity. Nitrogen fertilizer enhances cell size and division speed, leading to increased amino acids, including tryptophan, which are precursors for auxin, promoting cell division and height growth. The present findings align with those of Midha et al. [34], who observed that oat plants grew 41% taller, upon applying N at a rate of 120 kg ha⁻¹. This highlights the advantageous effect of N on plant height and growth as a whole. The overall results showed how the uptake enhancer may help to stimulate early vegetative growth. The first eight weeks showed no significant increase in above-ground mass; in fact, the CFA showed a negative response, with controls recording the highest mass. This correlates with the typical early vegetative phase of oats, which favors root growth. Conversely, although insignificant, the subsequent weeks showed a notable increasing trend, indicating the uptake enhancer’s impact on biomass production.
The application of fertilizer and uptake enhancer improved leaf area and chlorophyll content, enhancing photosynthetic potential despite a decline observed in both parameters over time, which is consistent with natural aging processes (Table 4). The outcomes correspond with the research by Singh et al. [35], who also observed a decline in chlorophyll content and leaf area in roots as oat plants age. The rise in the leaf-to-stem ratio can also be attributed to the role of N in biological processes, boosting cell division and meristematic activity, thereby expanding leaf surface area. Moreover, increased N enhances chlorophyll pigment, improving photosynthesis efficiency and leaf area. This extensive improvement in plant physiology brought about by increased absorption of N emphasizes the possible advantages of employing uptake boosters to maximize nutrient usage and encourage quicker plant growth.
The high growth in root volume, root FM, and DM in the CFA treatment proves the uptake enhancer’s beneficial effects on root growth and nutrient absorption. Improved root development enhances root surface area, which greatly improves the capacity of a plant to filter through the soil and absorb water and nutrients. The results are consistent with the study by Baratella et al. [31], who reported that applying an uptake enhancer onto a crop can promote root water uptake and, in turn, nutrient integration. The 144% increase in DM in the CFA treatment at week 12 suggests that the uptake enhancer significantly affected root biomass accumulation, which is crucial for nutrient uptake (Table 3). However, it is important to note that the use of PVC columns for growing plants has some constraints on root development and nutrient uptake due to the confined space. This might have potentially influenced nutrient acquisition patterns, especially in the treatments without the uptake enhancer. Improved panicle FM and DM after uptake enhancer applications imply that the uptake enhancer has the potential to improve grain output, an essential component of agricultural yield.
The increase in the number of seeds per plant, particularly at week 16, indicates the favorable impact of the uptake enhancer on the plant’s reproductive cells, potentially enhancing the yield potential (Table 4). The increase in seed number in inflorescences is likely due to higher N levels, which enhance photosynthesis efficiency and chlorophyll content, resulting in more spikelets and reduced flower cluster abortion due to less competition for nutrients. This aligns with previous research that was conducted by Wei et al. [36], who found that adequate N supply is crucial for maximizing reproductive success and yield in crops. Although statistical significance was only observed in week 16, the noticeable difference in week 12 suggests that uptake enhancers positively impacted seed output. The significant impact of the uptake enhancer application on total yield at week 16 underscores its practical significance, as a higher yield is often the primary goal of agriculture. The significant yield increase can be attributed to the role of N in boosting the number of flowering buds and grains per inflorescence, thus improving the grain yield. This increase in grain and straw components enhances biological yield, corroborating earlier studies on the positive impact of N on yield [37]. These findings underscore the importance of N management in maximizing crop productivity and overall agricultural sustainability. Additionally, the considerable increase in grain yield is consistent with the study by Singh et al. [38], who discovered improved crop yields with uptake enhancer application. Despite not being statistically significant, the consistent effect of the uptake enhancer on the N content in the crop throughout the sampling time is noteworthy and suggests improved nutrient uptake. The findings strongly suggest that the uptake enhancer plays a crucial role in enhancing crop uptake of nutrients.

5. Conclusions

This study concludes that the uptake enhancer effectively improved crop performance and soil nutrient distribution by retaining nitrogen in upper soil layers, enhancing plant-available pools, and significantly increasing nitrogen content and distribution compared to control profiles. Enhanced vegetative parameters, including leaf area, plant height, and chlorophyll content, suggest a physiological response to increased nitrogen. Moreover, the uptake enhancer influenced root system development, enhancing root volume and biomass and improving nutrient absorption efficiency. While this method shows promise for enhancing agricultural productivity and nutrient management efficiency, further research, including field trials considering different climates, soil types, application methods, and crops, is crucial to assess its long-term impact and ensure sustainable agricultural practices.

Author Contributions

Conceptualize, E.K. and E.V.d.W.; methodology, Z.S., E.K. and E.V.d.W.; software, Z.S. and E.K.; validation, E.K. and E.V.d.W.; formal analysis, Z.S., E.K. and E.V.d.W.; investigation, Z.S.; resources E.K. and E.V.d.W.; data curation, Z.S.; writing—original draft preparation, Z.S.; writing—review and editing, E.K. and E.V.d.W.; visualization, Z.S., E.K. and E.V.d.W.; supervision, E.K. and E.V.d.W.; project administration, E.K. and E.V.d.W.; funding acquisition, E.K. and E.V.d.W. All authors have read and agreed to the published version of the manuscript.

Funding

This research received no external funding.

Institutional Review Board Statement

Not applicable.

Informed Consent Statement

Not applicable.

Data Availability Statement

The raw data supporting the conclusions of this article will be made available by the authors on request.

Acknowledgments

We thank the University of the Free State for the Glasshouse and Laboratory services. We are also grateful to Biopher (Pty) Ltd. for providing the uptake enhancer for this study.

Conflicts of Interest

The authors declare no conflicts of interest.

References

  1. Ma, B.L.; Zheng, Z.; Pageau, D.; Vera, C.; Fregeau-Reid, J.; Xue, A.; Yan, W. Nitrogen and phosphorus uptake, yield and agronomic traits of oat cultivars as affected by fertilizer N rates under diverse environments. Nutr. Cycl. Agroecosyst. 2017, 108, 245–265. [Google Scholar] [CrossRef]
  2. Anas, S.M.; Alam, M.; Umair, M. Performance of one-way composite reinforced concrete slabs under explosive-induced blast loading. IOP Conf. Ser. Earth Environ Sci. 2020, 614, 012094. [Google Scholar] [CrossRef]
  3. Marschner, H. Mineral Nutrition of Higher Plants, 2nd ed.; Academic Press: London, UK, 2011. [Google Scholar]
  4. Graham, P.H.; Vance, C.P. Nitrogen fixation in perspective: An overview of research and extension needs. Field Crop Res. 2000, 65, 93–106. [Google Scholar] [CrossRef]
  5. Miller, A.J.; Cramer, M.D. Root nitrogen acquisition and assimilation. Plant Soil 2004, 274, 1–36. [Google Scholar] [CrossRef]
  6. Epstein, E.; Bloom, A.J. Mineral Nutrition of Plants: Principles and Perspectives, 2nd ed.; Sinauer Associates: Sunderland, MA, USA, 2005. [Google Scholar]
  7. Jiang, Y.; Wang, W.; Xie, Q.; Liu, N.A.; Liu, L.; Wang, D.; Zhang, X.; Yang, C.; Chen, X.; Tang, D.; et al. Plants transfer lipids to sustain colonization by mutualistic mycorrhizal and parasitic fungi. Science 2017, 356, 1172–1175. [Google Scholar] [CrossRef]
  8. Zhu, J.K. Abiotic Stress Signaling and Responses in Plants. Cell 2016, 167, 313–324. [Google Scholar] [CrossRef] [PubMed]
  9. Masclaux-Daubresse, C.; Daniel-Vedele, F.; Dechorgnat, J.; Chardon, F.; Gaufichon, L.; Suzuki, A. Nitrogen uptake, assimilation and remobilization in plants: Challenges for sustainable and productive agriculture. Ann. Bot. 2019, 105, 1141–1157. [Google Scholar] [CrossRef]
  10. Good, A.G.; Shrawat, A.K.; Muench, D.G. Can less yield more? Is reducing nutrient input into the environment compatible with maintaining crop production? Trends Plant Sci. 2004, 9, 597–605. [Google Scholar] [CrossRef]
  11. Schroeder, J.I.; Delhaize, E.; Frommer, W.B.; Guerinot, M.L.; Harrison, M.J.; Herrera-Estrella, L.; Horie, T.; Kochian, L.V.; Munns, R.; Nishizawa, N.K.; et al. Using membrane transporters to improve crops for sustainable food production. Nature 2013, 497, 60–66. [Google Scholar] [CrossRef]
  12. Kronzucker, H.J.; Glass, A.D.M.; Siddiqi, M.Y.; Kirk, G.J.D. Comparative kinetic analysis of ammonium and nitrate acquisition by tropical lowland rice: Implications for rice cultivation and yield potential. New Phytol. 2000, 145, 471–476. [Google Scholar] [CrossRef]
  13. Coskun, D.; Britto, D.T.; Shi, W.; Kronzucker, H.J. Nitrogen transformations in modern agriculture and the role of biological nitrification inhibition. Nat. Plants 2017, 3, 17074. [Google Scholar] [CrossRef] [PubMed]
  14. Coskun, D.; Britto, D.T.; Shi, W.; Kronzucker, H.J. How plant root exudates shape the nitrogen cycle. Trends. Plant Sci. 2017, 22, 661–673. [Google Scholar] [CrossRef] [PubMed]
  15. Galloway, J.N.; Townsend, A.R.; Erisman, J.W.; Bekunda, M.; Cai, Z.; Freney, J.R.; Martinelli, L.A.; Seitzinger, S.P.; Sutton, M.A. Transformation of the nitrogen cycle: Recent trends, questions, and potential solutions. Science 2008, 320, 889–892. [Google Scholar] [CrossRef] [PubMed]
  16. Galloway, J.; Aber, J.D.; Erisman, J.W.; Seitzinger, S.P.; Howarth, R.W.; Cowling, E.B.; Cosby, J. The nitrogen cascade. Biosci. Biotechnol. Biochem. 2003, 53, 341–356. [Google Scholar] [CrossRef]
  17. Erisman, J.W.; Bleeker, A.; Galloway, J.; Sutton, M.S. Reduced nitrogen in ecology and the environment. Environ. Pollut. 2007, 150, 140–149. [Google Scholar] [CrossRef] [PubMed]
  18. Sutton, M.A.; Bleeker, A.; Howard, C.M.; Erisman, J.W.; Abrol, Y.P.; Bekunda, M.; Datta, A.; Davidson, E.; De Vries, W.; Oenema, O.; et al. Our Nutrient World: The Challenge to Produce more Food and Energy with Less Pollution; Centre for Ecology and Hydrology: Edinburgh, UK, 2013. [Google Scholar]
  19. Ostendorf, M. What Is Going on with Fertilizer Prices? 2021. Available online: https://www.agriculture.com/news/crops/skyrocketing-fertilizer-market-has-farmers-analysts-and-companies-weighing-in (accessed on 4 September 2022).
  20. Kousar, P.; Ali, L.; Raza, A.; Maqbool, A.; Maqbool, S.; Rasheed, S.; Irum, N. Effect of different levels of nitrogen on the economic yield of wheat (Triticum aestivum L.) variety Aas-11. Int. J. Agron. Agric. Res. 2015, 6, 7–11. [Google Scholar]
  21. Fernández, V.; Eichert, T. Uptake of hydrophilic solutes through plant leaves: Current state of knowledge and perspectives of foliar fertilization. Crit. Rev. Plant Sci. 2009, 28, 36–68. [Google Scholar] [CrossRef]
  22. Hazen, J.L. Adjuvants—Terminology, classification, and chemistry. Weed Technol. 2000, 14, 773–784. [Google Scholar] [CrossRef]
  23. Van Huyssteen, C.W. Relating the South African Soil Taxonomy to the World Reference Base for Soil Resources; Sun Media Publishers: Bloemfontein, South Africa, 2020. [Google Scholar]
  24. FSSA Fertilizer Handbook, 6th ed.; FSSA: Pretoria, South Africa, 2007.
  25. Meier, U. Growth Stages of Mono and Dicotyledonous Plants; Blackwell: Oxford, UK, 1997. [Google Scholar]
  26. Zadoks, J.C.; Chang, T.T.; Konzak, C.F. A decimal code for the growth stages of cereals. Weed Res. 1974, 14, 415–421. [Google Scholar] [CrossRef]
  27. Nelson, D.W.; Sommers, L.E. Total carbon, organic carbon, and organic matter. Methods Soil Anal. Part 3 Chem. Methods 1996, 5, 961–1010. [Google Scholar]
  28. Bohm, W. Methods of Studying Root Systems; Springer: Berlin, Germany, 1979; pp. 95–138. [Google Scholar]
  29. Liu, Y.J.; Tong, Y.P.; Zhu, Y.G.; Ding, H.; Smith, F.A. Leaf chlorophyll readings as an indicator for spinach yield and nutritional quality with different nitrogen fertilizer applications. J. Plant Nutr. 2004, 29, 1207–1217. [Google Scholar] [CrossRef]
  30. Fixen, D.J.; Grove, J.H. Nitrate-nitrogen distribution in soil profiles under various cropping systems. Soil Sci. Soc. Am. J. 1990, 54, 1139–1144. [Google Scholar]
  31. Baratella, V.; Renzaglia, M.; Trinchera, A. Effect of surfactant as adjuvant for irrigation/fertigation in vegetables production: Preliminary results on lettuce. Acta Hortic. 2014, 1123, 157–164. [Google Scholar] [CrossRef]
  32. Smith, J.A.; Weber, J.B.; Reed, J.D.; Blum, U. Characterization of the effects of adjuvant and herbicide formulation on herbicide absorption and translocation. Weed Sci. 2007, 55, 59–68. [Google Scholar]
  33. Pinton, R.; Varanini, Z.; Nannipieri, P. The Rhizosphere: Biochemistry and Organic Substances at the Soil-Plant Interface; CRC Press: Boca Raton, FL, USA, 2007. [Google Scholar]
  34. Midha, L.K.; Duhan, B.S.; Arya, S. Performance of promising entries of oat (Avena sativa L.) under different nitrogen levels. Forage Res. 2015, 41, 122–125. [Google Scholar]
  35. Singh, R.; Singh, S.; Singh, R. Chlorophyll content and leaf area of oats as influenced by nitrogen and phosphorus fertilization. J. Indian Soc. Soil Sci. 2002, 50, 503–505. [Google Scholar]
  36. Wei, W.; Liu, S.; Cui, D.; Ding, X. Interaction between nitrogen fertilizer and biochar fertilization on crop yield and soil chemical quality in a temperate region. J. Agric. Sci. 2015, 159, 106–115. [Google Scholar] [CrossRef]
  37. Gu, X.; Yang, X.; Jiang, L.; Huang, S.; Zhou, H.; Zhu, J.; Chen, Y.; Li, Y.; Liu, Y. Nitrogen Foliage Application at Anthesis Improves Grain Yield and Quality of Wheat in a Genotype-Dependent Manner. Agronomy 2023, 13, 3077. [Google Scholar] [CrossRef]
  38. Singh, A.; Singh, S.; Singh, R.; Singh, P. Role of adjuvants in crop production: A review. J. Pharmacogn. Phytochem. 2020, 9, 1–8. [Google Scholar]
Figure 1. Nitrogen content distribution through the soil profile in different treatments, CNTRL: control; C: crop only; F: fertilizer only, CF: crop with fertilizer; FA: fertilizer and uptake enhancer; and CFA: crop with fertilizer and uptake enhancer, across 4 different sampling times: (a) week 4, (b) week 8, (c) week 12, and (d) week 16.
Applsci 14 05271 g001
Table 1. Treatment layout.
TreatmentCrop or No CropFertilizer
[ANO 21% (L ha−1)]
Uptake Enhancer
(1 mL L−1 Fertilizer)
CNTRLNo crop
CCrop
FNo crop50
CFCrop50
FANo crop501
CFACrop501
Treatments: CNTRL: control; C: crop only; F: fertilizer only; CF: crop with fertilizer; FA: fertilizer and uptake enhancer; and CFA: crop with fertilizer and uptake enhancer.
Table 2. Statistical analyses showing differences found in N content (±standard error) within each soil layer for all four sampling times for treatments: CNTRL: control; C: crop only; F: fertilizer only; CF: crop with fertilizer; FA: fertilizer and uptake enhancer; CFA: crop with fertilizer and uptake enhancer.
Sampling Time 1 (4 Weeks)
Treatments
Depth (cm)CNTRLCFCFFACFAp-Value
0–100.010 a
(±0.0012)
0.014 a
(±0.0014)
0.015 a
(±0.0035)
0.018 ab
(±0.0034)
0.025 b
(±0.0046)
0.053 c
(±0.0051)
<0.001
10–200.011 a
(±0.0009)
0.015 a
(±0.0027)
0.013 a
(±0.0030)
0.014 a
(±0.0025)
0.019 a
(±0.0061)
0.040 b
(±0.0056)
<0.001
20–300.011 a
(±0.0014)
0.017 ab
(±0.0035)
0.018 ab
(±0.0012)
0.018 ab
(±0.0034)
0.018 ab
(±0.0083)
0.025 b
(±0.0018)
0.005
30–400.011 a
(±0.0086)
0.016 a
(±0.0025)
0.019 b
(±0.0019)
0.019 b
(±0.0015)
0.019 b
(±0.0036)
0.021 b
(±0.0041)
0.001
40–500.013 a
(±0.0015)
0.017 ab
(±0.0031)
0.019 ab
(±0.0031)
0.02 b
(±0.0031)
0.020 ab
(±0.0044)
0.017 ab
(±0.0035)
0.042
Sampling Time 2 (8 Weeks)
Treatments
Depth (cm)CNTRLCFCFFACFAp-Value
0–100.031 b
(±0.0037)
0.025 b
(±0.0036)
0.023 b
(±0.0024)
0.014 a
(±0.0021)
0.029 b
(±0.0043)
0.030 b
(±0.0014)
<0.001
10–200.027 c
(±0.0049)
0.024 bc
(±0.0040)
0.020 b
(±0.0013)
0.012 a
(±0.0018)
0.028 c
(±0.0032)
0.029 c
(±0.0019)
<0.001
20–300.029 ab
(±0.0056)
0.033 b
(±0.0042)
0.023 ab
(±0.0061)
0.020 a
(±0.0026)
0.028 ab
(±0.0045)
0.025 ab
(±0.0017)
0.009
30–400.030 a
(±0.0055)
0.025 a
(±0.0054)
0.033 a
(±0.0067)
0.027 a
(±0.0033)
0.029 a
(±0.0059)
0.024 a
(±0.0012)
0.132
40–500.027 a
(±0.0084)
0.029 a
(±0.0025)
0.031 a
(±0.0052)
0.028 a
(±0.0038)
0.030 a
(±0.0043)
0.022 a
(±0.0013)
0.129
Sampling Time 3 (12 Weeks)
Treatments
Depth (cm)CNTRLCFCFFACFAp-Value
0–100.012 a
(±0.0005)
0.012 a
(±0.0006)
0.011 a
(±0.0005)
0.012 a
(±0.0010)
0.025 b
(±0.0039)
0.022 b
(±0.0011)
<0.001
10–200.012 a
(±0.0007)
0.013 a
(±0.0007)
0.011 a
(±0.0005)
0.011 a
(±0.0015)
0.023 b
(±0.0054)
0.023 b
(±0.0012)
<0.001
20–300.013 a
(±0.0013)
0.014 a
(±0.0004)
0.021 ab
(±0.0013)
0.012 a
(±0.0009)
0.026 b
(±0.0110)
0.020 ab
(±0.0013)
0.002
30–400.013 a
(±0.0017)
0.015 ab
(±0.0010)
0.019 ab
(±0.0044)
0.018 ab
(±0.0013)
0.020 b
(±0.0037)
0.018 ab
(±0.0023)
0.018
40–500.014 a
(±0.0031)
0.016 a
(±0.0012)
0.022 b
(±0.0024)
0.018 ab
(±0.0016)
0.016 a
(±0.0044)
0.013 a
(±0.0016)
<0.001
Sampling Time 4 (16 Weeks)
Treatments
Depth (cm)CNTRLCFCFFACFAp-Value
0–100.008 a
(±0.0081)
0.007 a
(±0.0018)
0.006 a
(±0.0032)
0.008 a
(±0.0014)
0.014 b
(±0.0025)
0.013 b
(±0.0013)
<0.001
10–200.010 bc
(±0.0008)
0.007 ab
(±0.0021)
0.004 a
(±0.0009)
0.010 bc
(±0.0020)
0.010 bc
(±0.0015)
0.012 c
(±0.0016)
<0.001
20–300.010 a
(±0.0053)
0.007 a
(±0.0018)
0.018 b
(±0.0017)
0.011 a
(±0.0006)
0.008 a
(±0.0019)
0.010 a
(±0.0012)
<0.001
30–400.009 ab
(±0.0063)
0.012 b
(±0.0024)
0.028 c
(±0.0040)
0.013 b
(±0.0014)
0.002 a
(±0.0008)
0.009 ab
(±0.0013)
<0.001
40–500.012 ab
(±0.0060)
0.015 b
(±00026)
0.033 c
(±0.0072)
0.014 b
(±0.0017)
0.003 a
(±0.0027)
0.007 ab
(±0.0009)
<0.001
Superscripts (a, b, c) indicate significant differences between means within the same row based on Tukey’s HSD test (p ≤ 0.05). p-values in bold indicate statistical significance of mean differences; p ≤ 0.05 is considered significant. The bottom row in each depth represents standard errors.
Table 3. Morphological parameters (±standard errors) in oats measured for all sampling times with the following treatments: C: crop only; CF: crop with fertilizer; and CFA: crop with fertilizer and uptake enhancer.
Sampling Time4 Weeks8 Weeks12 Weeks16 Weeks
TreatmentCCFCFACCFCFACCFCFACCFCFA
Plant height (cm)39.9 a
(±5.7)
38.2 a
(±6.6)
40.1 a
(±4.9)
48.3 a
(±19.4)
54.4 b
(±25.9)
55.4 b
(±7.9)
72.4 a
(±11.1)
75.9 a
(±8.4)
75.3 a
(±5.9)
79.0 a
(±7.8)
80.4 a
(±6.8)
83.0 a
(±5.1)
Above-ground FM (g)0.85 a
(±0.52)
0.58 a
(±0.48)
0.78 a
(±0.12)
19.1 b
(±3.6)
18.1 ab
(±3.6)
17.5 a
(±1.45)
14.2 a
(±1.5)
16.8 a
(±4.1)
18.1 a
(±3.5)
14.5 a
(±1.5)
16.3 a
(±1.6)
14.9 a
(±1.5)
Above-ground DM (g)0.39 a
(±0.18)
0.22 a
(±0.17)
0.27 a
(±0.04)
6.09 b
(±1.01)
5.62 ab
(±0.93)
5.54 a
(±0.84)
5.65 a
(±2.15)
6.94 a
(±1.41)
6.96 a
(±1.21)
5.13 a
(±0.35)
7.19 a
(±0.59)
6.92 a
(±1.12)
Root volume (ml)0.09 b
(±0.01)
0.04 a
(±0.01)
0.08 b
(±0.01)
0.20 a
(±0.14)
0.18 a
(±0.09)
0.25 a
(±0.11)
1.60 a
(±0.58)
1.98 ab
(±1.11)
3.34 b
(±1.31)
2.25 a
(±0.58)
3.05 ab
(±1.11)
4.53 b
(±1.31)
Root FM (g)1.94 a
(±0.79)
1.27 a
(±0.72)
1.81 a
(±0.45)
7.51 a
(±2.35)
7.86 a
(±2.09)
8.09 a
(±2.67)
2.55 a
(±0.45)
5.95 a
(±2.25)
9.94 b
(±4.17)
3.33 a
(±0.74)
4.04 b
(±1.13)
3.45 ab
(±0.41)
Root DM (g)1.07 b
(±0.59)
0.55 a
(±0.21)
1.06 b
(±0.19)
2.85 a
(±0.63)
3.16 a
(±0.93)
3.45 a
(±1.47)
1.12 a
(±0.33)
2.39 ab
(±0.86)
2.72 b
(±0.97)
1.71 ab
(±0.36)
2.07 b
(±0.37)
1.61 a
(±0.11)
Leaf area (cm2)152 a
(±87)
97 a
(±14)
176 a
(±91)
241 a
(±80)
224 a
(±60)
222 a
(±27)
67 a
(±11)
80 a
(±26)
101 a
(±22)
63 a
(±14)
75 a
(±21)
83 a
(±14)
Treatments with superscripts (a, b, c) indicate significant difference based on Tukey’s HSD test (p ≤ 0.05). Significance indicated in bold. The bottom row in each depth represents standard errors.
Table 4. Physiological and yield component parameters (±standard errors) in oats measured for all sampling times with the following treatments: C: crop only; CF: crop with fertilizer; and CFA: crop with fertilizer and uptake enhancer.
Sampling Time4 Weeks8 Weeks12 Weeks16 Weeks
TreatmentCCFCFACCFCFACCFCFACCFCFA
Chlorophyll content (CU)15.8 a
(±8.3)
18.0 a
(±7.2)
17.6 a
(±10.8)
10.3 a
(±6.4)
16.2 b
(±8.8)
14.1 ab
(±7.1)
3.4 a
(±2.8)
5.1 a
(±3.1)
5.6 a
(±2.5)
1.3 a
(±0.6)
1.4 a
(±0.5)
1.3 a
(±0.6)
Panicle FM (g)______3.82 a
(±1.04)
5.66 a
(±0.93)
5.73 a
(±0.96)
5.52 a
(±1.44)
7.32 b
(±1.67)
6.48 ab
(±1.85)
Panicle DM (g)______1.34 a
(±0.76)
2.43 a
(±0.83)
2.42 a
(±1.24)
3.01 a
(±1.68)
4.19 b
(±1.23)
4.24 b
(±1.78)
Nr of seeds per plant______54 a
(±8)
75 a
(±16)
73 a
(±12)
68 a
(±19)
92 ab
(±22)
100 b
(±24)
Total yield—seed mass (g)______1.34 a
(±1.23)
2.54 a
(±1.67)
2.43 a
(±1.87)
3.19 a
(±1.33)
4.43 b
(±2.11)
4.51 b
(±1.98)
N content in plants (%)1.63 a
(±0.18)
1.69 a
(±0.13)
1.95 a
(±0.51)
0.59 a
(±0.06)
0.65 a
(±0.12)
0.68 a
(±0.11)
0.27 a
(±0.04)
0.26 a
(±0.06)
0.33 a
(±0.06)
0.32 a
(±0.04)
0.30 a
(±0.03)
0.33 a
(±0.04)
Treatments with superscripts (a, b, c) indicate significant difference based on Tukey’s HSD test (p ≤ 0.05). Significance indicated in bold. The bottom row in each depth represents standard errors.
Disclaimer/Publisher’s Note: The statements, opinions and data contained in all publications are solely those of the individual author(s) and contributor(s) and not of MDPI and/or the editor(s). MDPI and/or the editor(s) disclaim responsibility for any injury to people or property resulting from any ideas, methods, instructions or products referred to in the content.

