1. Introduction
The water impermeability of concrete is determined based on the permissible filtration losses through the concrete and its corrosion resistance. Filtration losses are significant in hydraulic constructions, such as high-rise pressure dams, canal linings, etc. [
1,
2,
3,
4].
Four methods of determining water impermeability can be used [
5,
6]:
According to Ukrainian standards, the primary method for determining the water impermeability of concrete is the “wet spot” method.
The water impermeability class of concrete (W) indicates the maximum water pressure (in MPa·10−1) at which no water filtration occurs on at least four out of six samples by visual assessment.
Several calculation dependencies have been proposed for the predicted water impermeability, depending on the concrete structure parameters [
7].
For cement stone, the equation [
8,
9] for the dependence between the filtration coefficient (
FC) and the values of the hydraulic pore radius and porosity, reflecting the main features of its pore structure, was proposed:
where
r is the hydraulic radius and
P is the porosity.
However, the practical use of this dependence is problematic due to the difficulty of calculating the hydraulic radius, which is the average size of the capillaries at the ends of which there is a pressure drop. The hydraulic radius of capillaries in cement stone is usually calculated by dividing the amount of filtered water by the wetted surface area. To experimentally define the radius of capillaries in concrete, it is necessary to know the maximum capillary pressure P and the surface tension value
σ at the liquid–gas border. According to V. Stolnikov [
10],
r is equal to:
The formula is proposed [
11] to calculate the filtration coefficient:
where
P28 is the concrete porosity at 28 days and
KW is the coefficient of water velocity. Calculations using this formula allow the determination of the filtration coefficient for each class of concrete water impermeability depending on its total porosity.
Formula (3) has a several drawbacks [
12]. The velocity coefficient
Kw was calculated under standard conditions to determine the concrete water impermeability using cylinder specimens with a diameter and height of 15 cm. It is assumed that the water velocity in concrete obeys Darcy’s law [
13], which is valid only for viscous (Poiseuille) flow. This equation is valid for the “liquid–concrete” system with a pore radius
r = 10
−4–10
−3 cm. According to the data obtained using mercury porosimetry, in a cement stone with W/C = 0.3, the volume of pores less than 10
−4 cm is 15%, and at W/C = 0.5, it is 25% [
12]. It is also known that the content of pores less than 10
−4 cm in a cement–sand mortar during wet-air hardening is more than 60%, and during water hardening—almost 90%.
It is considered to be experimentally proven [
14] that the water impermeability of concrete is determined not by the total but by the permeable or effective porosity. It means the ratio of the volume of pores, which are the ways of water filtration, to the volume of the specimen. As opposed to total and capillary porosity, effective porosity varies widely depending on the duration of the specimen’s interaction with water.
The relationship between the filtration coefficient of concrete and its compressive strength has been experimentally substantiated. The presence of this relationship made it possible to propose a method for determining the strength of concrete by water impermeability. The experimental data are well approximated by a power law of the type [
15]:
where
fc is the strength of concrete,
Kc and
m are coefficients influenced by the characteristics of concrete mixtures, hardening conditions, hardening duration, etc.
Considering the wide variety of factors affecting concrete’s water impermeability, the coefficients KW and m in Equation (4) should be experimentally determined when predicting water impermeability and designing concrete compositions.
V. Sizov proposed [
16] to predict the concrete water impermeability using the equation:
where W is the water impermeability class of concrete (MPa·10
−1),
Rcem is the compressive strength of cement (MPa), and C/W is the cement–water ratio.
It is proposed to take the coefficient A for the reference composition equal to 1 and for other compositions to be determined by a special nomogram that considers the effect of W/C, water consumption, active and inert additives, and air pore volume.
However, this equation does not objectively reflect the effect of active mineral additives on water impermeability.
In some cases, it is necessary to assess the change in the water impermeability of concrete under prolonged exposure to water pressure. Many authors have noted the increase in concrete water impermeability in the natural environment [
17]. For example, data on the water impermeability of concrete, determined on cores drilled at different times from Italian dams, indicate a decrease in the concrete filtration coefficient by three orders of magnitude from 90 days to 27 years [
15].
The increase in concrete water impermeability in the later stages of hardening can be significantly higher than the relative increase in concrete strength. To achieve significant and stable growth in concrete water impermeability over time, it is necessary to ensure sufficient humidity of concrete during hardening [
18].
Adding organic and inorganic additives to the concrete mix is an effective way to reduce its permeability.
Surfactants and polymer additives are the most commonly used organic additives. When reducing the overall permeability of concrete and increasing the water impermeability, surfactants reduce the W/C, increase the density, and reduce the average capillary radius. In addition, most surfactants promote air entrainment of the concrete mixture, which contributes to forming a conditionally closed capillary-porous structure and reduces permeability [
19].
Dispersed mineral additives, acting as active concrete fillers, significantly impact the formation of the cement stone structure and the pore structure of concrete, which should accordingly affect its water impermeability. As is well known, the water impermeability of concrete significantly depends on the value of sedimentation porosity, which is also considerably affected by active mineral additives. In turn, the sedimentation porosity of concrete is primarily determined by the water separation of the concrete mix. Ensuring resistance to stratification is particularly important for self-compacting concrete mixes.
This study’s aim, the results of which are presented in the paper, was to investigate the influence of the main factors of the concrete mixture’s composition and the dispersion of fly ash as an active mineral additive on the water impermeability of concrete and to establish a correlation between water impermeability and compressive strength for self-compacting fly-ash-containing concrete. The technological factors’ influence on the concrete mixture’s water separation was also studied.
2. Materials and Methods
The research was carried out using Portland cement of CEM 42.5 R and active mineral additive fly ash (Ukraine Power Station). Fly ash with an initial specific surface of 253 m
2/kg was activated by grinding in a laboratory ball mill to three values of specific surface area: 290, 390, and 400 m
2/kg on average. The chemical composition of fly ash is shown in
Table 1.
A mixture of quartz sand of two fractions of 0.16 mm to 2 mm and 2 mm to 5 mm was used at various ratios. The grain fraction of 2 mm to 5 mm was conditionally accepted as coarse aggregate and the fraction of 0.16 mm to 2 mm as fine aggregate. Modified polycarboxylate ether Melflux 2651f was used as a superplasticizer.
By changing the superplasticizer consumption, a concrete mix flow of 550 mm to 600 mm (class SF1 according to EN 12350-8:2019 [
20]) was achieved. With such a flow, the concrete cone slump is 26–27 cm, as previous experiments have shown.
Water separation of fresh concrete mixtures was determined after settling in a cylindrical vessel according to the EN 480-4:2005 [
21] method.
To determine the strength of self-compacting concrete, specimens were made in the form of prisms with dimensions of 4 cm × 4 cm × 16 cm. The specimens were hardened for testing in humid air conditions at 20 ± 2 °C. The strength characteristics were measured using a test machine FP 100/1 with a 1000 kN load capacity and accuracy δ = ±1.0%. Strength characteristics of concrete specimens were determined according to EN 12390-3:2019 [
22].
The water impermeability of the concrete specimens was determined by the “wet spot” method in accordance with the Ukrainian standard. A setup was used to test 6 specimens simultaneously. Water was supplied to the bottom of the specimens, and the upper end of the specimen is observed. The specimens were made in cylindrical molds with an internal diameter of 150 mm. The height of the mold was 30 mm. During the test, the specimens were placed in the sockets of the measuring setup and fixed. The water pressure is increased gradually, starting from 0.2 MPa. The duration of the pressure change ranged from 1 to 5 min. At each stage, the specimens were kept under pressure for 4 h. The water impermeability of each specimen was evaluated at the maximum pressure when water had not yet penetrated the concrete. For a series of specimens, the assessment was made at the level at which four out of six specimens had not yet allowed water to penetrate.
Experiments to determine the strength and water impermeability were performed on specimens at 28 days.
The study of the influence of a set of factors on the properties of RPC was carried out using the methods of mathematical planning of experiments [
23,
24].
3. Results and Discussion
To perform the experiments, a three-level five-factor plan Ha
5 [
23] was used, which provides for the possibility of obtaining quadratic polynomial models.
Conditions for planning experiments are given in
Table 2. The experimental planning matrix and compositions of concrete mixtures are given in
Table 3, and the results of experimental data are in
Table 4.
The composition of concrete at each point of the matrix was calculated using the method described in [
24].
As a result of the statistical processing of the experimental data, polynomial models were obtained, which are shown in
Table 5.
The analysis of the models shows that the water–cement ratio has a decisive influence on water impermeability and strength. It is also the main factor determining water separation (
Figure 1).
Thus, at an ash consumption of 90 kg and W/C = 0.3, the water separation value is 0.25 g/L, and with an increase in W/C to 0.5, the water separation increases to 1.45 g/L (
Figure 1).
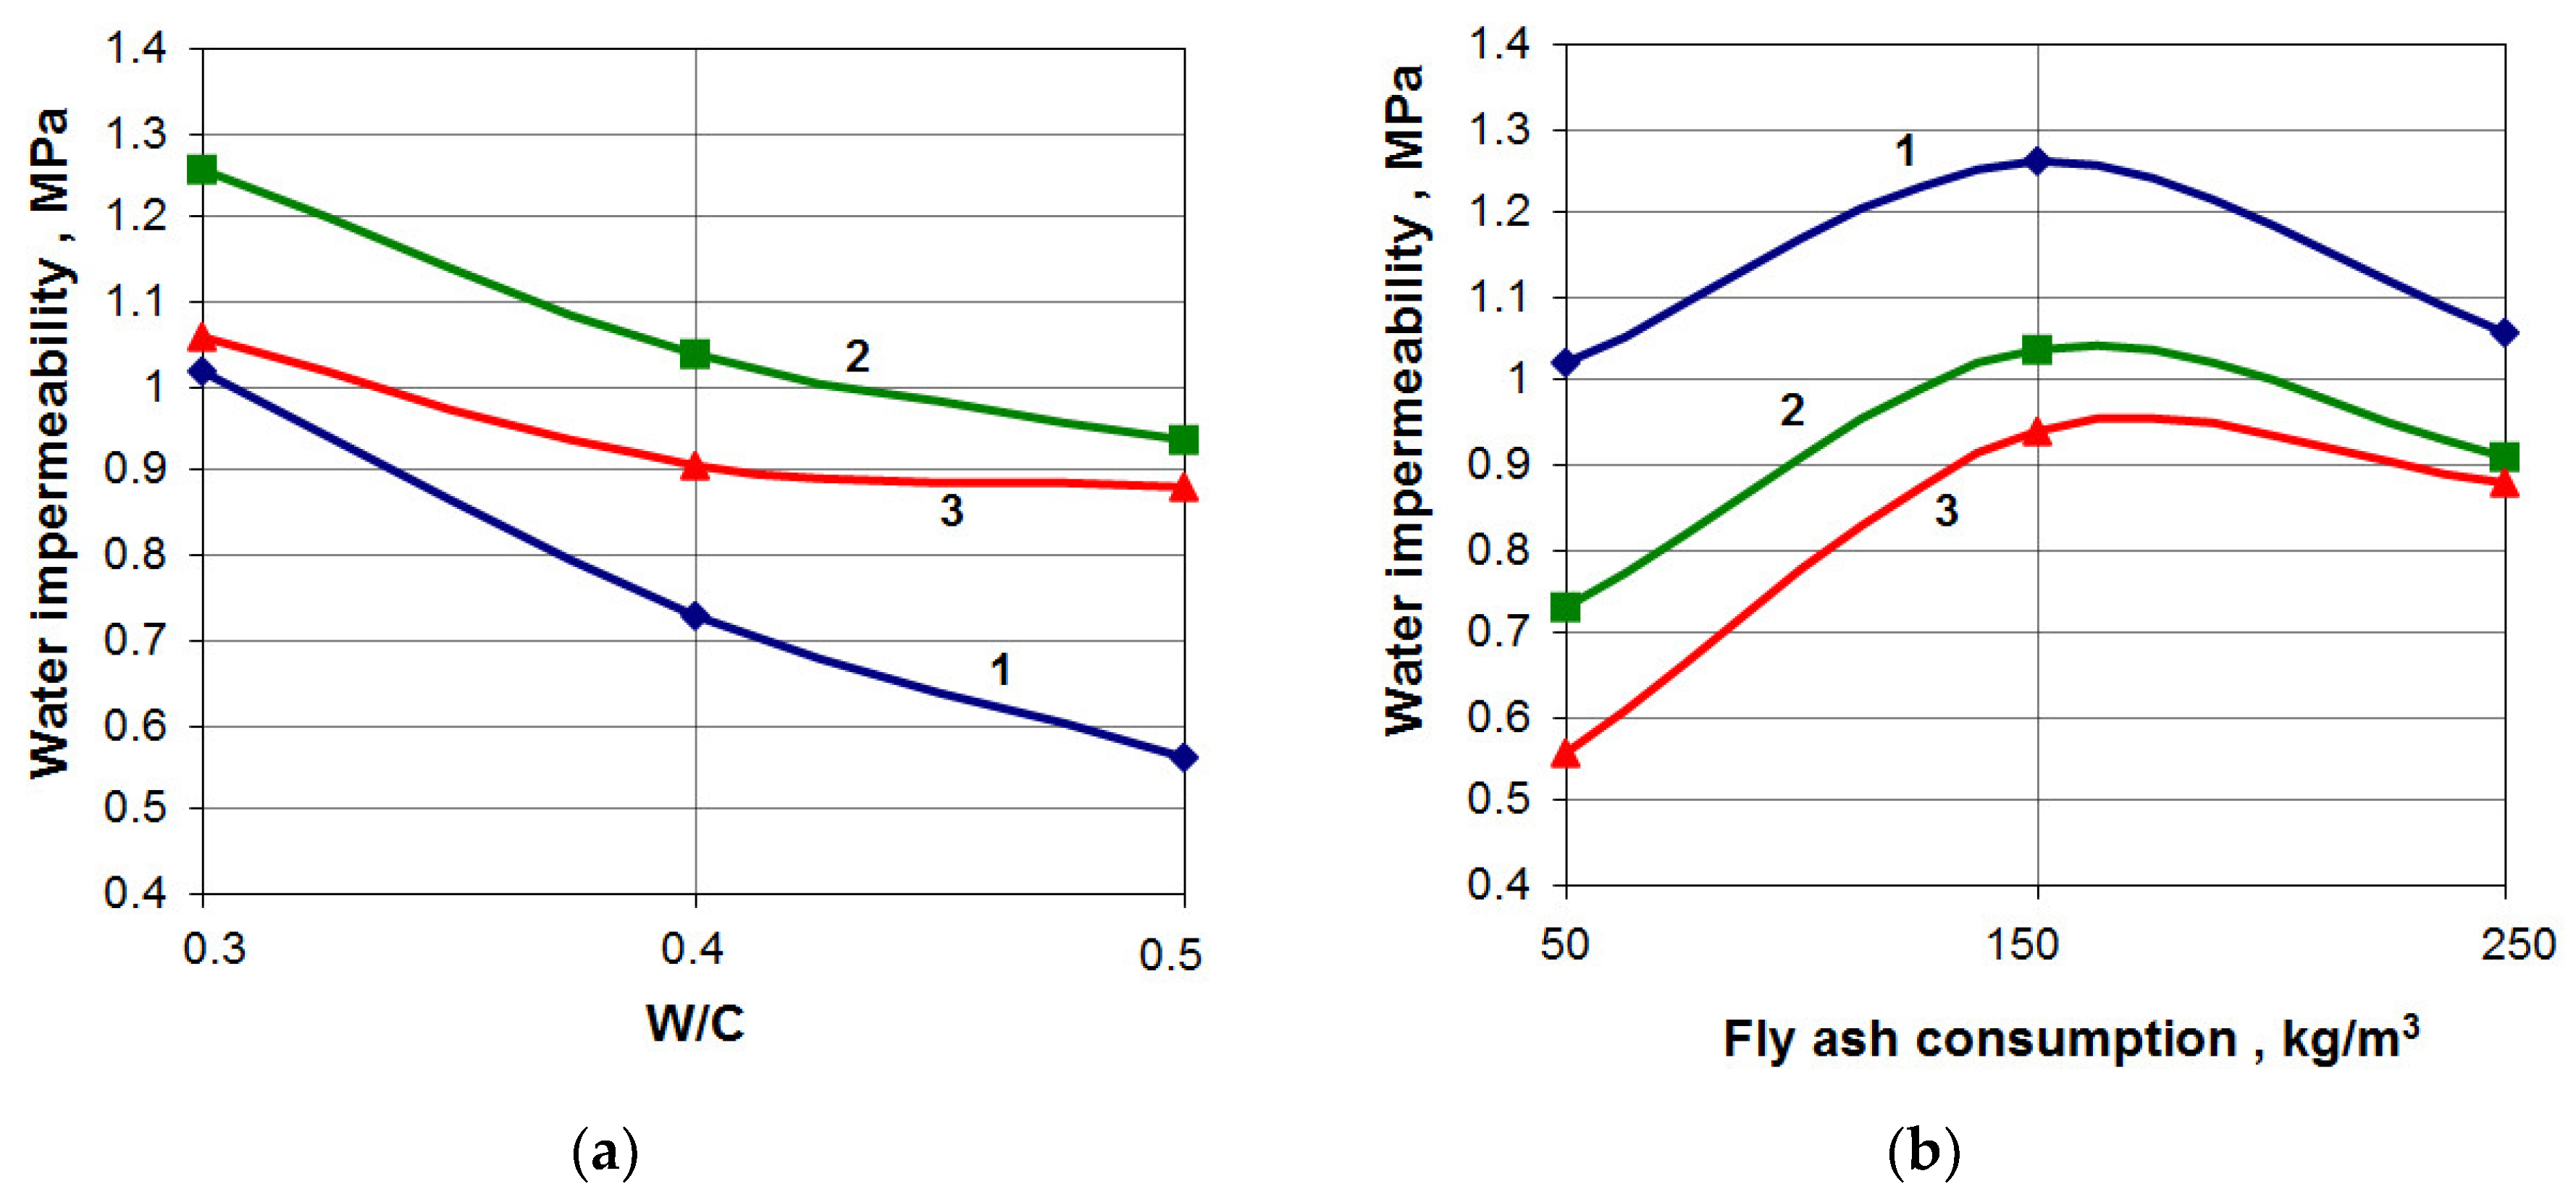
A significant increase in the water resistance of self-compacting fly-ash-containing concrete at a W/C of less than 0.4–0.5 (
Figure 2) can be explained by a decrease in internal water separation of concrete mixtures. The increase in the water impermeability of self-compacting concrete is also associated with its strength (
Figure 3) and optimal ash consumption (
Figure 2 and
Figure 4).
The water impermeability of the self-compacting fly-ash-containing concrete of the studied compositions at 28 days, due to the choice of optimal values and technological factors, can achieve a value of 1.3 MPa.
With the increasing age of concrete, water impermeability increases (
Figure 5) due to irreversible changes in the structure of the pore volume and an increase in the solid phase in the cement stone.
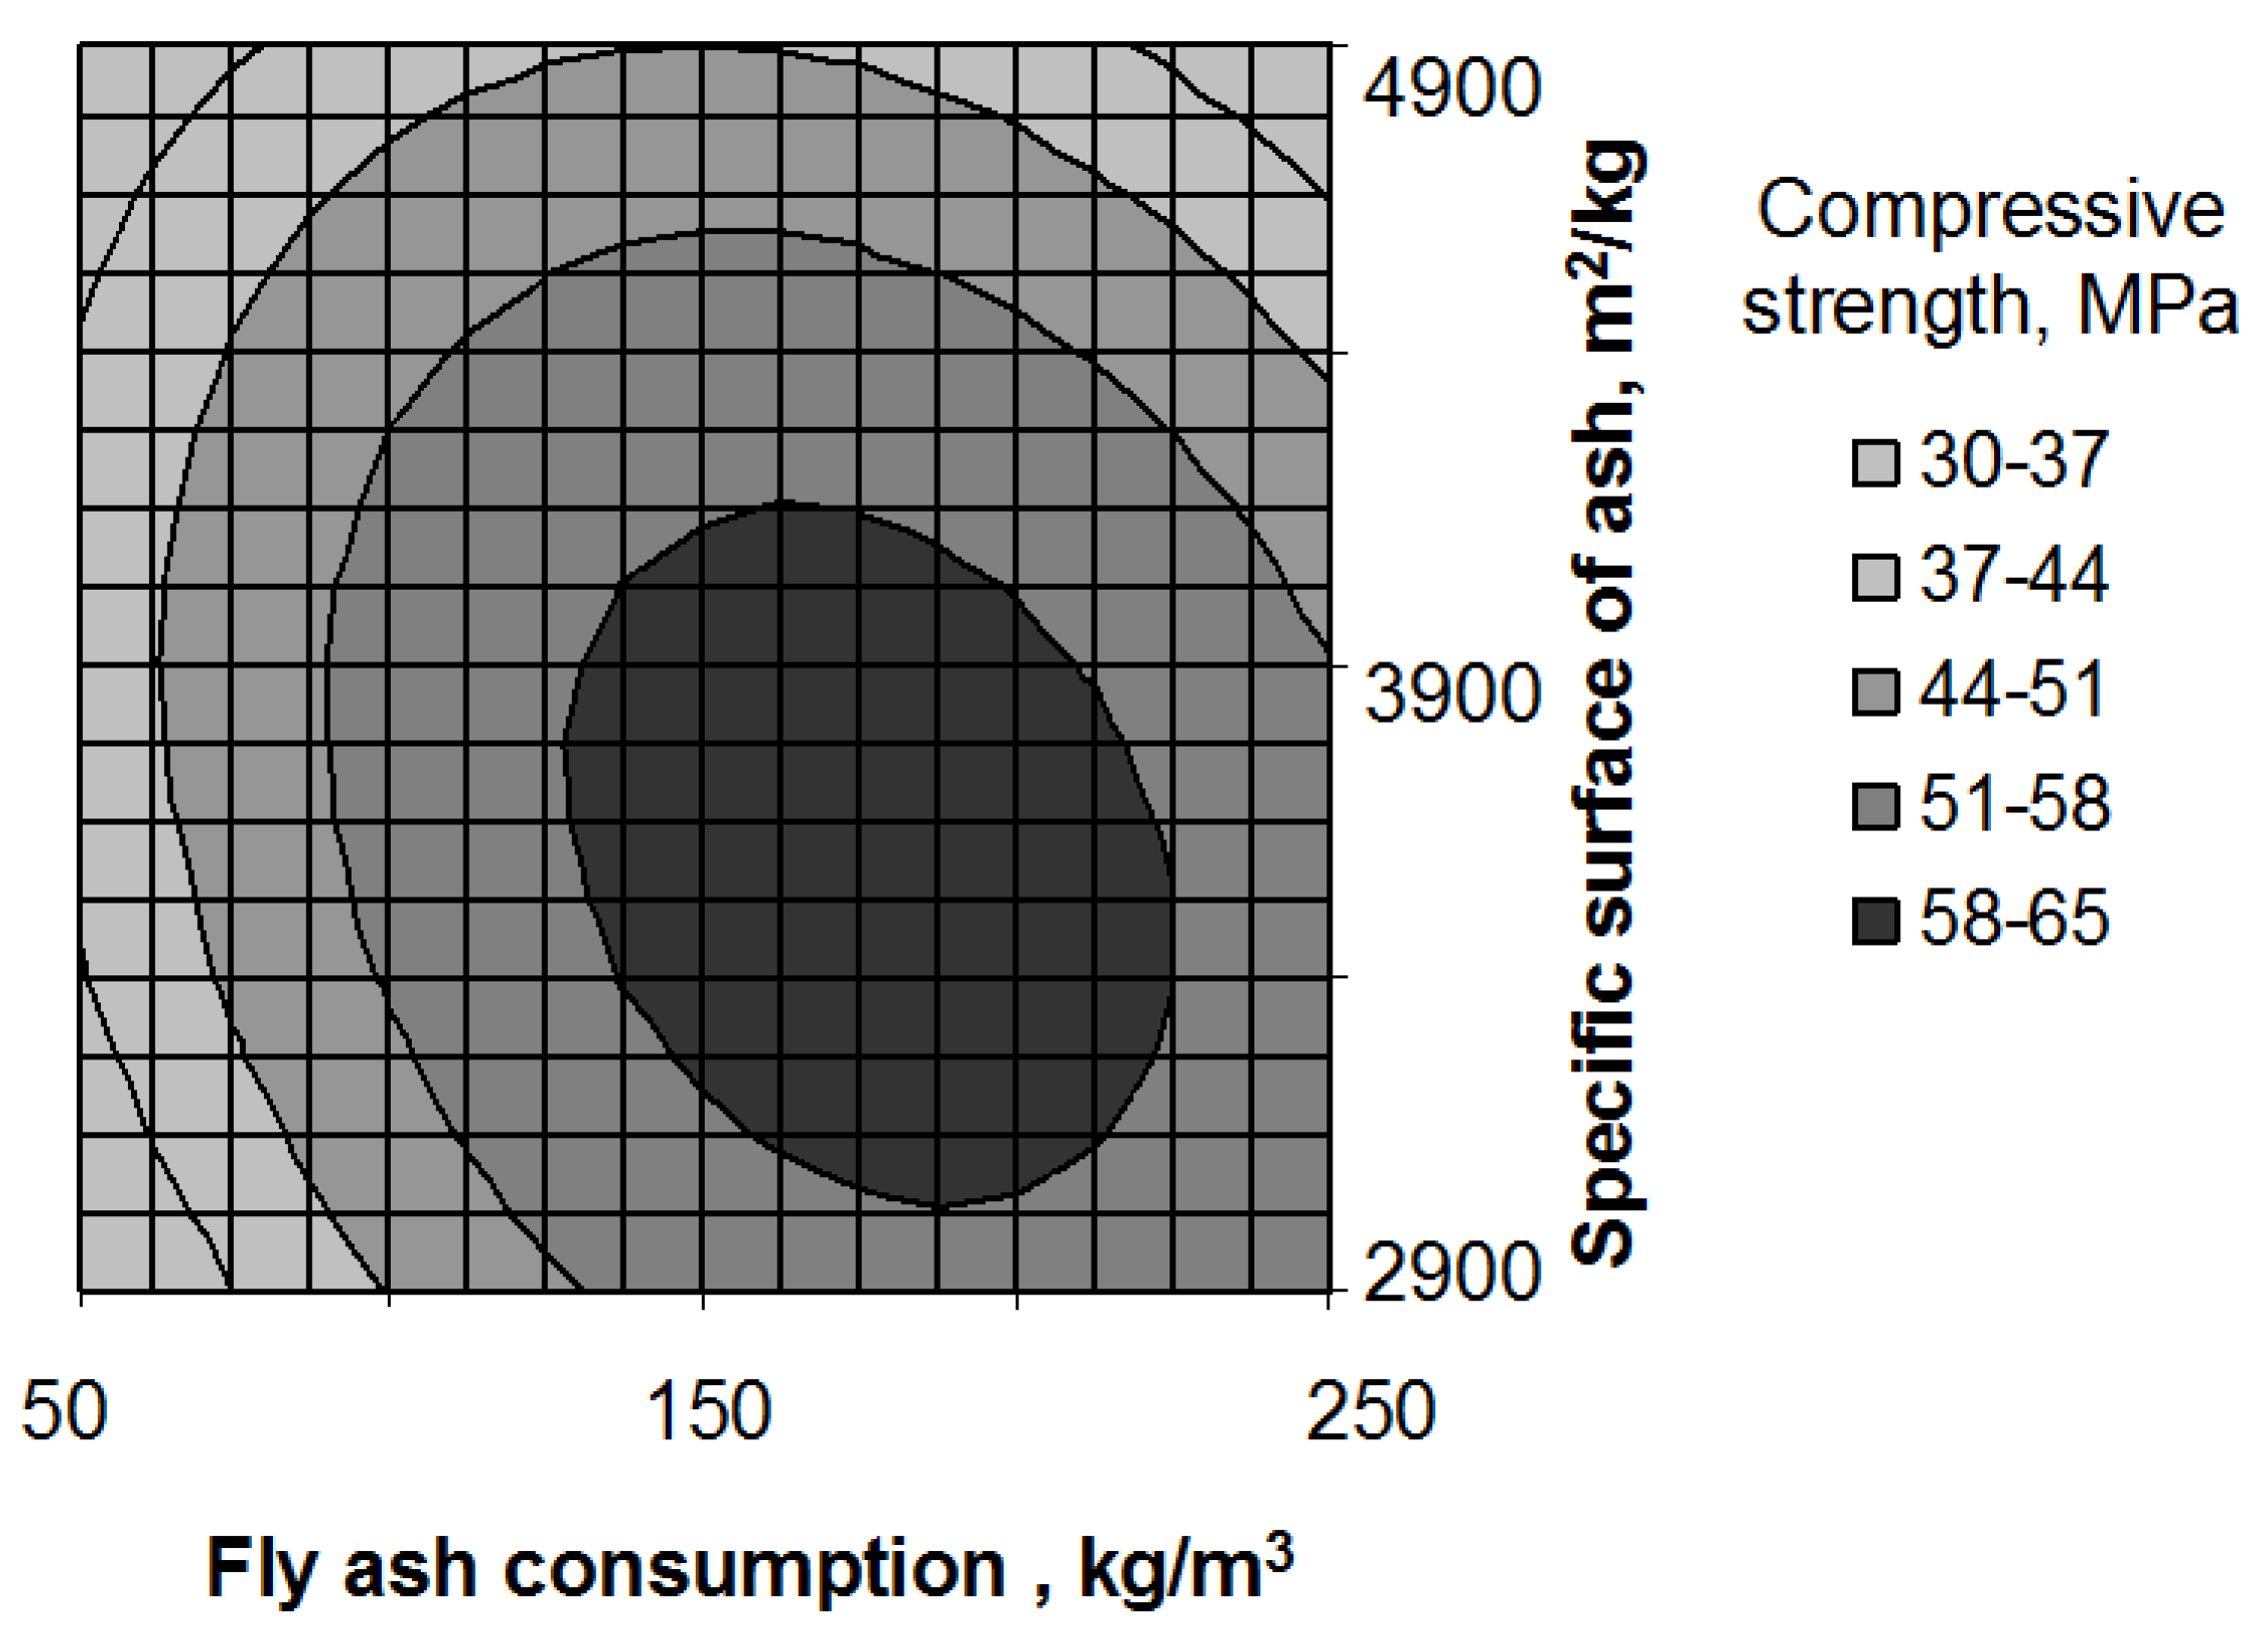
Increasing the dispersion of fly ash and its consumption has an extreme effect on the water impermeability of the concrete. Increasing the specific surface area of ash to 390 m2/kg causes a significant increase in water impermeability. Further increase in the specific surface area of ash decreases its positive effect. This can be explained by the influence of ash dispersion on the capillary porosity of concrete, which, after reaching a minimum value as a result of increasing cement hydration products, begins to grow due to the increasing water demand of the concrete mixture.
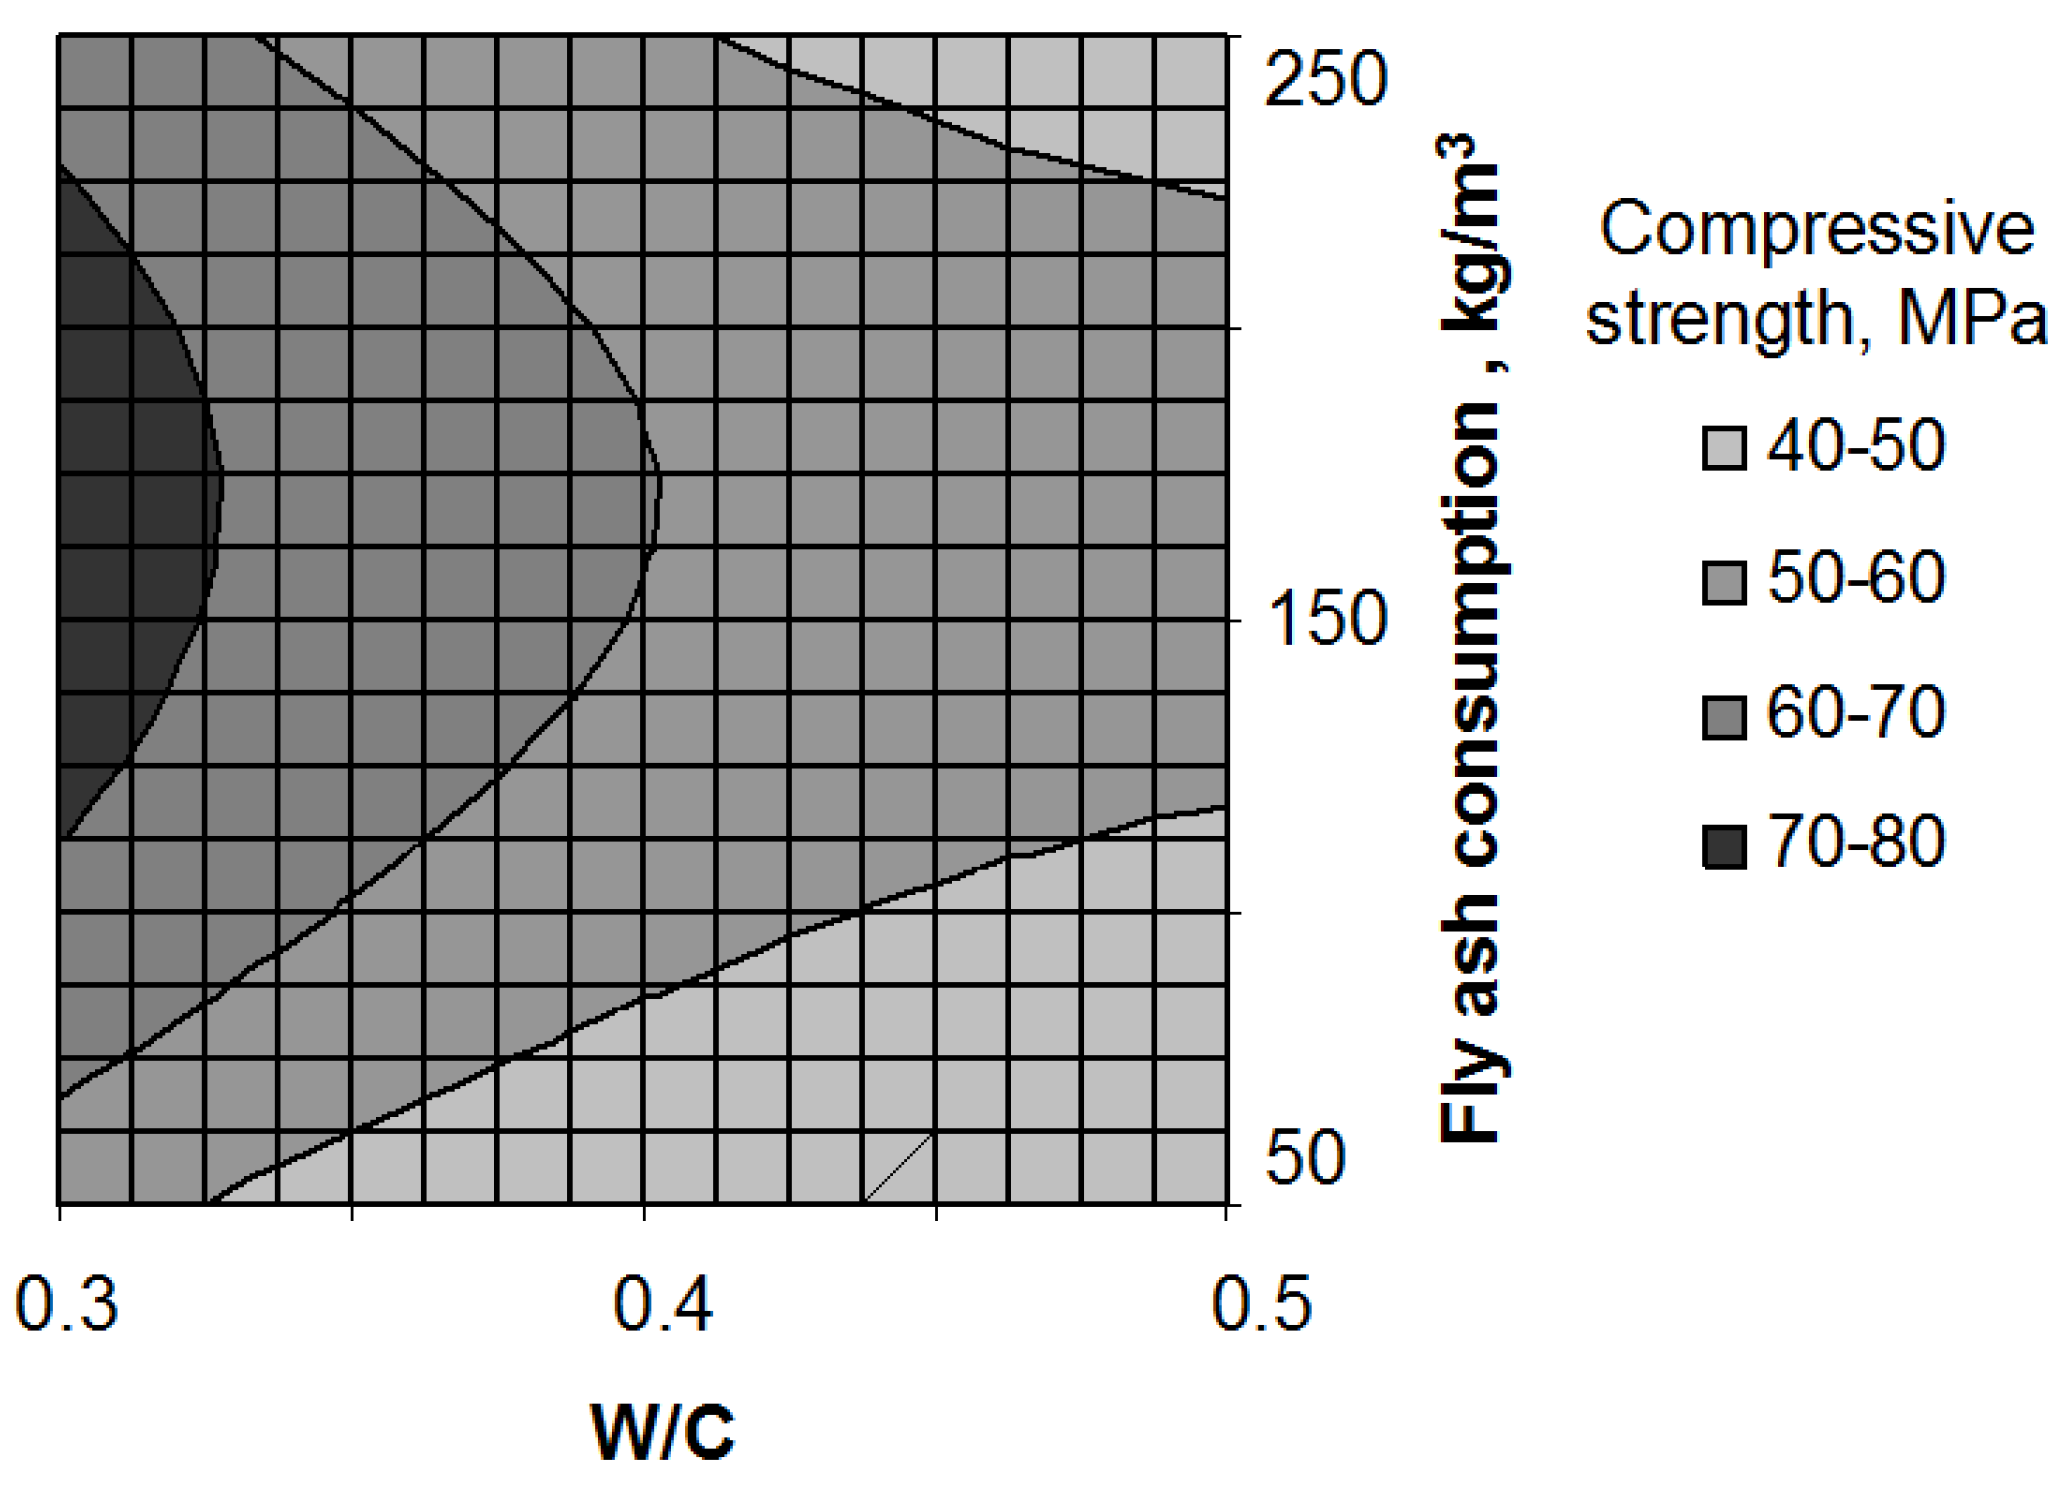
The analysis of the mathematical model (Equation (7)) and the strength diagram based on it (
Figure 6) also indicates the extreme influence of both the consumption and dispersion of ash on the concrete strength.
The range of possible fly ash consumption rates narrows as both concrete strength and water–cement ratio increase, while the strength remains unchanged. If the fly ash consumption changes, the superplasticizer consumption must be adjusted. This is necessary to achieve the same concrete mix workability.
The diagram analysis (
Figure 6) suggests that selecting the optimal values of ash consumption and its dispersion is possible. If the minimum possible ash consumption is optimal, it increases with an increase in the W/C, corresponding to the data [
25] for low-slump ash-containing concrete. However, for practical purposes, the optimal fly ash consumption can be the same over the entire range of concrete strengths. This consumption can be found analytically from Equation (7) by determining the partial derivative of X4: dfc/dX4. For the accepted conditions, X4opt = 0.2; i.e., the optimal fly ash consumption is 170 kg/m
3. Increasing the dispersion of ash (by grinding it) should increase its chemical activity, which has a positive effect on the growth of concrete strength. On the other hand, an increase in the dispersion of ash causes an increase in the concrete mixture’s air content and the mortar component’s viscosity [
26]. When it reaches values above the permissible ones, external stratification of the mixture may occur. It should be noted that the strength of the concrete is affected by the grain size distribution of the initial components. Excessive content of fine ash fractions can lead to the stratification of self-compacting concrete [
27].
The cement consumption in self-compacting fly-ash-containing concrete at the optimum fly ash consumption and its optimum dispersion are much lower than in conventional plasticized concrete. For example, for concrete with the superplasticizer additive without fly ash to achieve a strength of 56 MPa at the age of 28 days (at a water consumption of 170 kg/m3; W/C = 0.3 and r = 0.43), the cement consumption was 565 kg. The same strength was achieved with self-compacting fly-ash-containing concrete at a cement consumption of 430 kg and a fly ash consumption of 150 kg/m3 with a specific surface area of 290 m2/kg. Thus, the cement savings amounted to 135 kg per 1 m3 of self-compacting concrete.
The experimental and calculated data obtained indicate that it is possible to reduce cement consumption by 20–23% by adding the optimal amount of fly ash to the compositions of self-compacting concrete while ensuring the specified strength. Grinding fly ash to the optimum specific surface area allows additional cement savings of 8–10%.
Increasing the dispersion of fly ash positively affects water separation (
Figure 1). For example, at a consumption of 250 kg of fly ash with a specific surface area of 290 m
2/kg, the water separation rate is 0.45 g/L. With an increase in the specific surface area to 390 m
2/kg, it decreases to 0.15 g/L. The sensitivity of water separation to increased fly ash consumption at its higher specific surface makes it possible to use fly ash at a high water–cement ratio at a rational dosage of 150–200 kg/m
3 as a water-retaining additive after its additional grinding.
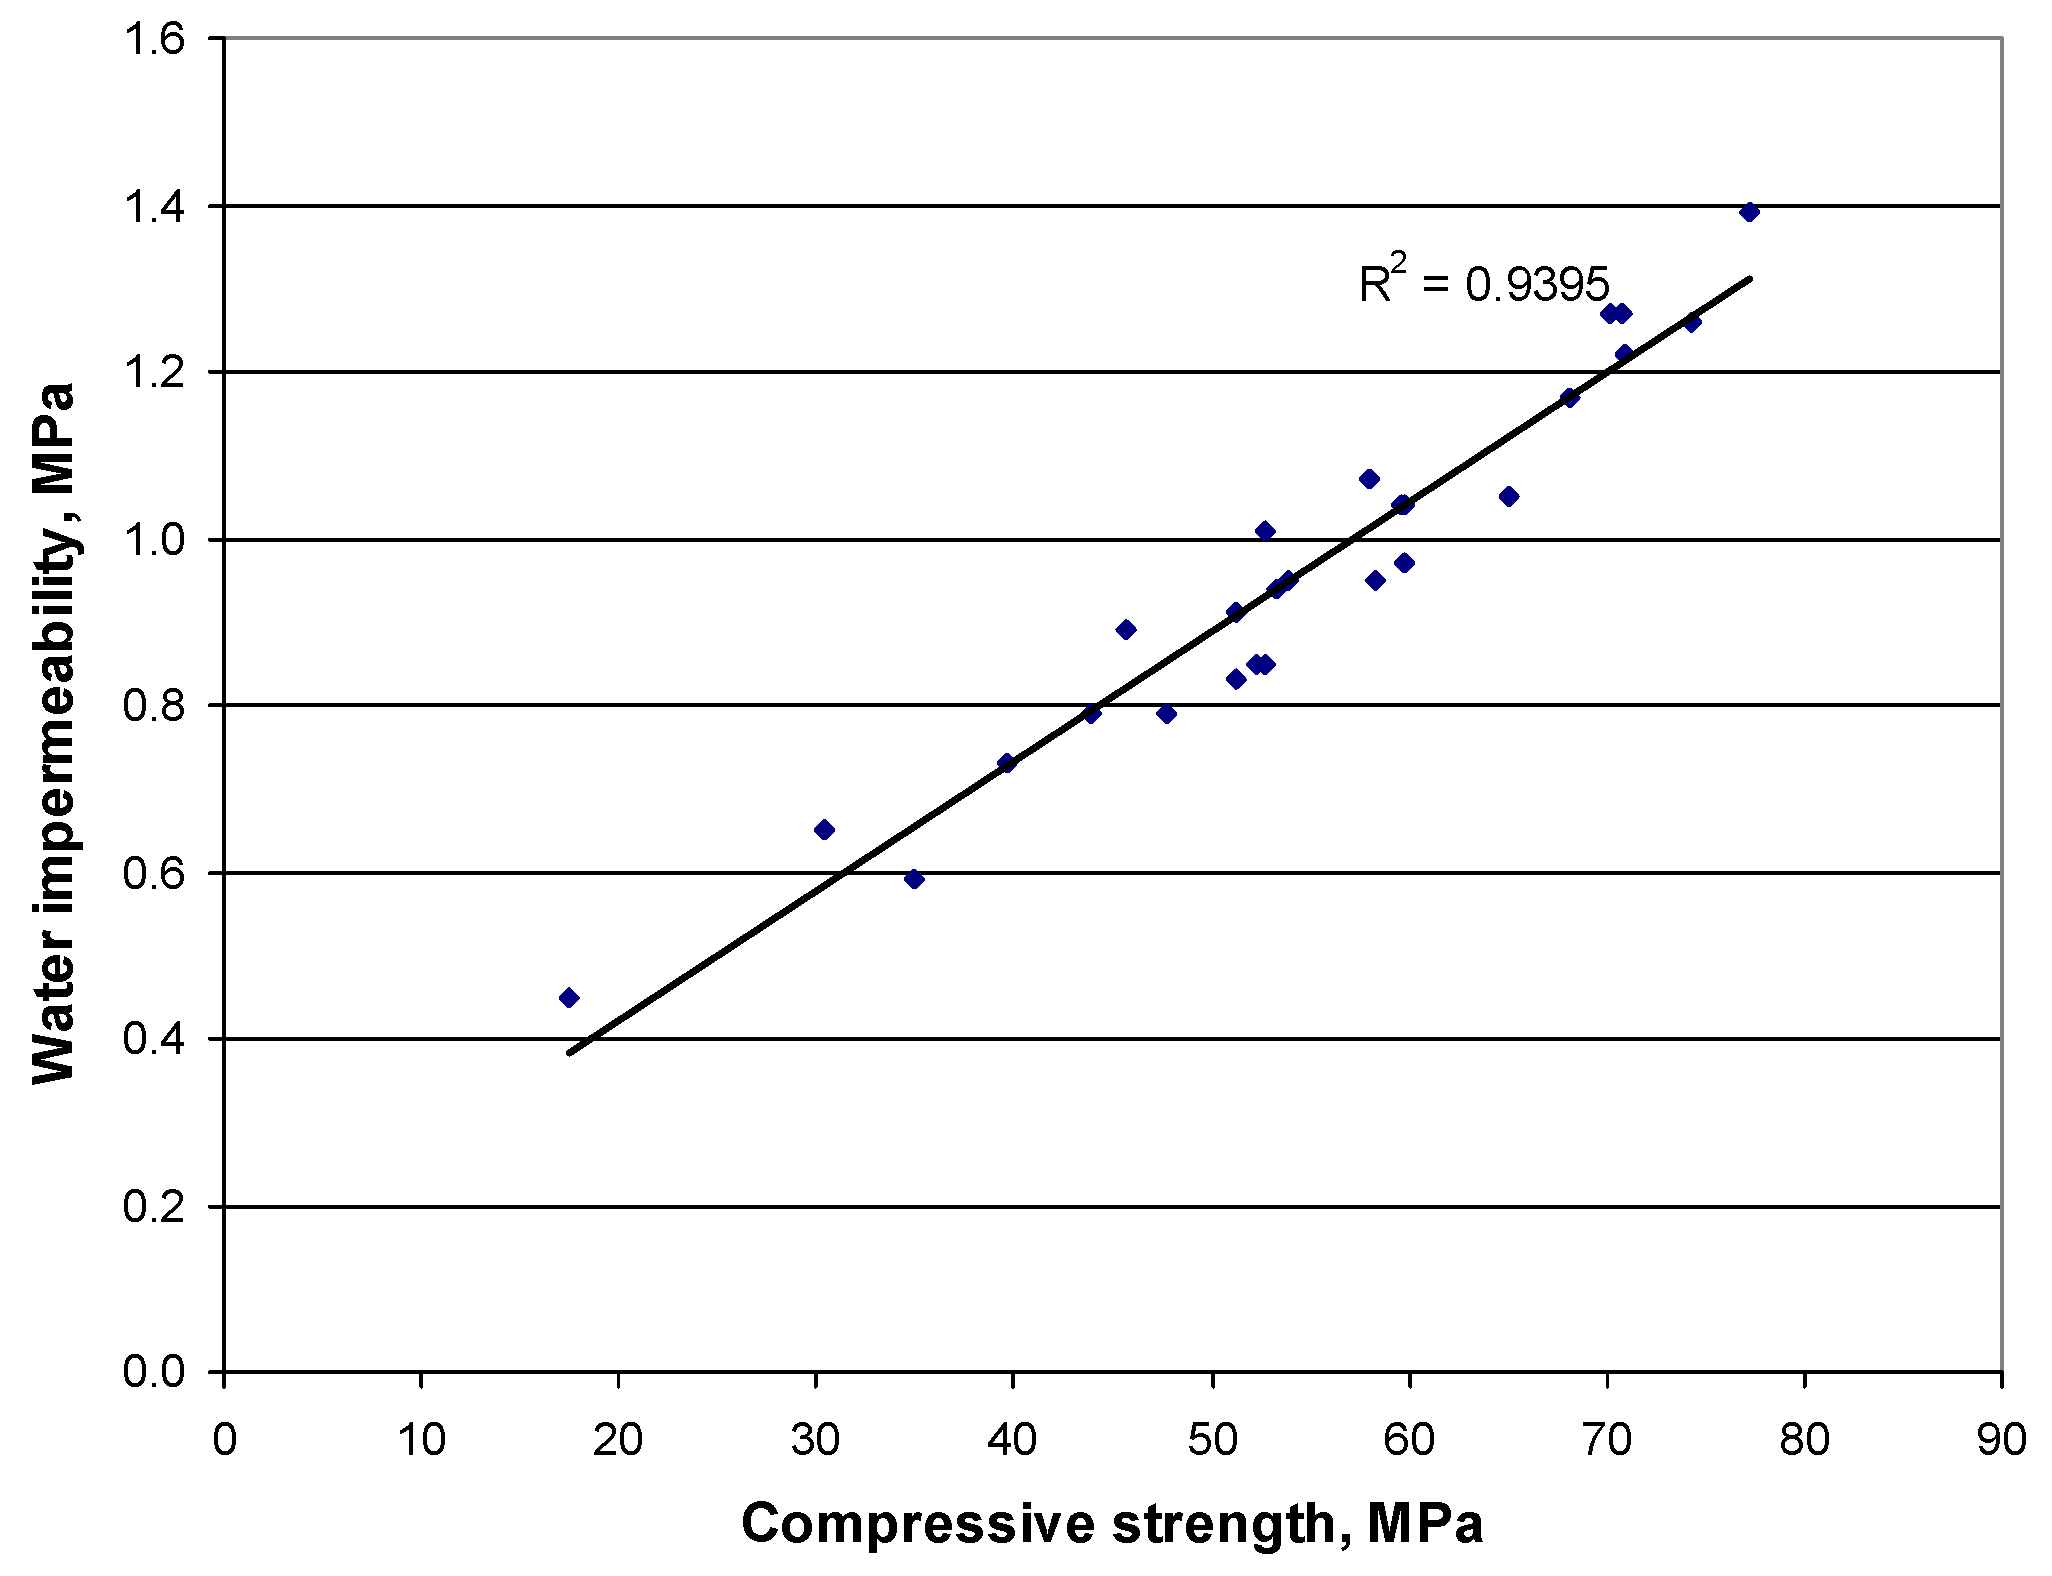
Based on the obtained experimental data, a linear relationship between the compressive strength and water impermeability of self-compacting fly-ash-containing concrete was obtained (
Figure 7). It is described by the following equation:
The correlation analysis made it possible to establish a correlation coefficient between the strength and water resistance of self-compacting fly-ash-containing concrete, which is 0.969.
The obtained mathematical models make it possible to determine the nature of the relationship between the studied properties and the possibility of predicting the water impermeability of self-compacting fly-ash-containing concrete based on correlation dependencies.
To verify the relevance of the experimental and calculated values of water impermeability, a special experiment was performed, the results of which are shown in
Table 6. The previously specified materials were used in the experiments.
The results in
Table 6 show that the accuracy of calculating the water impermeability values using Equation (9) is sufficiently good.


 ,
, 


