Article

Dynamic Multi-Attribute Decision-Making Method for Risk-Based Ship Design

1
School of Management Engineering, Qingdao University of Technology, Qingdao 266520, China
2
State Key Laboratory of Ocean Engineering, Shanghai Jiao Tong University, Shanghai 200240, China
*
Author to whom correspondence should be addressed.
Appl. Sci. 2024, 14(13), 5387; https://doi.org/10.3390/app14135387
Submission received: 28 May 2024 / Revised: 11 June 2024 / Accepted: 18 June 2024 / Published: 21 June 2024
(This article belongs to the Special Issue Advances in Applied Marine Sciences and Engineering—2nd Edition)

Abstract

:
Formal safety assessment (FSA) is regarded as an effective approach to support decision-making in shipbuilding to balance safety, technology, and cost. However, the selection of risk control options (RCOs) in the FSA process still needs to be studied before the FSA becomes a generic approach. This study proposed a multi-attribute-based assessing model to support the decision-making process regarding RCOs. The attributes of RCOs were divided into the performance and cost-effectiveness attribute sets. Moreover, a dynamic selection procedure of attributes was designed based on the ‘as low as reasonable and practicable’ (ALARP) principle. The application of the dynamic multi-attribute model can make it possible to rank RCOs by considering the changes in the decision-makers’ risk aversion to risk levels. In this model, a comprehensive weighting method based on game theory was used to balance the subjective and objective weights of the attributes. An improved grey rational analysis (GRA) was used to perform the multi-attribute assessment of RCOs. Therefore, this dynamic multi-attribute model is combined with the ALARP principle and evaluated using GRA. Finally, a case regarding crude tankers was studied using the proposed model to verify the feasibility and reliability of the dynamic multi-attribute model.

1. Introduction

The FSA of ships was first proposed in the U.K. in the 1980s; it is a structured, systematic method and includes five steps: hazard identification, risk analysis, risk control options, cost-effectiveness assessment (CEA), and decision-making recommendations (Wang 2002) [1]. The International Marine Organization (IMO) originally studied FSA at the 62nd Marine Safety Committee (MSC) in 1993. In 2013, the MSC-Marine Environment Protection Committee (MSC-MEPC) of the IMO published the ‘Revised guideline for FSA for use in the IMO rule-making process’. FSA studies have been widely used to support an organization’s decision-making process to maintain a balance between security, technology, and cost. Banda et al. [2] analyzed the probability of oil leakage caused by collisions involving tanker ships and other types of vessels based on the FSA steps. Wang et al. [3] used the FSA method to identify and assess the risks of each process, to determine the negligible risk, reasonably feasible low risk, and unacceptable risk, and to propose corresponding safety measures to provide safety for the operation of LNG bunkering vessels. Siljung [4] developed an improved risk assessment technique based on FSA to propose a safety policy for ships using liquefied petroleum gas engine systems. Meriam et al. [5] proposed a framework for selecting a ship’s RCOs with a higher degree of autonomy in maritime risk assessment and formal safety assessment. FSA for vessels is a systematic method used to assess various safety risks that vessels may face during navigation. Currently, research on FSA is still relatively weak and based on theoretical frameworks. Before FSA becomes a universal method, some detailed issues still need to be addressed.
For example, the question of ranking and optimizing RCOs was raised by the spill panel of experts in FSA practice. The IMO guidelines generally use a single index, the cost of averting a fatality (CAF), to assess RCOs. The CAF is not a perfect index because certain risk factors, such as environmental pollution and property loss, cannot be considered. Bao et al. [6] and Liu et al. [7] integrated the CAF and cost of averting a ton of oil (CATS) into a multi-attribute system as an alternative for assessing RCOs. Puisa [8] and others discussed the robustness assessment of current methods for cost-effective risk control schemes through the FSA guidelines of the International Maritime Organization. Montewka [9] argued that the FSA proposed by the International Maritime Organization is too narrow in defining risks and proposed a risk management approach applicable to the maritime sector, introducing a qualitative scoring system and demonstrating its applicability to the exemplary risk modeling of passenger ships. However, the proposed multi-attribute system only focused on cost-effectiveness factors. If RCOs were ranked only by using the CEA, certain options that exhibit excellent performance in averting fatalities or oil spills would likely be screened only because of their high costs. In particular, when the risk level is identified as intolerable, CEA indexes obtained by an acceptable risk criterion based on the ALARP principle are unsuitable because intolerable risks should be controlled regardless of costs.
In current FSA studies, the ALARP is a popular principle to determine the acceptable risk criterion. Haddad and Harun [10] introduced ALARP limits for risk assessment and established a novel quantitative assessment tool applicable to road tunnels in the UK. Maselli et al. [11] proposed a tolerance and acceptability threshold applicable to estimating investment risk using the ALARP criterion. Jiang et al. [12] proposed a risk assessment analysis method based on the correlation of complex systems by identifying key safety elements through the ALARP principle. Baybutt [13] analyzed the application principles of ALARP in process safety, describing the consideration of risk estimation uncertainty and the use of prevention principles in the context of ALARP. Ge et al. [14] presented guidelines for the development of risk criteria for dams in developing countries, using China as an example, and proposed a targeted analytical method for selecting relevant parameters based on the ALARP principle and F-N curves showing the relationship between cumulative frequency and the number of potential fatalities. The ALARP principle reflects the risk aversion of decision-makers, that is, decision-makers have different attitudes towards risk control as the size of the risk varies. Thus, to consider the changes in risk aversion with risk level, a dynamic multi-attribute index system is used in this study, which involves the selection of the multi-attribute set depending on the acceptable risk level. For example, a CEA multi-attribute set is selected in a medium-risk condition and a performance multi-attribute set without cost indices is selected in a high-risk condition.
In recent years, in the research of risk control decision models, De Luque-Villa et al. [15] performed an environmental risk analysis of the oil and gas industry and created a multidisciplinary assessment model based on a probabilistic risk analysis approach. Ilczuk and Kycko [16] introduced a fuzzy set-based risk analysis method, which is useful for improving the safety of the investment process in the railroad traffic control industry. Sunil et al. [17] provided an innovative approach that combines cost-benefit analysis with STPA-BN-Influence diagrams for risk-based decision-making. Panagiotis et al. [18] introduced an enhanced risk model, combining event tree analysis and a Bayesian network for ship evacuation processes in order to help understand the actual risk of fire and flood events during evacuation and assess various risk control measures and mitigation strategies. This paper establishes a GRA model for RCO-level assessment based on multi-attribute evaluation, as the indicators for ship FSA and risk control decision-making are diverse and complex. It is difficult to quantify the impact of each indicator as some belong to grey areas. The GRA method can overcome issues such as incomplete data, high uncertainty, and difficulty in quantification. By calculating the grey relational degree (GRD) of indicator data, it can identify the degree of correlation between each indicator, thereby helping decision-makers to clarify the relationships between various indicators and assist in multi-attribute evaluation and decision-making for risk control measures. Therefore, using the grey relational analysis method for multi-attribute evaluation of risk control measures is a more suitable approach. The grey system theory was first proposed by Deng in 1989 [19] and, since then, it has been an important topic of discussion in multiple-attribute decision-making applications in engineering, e.g., in Feng et al. [20], Grdinic-Rakonjac et al. [21], Dey et al. [22], Ramesh et al. [23], and Zhou et al. [24]. In an FSA study of a ship, Li and Tang [25] initially ranked the RCOs by using a GRD-based multi-attribute assessment.
The results of the multi-attribute assessment depend significantly on the attribute weights. Currently, the commonly used methods for determining attribute weights can be categorized into three types according to the source of raw data. The first category is the subjective weighting method, i.e., determining the weights by taking into account the subjective preferences or experiences of the decision-making experts. Traditional subjective methods include the analytic hierarchy process (AHP) [26] and Delphi methods [27]. The second category is the objective weighting method, in which weights are set by a specific algorithm applied to the raw data without taking into account expert preferences. Conventional objective weighting methods include the entropy weighting method [28], the maximizing deviation method [29], and the linear programming method [30]. The third category integrates subjective preference and objective importance. Common methods for calculating comprehensive weights generally include the linear weighted synthesis method [31], the sum of squared deviations method [32], and the game theory method [33]. This study adopts game theory to determine the comprehensive weights. Game theory focuses on the interactions between formalized incentive structures and is a mathematical theory and methodology for studying competitive phenomena. Because the subjective and objective weighting methods each have their advantages and disadvantages, to resolve the conflicts between various methods and maintain their consistency, a Nash equilibrium is established by combining game theory to obtain an optimal combination of weights. In detail, an AHP-based method is used to determine the subjective preference of experts for attribute indices; following this, the data in the GRA are used to determine the objective importance; then, a game theory-based priority model is used to determine the integrated weights.
In addition, there are still some issues in the practical application of FSA. IMO has conducted FSA research on typical ship types and proposed a series of RCOs, but has not prioritized the research of these RCOs. Currently, there is a lack of systematic evaluation and verification of the practicability and justifiability of the newly proposed solution decision-making methods, and more empirical research is needed to verify the actual effectiveness of FSA. Tankers are the main type of energy transportation ships at present, with high operational risks. Once an accident occurs, the consequences are catastrophic. Therefore, studying accident risk control measures for tankers is valuable. Furthermore, tanker disasters result in casualties, property damage, environmental pollution, etc., which helps to illustrate the advantages of multi-factor decision-making. Therefore, in this paper, the feasibility and rationality of the proposed dynamic multi-attribute evaluation model are verified by taking the RCO decision of tanker carriers as an example.

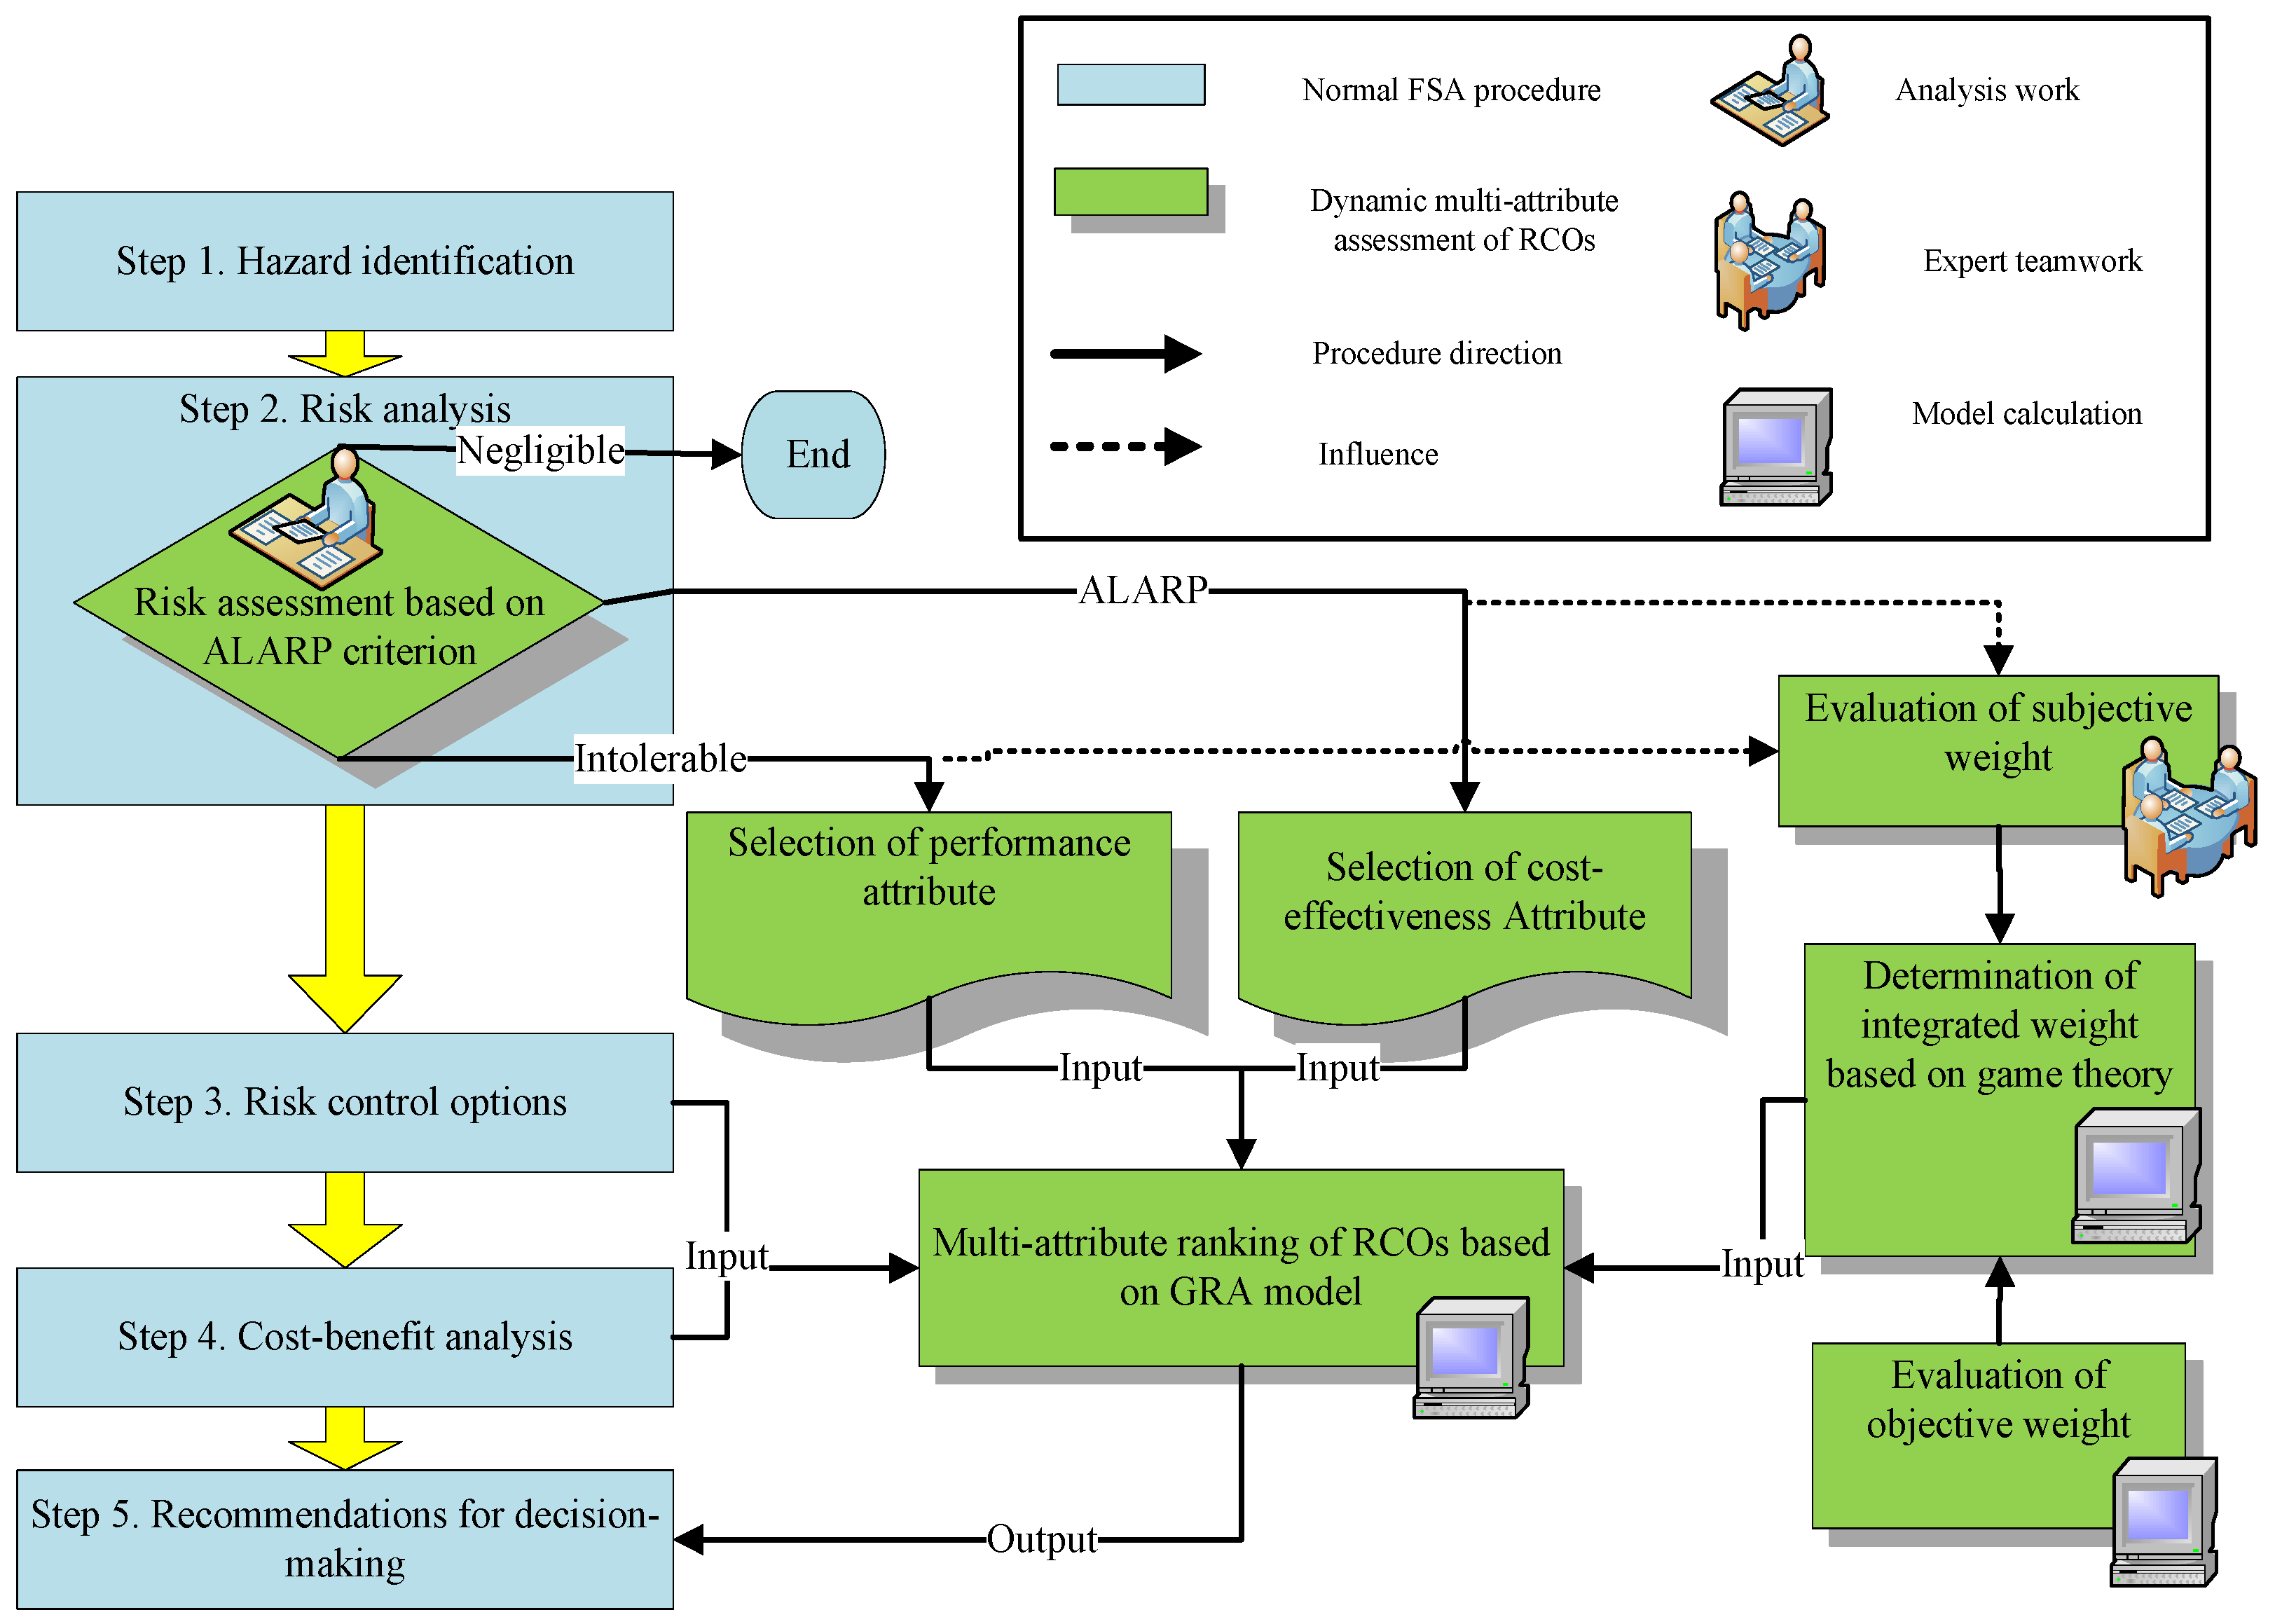
2. A Dynamic Multi-Attribute System for RCO Ranking

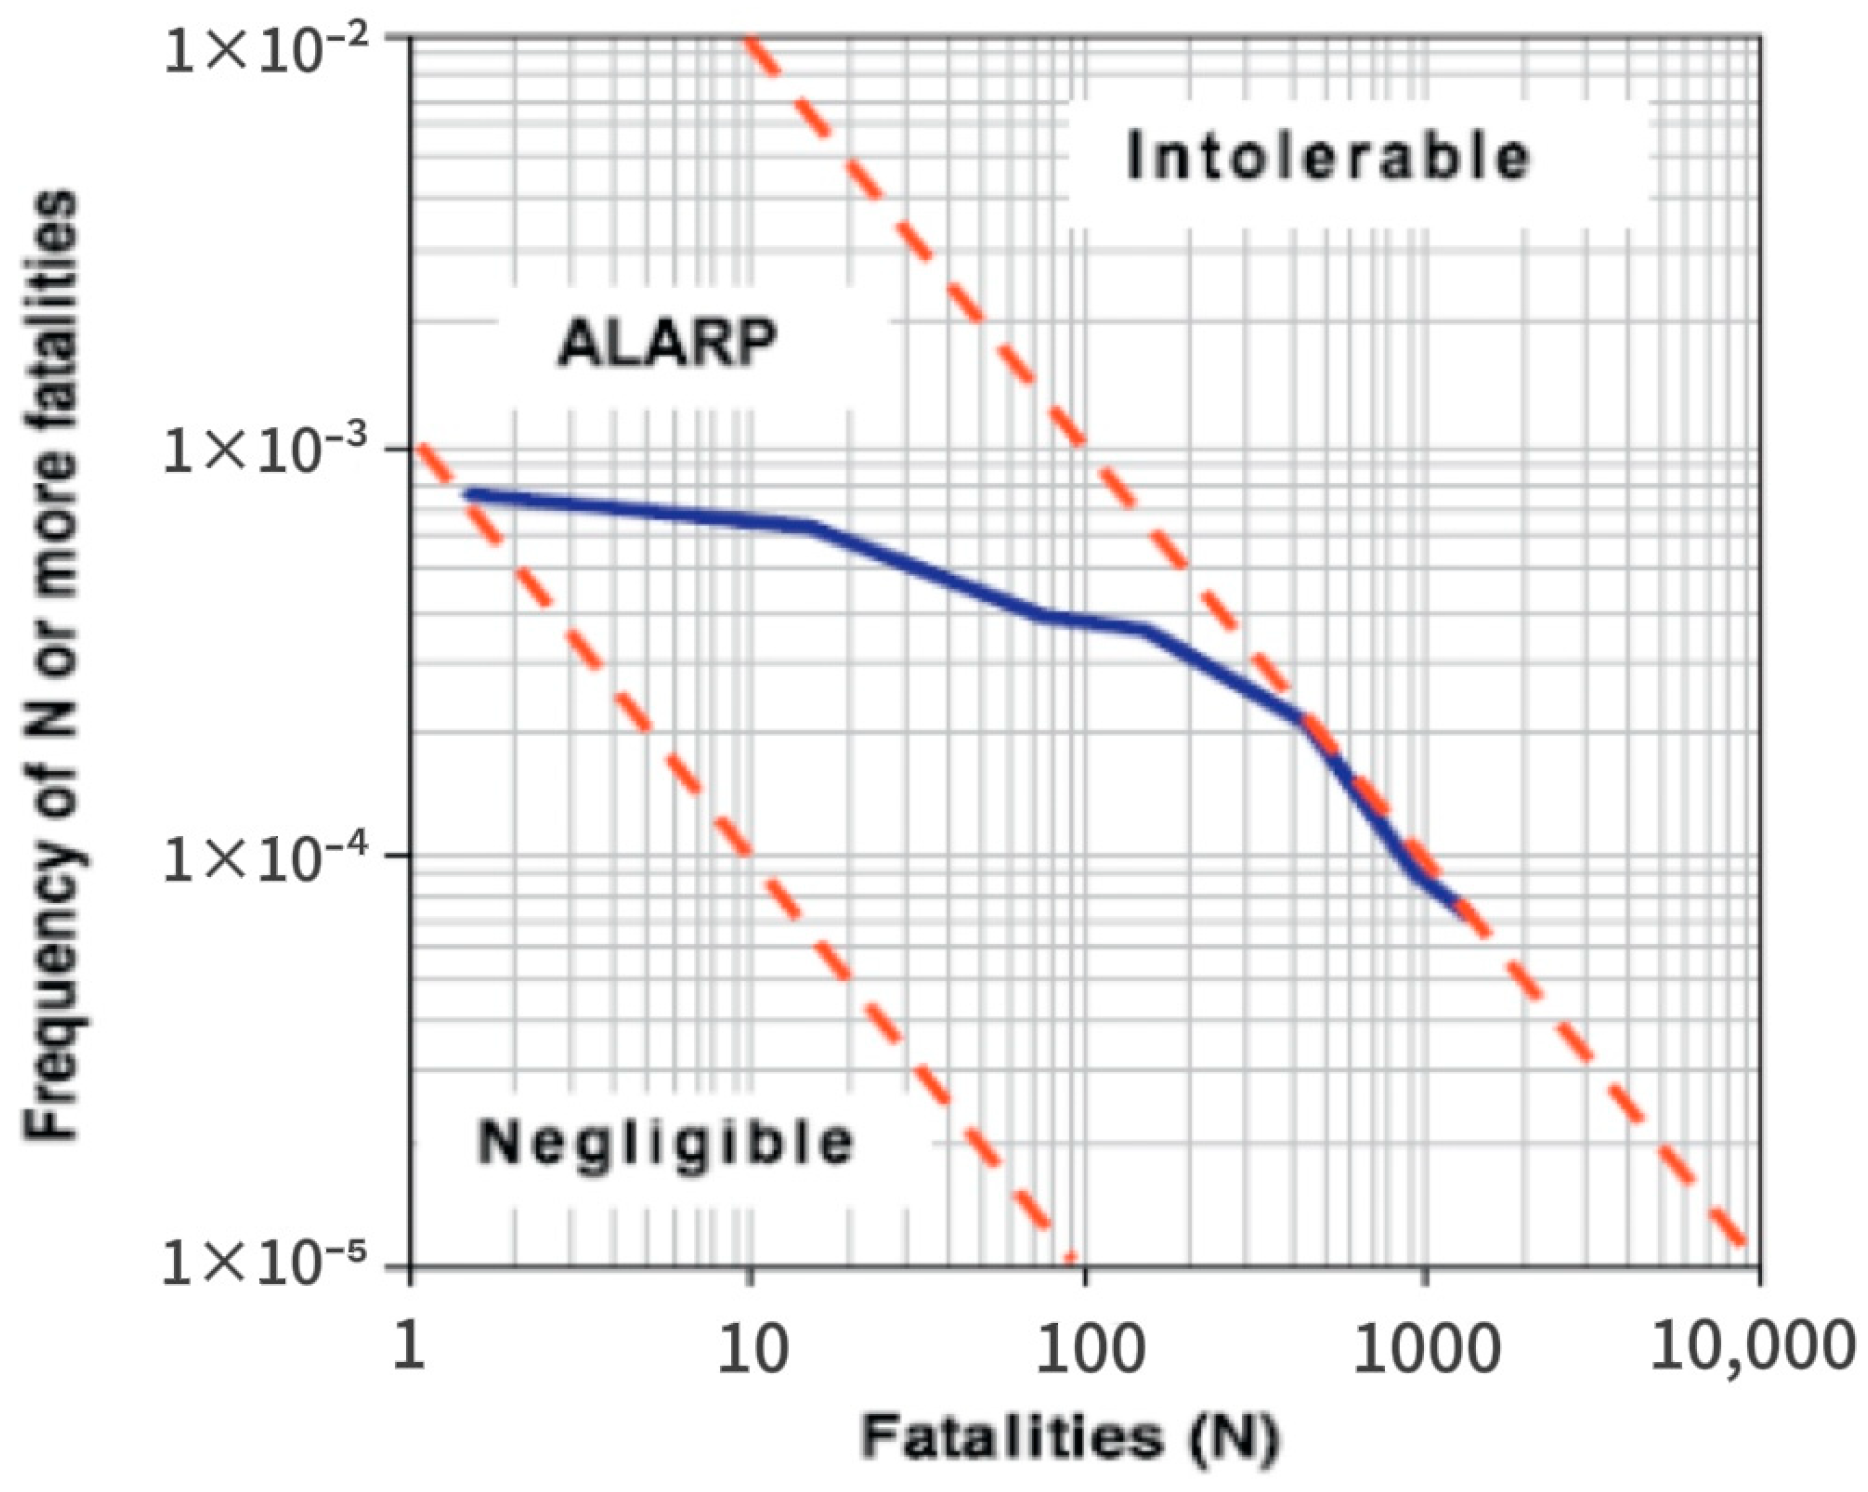
2.1. FSA and the ALARP Principle

The ALARP principle sets the standard for risks, meaning that the risk level should be minimized as much as possible, within technically and economically feasible limits. As shown in Figure 1, the normal ALARP-based standard establishes an upper limit on the maximum tolerable risk, which should not be exceeded, regardless of the cost of keeping the risk below that limit. It is also possible to set a lower limit, below which the level of risk below that curve is determined to be negligible, and below which no mandatory risk reduction measures are required. The level of risk between these two limits could then be required to be kept as low as reasonably practicable, based on cost-benefit considerations and the ALARP principle.
FSA is a structured and systematic methodology for conducting risk analysis and cost-benefit assessments and can be used as a tool to help assess ship security in five steps. (1) step 1 of the FSA involves identifying the potential causes and consequences of scenarios relevant to all incidents. (2) Through the risk assessment based on the ALARP criterion in step 2 of the FSA, risk areas needing control can be identified. (3) In step 3 of the FSA, potential RCOs are identified by using structured review techniques. There is a wide variety of RCOs, ranging from technical measures included in the design of a ship to specific changes in the ship’s watch plan. A published report describes the typical and recommended RCOs [35]. (4) Next, step 4 of the FSA compares the benefits and costs associated with implementing each identified RCO. In this step, certain CEA indices can be used to rank the RCOs from a cost–benefit perspective (e.g., to screen for products that are not cost-effective or impractical). The CEA index can be the cost of averting a fatality, namely, the gross cost of averting a fatality (GCAF) or the net cost of averting a fatality (NCAF). Similarly, Vanem et al. [36] proposed the CATS as a way to determine the CEA index for accidental oil spills. (5) Step 5 of the FSA is to provide recommendations for decision-making, including cost-benefit information on hazards, associated risks, and alternative RCOs.

2.2. Dynamic Multiple-Attribute Indices System

A multi-attribute assessment model is used to rank RCOs. As analyzed in Section 1, if the RCOs were assessed only by using the abovementioned CEA indices, options that exhibit excellent performance in controlling risks would likely be screened only because of their high costs. Thus, more performance indices are added to the multi-attribute system, such as △PLL, △PLO, and △PLP, where △PLL represents the decrease in life loss risk (potential loss of lives) by carrying out an RCO; △PLO denotes the decrease in oil spill risk (potential loss of oil spill); and △PLP represents the decrease in property loss risk (potential loss of property).
Furthermore, a dynamic multi-attribute system is proposed to rank RCOs, especially for FSA projects based on the ALARP principle. This system has two typical alternative multi-attribute index sets: cost-effectiveness indicators (GCAF, NCAF, and CATS) and performance indices (△PLL, △PLO, and △PLP). Figure 2 shows the dynamic selection procedure of multi-attribute sets: if the risk levels (life loss risk and oil spill risk) are in the ALARP area (as shown in Figure 1), the cost-effectiveness index set could normally be used. If any of the risks (life loss risk or oil risk) are high and lie in the intolerable area, the performance index set should be used because the risks should be reduced as much as possible regardless of the cost factors. Thus, the decision-makers’ aversion to high risks can be reflected in the selection procedure of RCOs.

3. GRA Model for RCO Ranking

All of the performance indices (△PLL, △PLO, and △PLP) can be estimated using a risk analysis, but it is difficult to quantitatively evaluate the global performance extent of each RCO because these indices belong to different dimensional attributes. A GRA can then be used to quantify the relationship between two data sequences. As shown in Figure 3, the GRD of any sequence in A, B, C, or D is high if it has similar trends with the reference sequence X; otherwise, the GRD is low.

3.1. Model Definition

Assuming that there are n RCOs forming an option set O = ( O 1 , O 2 , , O i , , O n ) , each RCO has m attribute indices forming an attribute set V = ( V 1 , V 2 , , V J , , V m ) . Thus, x i j is defined as the experiment value of attribute V j in option O i . The information sequence X i = ( x i 1 , x i 2 , , x i m ) indicates m attribute experimental values in option O i .
For the ideal option O 0 , X 0 = ( x 01 , x 02 , , x 0 m ) indicates the ideal sequence. x 0 j can be determined depending on the types of attribute indices V j as follows:
x 0 j = max x 1 j , x 2 j , , x n j , V j L B A min x 1 j , x 2 j , , x n j , V j S B A
where LBA indicates ‘the larger the better attribute’ indices, such as △PLL, △PLO, and △PLP, whereas SBA indicates ‘the smaller the better attribute’ indices, such as GCAF, NCAF, and CATS.

3.2. Linear Normalization of Attribute Sequences

For the above information model, the first step of the GRA is linear normalization of the experimental data. Following this, all of the experimental values of each attribute are normalized into non-dimensional data varying from 0 to 1.
The experiment value of a ‘the larger the better attribute’ can be normalized to the following style:
x i j = x i j min x 1 j , x 2 j , x n j max x 1 j , x 2 j , x n j min x 1 j , x 2 j , x n j
The experiment value of a ‘the smaller the better attribute’ can be normalized to the following style:
x i j = max x 1 j , x 2 j , x n j x i j max x 1 j , x 2 j , x n j min x 1 j , x 2 j , x n j
Through the above normalization, the information sequence of the ideal option is transformed to X 0 = ( x 01 , x 02 , , x 0 m ) and all the ideal attribute values in it should be equal to 1 ( x 0 j = 1 ). The experiment value sequences of the RCOs being assessed are transformed to X i = ( x i 1 , x i 2 , , x i m ) .

3.3. Calculation of Grey Rational Coefficients

In a GRA, the grey rational coefficient γ i j indicates the relationship between the ideal normalized value x 0 j and the actual normalized value x i j in the attribute index V j . It is defined as:
r i j = min 1 i n min 1 j m x i j x 0 j + ρ max 1 i n max 1 j m x i j x 0 j x i j x 0 j + ρ max 1 i n max 1 j m x i j x 0 j
where ρ is the distinguishing coefficient set between 0 and 1. In this study, it was set at ρ = 0.5 .

3.4. Calculation of GRD

In the last step, the GRD is calculated by averaging the grey relational coefficients in m attributes. The GRD between the ideal option O 0 and the assessed RCO O i can be obtained as follows:
r i = 1 m j = 1 m w j r i j   ( i = 1 , 2 , , n )
where w j is the importance weight of the attribute index V j , r i is the GRD in the i t h RCO, and it indicates how close the experimental values given in this RCO are to the ideal option.

4. Determination of Attribute Weights

The weights of the attribute indices have a significant impact on the RCO sorting results. There are various ways to set the weights.

4.1. Subjective Weight

In the maritime industry, experts in different fields pay different levels of attention to the indices of each attribute or have a tendency toward certain indices. To show the difference in preference, experts from different fields should be invited to form a working group to weigh the importance of attribute indices.
For each expert in the working group, an AHP is used to weigh the attribute indices. The AHP method is a traditional subjective weighting method proposed by T.L. Saaty of the University of Pittsburgh in the 1970s, which transforms qualitative analysis into quantitative calculations by taking into account the experience of experts.
Once each expert provides his/her subjective weight set of attribute indices by the AHP method, a total subjective weight set w s = w s 1 , w s 2 , , w s j , w s m can be obtained by Formula (6), where N represents the number of experts invited, w s k = w s k 1 , w s k 2 , , w s k j , w s k m denotes the weight set given by expert k , and z k represents the importance weight of expert k , and it can be determined by the organizer of the FSA project.
w s = k = 1 N z k w s k   ( k = 1 , 2 , , N ; z 1 + z 2 + + z k = 1 )

4.2. Objective Weight

The objective weight method seeks to mine hidden relationships in data excluding those in subjective factors, and it can be used to balance the influence of subjective bias. The GRA procedure in Section 3 can be used to evaluate the objective weight w o = w o 1 , w o 2 , , w o j , w 0 m , where w o j denotes the objective weight of the attribute index and can be determined by Formula (7),
w o j = 1 n i = 1 n γ i j j = 1 m 1 n i = 1 n γ i j ( i = 1 ,   2 ,     ,   n ; j = 1 ,   2 ,     ,   m )

4.3. Integrated Weight

A strategy based on game theory [37] is applied to integrate the subjective and objective weights. If the weight set determined by any of the methods was defined as w l = w l 1 , w l 2 , , w l j , w l m , the integrated weight w of all methods can be determined by Formula (8),
w = l = 1 L a l w l T   ( l = 1 , 2 , , L ) , a i > 0
where L is the number of methods producing a weight and a l is an importance coefficient related to w l .
For getting the most reasonable w , a l ( l = 1 , 2 , , L ) needs to be optimized to minimize the dispersion of w and w l , as follows:
min i = 1 L a i w i T w l T 2 , ( l = 1 , 2 , 3 , L )
The first derivative style of the optimization requirement in Formula (9) can be transformed into the following linear equation:
w 1 w 1 T w 1 w 2 T w 1 w L T w 2 w 1 T w 2 w 2 T w 2 w L T w L w 1 T w L w 2 T w L w L T a 1 a 2 a L = w 1 w 1 T w 2 w 2 T w L w L T
where ( a 1 , a 2 , , a L ) can be obtained by solving Equation (10), and their normalization can be performed in the following way:
a l * = a l l = 1 L a l
Therefore, the optimal integrated weight can be determined as follows:
w * = l = 1 L a l * w l T

5. Example Application

5.1. Case Background

The IMO conducted an FSA of oil tankers at a high level in the IMO FSA report. In step 1 and step 2 of this FSA, collision, grounding, fire, and blast contacts were identified as the main accident hazards, and the corresponding risks (accident probability and consequence) were analyzed quantitatively. In step 3, eight types of RCOs are proposed by an expert group to control accident risks and are listed in Table 1. The cost-benefit analysis was conducted using the GCAF index, and the analysis results were compared with the improved grey correlation degree method to demonstrate the reliability of the new method when considering more attribute indicators.
In Table 2, all the index data are the average attribute level per ship in its lifetime (25 years). Because the attribute data of certain options do not exist (as presented in Table 2), the most conservative information-processing method is used to complement them. In risk assessment, if some attribute data are missing, the most conservative information processing method can be used to supplement it in order to avoid underestimating the risk. This approach maximizes the risk estimate, thereby better protecting interests and safety. It helps to prevent potential risks to the greatest extent possible, avoiding the underestimation of risks due to missing data, which could lead to accidents or losses. This conservative decision-making enables more cautious actions to be taken in the face of uncertainty and risk, thereby reducing potential risks and losses. For example, the △PLL data of RCO3 do not exist, and therefore, the minimum data in the △PLL sequence (0.00012) are used to complement it; the CATS data of RCO7 do not exist, and thus, the maximum data in the CATS sequence (320) are used to complement it.

5.2. Traditional FSA

Traditional RCOs rely solely on cost-benefit indicators such as GCAF, NCAF, or CATS for decision-making. For example, GCAF represents the cost of reducing the risk of one fatality, characterizing the risk control efficiency of the RCO. The smaller the GCAF, the more optimal the scheme is considered. The results of the traditional FSA are shown in Table 3:

5.3. GRA for ALARP Risk Levels

5.3.1. Selection of Multi-Attribute Indices

As shown in Figure 4, the IMO FSA on crude oil tankers concluded that the total risk to the crew is in the ALARP area. Thus, according to Section 2, the cost-effectiveness attribute index set (GCAF, NCAF, and CATS) is selected to rank the RCOs. According to Formula (1), the ideal option has the ideal attribute set X0 = (X0, GCAF, X0, NCAF, X0, CATS) = (1.45, −46.6, 2.5).

5.3.2. Linear Normalization of the Attribute Sequences

Through linear normalization according to Formula (4), a normalized attribute matrix can be obtained.
X = [ x i j ] 8 × 3 = x 1 , G C A F x 1 , N C A F x 1 , C A T S x 2 , G C A F x 2 , N C A F x 2 , C A T S x 8 , G C A F x 8 , N C A F x 8 , C A T S

5.3.3. Grey Rational Coefficient Matrix

Through the calculation of Formula (5), a grey rational coefficient matrix can be obtained.
[ γ ij ] 8 × 3 = γ 1 , G C A F γ 1 , N C A F γ 1 , C A T S γ 2 , G C A F γ 2 , N C A F γ 2 , C A T S γ 8 , G C A F γ 8 , N C A F γ 8 , C A T S

5.3.4. Integrated Weight

In this case, three experts, from a maritime authority, a research institution, and a ship-owning company, respectively, are invited to give their opinions on the subjective weights of GCAF, NCAF, and CATS. To balance the preferences of stakeholders, the three experts are given equal importance ( z 1 = z 2 = z 3 = 1 / 3 in Formula (6)). The objective weights can be obtained according to Section 4.2. Following this, by using the model based on game theory proposed in Section 4.3, the integrated weights w can be determined, as presented in Table 4.

5.3.5. GRD Calculation

According to Formula (7), the GRD for each RCO with the desired option can be calculated and the results are shown in Table 5.

5.4. GRA for Intolerable Risk Levels

For the crude oil tankers assessed, in the case where the F–N curve (total accident risk to the crew) breached the upper limit, the performance attribute index set (△PLL, △PLO, and △PLP) is selected to rank the RCOs. In this assumed condition, according to Formula (1), the ideal option has the ideal attribute set X0 = (X0, △PLL, X0, △PLO, X0, △PLP) = (0.019, 170, 5.67).
The GRA procedure is similar to step 5 in Section 5.3, and the corresponding results are also listed in Table 5 and Table 6.

5.5. GRA-Based RCO Ranking

The eight types of RCOs are ranked using the dynamic multi-attribute method, and two levels of risk to the crew, ‘ALARP and intolerable’, are considered. When the risk level is in the ALARP area, the cost-effectiveness attribute index set (GCAF, NCAF, and CATS) is selected to rank the RCOs based on the GRA. When the risk level is in the intolerable area, the performance attribute index set (△PLL, △PLO, and △PLP) is selected.

5.6. Analysis of Results

First, compared with the traditional method in the multi-attribute-based RCO ranking process, it was found that the order of advantages and disadvantages of some programs changed. Therefore, in the multi-attribute-based RCO ranking process, certain RCOs with advantages in controlling oil spills, such as RCO2 and RCO6, attract more attention than those in the single-attribute GCAF-based assessment (as presented in Table 6).
Secondly, the results based on the two multi-attribute sets are still different, as can be seen in Table 6 and Figure 5. For example, RCO1 is not an excellent option in the performance assessment based on (△PLL, △PLO, △PLP), but it shows its advantages in the cost-effectiveness assessment based on (GCAF, NCAF, CATS) because its cost is very low. Lower costs mask their shortcomings in risk reduction. Therefore, the use of gray correlation metrics allows for the separate consideration of risk and cost, especially as programmatic decisions are influenced by the combination of empowerment.
In addition, RCO6 is the best option in both the performance and cost-effectiveness assessments. This indicates that RCO6 should always be preferred whether the accident risk levels are in the ALARP or intolerable area.

6. Conclusions

In this paper, the GRA model is used to rank RCOs based on multi-attribute indices. In particular, systematic weighting methods are used to make the multi-attribute assessment more reasonable. The AHP method is useful to reduce the experts’ errors in the subjective weighting process. The objective weights can be obtained more easily by the GRA. Furthermore, the game theory-based optimization method provides a way to balance the subjective and objective weights when integrating them.
Through the study of a series of methods and case analyses, a systematic model for decision-making on RCOs in the FSA process of a ship is proposed. The multi-attribute assessment model is proved to be more sensitive and reasonable for RCO selection than the rule method based on a single CEA index. When an acceptable risk criterion based on the ALARP principle is used in the FSA, the proposed dynamic multi-attribute index system makes it possible to select RCOs by considering changes in the decision-makers’ risk aversion.
The FSA methodology is a methodological system that involves multiple work steps, but the work in this paper is not yet complete and deserves to be further researched and explored in future research endeavors in this field. The key to the new model proposed in this paper is the rationality of the ALARP criterion; this paper does not consider which attributes should be taken into account when the risk is near the boundary line, and the direct conversion of the attribute indicator set in full accordance with the boundaries seems a bit abrupt, which will continue to be considered in the future. In addition, when measuring the effectiveness of various types of risk control measures, the degree of accuracy depends on the accurate measurement of the risk value before and after the RCO is taken, so as the risk model is more scientifically sound to quantify the level of risk, this new model will be more practical.

Author Contributions

Conceptualization, methodology, software, funding acquisition, X.L.; validation, formal resources, data curation, writing—original draft preparation, X.L. and X.Z.; analysis, investigation, X.Z.; investigation, writing—review and editing, Y.Y. All authors have read and agreed to the published version of the manuscript.

Funding

This research received no external funding.

Institutional Review Board Statement

Not applicable.

Informed Consent Statement

Not applicable.

Data Availability Statement

The data used to support the findings of this study are included within the article and are also available from the corresponding authors upon request.

Acknowledgments

The study in this paper was supported by the Ministry of Industry and Information Technology of the People’s Republic of China.

Conflicts of Interest

The authors declare no conflicts of interest.

References

  1. Wang, J. Offshore safety case approach and formal safety assessment of ships. J. Saf. Res. 2002, 33, 81–115. [Google Scholar] [CrossRef] [PubMed]
  2. Banda, O.A.V.; Goerlandt, F.; Kuzmin, V.; Kujala, P.; Montewka, J. Risk management model of winter navigation operations. Mar. Pollut. Bull. 2016, 108, 242–262. [Google Scholar] [CrossRef] [PubMed]
  3. Wang, Y.L.; Cha, Z.Q.; Liang, G.P.; Zhang, X.; Li, K.; Guan, G. Risk assessment of lng bunkering vessel operation based on formal safety assessment method. Process Saf. Prog. 2023, 2024, 299–312. [Google Scholar] [CrossRef]
  4. Siljung, Y.; Byongug, J.; Won-Ju, L. Improved formal safety assessment methodology using fuzzy topsis for lpg-fueled marine engine system. Ocean. Eng. 2023, 269, 113536. [Google Scholar]
  5. Meriam, C.; Ahmad, B.; Sunil, B.; Banda, O.A.; Floris, G. Towards system-theoretic risk assessment for future ships: A framework for selecting risk control options. Ocean. Eng. 2022, 259, 111797. [Google Scholar]
  6. Bao, J.Z.; Liu, Z.J.; Wang, L.D. Selection model of risk control option based on dominance degree. J. Traffic Transp. Eng. 2011, 11, 82–87. [Google Scholar]
  7. Jingxia, L.; Wang, L.; Bao, J. The application of grey relational projection to rank and optimize risk control options. In Proceedings of the 2015 12th International Conference on Fuzzy Systems and Knowledge Discovery (FSKD), Zhangjiajie, China, 15–17 August 2015; pp. 1676–1680. [Google Scholar]
  8. Puisa, R.; Vassalos, D. Robust analysis of cost-effectiveness in formal safety assessment. J. Mar. Sci. Technol. 2012, 17, 370–381. [Google Scholar] [CrossRef]
  9. Montewka, J.; Goerlandt, F.; Kujala, P. On a systematic perspective on risk for formal safety assessment (fsa). Reliab. Eng. Syst. Saf. 2014, 127, 77–85. [Google Scholar] [CrossRef]
  10. Haddad, R.K.; Harun, Z. Development of a novel quantitative risk assessment tool for UK road tunnels. Fire 2023, 6, 65. [Google Scholar] [CrossRef]
  11. Maselli, G.; Macchiaroli, M.; Nesticò, A. Alarp criteria to estimate acceptability and tolerability thresholds of the investment risk. Appl. Sci. 2021, 11, 9086. [Google Scholar] [CrossRef]
  12. Jiang, Z.; Zhao, T.; Wang, S.; Ren, F. A novel risk assessment and analysis method for correlation in a complex system based on multi-dimensional theory. Appl. Sci. 2020, 10, 3007. [Google Scholar] [CrossRef]
  13. Baybutt, P. The alarp principle in process safety. Process Saf. Prog. 2014, 33, 36–40. [Google Scholar] [CrossRef]
  14. Ge, W.; Li, Z.; Liang, R.Y.; Li, W.; Cai, Y. Methodology for establishing risk criteria for dams in developing countries, case study of China. Water Resour. Manag. 2017, 31, 4063–4074. [Google Scholar] [CrossRef]
  15. De Luque-Villa, M.A.; Robledo-Buitrago, D.A.; Gómez-Rendón, C.P. Holistic environmental risk index for oil and gas industry in Colombia. Sustainability 2024, 16, 2361. [Google Scholar] [CrossRef]
  16. Ilczuk, P.; Kycko, M. Risk assessment in the design of railroad control command and signaling devices using fuzzy sets. Appl. Sci. 2023, 13, 12460. [Google Scholar] [CrossRef]
  17. Sunil, B.; Ahmad, B.; Jakub, M.; Meriam, C.; Banda, O.A. Selecting cost-effective risk control option for advanced maritime operations; integration of stpa-bn-influence diagram. Ocean. Eng. 2023, 280, 114631. [Google Scholar]
  18. Ventikos, N.P.; Panagiotis, S.; Manolis, A.C.P.V.; Evangelos, B.; Fotios, S.; Stefanos, C.; Alessandro, M. The development and demonstration of an enhanced risk model for the evacuation process of large passenger vessels. J. Mar. Sci. Eng. 2023, 11, 84. [Google Scholar] [CrossRef]
  19. Deng, J.L. Grey group decision in grey rationale space. Sci. Technol. Inf. Serv. 1989, 1, 1–24. [Google Scholar]
  20. Feng, S.S.; Chen, Z.J.; Guan, Q.S.; Yue, J.T.; Xia, C.Y. Grey relational analysis-based fault prediction for watercraft equipment. Front. Phys. 2022, 10, 885768. [Google Scholar] [CrossRef]
  21. Grdinic-Rakonjac, M.; Antic, B.; Pesic, D.; Pajkovic, V. Construction of road safety composite indicator using grey relational analysis. Promet-Traffic Transp. 2021, 33, 103–116. [Google Scholar] [CrossRef]
  22. Dey, P.P.; Pramanik, S.; Giri, B.C. An extended grey relational analysis based multiple attribute decision making in interval neutrosophic uncertain linguistic setting. Neutrosophic Sets Syst. 2016, 11, 21–30. [Google Scholar]
  23. Ramesh, S.; Viswanathan, R.; Ambika, S. Measurement and optimization of surface roughness and tool wear via grey relational analysis, topsis and rsa techniques. Measurement 2016, 78, 63–72. [Google Scholar] [CrossRef]
  24. Zhou, J.; Ren, J.; Yao, C. Multi-objective optimization of multi-axis ball-end milling inconel 718 via grey relational analysis coupled with rbf neural network and pso algorithm. Measurement 2017, 102, 271–285. [Google Scholar] [CrossRef]
  25. Li, X.; Tang, W. A multiple attribute decision-making model of ship risk control options based on gray correlation. Shipbuild. China 2015, 56, 193–200. [Google Scholar]
  26. Deng, Z.; Du, A.; Yang, C.; Tong, J.; Chen, Y. Multilevel evaluation model of electric power steering system based on improved combination weighting and cloud theory. Appl. Sci. 2024, 14, 1043. [Google Scholar] [CrossRef]
  27. Arden, B. A bonneville power administration delphi0 project for power system operation and control. IEEE Trans. Power Appar. Syst. 1983, PAS-102, 2104–2109. [Google Scholar]
  28. Chen, J.; Gao, C.; Zhou, H.; Wang, Q.; She, L.; Qing, D.; Cao, C. Urban flood risk assessment based on a combination of subjective and objective multi-weight methods. Appl. Sci. 2024, 14, 3694. [Google Scholar] [CrossRef]
  29. Wang, X.; Zhang, L. A combined weighting model based on maximizing deviation for multiple attribute decision-making. Adv. Mater. Sci. Eng. 2022, 2022, 7679851. [Google Scholar] [CrossRef]
  30. Nafei, A.; Huang, C.Y.; Azizi, S.P.; Chen, S.C. An optimized method for solving membership-based neutrosophic linear programming problems. Stud. Inform. Control. 2022, 31, 45–52. [Google Scholar] [CrossRef]
  31. Mojtaba, B.; Sham, R.A.; Ahmad, E.S. A linearization to the multi-objective linear plus linear fractional program. Oper. Res. Forum 2023, 4, 82. [Google Scholar] [CrossRef]
  32. Yang, W.; Zhao, Z.; Wang, X.; Hu, S. The large deviation results for the nonlinear regression model with dependent errors. TEST 2017, 26, 261–283. [Google Scholar] [CrossRef]
  33. Lin, K.; Li, B. A cloud- and game model-based approach to project evaluations of sustainable power supply investments. Sustainability 2024, 16, 4040. [Google Scholar] [CrossRef]
  34. Vanem, E. Ethics and fundamental principles of risk acceptance criteria. Saf. Sci. 2012, 50, 958–967. [Google Scholar] [CrossRef]
  35. Liwang, H.; Ringsberg, J.W.; Norsell, M. Quantitative risk analysis—ship security analysis for effective risk control options. Saf. Sci. 2013, 58, 98–112. [Google Scholar] [CrossRef]
  36. Vanem, E.; Endresen, O.; Skjong, R. Cost-effectiveness criteria for marine oil spill preventive measures. Reliab. Eng. Syst. Saf. 2008, 93, 1354–1368. [Google Scholar] [CrossRef]
  37. Lai, C.; Chen, X.; Chen, X.; Wang, Z.; Wu, X.; Zhao, S. A fuzzy comprehensive evaluation model for flood risk based on the combination weight of game theory. Nat. Hazards 2015, 77, 1243–1259. [Google Scholar] [CrossRef]
Figure 1. The standard line in the F-N diagram represents the absolute value of intolerable and negligible risks, between which is the ALARP area, to which the cost-effectiveness criterion applies [34].
Applsci 14 05387 g001
Figure 2. Dynamic multi-attribute assessment of RCOs in ship FSA procedures.
Applsci 14 05387 g002
Figure 3. Sketch map of GRD-based multi-index assessment.
Applsci 14 05387 g003
Figure 4. F–N curve of LNG carriers for total risk to crew.
Applsci 14 05387 g004
Figure 5. RCO ranking of crude oil carriers based on dynamic multi-attribute indices.
Applsci 14 05387 g005
Table 1. RCOs for accident risks of crude oil tankers.
RCOAccident Risks
RCO1Active steering gear redundancy
RCO2Electronic chart display and information
RCO3Terminal proximity and speed sensors
RCO4Navigational sonar
RCO5Better implementation of hot work
RCO6Double-walled hot fuel lines in the engine
RCO7Engine control room additional emergency
RCO8Hull stress and fatigue monitoring system
Table 2. Attribute indices of RCOs for crude oil tankers.
Performance AttributeCost-Effectiveness Attribute
△PLL
(Fatalities)
△PLO
(Tons of Oil Spill)
△PLP
(106 USD)
GCAF
(106 USD)
NCAF
(108 USD)
CATS
(102 USD)
RCO10.00012160.5340−43.83
RCO20.00121705.6762.5−46.64.4
RCO3-40.119--215
RCO40.00049702.36401−44.228
RCO50.019452.21.45−1.114.5
RCO60.0141545.32.7−3.712.5
RCO70.0044--3.170.0317-
RCO80.0005340.134241−0.102320
Table 3. Traditional FSA’s GCAF results and sorting of RCOs for crude oil tankers.
GCAFRanking
RCO1404
RCO262.55
RCO34018
RCO44017
RCO51.451
RCO62.72
RCO73.173
RCO82416
Table 4. Importance weights of the attribute indices of RCOs for crude oil tankers.
ALARP Risk LevelIntolerable Risk Level
GCAFNCAFCATS Δ P L L Δ P L O Δ P L P
w s 1 (E1)0.470.120.410.730.190.08
w s 2 (E2)0.320.370.310.560.250.19
w s 3 (E3)0.130.620.250.430.120.45
w s 0.310.370.320.570.190.24
w o 0.270.440.290.310.340.35
w 0.280.420.300.540.210.25
Table 5. GRD results and ranking orders of RCOs for crude oil tankers.
ALARP Risk LevelIntolerable Risk Level
GRDRankingGRDRanking
RCO10.74220.3416
RCO20.67630.6473
RCO30.33480.3338
RCO40.61950.3924
RCO50.65840.7352
RCO60.99410.7501
RCO70.45660.3655
RCO80.45370.3367
Table 6. GAD-based and GCAF-based RCO ranking for crude oil carriers (‘>’ denotes ‘is superior to’).
Attribute IndicesResults of RCO Ranking
(GCAF, NCAF, CATS)6 > 1 > 2 > 5 > 4 > 7 > 8 > 3
(△PLL, △PLO, △PLP)6 > 5 > 2 > 4 > 7 > 1 > 8 > 3
GCAF5 > 6 > 7 > 1> 2 > 8 > 4 > 3
Disclaimer/Publisher’s Note: The statements, opinions and data contained in all publications are solely those of the individual author(s) and contributor(s) and not of MDPI and/or the editor(s). MDPI and/or the editor(s) disclaim responsibility for any injury to people or property resulting from any ideas, methods, instructions or products referred to in the content.

