Abstract
This study aims to understand and simulate the mechanical properties of concrete, focusing specifically on the mesoscopic scale and its relation to the macro scale. Investigating concrete at this level involves examining its composition as a heterogeneous amalgamation of mortar, aggregates, and the Interfacial Transition Zone (ITZ). Numerical models, utilizing the finite element method (FEM), are employed to thoroughly examine the structural behavior of concrete. The study uses MATLAB (2023a) programming to develop three-dimensional models, which are then subjected to FEM analysis. Various mesoscopic Representative Volume Elements (RVEs) are formulated, considering spherical aggregates with different locations and dimensions to capture the complex nature of concrete. MATLAB is used to generate files containing comprehensive information about the RVEs, which are then processed with FEM to simulate compression strength tests. As the complexity increases with the inclusion of the ITZ, prismatic RVEs are developed to better represent real-world conditions. The proposed mesoscopic model establishes a foundational framework for a numerical simulation methodology tailored to laboratory compression tests, bridging the gap between mesoscopic and macroscopic scales. This approach provides detailed insights into concrete behavior, elucidating deformation and fracture mechanisms. Although not a complete substitute for experimental methods, these models offer a cost-effective and efficient alternative, identifying vulnerable areas and exploring the effects of additional materials on concrete behavior. The progressive replacement of laboratory tests with numerical simulations using RVEs of specific compositions will make the study of concrete behavior at the mesoscopic scale increasingly sustainable, paving the way for more efficient and environmentally friendly research practices in the field.
1. Introduction
Concrete, widely employed in construction due to its cost-effectiveness, strength, and durability, has diverse applications in civil engineering. However, its highly heterogeneous microstructure complicates predictions solely based on experiments. Theoretical studies employing micromechanics analysis help deduce macroscopic constitutive behavior. Comprising different phases, concrete’s behavior and properties exhibit variations across scales, from the microscopic to the macroscopic scales [1,2].
At the microscopic level, concrete is a composition of cement particles and water, forming an intricate cement paste that envelops aggregates like sand and gravel. The microstructure of this paste is complex, featuring porosities, micro-cracks, and other defects that can significantly influence its mechanical properties [3]. Zooming into the mesoscopic level, concrete reveals itself as a material consisting of three crucial phases: the mortar, comprising cement, water, and fine aggregate; the ITZ found between the coarse aggregate and the mortar; and the coarse aggregates themselves [4,5]. Each of these phases uniquely contributes to the overall behavior of the material. At this level, parameters like the shape, size, and distribution of coarse aggregates significantly impact concrete’s mechanical behavior. This study aims to create random mesostructured models for concrete, considering the coordinates and sizes of aggregate particles and then subjecting them to finite element method (FEM) analysis to understand their effects on macroscopic responses.
At the macroscopic level, concrete is simplified as a single-phase material characterized primarily by its compressive strength, modulus of elasticity, and flexural and tensile behavior. This macroscopic view is essential in the design process, where meticulous control and verification of these properties are imperative to ensure the safety and durability of constructed structures [6]. Engineers and architects rely on a thorough understanding of concrete’s behavior at different scales to optimize its use in various applications, meeting the stringent demands of modern construction standards.
Numerical models become valuable tools when examining concrete at the mesoscopic level, which deals with millimeter-scale dimensions. These models enable a detailed analysis of how concrete behaves at the specimen level. The material’s traits are intricately influenced by the properties of its key components: coarse aggregate, mortar, and the interface between them. Utilizing numerical models at this mesoscopic scale holds significant importance, offering insights into the mechanical aspects of concrete, such as its fracture toughness and load-bearing capacity. This approach provides a nuanced understanding of concrete behavior, contributing to advancements in structural engineering and material science [7].
Several mesoscopic models have been developed, each examining how material composition influences overall behavior [8,9,10]. Aggregate shapes, sizes, and distributions are essential factors affecting stress distribution and crack initiation. Various approaches, including truss models, lattice models, and finite element mesh simulations, have been employed to study concrete microstructure. Notably, the choice of aggregate size distribution, often described by grading curves like the Fuller curve, plays a vital role in concrete mix design, affecting the workability, mechanical strength, permeability, and durability of the material. Different methods have been used to simulate aggregate spatial distribution, such as take-and-place, divide-and-fill, stochastic-heuristic algorithms, and distinct element methods. Meshing techniques, such as aligned and unaligned approaches, help discretize mesoscopic models for numerical analysis. The ITZ between aggregates and mortar is recognized as influential in microcrack initiation, prompting varied approaches in mesh generation considering ITZ domains [11].
The main novelties of this work lie in two aspects: the algorithm used and the numerical model. Firstly, a MATLAB code has been developed based on the take-and-place method, which can design RVEs in prismatic or cylindrical forms, with filling characteristics as required in terms of aggregate percentage and size. Additionally, the ITZ has been considered, and it is possible to account for the presence of pores, although this option has not been chosen in this instance. The geometric arrangement ensures that aggregates do not touch or overlap, allowing consideration of the specific properties of the ITZ. Regarding the numerical model, a nonlinear combined mathematical model of concrete is used for the mortar and ITZ, based on the Drucker–Prager material model for compression stresses and the Willam–Warnke model for tension stresses, to predict both material failure modes: cracking and crushing.
For the contact between coarse aggregates and ITZ, a pure penalty algorithm between deformable surfaces with asymmetric behavior is used.
2. Materials and Methods
The fact that concrete is brittle in tension but relatively strong in compression, that the strength of the mortar is higher than that of the concrete itself, and that this strength decreases as the size of the coarse aggregate increases, as well as the permeability of high-density coarse aggregate concrete is higher than that of the cement paste, are questions about the behavior of concrete that are answered by the existence of the ITZ between the large aggregate particles and the hydrated cement paste [12]. Although composed of the same elements as the hydrated cement paste, the microstructure and properties of the ITZ differ from the bulk hydrated cement paste. Therefore, it is treated as a separate phase in the concrete microstructure.
Wittmann and his team [9] have delved into key aspects related to the ITZ and the behavior of concrete at the mesoscopic level. They have crafted both 2D and 3D models, meticulously considering the interplay between mortar and aggregates, along with the geometric and mechanical characteristics inherent to each phase.
The mesoscopic model developed by Wittmann is based on the concept that concrete can be considered a composite material formed by aggregates dispersed in a matrix of cement paste. In this model, concrete is divided into discrete elements called particles, representing the aggregates and the cement paste. Each particle is individually modeled, considering its geometric and mechanical properties. For instance, aggregates can be represented as spherical or ellipsoidal particles with specific size and strength properties, while the cement paste can be modeled as a continuous matrix with elastic or viscoelastic properties. Wittmann’s mesoscopic model allows for the simulation of the mechanical behavior of concrete by considering the interaction between particles [13,14]. External loads can be applied to study how forces are transmitted through the particles and the paste matrix. This allows the analysis of phenomena such as deformation, strength, fracture, and the long-term behavior of concrete. The model provides a more realistic representation of concrete behavior by considering the distribution and interaction of aggregates and allows the study of the influence of different parameters, such as the water–cement ratio, aggregate size, and material properties, on the mechanical properties of concrete. It is also useful for investigating the impact of defects and heterogeneities on material behavior. However, it is important to note that Wittmann’s mesoscopic model simplifies reality and requires careful selection of parameters and properties for accurate results, and its application can require significant computational resources.
In this work, a detailed mesoscopic model has been devised to represent concrete, consisting of three distinct phases: mortar, coarse aggregate, and the transition zone (Figure 1).
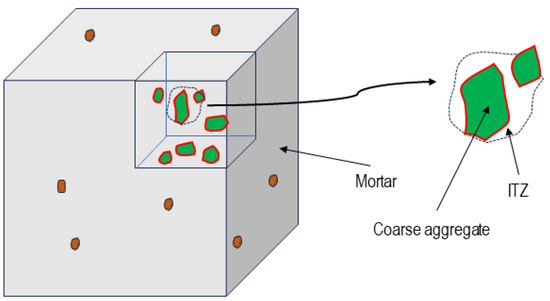
Figure 1.
RVE. Mesoscopic model section detail.
To carry out a successful numerical approximation, experimental tests were conducted on cubic specimens measuring 50 × 50 × 50 mm made of concrete dosed with a water-to-cement ratio (w/c) of 0.5 and with CEM I 52.5 cement. All manufactured specimens incorporated the same number of coarse limestone aggregates corresponding to the particle size fractions 8/10 mm, 6/8 mm, and 4/6 mm to ensure, as much as possible, the best reproducibility among tests and the production of specimens very similar to those simulated numerically. Before the tests, the manufactured specimens were cured for 28 days in a humidity chamber with a relative humidity of 95% and a temperature of 20 °C.
The modeling was carried out in two stages: geometrical models are generated using our own MATLAB code, and the numerical model is analyzed using FEM with the Ansys-Workbench program.
2.1. Stage 1: Geometrical Model Generation
To carry out the first stage of modeling, coarse aggregates were spherical in shape, and three phases were established: mortar, coarse aggregates, and the ITZ. The effect of aggregate shape has been studied by other authors [15,16] using spherical, ellipsoidal, and polyhedral shapes while keeping the rest of the parameters fixed, reaching the conclusion that the type of crack is independent of the shape of the aggregate. It was also concluded that the load capacity of concrete containing spherical and ellipsoidal aggregates is between 1% and 3% higher than that which includes polyhedral aggregates, perhaps since non-smooth aggregates have more aggregate interface elements and because the smooth edges of spherical and ellipsoidal aggregates have a more benign stress distribution that delays the fracture process and increases tensile strength [15]. Thus, in this stage, a spherical aggregate shape is adopted.
In principle, the ITZ was generated by subtracting the volume of two previously defined concentric spheres: the inner sphere corresponds to the equivalent diameter of the coarse aggregate, and the outer sphere is designed with a diameter equal to that of the coarse aggregate plus twice the thickness of the ITZ. The shell, obtained by the difference between the larger and smaller spherical volumes, would precisely be this weaker zone (ITZ) of the concrete that is generated around the coarse aggregate particles. The programming in MATLAB is carried out using the following input parameters:
- -
- The dimensions of the Representative Volume Element (RVE), which correspond to the dimensions of the specimens tested in the laboratory.
- -
- The diameters of the coarse aggregate particles are represented as spheres.
- -
- The mass percentage of each of the sizes of the coarse aggregate particles is considered in relation to the total mass.
- -
- The coarse aggregate–cement ratio.
- -
- The volume fractions of cement, aggregates, and water.
- -
- The density of concrete.
The RVE generated in MATLAB can vary in size and shape, including options such as cylinder, prism, or cube. In the simulations conducted in this study, coarse aggregate particles with diameters of 4, 6, and 8 mm are utilized, comprising 8%, 15%, and 7% of the total mass, respectively [17]. Particles smaller than 4 mm are considered mortar. These volumes correspond to those outlined in the Fuller parabola for the same particle sizes. The MATLAB programming enables the generation of a random particle distribution within the RVE, aiming to statistically mimic that of real concrete. The positioning of each coarse aggregate particle within the RVE is achieved randomly, employing the take-and-place method [9,18], which organizes the spheres (particles) based on their size, following the mass percentages established in the initial data. The number of particles of each diameter i that is introduced in the RVE is calculated by the expression:
where V is the volume in m3 of the RVE, is the mass fraction of the coarse aggregate of diameter i with respect to the total mass, is the aggregate volume in m3, is the amount of cement per m3 of concrete, is the water–cement ratio, is the density of cement (3150 kg/ m3), and is the density of water.
The value obtained from the previous expression (1) is rounded to ensure that the number of particles is an integer. Following this, a surplus of particles from each class is generated, exceeding the quantity needed to fill the RVE, ensuring it complies with the predetermined mass percentage. Subsequently, the RVE is populated. A Cartesian coordinate system is employed in the concrete sample, where the placement of a coarse aggregate particle within the specified concrete volume is determined by the coordinates of its center. To place a particle inside the RVE, two conditions must be met:
- -
- There should be no overlaps between two spheres, and they cannot be tangent to each other either.
- -
- All generated particles (spheres) must have their entire volume contained within the RVE.
A third condition establishes that each particle must be surrounded by a mortar layer with a minimum thickness. This implies that there must be a minimum distance between the boundary of a particle and the faces of the defined RVE, as well as a minimum space between two adjacent particles. This distance is defined by the following expression:
where α is an influence parameter for each sphere, represents the diameter of the new sphere introduced, and is the diameter of the next sphere that is intended for introduction. The algorithm also incorporates a parameter known as Hsu’s particle radii, with a fixed value of 0.5. This value reflects the ability of coarse aggregate to influence the properties and behavior of the resulting concrete, influenced by factors such as size, shape, texture, and chemical composition. All particles for which are discarded.
The process of filling the RVE commences with the particles of the largest diameter until the desired proportion of aggregate is achieved. Subsequently, particles of successive diameters are placed in descending order of size.
As a test, the filling of multiple cubic RVEs has been simulated with coarse aggregate locations randomized according to the specified volumetric fractions for each size of coarse aggregate particles under consideration.
Once the specimen is filled with particles corresponding to the established different sizes, MATLAB generates a file with the extension .inp. This file includes the coordinates of the centers, the diameters of each coarse aggregate particle (sphere), and the Representative Volume Element (RVE) dimensions. Subsequently, this file is converted into another file with the extension .igs for export to Ansys. Ansys adjusts the RVE generated by MATLAB using the take and place method for subsequent application of the finite element method (Figure 2).
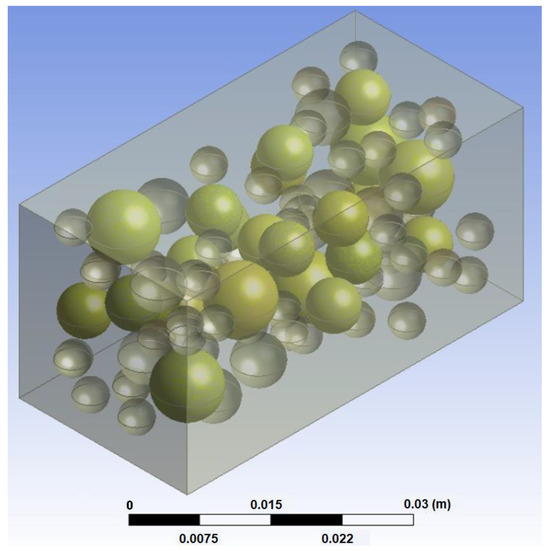
Figure 2.
RVE generated by MATLAB using the ‘take and place’ method and adapted by Ansys.
2.2. Stage 2: Numerical FEM Model
To evaluate the structural behavior of concrete at the mesoscale level, a variety of finite elements, material models, and contact models have been employed. For finite element analysis, we adopt linear elastic behavior for the material, where displacements are assumed to be infinitesimal and proportional to the applied force . Additionally, we maintain constant boundary conditions during the application of loads on the set of finite elements. Under these conditions, the equilibrium equations for static analysis are expressed as:
These assumptions facilitate the preservation of finite element geometry throughout the loading process, allowing the use of first-order infinitesimal deformation approximations. However, real-world scenarios may require consideration of nonlinear deformations, even if they are minor and do not exceed the elastic limits of typical structural materials.
Subsequently, we provide explanations for the geometric model, meshing strategy, finite elements used, material constitutive laws and properties, as well as forces and boundary conditions.
2.2.1. Geometrical Model
The second phase begins by importing the .igs file from the Ansys Workbench FEM 2022 R1 software, which contains the geometry described in the first phase. Upon importing the file, we proceed to generate the phase corresponding to the ITZ using a Boolean operation. This operation allows us to distinguish between the volumes of each pair of concentric spheres obtained in the previous phase. During this operation, we retain the sphere with the smaller diameter and assign it the properties of the aggregate material. The properties assigned to each of the phases considered were obtained experimentally.
2.2.2. Meshing Strategy and Utilized Finite Elements
Meshing is conducted independently, utilizing tetrahedral finite elements for the aggregates and hexahedral elements for the mortar and the ITZ. Introducing the ITZ into the model adds complexity due to coupling and assembly issues at the boundary separating the hexahedral elements used in the mortar phase and the ITZ. Initially, an ITZ thickness of 100 µm was established.
During the meshing process, the number of finite elements (FE) was restricted to 1.5 million to ensure manageable computations. To prevent exceeding these limits, a prismatic Representative Volume Element (RVE) was utilized, representing one-quarter of a cubic specimen with a 50 mm edge tested in the laboratory. Boundary conditions include symmetry on the ZX and YZ faces to simulate a cubic specimen. Furthermore, this approach allows for managing smaller sizes in the ITZ finite elements. Within this volume, the integrity of all included aggregates (spheres) is maintained (Figure 3).
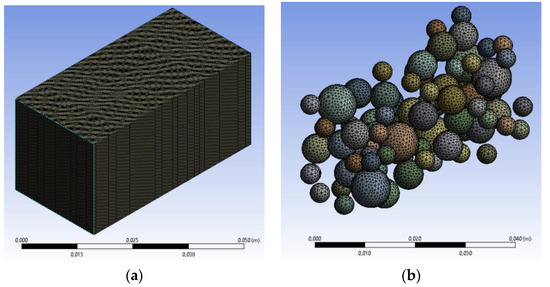
Figure 3.
(a) Meshing the Representative Volume Element (RVE). (b) Distribution and meshing of aggregates within the specimen.
In terms of meshing, three different methods have been utilized: a body-fitted Cartesian algorithm [19] for the mortar and ITZ components, free meshing with specific sizing parameters for coarse aggregate, and our own code with APDL programming for ITZ components.
Specifically, the geometric model was meshed with linear Finite Element Method (FEM) elements using a body-fitted Cartesian algorithm [19], with an element size ranging from 6 × 10⁻⁴ m for coarse aggregate to 3 × 10⁻⁴ m for the ITZ. Considering the overall behavior, including crack patterns, a compromise between ITZ thickness and computational effort justifies the use of a thickness of up to 0.3 mm to replicate a real ITZ thickness of 100 µm [20].
The following element types were used [21,22]:
- The mortar and ITZ were modeled using a solid type of tetrahedral finite element called SOLID65, suitable for simulating the nonlinear structural behavior of concrete. It features eight nodes with three degrees of freedom per node: translations in the X, Y, and Z directions.
- The coarse aggregate was modeled by the SOLID185 element, representing a homogeneous structural solid defined by eight nodes with three degrees of freedom per node.
- Contact between ITZ and coarse aggregate is modeled by the CONTA174 element. This element has eight nodes and three degrees of freedom per node. The contact element is used to simulate contact and sliding between both materials using a pure penalty algorithm between deformable surfaces.
2.2.3. Material Constitutive Laws and Properties
Drawing from previous research aimed at simulating concrete cracking and crushing [23,24,25,26,27,28,29], the authors employed the following constitutive models:
- -
- The Concrete Damage Plasticity (CDP) model used combines the theory of isotropic elastic damage with isotropic plasticity in tension and compression to simulate the inelastic behavior of concrete, given its quasi-brittle nature. Moreover, this model is suitable for both mass and reinforced concrete and accommodates static, cyclic, and dynamic loads. The CDP model addresses two primary fracture mechanisms: tensile cracking and compression crushing. The formulation of continuous damage in elasticity [30] can be expressed as follows:where σ is the Cauchy stress tensor, d is the damage variable, is the undamaged elastic stiffness tensor, ε is the total strain tensor, and is the inelastic strain tensor, which accounts for the irreversible nature of concrete cracking.
- -
- For mortar and ITZ, a nonlinear combined mathematical model of concrete was utilized, incorporating the Drucker–Prager material model [31,32,33] for compression stresses and the Willam and Warnke model [34,35,36] for tension stresses. This model predicts both material failure modes: cracking and crushing.The Drucker–Prager yield criterion, used to determine if a material has exceeded its elastic limit, is defined by the equations:where and are stress invariants:α is a parameter related to the internal friction angle φ:andis related to cohesion angle c according to the expression:This correlation is established based on experience gained from finite element applications to concrete.The Drucker–Prager yield surface, depicted as a cone of revolution with its axis along the hydrostatic line () (refer to Figure 4), governs plastic deformations, given by:
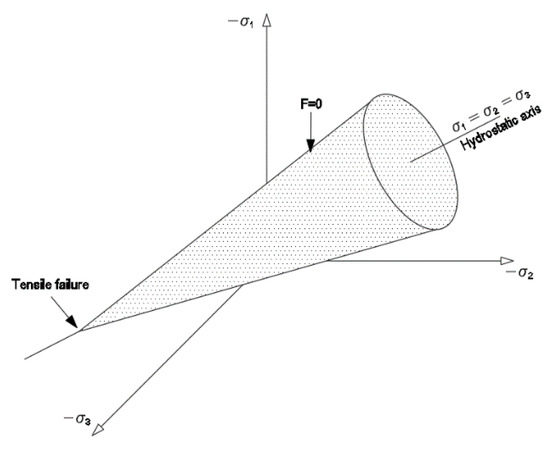 Figure 4. Drucker–Prager yield surface.Here, dλ is a scalar determining the magnitude of plastic deformation. The vector of plastic deformations is perpendicular to the yield surface. In this context, the volumetric plastic deformation is:This model can be incorporated into the equations governing the behavior of mortar and ITZ as a yield condition in the nonlinear constitutive model [37].The failure surface described by Willam and Warnke indicates that the compressive strength of concrete under multiaxial compressive stresses can surpass its uniaxial compressive strength significantly. When considering , the sign of determines the mode of concrete failure. To tend towards tension-induced fracture, must be positive, leading to cracks perpendicular to this principal stress. Conversely, when no stress is positive, crushing failure occurs. Ansys employs the failure criterion due to a multiaxial stress state:Here, is a function of the principal stresses (, S represents the failure surface, and is the uniaxial compressive strength, satisfied when the condition:is met, where:Regarding the material definition, in addition to the elastic modulus and Poisson’s ratio, the coefficients of transfer of shear stress for open and closed cracks must also be introduced. With this model, Ansys nullifies the elastic modulus of concrete elements parallel to the principal tensile stress in the event of cracking. Conversely, in the case of crushing, the elastic modulus of concrete elements in all directions is nullified, equivalent to removing the element from the model.
The material properties of the limestone aggregates, mortar and ITZ were assigned to the meshed model by APDL programming [22]. Based on authors’ previous works [36], both numerical and experimental, and other research papers [20,38,39], the following material properties are adopted:
- For coarse aggregate, a purely linear elastic model is employed due to its high strength. Additionally, for the contact between coarse aggregates and ITZ, a pure penalty algorithm between deformable surfaces with asymmetric behavior is utilized.
- Furthermore, the relevant mortar material properties employed in the model include:Density of concrete: 2150 kg/m3.Young’s modulus (E): 42,000 MPa (N/m2).Poisson’s ratio: 0.2.Nonlinear properties for the Drucker–Prager material model:Ultimate uniaxial crushing strength: 42 MPa (N/m2).Internal friction angle (φ): 35°.Cohesion angle (c): 35°.
- The ITZ properties used in the model are:Young’s modulus (E): 25,000 MPa (N/m2).Ultimate uniaxial compressive strength: 37 MPa (N/m2).Internal friction angle (φ): 35°.Cohesion angle (c): 19°.
- Additionally, the properties of the limestone aggregates employed in the model are:Young’s modulus (E): 65,000 MPa (N/m2).Poisson’s ratio: 0.18.
2.2.4. Forces and Boundary Conditions
Forces and boundary conditions applied to the FEM model include symmetry on ZX and YZ faces, with an imposed displacement of −7 × 10⁻⁵ m applied to the XY face.
The numerical model utilizes a Newton–Raphson integration scheme with a force convergence parameter of 2.5 with respect to the L2 Euclidean norm, with a minimum value of 0.01 N. The applied displacement for each sub-step, ranging from 1% to a maximum value of 2%, is linearly interpolated from the value of the previous load step.
3. Numerical and Experimental Results
Based on the stages, four distinct numerical and experimental tests have been conducted. The primary findings are presented in the following sections.
3.1. Experimental Results
In Figure 5, the setup for one of the experimental tests conducted is depicted. Two strain gauges affixed to opposite faces of the specimen are utilized to determine the stress–strain curve of the material. Figure 6 illustrates the stress–strain curves from four experimental tests. The results indicate a consistent pattern of behavior, with slight variations attributed to experimental conditions. The tests were performed using a Sistemas de Ensayo S.L. multi-test machine (Fuenlabrada, Spain) with a capacity of 20 Tm and a test speed of 1500 N/s. This machine is connected to a Quantum MX1615 data analyzer (HBM, Darmstadt, Germany) and a PC for data processing. The 50 × 50 × 50 mm specimens were instrumented with HBM-LY11-1-6/350 strain gauges (Hottinger Brüel & Kjær, Copenhagen, Denmark), featuring a measurement grid of 1 × 2.5 mm and connected to the Quantum MX1615 device prior to testing.
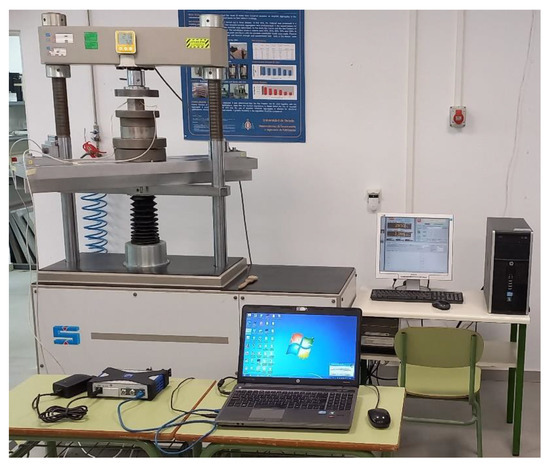
Figure 5.
Experimental test employing strain gauges.
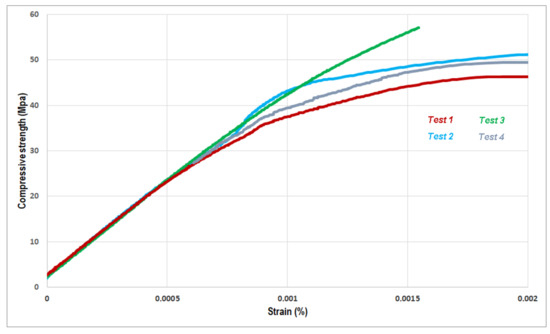
Figure 6.
Stress–strain curves obtained from the experimental tests.
The initial test exhibits an almost linear phase that gradually deviates as deformations increase. It reaches an ultimate tensile strength of 45.9 MPa with a strain close to 1.8 per thousand. In the second test, a slight deviation in the curve occurs when deformations exceed eight per thousand, attributed to a temporary malfunction in one of the strain gauges. Nevertheless, the test progresses normally until failure, achieving deformation levels like the previous test and a tensile strength slightly higher (49.9 MPa). The third experimental test yields an ultimate tensile strength of 57.1 MPa at a strain close to 1.6 per thousand, with a less pronounced curvature compared to the preceding tests. Finally, in the fourth test, a stress–strain curve characteristic of the material is observed, culminating in failure at a tension level comparable to the first two tests (48.7 MPa) and a strain close to 1.7 per thousand.
3.2. Numerical FEM Results
The problem was resolved on a workstation computer equipped with dual Xeon 64-bit CPU E5630 (Intel, Santa Clara, CA, USA), 64 GB RAM memory, 6.0 TB hard disk (Supermicro®, San Jose, CA, USA), and eight cores. The average CPU time per nonlinear structural analysis was approximately 70,000 s, with a total of about 500 iterations required to achieve convergence. The Newton–Raphson method was employed to solve the nonlinear mathematical model, both due to the constitutive model of the material and the contacts between the aggregates and the ITZ. The discrepancies between the values of “Force convergence” and “Force criterion” were minimal, ranging from 1.4 × 10⁻⁷ to 31.7 N. Moreover, a smooth progression of the iterations performed by the method until reaching the solution was observed, indicating that the problem was well-conditioned.
Figure 7 depicts the curves derived from the four numerical simulations. Notably, all simulations exhibit an initial nearly linear phase with almost identical slopes. In simulations 1 and 4, the curve deviates at a stress level of around 40 MPa, accompanied by deformations of 1 per thousand. Conversely, simulations 2 and 3 show cracking initiation at stress levels very close to 37.5 MPa, with deformations around 0.95 per thousand in both cases. Interestingly, the ultimate tensile strength in the first and fourth tests converges to similar failure values of 43 MPa, corresponding to strains of 1.2 per thousand and 1.3 per thousand, respectively. These disparities in ultimate tensile strength and strain among simulations stem from the different distributions of coarse aggregates in each of the geometric models employed to simulate the specimens, as generated using MATLAB.
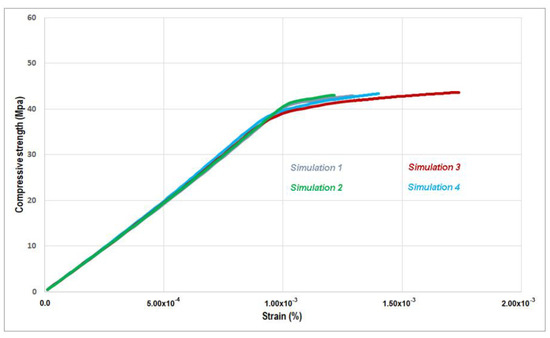
Figure 7.
Stress–strain curves generated by the four numerical models.
Cracking and crushing failures for different zones analyzed are illustrated in Figure 8 through elements colored in green and red, respectively. The overall view, coarse aggregate, central section of the specimen, and ITZ zone are depicted in the same figure. It can be observed in Figure 8 that failure occurs in the weakest part of the concrete, namely, in the ITZ.
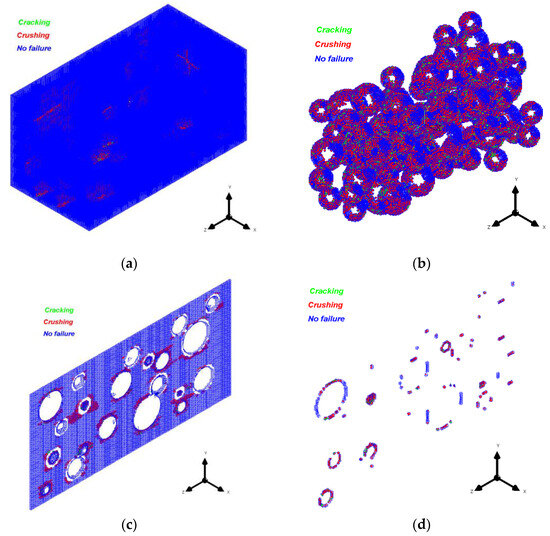
Figure 8.
Cracking and crushing failures: (a) entire FEM model, (b) ITZ, (c) central section of the specimen without aggregates, and (d) central section of the ITZ.
Figure 8a shows the global failure of the specimen in one of the cases considered. Figure 8b displays the cracking and crushing in the ITZ elements, where many affected elements can be observed. Figure 8c presents a central cross-section of the specimen, revealing that the initial failure occurs due to crushing at the top and bottom of the aggregate, propagating in some cases from the ITZ of one aggregate to another and traversing the mortar. Finally, Figure 8d illustrates the ITZ elements in a central cross-section of the specimen, showing a significant number of elements primarily affected by crushing.
In Figure 9, the directional deformation along the z-axis of the fourth section of the prismatic specimen is shown, with a maximum value of −6.64 × 10⁻⁵ m, which is very close to the imposed displacement applied to the model. Figure 10 illustrates the total deformation experienced by the fourth section of a prismatic RVE, with a maximum of 7.28 × 10⁻⁵ m. A non-uniform displacement pattern can be observed, attributed to the symmetry conditions and the heterogeneity of the specimen due to the presence of aggregates.
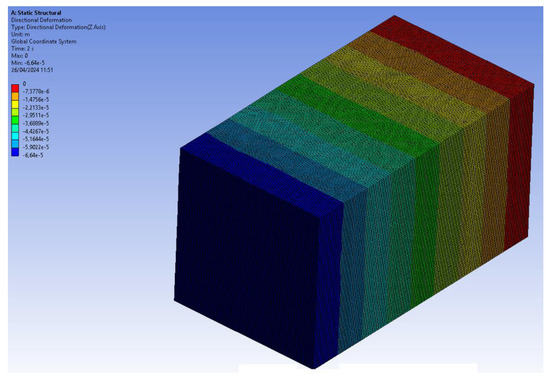
Figure 9.
Directional deformation along the longitudinal z-axis from the fourth part of the prismatic specimen.
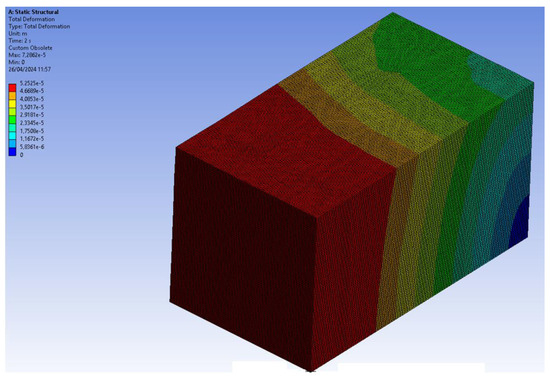
Figure 10.
Total deformation experienced by the fourth part of the prismatic specimen.
3.3. Numerical and Experimental Comparison
Figure 11 demonstrates a strong agreement between the experimental results and those obtained from numerical simulation. In the numerical simulation, the compressive strength measures 41.34 MPa with a strain of 1.04 × 10⁻³ m. Remarkably, the stress–strain curve from the laboratory tests closely aligns with this simulation data. This showcases an advanced numerical model that delivers reliable results based on four different FEM models. It is intended to be utilized in the future to tackle more complex problems that demand increased experimental and computational efforts.
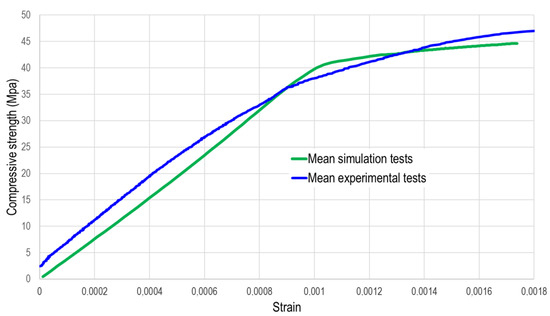
Figure 11.
Mean stress–strain curves leading to failure obtained through laboratory experimentation and numerical simulation.
4. Conclusions
The proposed model lays the foundation for a methodology aimed at numerically simulating compression tests, a common practice in laboratory settings.
From the experimental and numerical perspectives of this research, the following conclusions can be drawn:
- The code generated in MATLAB proves to be a powerful tool for easily reproducing different Representative Volume Elements (RVEs). These RVEs correspond to the dimensions of the specimens tested in the laboratory, including the mass percentage of each considered coarse aggregate particle size, which is randomly distributed to accurately represent real conditions.
- Regarding the numerical FEM model, more than 1 million nodes and elements are necessary to mesh an ITZ size small enough for a 50 × 10−3 m cubic specimen, considering one-fourth of the prismatic specimen with appropriate symmetry boundary conditions. Additionally, a body-fitted Cartesian algorithm for the mortar and ITZ components is adopted to efficiently develop a tetrahedral finite element mesh.
- The Concrete Damage Plasticity (CDP) model, using a nonlinear combined mathematical model of concrete based on the Drucker–Prager material model for compressive stresses and the Willam and Warnke model for tensile stresses, effectively predicts both material failure modes: cracking and crushing of concrete.
- There is a good agreement between the experimental results and those obtained from numerical simulation, with similar compressive strengths observed both experimentally and numerically. Notably, the stress–strain curve from the laboratory tests closely aligns with the simulation data.
- The detailed analysis of the failure mechanisms in the specimen reveals the critical importance of the interaction between the aggregate and the mortar, particularly in the ITZ. The initial failure occurs due to crushing at the top and bottom of the aggregate and, in some cases, propagates from the ITZ of one aggregate to another and through the mortar, demonstrating the complex nature of concrete failures. Additionally, a significant number of ITZ elements are primarily affected by crushing. These findings underscore the necessity of accurately modeling the ITZ to predict material behavior under stress.
On the other hand, several key points emerge in the discussion:
- Detailed Insights into Mesoscopic Behavior: The model promises to provide comprehensive insights into the mesoscopic-scale behavior of concrete. This detailed information is crucial for understanding deformation and fracture mechanisms, ultimately contributing to more informed and effective material design.
- Cost-Effective and Rapid Evaluation: Mesoscopic numerical simulations offer a cost-effective and time-efficient alternative for assessing concrete behavior. While they offer significant advantages, it is important to acknowledge that they cannot entirely replace experimental methods. Both approaches complement each other, each with its unique strengths and limitations.
- Identification of Failure-Prone Areas: Through these simulations, it becomes possible to identify areas within the material that are more susceptible to failure. This insight is invaluable for targeted improvements and reinforcement in structural design. The aim of this work is to compare numerical results with those obtained in the laboratory; thus, we have not compared our numerical results with others obtained in a similar way or with theoretical methods. In summary, the proposed mesoscopic model not only opens avenues for efficient simulation of compression tests but also holds the potential to deepen our understanding of concrete behavior, paving the way for advancements in material science and engineering.
The authors aim to soon employ this methodology as a substitute for extensive experimental testing campaigns, which generate significant waste, by utilizing numerical simulations that yield comparable results.
Author Contributions
Conceptualization, F.M.-C., J.J.d.C.-D. and F.L.-G.; methodology, J.J.d.C.-D., Z.F.-M. and F.L.-G.; software, Z.F.-M., J.J.d.C.-D. and M.A.-M.; validation, F.L.-G., C.L.-C. and F.M.-C.; formal analysis, C.L.-C. and M.A.-M.; investigation, Z.F.-M., C.L.-C. and M.A.-M.; writing—original draft preparation, Z.F.-M.; writing—review and editing, Z.F.-M., J.J.d.C.-D. and F.L.-G.; supervision, Z.F.-M., F.M.-C., C.L.-C., M.A.-M., J.J.d.C.-D. and F.L.-G. All authors have read and agreed to the published version of the manuscript.
Funding
This research was funded by the Ministry of Science and Innovation of the Government of Spain through the research projects grant numbers PID2021-122291OB-I00 and MCINN-22-TED2021-131976B-I00 and by the Foundation for Scientific and Technical Research of the Regional Government of Asturias through the research reference SV-PA-21-AYUD/2021/51328.
Institutional Review Board Statement
Not applicable.
Informed Consent Statement
Not applicable.
Data Availability Statement
The raw data supporting the conclusions of this article will be made available by the authors on request.
Acknowledgments
The authors also want to thank the following for their support in carrying out this study: Basf, Sika, the Ministry of Science and Innovation of the Government of Spain and the Foundation for Scientific and Technical Research of the Regional Government of Asturias. Furthermore, the authors must acknowledge the academic use of the ANSYS-Workbench program.
Conflicts of Interest
The authors declare no conflicts of interest.
References
- Bentz, A. Multiscale modelling of concrete: From nano to macro. Cem. Concr. Res. 2008, 38, 170–192. [Google Scholar]
- Meschke, G. Multiscale modelling of concrete structures. J. Struct. Eng. 2011, 137, 1469–1484. [Google Scholar]
- Cusatis, P.; Mola, F.; Berto, F. Multiscale modelling of concrete fracture: Bridging the gap between microscopic and macroscopic scales. Cem. Concr. Res. 2011, 41, 1109–1123. [Google Scholar]
- Krüger, M. Multiscale modelling of concrete: Bridging the gap between micro and macroscale. J. Eng. Mech. 2016, 142, 04016077. [Google Scholar]
- Liu, Y.; Ye, F.; Cheng, X.; Li, X.; Li, C. A multiscale simulation approach for predicting the elastic modulus of concrete. Eng. Struct. 2021, 242, 111952. [Google Scholar]
- Wang, X. Multiscale modelling of concrete: From microstructure to fracture mechanics. Eng. Fract. Mech. 2018, 205, 295–313. [Google Scholar]
- Chateau, J.L.; La Borderie, R. A 3D mesoscopic model for concrete fracture analysis. Eng. Fract. Mech. 2009, 76, 1943–1962. [Google Scholar]
- Zhou, R.; Song, Z.; Lu, Y. 3D mesoscale finite element modelling of concrete. Comput. Struct. 2017, 192, 96–113. [Google Scholar] [CrossRef]
- Wittmann, F.H.; Roelfstra, P.E.; Sadouki, H. Simulation and analysis of composite structures. Mater. Sci. Engng. 1984, 68, 239–248. [Google Scholar] [CrossRef]
- Bazant, Z.; Tabbara, M.; Kazemi, M.; Pijaudier-Cabot, G. Random Particle Model for Fracture of Aggregate or Fiber Composites. J. Eng. Mech. 1990, 116, 8. [Google Scholar] [CrossRef]
- Latifeh, S.E.H.; Khoei, A.R. An embedded cohesive crack model for modelling of fracture in concrete. Eng. Fract. Mech. 2012, 85, 68–84. [Google Scholar]
- Mehta, P.; Monteiro, P. Concrete: Microstructure, Properties, and Materials, 3rd ed.; McGraw-Hill Professional: New York, NY, USA, 2005; ISBN 13 978-0071462891. [Google Scholar]
- Wriggers, P.; Moftah, S.O. Mesoscale models for concrete: Homogenisation and damage behaviour. Finite Elem. Anal. Des. 2006, 42, 623–636. [Google Scholar] [CrossRef]
- Montero-Chacón, F.; Marín-Montín, J.; Medina, F. Mesomechanical characterization of porosity in cementitious composites by means of a voxel-based finite element model. Comput. Mater. Sci. 2014, 90, 157–170. [Google Scholar] [CrossRef]
- Xiaofeng, W.; Mingzhong, Z.; Andrey, P.J. Computational technology for analysis of 3D meso-structure effects on damage and failure of concrete. Int. J. Solids Struct. 2016, 80, 310–333. [Google Scholar] [CrossRef]
- Molugaram, K.; Shanker, J.; Ramesh, A. A Study on Influence of Shape of Aggregate on Strength and Quality of Concrete for Buildings and Pavements. Adv. Mater. Res. 2014, 941–944, 776–779. [Google Scholar] [CrossRef]
- Cusatis, G.; Bažant, Z.P.; Cedolin, L. Confinement-shear lattice model for concrete damage in tension and compression: I. Theory. J. Eng. Mech. 2003, 129, 1439–1448. [Google Scholar] [CrossRef]
- Wang, Z.M.; Kwan, A.K.H.; Chan, H.C. Mesoscopic study of concrete I: Generation of random aggregate structure and finite element mesh. Comput. Struct. 1999, 70, 533–544. [Google Scholar] [CrossRef]
- Nadal, E.; Ródenas, J.J.; Albelda, J.; Tur, M.; Tarancón, J.E.; Fuenmayor, F.J. Efficient Finite Element Methodology Based on Cartesian Grids: Application to Structural Shape Optimization. Abstr. Appl. Anal. 2013, 19, 953786. [Google Scholar] [CrossRef]
- Maleki, M.; Rasoolan, I.; Khajehdezfuly, A.; Jivkov, A.P. On the effect of ITZ thickness in meso-scale models of concrete. Constr. Build. Mater. 2020, 258, 119639. [Google Scholar] [CrossRef]
- Madenci, E.; Guven, I. The Finite Element Method and Applications in Engineering Using ANSYS; Springer: New York, NY, USA, 2007. [Google Scholar]
- Moaveny, S. Finite Element Analysis: Theory and Applications with ANSYS; Prentice Hall: New York, NY, USA, 2007. [Google Scholar]
- Bhowmick, R. Nonlinear Analysis of Tie Confined Columns. Eur. J. Eng. Sci. Technol. 2020, 3, 130–138. [Google Scholar] [CrossRef][Green Version]
- Gheitasi, A.; Harris, D.K.; Hansen, M. An experimental-computational correlated study for describing the failure characteristics of concrete across two scale levels: Mixture and structural component. Exp. Mech. 2018, 58, 11–32. [Google Scholar] [CrossRef]
- Zhou, F.; Wu, H. A novel three-dimensional modified Griffith failure criterion for concrete. Eng. Fract. Mech. 2023, 284, 109287. [Google Scholar] [CrossRef]
- Halahla, A. Study the behavior of reinforced concrete beam using finite element analysis. In Proceedings of the 3rd World Congress on Civil, Structural, and Environmental Engineering (CSEE’18), Budapest, Hungary, 8–10 April 2018. [Google Scholar] [CrossRef]
- Ulm, F.J.; Coussy, O.; Bažant, Z.P. The “Chunnel” fire. I: Chemoplastic softening in rapidly heated concrete. J. Eng. Mech. 1999, 125, 272–282. [Google Scholar] [CrossRef]
- Wang, G.Y.; Wang, Z.P.; Yin, Y.; Wang, F.C. Bearing capacity of the corrosion reinforced concrete axial compression members. Adv. Mater. Res. 2012, 430, 1830–1833. [Google Scholar] [CrossRef]
- Turgay, T.; Köksal, H.O.; Polat, Z.; Karakoç, C. Stress–strain model for concrete confined with CFRP jackets. Mater. Des. 2009, 30, 3243–3251. [Google Scholar] [CrossRef]
- Marin Montin, J.; Alcalde, M.; Cifuentes, H.; Montero-Chacón, F. Multiscale Analysis of the Influence of Steel Fiber Reinforcement on the Shear Strength of Post-Tensioned Dry Joints. Appl. Sci. 2020, 10, 5486. [Google Scholar] [CrossRef]
- Bathe, K.J. Finite Element Procedures; Prentice-Hall: Englewoods Cliffs, NJ, USA, 2007. [Google Scholar]
- Reddy, J.N. An Introduction to Non-Linear Finite Element Analysis; Oxford University Press: New York, NY, USA, 2004. [Google Scholar]
- Zienkiewicz, O.C.; Taylor, R.L. The Finite Element Method for Solid and Structural Mechanics; Butterworth-Heinemann: New York, NY, USA, 2005. [Google Scholar]
- Fuschi, P.; Dutko, M.; Peric, D.; Owen, D.R.J. On numerical integration of the five-parameter model for concrete. Comput. Struct. 1994, 53, 825–838. [Google Scholar] [CrossRef]
- Willam, K.J.; Warnke, E.D. Constitutive model for the triaxial behaviour of concrete. In Proceedings of the International Association for Bridge and Structural Engineering; ISMES: Bergamo, Italy, 1975; Volume 19, pp. 174–178. [Google Scholar]
- Del Coz Díaz, J.J.; García Nieto, P.J.; Álvarez Rabanal, F.P.; Lozano Martínez-Luengas, A. Design and shape optimization of a new type of hollow concrete masonry block using the finite element method. Eng. Struct. 2011, 33, 1–9. [Google Scholar] [CrossRef]
- Doran, B.; Köksal, H.O.; Polat, Z.; Karakoc, C. The use of Drucker-Prager criterion in the analysis of reinforced concrete members by finite elements. Tek. Dergi 1998, 9, 1617–1625. [Google Scholar]
- Forti, T.; Batistela, G.; Forti, N.; Vianna, N. 3D Mesoscale Finite Element Modelling of Concrete under Uniaxial Loadings. Materials 2020, 13, 4585. [Google Scholar] [CrossRef] [PubMed]
- Shuguang, L.; Qingbin, L. Method ofmeshingITZstructurein3Dmeso-level finite element analysis for concrete. Finite Elem. Anal. Des. 2015, 93, 96–106. [Google Scholar] [CrossRef]


Disclaimer/Publisher’s Note: The statements, opinions and data contained in all publications are solely those of the individual author(s) and contributor(s) and not of MDPI and/or the editor(s). MDPI and/or the editor(s) disclaim responsibility for any injury to people or property resulting from any ideas, methods, instructions or products referred to in the content. |
© 2024 by the authors. Licensee MDPI, Basel, Switzerland. This article is an open access article distributed under the terms and conditions of the Creative Commons Attribution (CC BY) license (https://creativecommons.org/licenses/by/4.0/).