Review

Biophotons: A Hard Problem

by
Luca De Paolis
1,
Roberto Francini
2,
Ivan Davoli
3,
Fabio De Matteis
2,
Alessandro Scordo
1,
Alberto Clozza
1,
Maurizio Grandi
4,
Elisabetta Pace
1,*,
Catalina Curceanu
1,
Paolo Grigolini
5 and
Maurizio Benfatto
1,*
1
Laboratori Nazionali di Frascati, Istituto Nazionale di Fisica Nucleare, Via E. Fermi 40, 00044 Frascati, Italy
2
Dipartimento di Ingegneria Industriale, Università di “Tor Vergata”, Via del Politecnico, 00133 Roma, Italy
3
Dipartimento di Fisica, Università di “Tor Vergata”, Via della Ricerca Scientifica, 00133 Roma, Italy
4
Istituto La Torre, Via M. Ponzio 10, 10141 Torino, Italy
5
Center for Nonlinear Science, University of North Texas, Denton, TX 76203-5017, USA
*
Authors to whom correspondence should be addressed.
Appl. Sci. 2024, 14(13), 5496; https://doi.org/10.3390/app14135496
Submission received: 22 February 2024 / Revised: 12 June 2024 / Accepted: 19 June 2024 / Published: 25 June 2024
(This article belongs to the Special Issue Feature Review Papers in Applied Physics)

Abstract

:
About a hundred years ago, the Russian biologist A. Gurwitsch, based on experiments with onion plants by measuring their growth rate, hypothesized that plants emit a weak electromagnetic field that somehow influences cell growth. This interesting observation remained fundamentally ignored by the scientific community; only in the 1950s the electromagnetic emission from some plants was measured using a photomultiplier used in single counting mode. Later, in the 1980s, several groups around the world started extensive work to understand the origin and role of this ultraweak emission, now called biophotons, coming from living organisms. Biophotons are an endogenous very small production of photons in the visible energy range in and from cells and organisms, and this emission is characteristic of living organisms. Today, there is no doubt that biophotons exist, this emission has been measured by many groups and for many different living organisms, from humans to bacteria. However, the origin of biophotons and whether organisms use them to exchange information is not yet well understood; no model proposed to date is capable of reproducing and interpreting the great variety of experimental data coming from the many different living systems measured so far. In this brief review, we present our experimental work on the biophotons coming from germinating seeds, the main experimental results, and some new methods we are using to analyze the data to open the door for interpretative models of this phenomenon clarifying its function in the regulation and communication between cells and living organisms. We also discuss ideas on how to increase the signal-to-noise ratio of the measured signal to open up new experimental possibilities that allow the measurement and the characterization of currently unmeasurable quantities.

1. Introduction

All living systems emit electromagnetic radiation, a small number of photons of about 100 ph/sec per square centimeter of surface area, at least in the visible energy range. The scientific community calls this emission by the name of biophotons [1,2].
This emission is present in all living organisms, at least in aerobic ones, and ends as soon as the organism dies. This excludes the possibility that it derives from traces of the radiative substances present in the organism or the passage of cosmic rays. The main characteristics of biophotonic emission are a very low intensity and the absence of specific emission lines; practically, we are in the presence of a flat emission in the energy range between 200 and 800 nm with a slight maximum around the orange area. It should also be noted that the contribution of the thermal part, calculated with the Planck distribution in the visible energy range and at room temperature is practically zero [3]. Furthermore, the presence of any type of stress, from chemical to a change in temperature, typically induces an increase in emission, which can reach up to a few orders of magnitude greater than the nonstressed baseline, followed by a decrease, which follows a nonexponential power law, up to normal values [1,2].
In the 1920s, the Russian biologist A. Gurwitsch [4], observing the growth rate of onion plants, hypothesized the existence of an electromagnetic field responsible for the regulation of cellular growth in living systems, capable of influencing the mitotic activity of the surrounding tissues. He called this weak emission “mitogenetic radiation”. Despite the confirmation of his results (see the article by Gabor and Reiter [5]), the scientific community completely ignored Gurwitsch’s results; therefore, his work faded into the background. Only thirty years later, Colli and Facchini [6,7] carried out the first measurement of electromagnetic emission from living organisms through the use of the first photon detectors used in single-photon counting mode. This work again fell into oblivion; only thirty years later, F.A. Popp et al. [2] began a large experimental/theoretical research project to understand the origin and significance of biophoton emission in detail.
Nowadays, there are no longer any doubts about the experimental evidence of biophotonic emissions; however, questions related to their generation and the role they have in biological processes remain open. There are currently several hypotheses [1,2] that try to explain this surprising phenomenon that is typical of living beings. These can essentially be divided into two categories: in the first, the emission derives from the random processes of the radiative decay of the molecules previously excited by metabolic processes, while in the second, the theories are based on the existence of a coherent electromagnetic field inside the cells that in some way generates the observed biophotonic emission. Both theories predict that any type of perturbation generated by nonspecific stress gives rise to an increase in emission, as observed experimentally. The two hypotheses are not mutually exclusive, and the emission could have a dual origin. There is also clear experimental evidence that biophotonic emission carries some type of biological information [8,9,10,11]; for example, the emitted radiation can increase the rate of cell division by up to 30% in similar organisms, which is the so-called mitogenetic effect [11,12,13].
Recently, biophotons are also revealing their ability to be used in noninvasive methods for research in biology from applications in toxicology [14] to human health monitoring [15] as well as identification and treatment of diseases, especially cancer [16].
In this short review, we present the results we obtained by following the emission of biophotons from various types of seeds during the germination process. Our experimental apparatus essentially consists of a black PVC dark chamber appropriately made to avoid any contamination from external light and a photomultiplier that works as a single-photon count device. The experimental data consist of the number of photons that arrived at the sensitive part of the photomultiplier in a well-defined time window (1 sec. in our case) and were stored as a function of time from the moment the experimental chamber was closed and for the entire duration of the experiment, which could last from a few hours to several days, depending on the seeds. Therefore, the experimental data are represented by a time series in which the counts detected in the chosen time window are reported as a function of time [1,6,7,17].
We recently analyzed these data using the diffusion entropy analysis (DEA) method [17]. This is based [18,19] on the determination of the scaling index η associated with the time series, according to the complexity concept developed by Kolmogorov [20]. Using the experimental data, it is possible to generate a diffusive process [17,18,19], and the scaling index is determined by calculating the associated Shannon entropy. The presence of an anomalous complexity is highlighted by a deviation from the ordinary value η = 0.5. Our analysis [17] indicates a clear deviation from the ordinary value η = 0.5 for the entire duration of the experiment. At the beginning of germination, we found complexity essentially due to the presence of so-called crucial events, while as the germination process progresses and leaves and roots develop, the type of complexity changes and we proceed towards a Fractional Brownian Motion (FBM)-type regime [21].
Biophotons can be regarded as an index of thermodynamic activity [2], and changes in emission rates over time (usually hours) result in changes in scaling parameters [17]. When biophoton emission rates are used in conjunction with an analytical technique like DEA, they have the potential to document dynamic changes in complexity in a developing organism or complex adaptive system.
From this point of view, the germination process could be seen as a process that has a phase transition not yet known, accompanied by changes in complexity patterns (from crucial to FBM condition). We can hypothesize that the process of cellular differentiation required for the development of leaves and roots leads to a criticality [11] driven by the presence of crucial events. These results offer the possibility of investigating the existence of variation in complexity patterns in a variety of different developing organisms and provide evidence of the importance of the exchange of information (entropy) transfer for cell-to-cell communication during organismal development [11].
It can also be thought that the concept of swarm intelligence [22,23] may be associated with the development of a root network of plants living in natural conditions, and the presence of crucial events in the initial phase of germination may be associated with the birth of this extraordinary radical intelligence.
In this paper, we present a brief review of our work on spontaneous emission coming from seeds during the germination process. In particular, in Section 2, we present a new method of analysis of experimental data based on the use of the logistic equation. This allowed us to hypothesize that the germination process can also be thought of as the activation of different cell groups, each with its characteristic times, which are nodes of a complex network that interact based on the increase or decrease in the global benefit. Furthermore, we describe the diffusion entropy analysis method in detail; the results obtained are related to the spectral and the logistic types of analysis, all of which create a fairly coherent picture of how the germination process of various seeds should be thought.
A section is also dedicated to some new ideas for developing the experimental set-up to increase the signal-to-noise ratio to have access to information that is difficult to obtain today. Finally, a section is dedicated to a brief description of the role of stress in biophotonic emission, with particular attention to delayed luminescence experiments, while in another section, the main applications of biophotons in the life sciences are briefly described.

2. Methods and Experimental Data

Our experimental setup was formed by a germination chamber, a photon counting system, and a turning filter wheel [17]. A drawing of the experimental setup we used to measure the spontaneous emission of germinating seeds is shown in Figure 1.
The photon counting device a H12386-210 high-speed counting head (Hamamatsu Photonic Italia S.r.l, Arese (MI), Italy) powered at +5 Vcc. The phototube is sensitive in the wavelength range between 230 and 700 nm, with a peak sensitivity at 400 nm [24]. The data acquisition and control of the experiment were achieved via an ARDUINO board and a computer equipped with a LAB-VIEW system (National Instrument, Austin, TX, USA).
The whole experimental setup work as a single-photon counting system and the detector can see a single photon with just the quantum efficiency of the photomultiplier. The acquisition time window was fixed at 1 s, and within this window, the entire system had a dark count of approximately 2 counts/sec, perfectly in line with the datasheet of this specific photomultiplier, which indicates 1.7 counts/sec [25]. A turning wheel holding a few long-pass glass color filters placed between the germinating seeds and the detector. The wheel had eight positions. Six were used for the color filters, one was empty, and the last one was closed with a black cap; see [17] for details.
Seeds were kept in a humid cotton bed and placed in a Petri dish; they were normal seeds bought from a supermarket. Without any seed, the emission consists of a monotonic decreasing tail due to the residual luminescence of the material, a consequence of the light exposure of the experimental chamber. The emission tail arrives in a few hours at the dark count value.
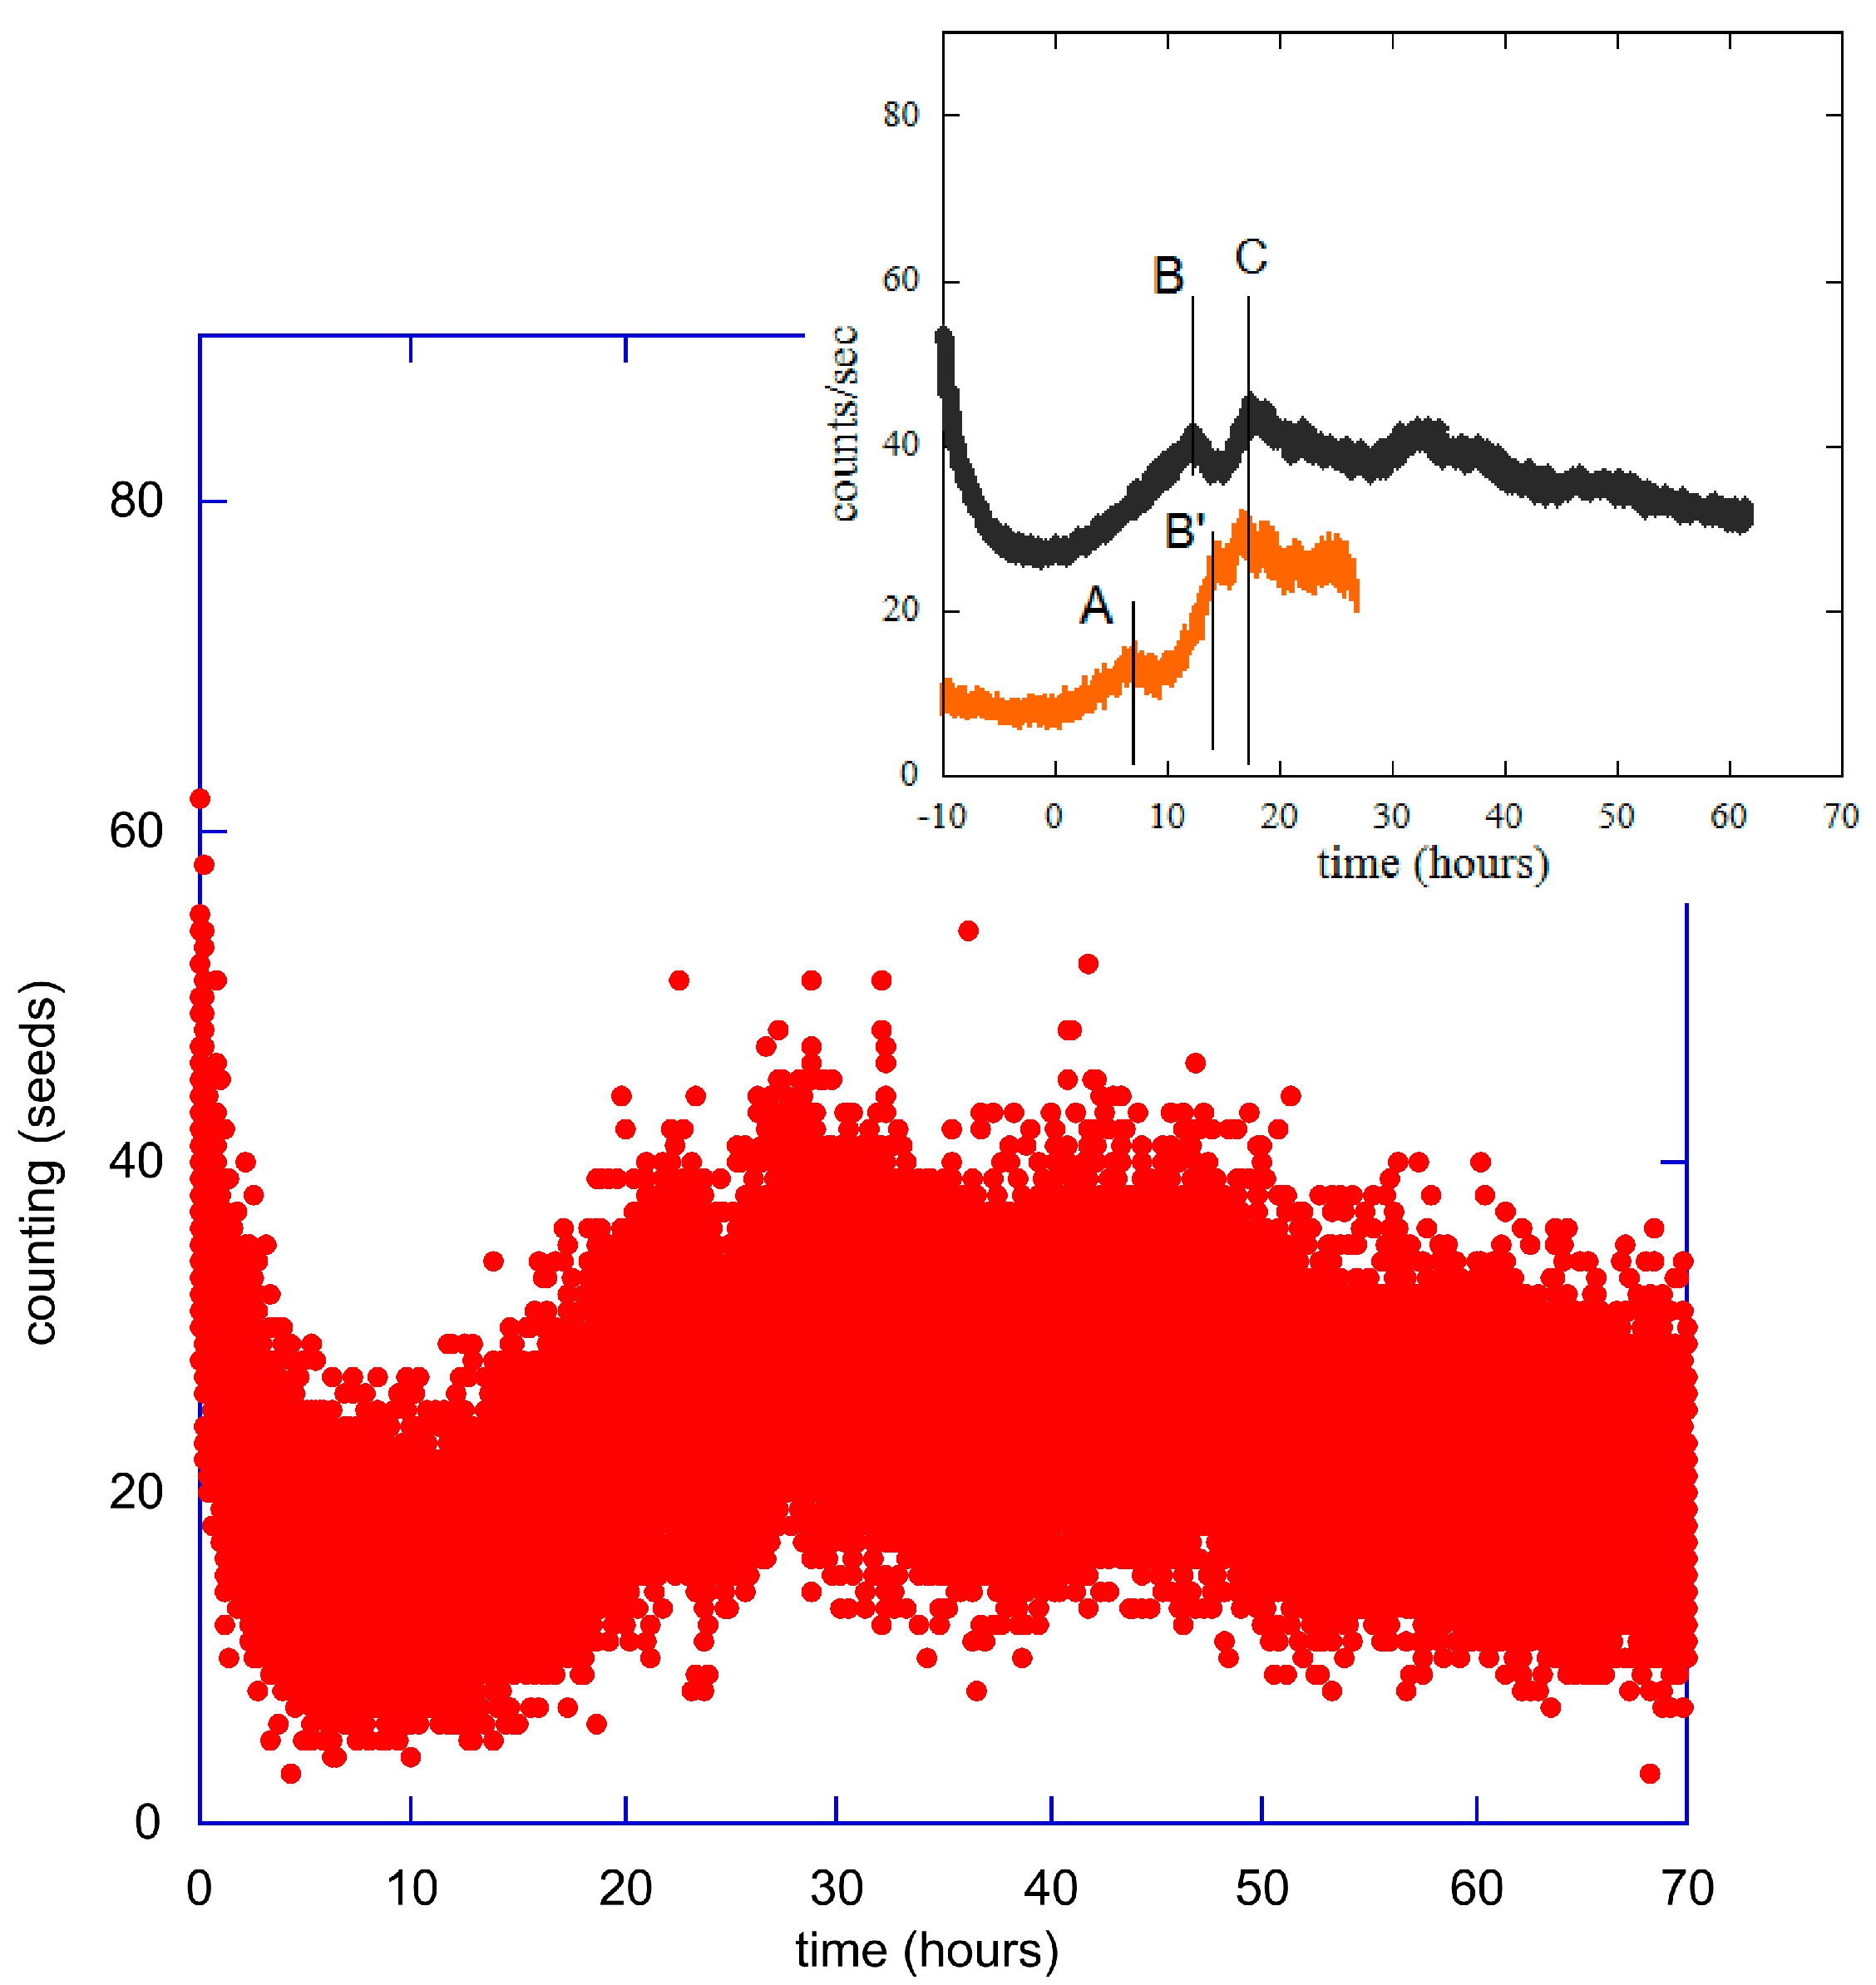
A typical measured signal with seeds and the wheel in the empty position is displayed in Figure 2. This signal (red points) refers to the emission of 76 lentil seeds for a total duration of 72 h from the moment of closure of the experimental apparatus after insertion of the Petri dish with the seeds into the measurement chamber.
The initial behavior (a few hours) is dominated by residual luminescence. The germination-triggered biophoton emission emerges about 5–7 h after closing the chamber (the change in the slope of the counting curve), and then it became dominant for the entire duration of the experiment, with a signal well above the detector’s dark counts.
The temporal evolution of biophoton emission (see Figure 2) have a shape that appears to be a universal characteristic in the germination phase of seeds. For example, emissions from common wheat (Triticum aestivum) [14] and Arabidopsis thaliana seeds [26] are very similar to those presented here. All this seems to indicate that the emission is substantially controlled by a completely general process, characteristic of the germination phase and substantially independent of the type of seed. This is quite interesting and needs a deeper discussion.
The comparison [27] between the emission of the 76 lentil seeds and that of a single bean is reported in the inset in Figure 2. The emissions were analyzed for a fairly long time, from the end of the residual luminescence until the moment of the generation of leaves and roots. The time scales relating to the single bean and the 76 lentil seeds are completely different; therefore, to highlight the common characteristics of the two emissions, we rescaled the time scale of the bean by a factor of 0.164. This allowed us to align the two maxima, the C peaks in the figure. The zero was placed in the first minimum of both emissions at the end of the residual luminescence; this means we subtracted the values 10 and 100 from the original time scales, respectively, for the lentils and the single bean. Furthermore, to normalize the number of counts to the C peaks, we multiplied the counting scale of a single bean by a factor 2.28.
The time-rescaling procedure used here is based on the popular logistic equation [28,29], which can be used in different systems to describe the growth of a population that reaches the final steady-state value that is specific for any system. The logistic equation plays an important role in biology, also contributing to the emerging science of chaos. Here, the logistic equation takes the form
n ˙ t = a · n t b · n 2 t
where n(t) is the number of cells growing because of watering the seeds [29], and the numbers a and b are constants that depend on the system. The solution to Equation (1) can be written as:
n t = a · C e a t 1 + b · C e a t
where C depends on the initial conditions n(0) through the relationship C = n 0 a n 0 · b . We made the conjecture that the rate of biophoton emission is proportional to the derivative of the number of cells, i.e., to n ˙ t :
n ˙ t = a 2 · C e a t 1 + b · C e a t 2
Cells can be thought of as a kind of interacting unit in the living organism; for a single type of unit, the time derivative reaches a maximum at a time determined by the parameters and b and the initial conditions. The corresponding emission has a regular trend, with only one maximum reached at time t m a x = 1 a ln 1 β and intensity I m a x = a 4 b . β is defined as β = b · C .
We hypothesized that the saturation time of the ordinary logistic equation in different systems corresponds to the maximum emission peak, and we rescaled the time scale of the bean so that its maximum photon emission rate coincided with that of the lentils. In this way, we made a comparison between them, reducing the time of the slower growth by a reducing factor: 0.164 in the case of the bean.
The fact that the emissions of different seeds have very similar temporal behavior led us to hypothesize the existence of a sort of generalized logistic equation as a universal property of the connection between the system growth and photon emission.
The experimental data show a wealth of structures with a succession of maxima and minima distributed throughout the experiment. In detail, the lentil emission shows peaks B and C, separated by about 5 h, between time 0 and 20 h, and the same two peaks (B’ and C) are present in the emission of the single bean, but here they separated by about 14 h. The biophoton emission of the bean has a further peak A at about 43 h (these values in the bean time scale), which is absent in the lentil emission. Both emissions also show at least two slopes in the growth phase, between zero and peak C.
In our opinion, this is clear evidence of the presence of different types of units in the seeds that could be activated at different times on different time scales. The simplest generalization of Equation (3) that considers the presence of different types of units and with which to make a phenomenological fit of biophotonic emission as a function of time could be of the following type:
n ˙ t = a 2 e a t i = 1 J C i 1 + b i · C i e a t 2
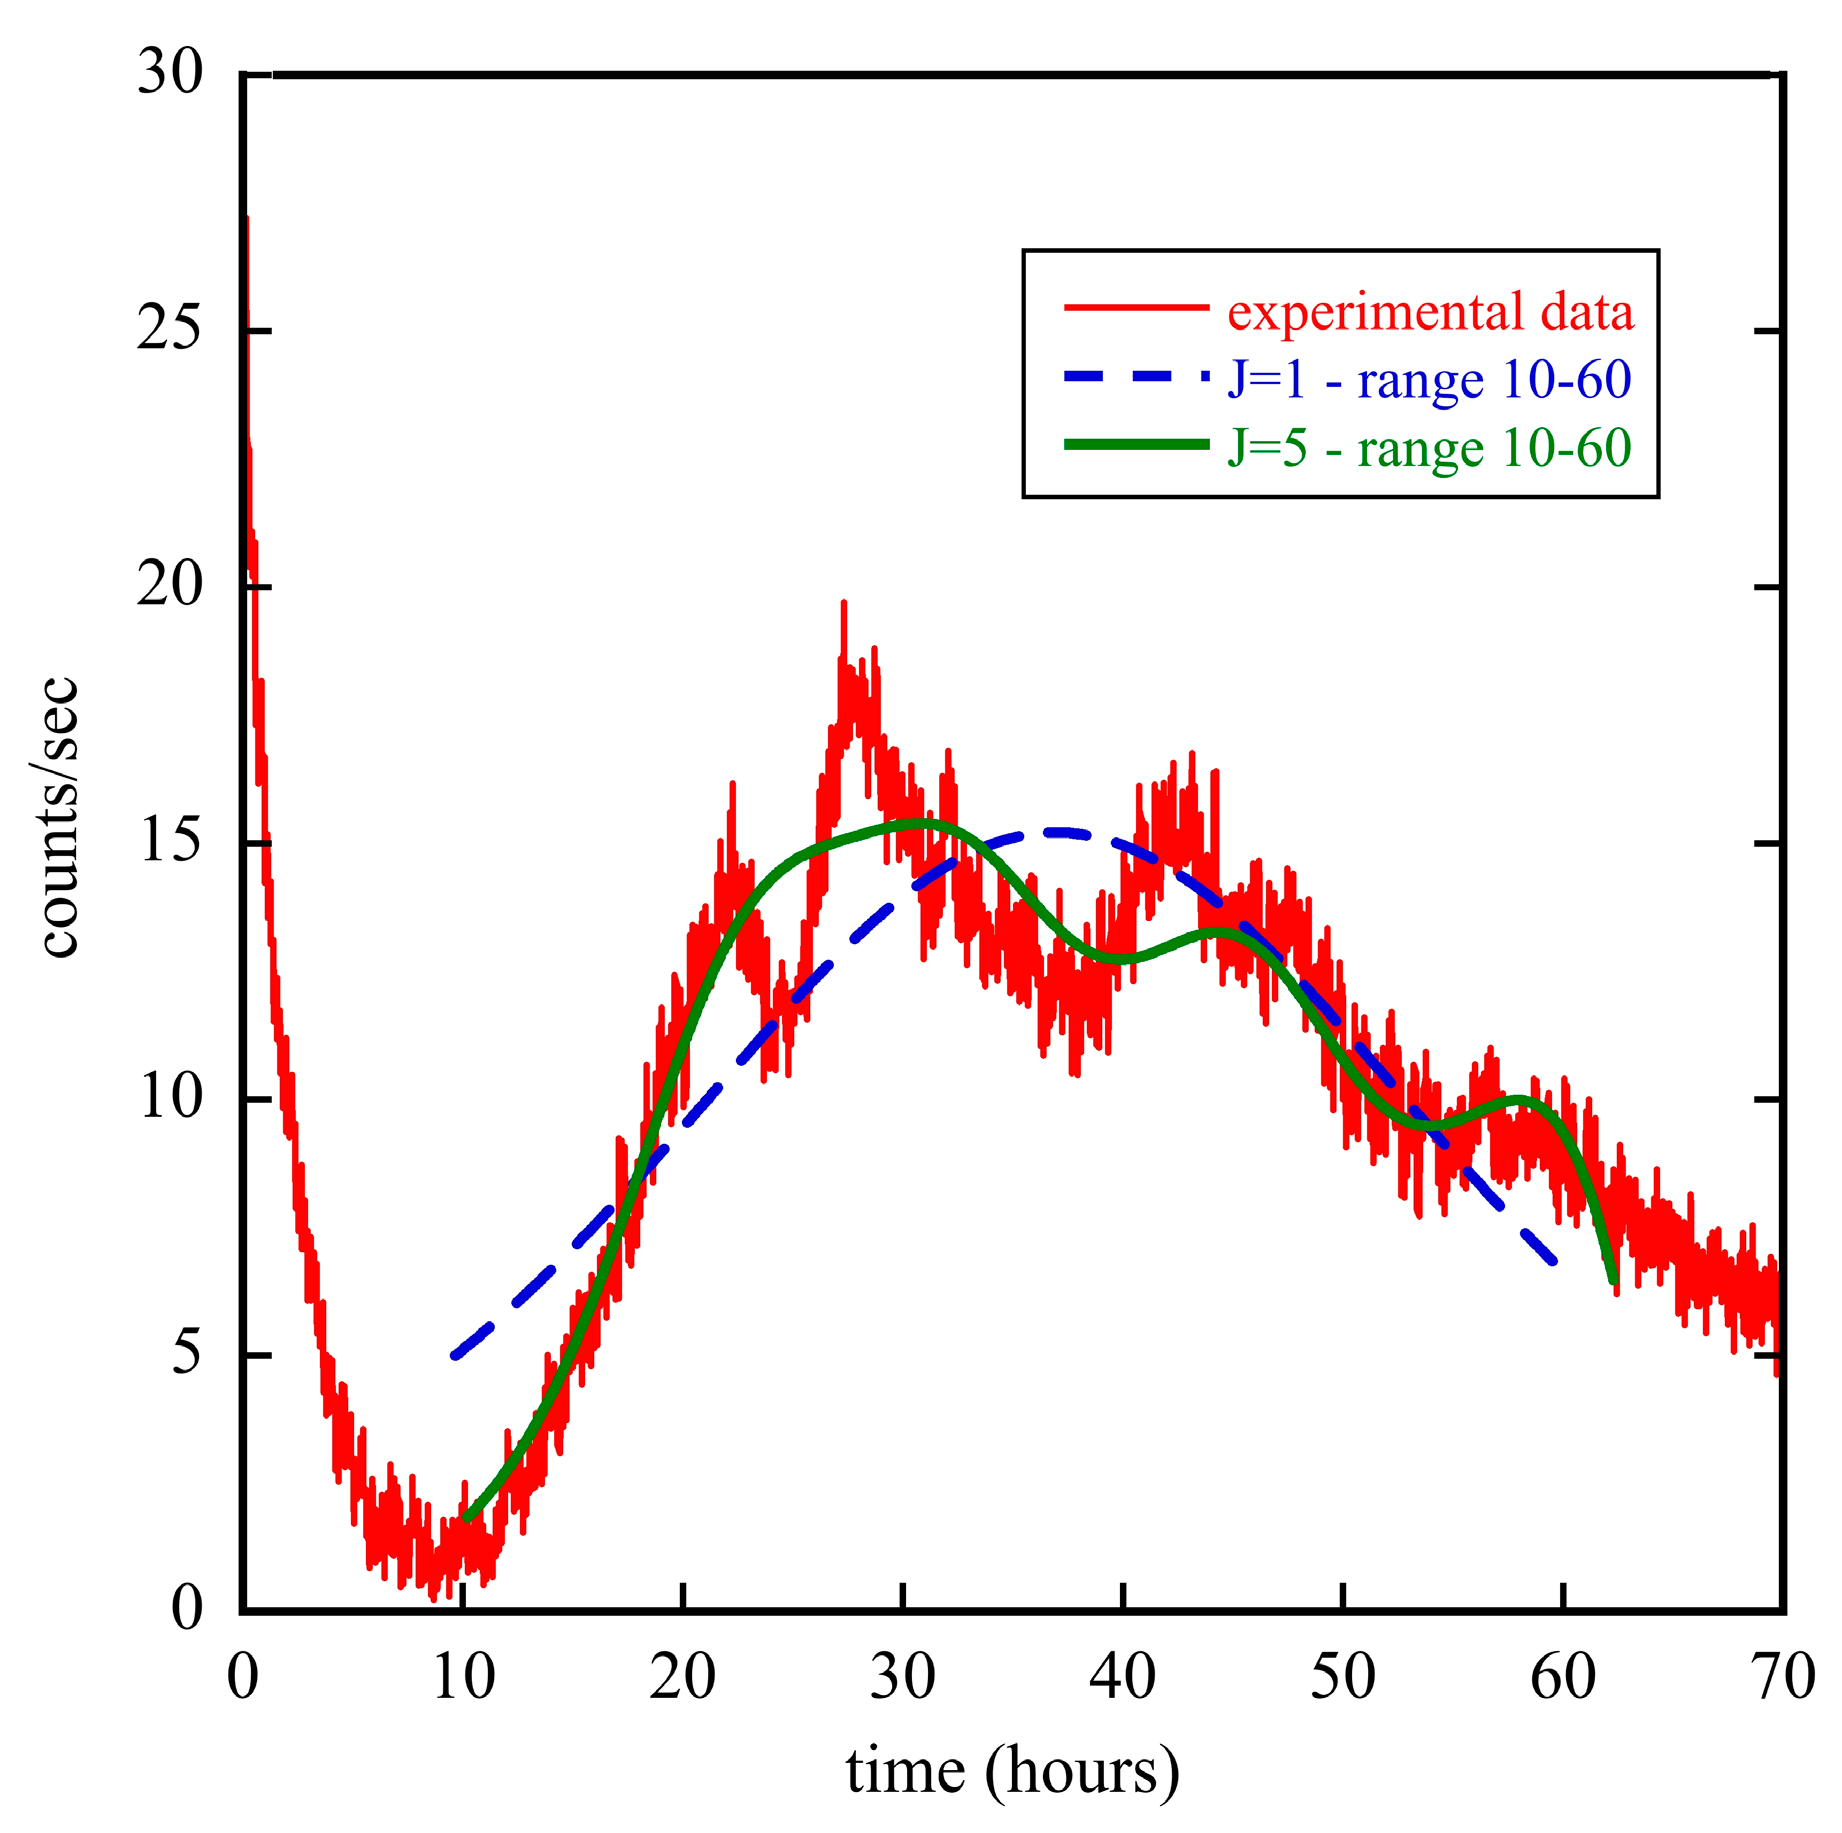
where the different constants could be determined by a fit procedure conducted by using the experimental data. In Figure 3, we present such a type of analysis by comparing the experimental data relating to the emission of the 76 lentils with the two fits made using Equation (4) with J = 1 and J = 5.
The two fits were conducted using the experimental data in the time range of 10–60 h. We do not report the values obtained from the fit procedure, both for brevity and because this analysis essentially aims to give a qualitative indication of the path to be followed for the development of models capable of shedding light on the mechanisms underlying the generation of biophotons. We also tested fits based on single-component models. These did not seem to work. This is not surprising as the temporal distances between the various peaks in the emission spectrum are different, and this seems to suggest the need for different frequencies.
It seems quite clear that only fits made based on many-component functions can reproduce, at least qualitatively, the shape of the time series representing the measured experimental data, supporting the idea that the germination process can also be thought of as the activation of different cell groups at different times characteristic for each group. From this point of view, each unit can be thought of as a node in a network, where each node can interact with its neighbors and make choices based on the increase or decrease in global benefit [30]. The system spontaneously evolves towards criticality, leading at the same time to the emergence of cooperation and intelligence. By intelligence, we here mean the fact that a local interaction changes into a long-term one, making the single units sensitive not only to their nearest neighbors but also to the units very far away from them. Analysis of single-bean experimental data produces the same type of fits and to the same type of interpretation, which is why they are not shown in this work.
For a full understanding of the biophoton phenomenon, one also needs to consider the processes of the excitation of molecules, which then give an emission during the radiative decay process. All the details of the cellular environment, i.e., the spectral distribution of the density of states, are important and can influence the excitation as well as the emission of the molecules, and the processes related to biophoton emissions should be essentially considered as connected to the nonthermal states occurring in the living cell. The processes in nonliving substances are mostly related to thermal equilibrium states at room temperature, and thus they cannot lead to molecular excitation and consequently to the emission of biophotons in the optical region. There are many models in the literature in this regard (see reference [31] for a review), essentially based on three processes. The first is DNA replication (it is considered a possible source of biophotons) during the cell cycle, when the activation energy of DNA replication may be used to excite molecules, prior to cell division, which includes membrane formation. The second is the synthesis of ATP that occurs during cellular metabolism, when the ion fluxes through membrane (particularly in the mitochondrion); the last one is based on the oxidation process of some biological molecules in the living system.

3. Statistical Analysis of the Experimental Data

In this section, we briefly present the main results regarding the statistical properties of the time series representing the experimental data using the probability distribution function approach and the diffusion entropy analysis method.

3.1. The Probability Distribution Function Approach

In a semiclassical picture of the optical detection process, a phototube converts the continuous cycle-averaged classical intensity I ¯ t into a series of discrete photocounts. Thus, the photocount m obtained in an integration time T is proportional to the intensity of the light that arrives on the detector [32]. From the experimental data, it possible to obtain the distribution function P n T , which counts how many times a number of photons n has been detected by the phototube in a given acquisition time T. Therefore, after an appropriate normalization process, it gives the probability of obtaining m counts in the chosen acquisition time window.
This function is analyzed by determining the mean, variance, and other moments of higher order to highlight some statistical properties of emitted light, considering that, at least in some particular cases, there is a direct correspondence between the statistical properties of the light, the functional form of the P n T , and some characteristics of the physical process behind the production of the measured light. We do not repeat here the entire theoretical derivation that leads to the determination of P n T , but we want to remember that there are only some cases that lead to an analytical form of this function. Details can be found in the literature [27,33].
The simplest case is a stable classic light wave, where the cycle-averaged intensity has a fixed value independent of the time [33]. In this case, the distribution has a Poissonian form:
P n T = n n n ! e n
where n = α I ¯ T . Factor α is a constant that depends on the construction characteristics of the phototube. For a Poisson distribution, the variance is equal to the average σ 2 = n . It is convenient to define the so-called Fano factor [32] F through the relationship σ 2 = F n to quantify some type of departure from the Poisson distribution; this could be an indication of a nonclassical nature of the light. A Poisson distribution is a sign of a system in coherent states; in this case, the quantum states correspond to classical electromagnetic waves [27,32,33], but this distribution also occurs for experiments where the integration time T is much longer than the characteristic time of the intensity fluctuations of the light beam.
The photocount distribution can be also derived for complete thermal chaotic light [28,32,34]. In this case, the distribution takes the form
P n T , M = n + M 1 ! n ! M 1 ! 1 + M n n 1 + n M M
where 〈n〉 is the average number of photons, and M is the number of field modes. Thermal states are classical, and there is the following relationship between average and variance:
σ 2 = n + n 2 M
In general, the M coefficient could be huge, in this case, the variance becomes almost equal to the average value, recovering the equation valid for the Poisson distribution. Therefore, for large M values, the thermal photocount distribution approaches the Poisson distribution. This implies that it is difficult to discriminate between coherent and thermal states when many modes are present, in agreement with the discussion of in Ref. [34].
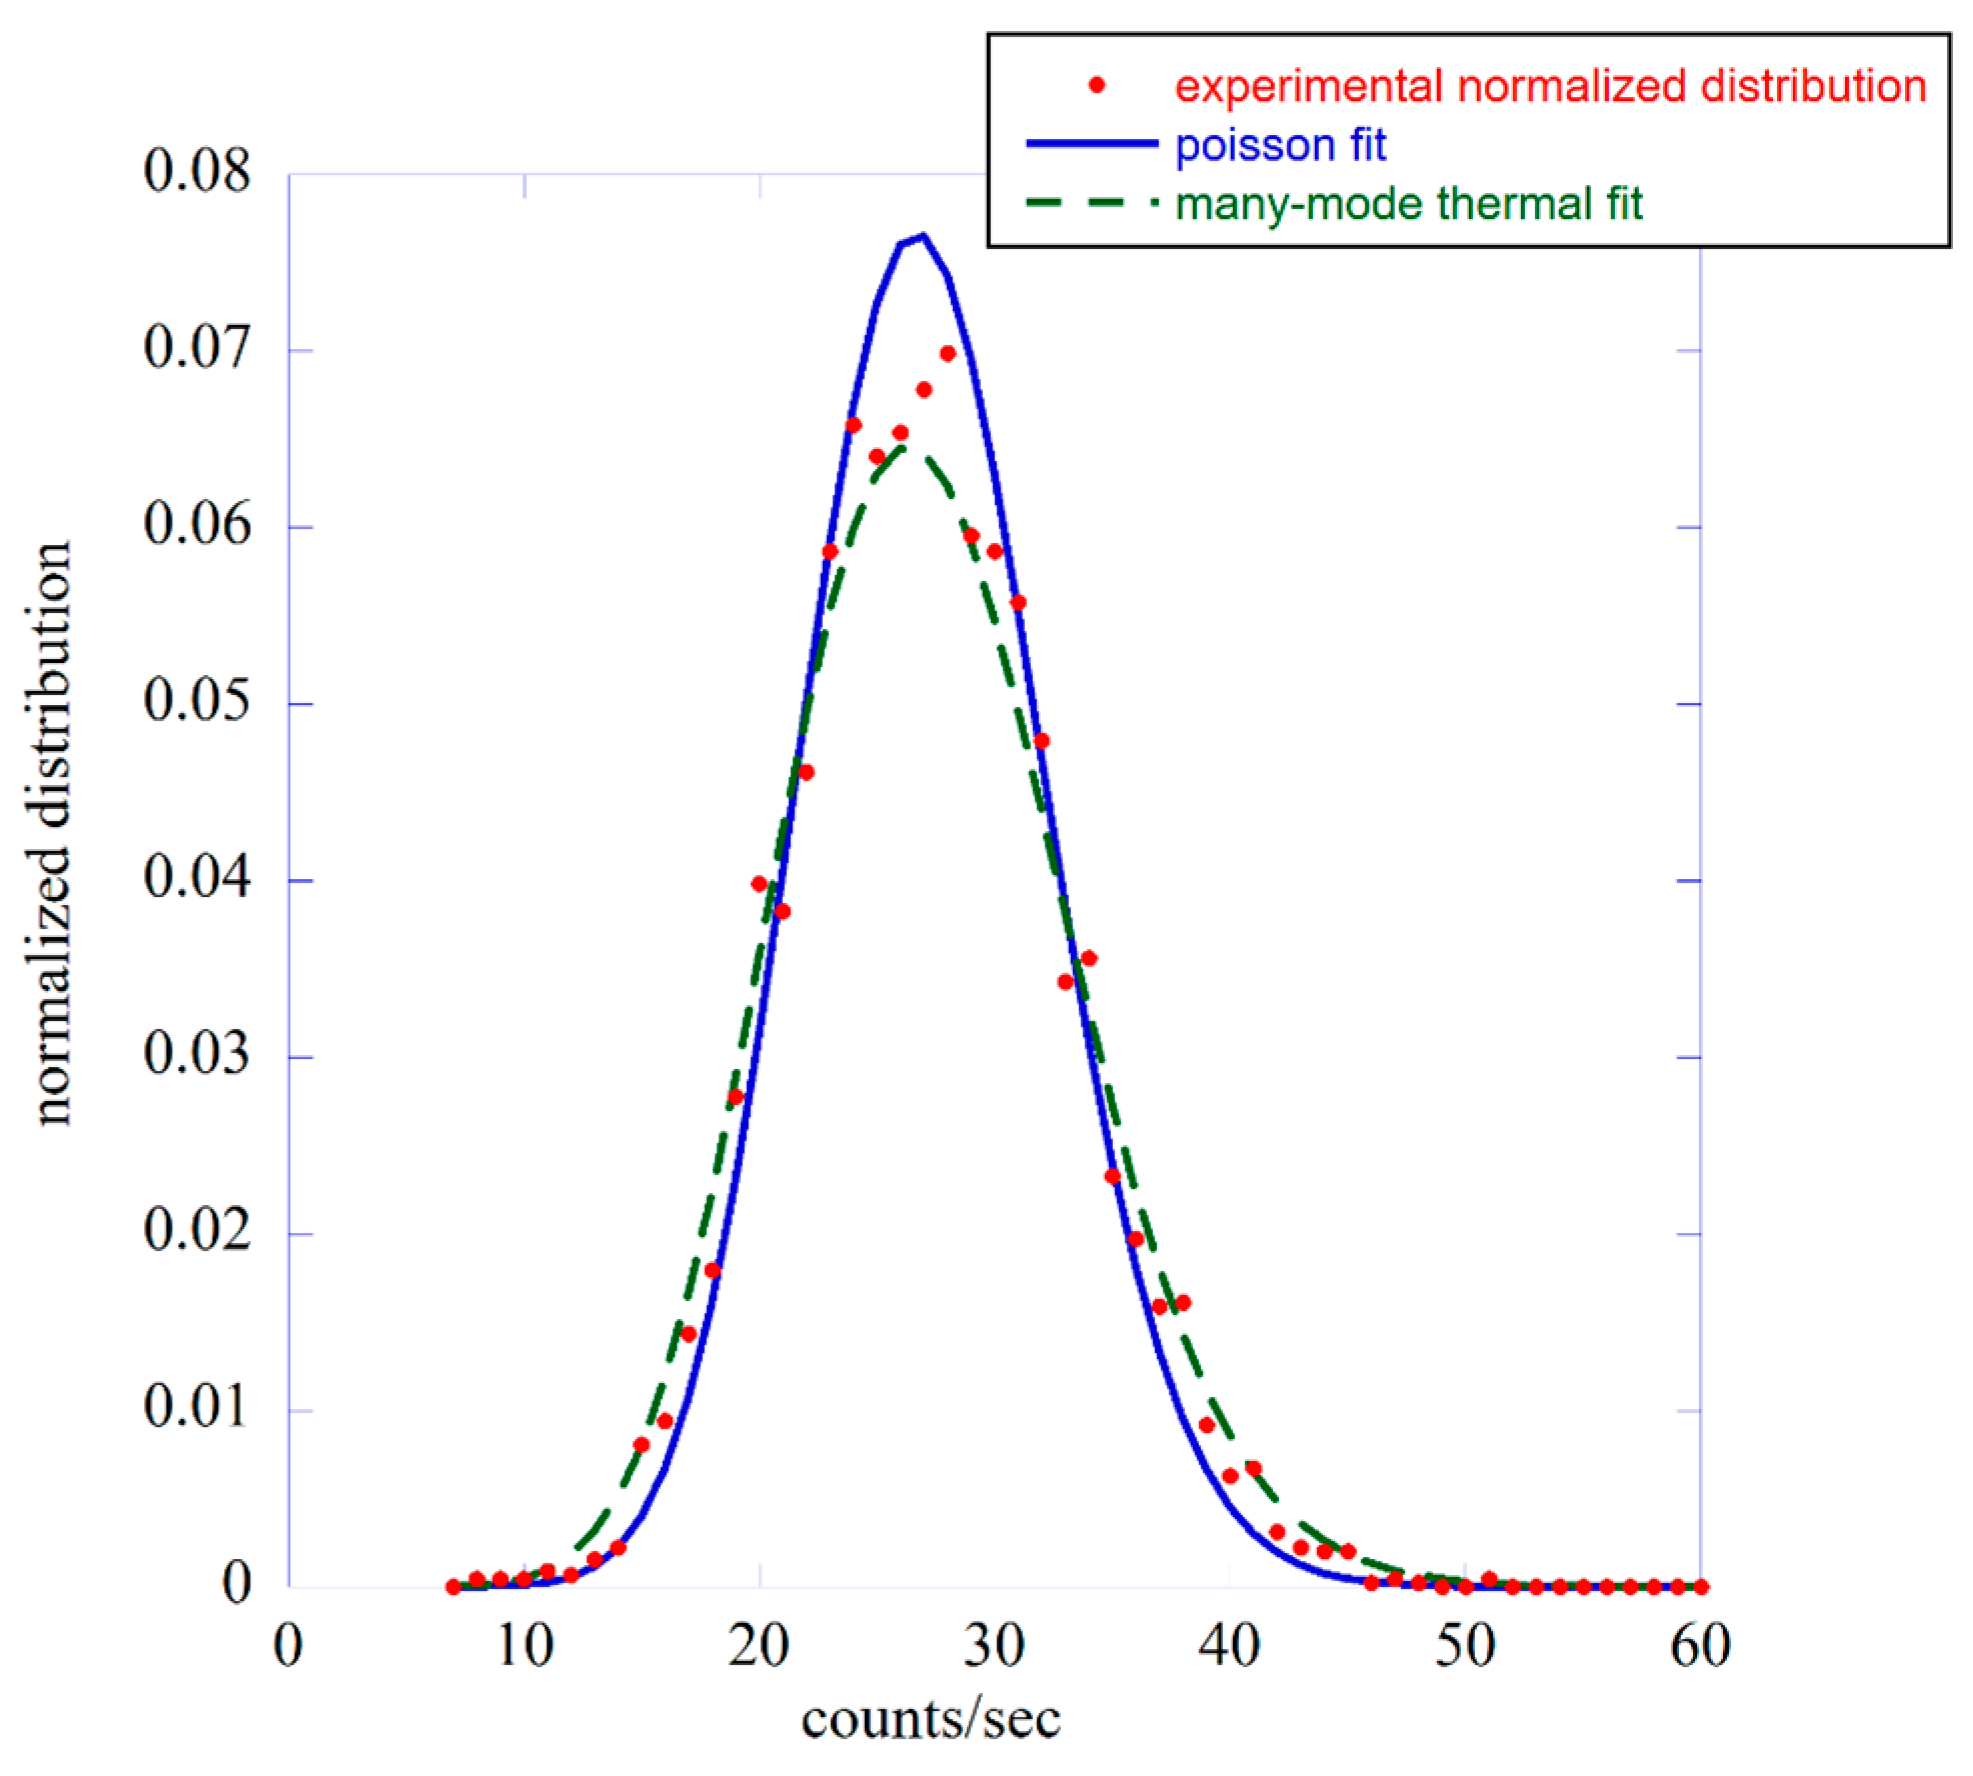
In references [17,27], we have already presented a detailed analysis of the experimental data relating to lentils and a single bean. For brevity, we present here only the comparison between the P n T obtained from the experimental data of lentil seeds related to the time window between 20 and 30 h (original time scale in Figure 1) and two fits performed using Equations (5) and (6). The results are presented in Figure 4. The two fits have essentially the same χ 2 , and there is no reason to prefer one over the other.
In this case, the experimental average count is n = 27.25 and the variance is σ 2 = 34.01 . The Fano factor F   ~   1.25 indicates a photocount statistics of the super-Poissonian type. The Poissonian type of the fit gives an average count equal to n = 27.18   ±   0.07 , while the multimode thermal function gives n = 27.27   ±   0.05 and M = 65.0   ±   0.03 , in this last case, Equation (7) is roughly satisfied. This result confirms what we have found in previous works [17,27]. The experimental photocount distribution function always has, at least for the time windows considered in our experiment, a variance greater than the average value, indicating a super-Poissonian type of behavior, which is typical of either thermal emission or emission with a very short coherence time compared to the time window of the measurement. Using this type of analysis, it is very difficult to discriminate between coherent and thermal states, in agreement with the discussion in Ref. [32]. The possibility of proving whether the biophotonic emission of living beings is coherent, so measuring some parameters such as the coherence length and time is extremely important for the implications that this type of finding would have in defining the role that coherent processes have in biology. Coherence parameters can be measured using light interference or light correlation functions [32,34]. The nonclassical nature of the emitted light could be assessed using the measure of the higher-order correlation functions associated with the electromagnetic field [33,34]. This type of measurement is extremely challenging with the experimental setups used until now because we need to consider signals of very low intensity and those coming from nonstationary processes.

3.2. The Diffusion Entropy Method

There is now clear evidence that biological systems cannot be described by the ordinary prescriptions of equilibrium statistical mechanics. This indicates the need to have analysis methods that can highlight all the deviations from the canonical form of equilibrium to understand the breakdown of the conditions on which Boltzmann’s view is based: no memory, short-range interaction, and no cooperation. Any deviation from the canonical form is a measure of the system’s complexity. There is still no unanimous consensus on the origin of complexity. In our case, the idea that complexity emerges from self-organization seems to be the most appropriate. The seed can be thought of as a system that self-organizes when it begins to germinate because of watering. In general, a complex system is formed by several interacting units generating a whole with specific properties such as nonlinearity, self-similarity, and self-organization, to quote just a few. Complexity can be thought of as a delicate balance between order and randomness, and when one of the two prevails, complexity turns into simplicity.
In the complexity literature, there exists wide consensus on the importance of Kolmogorov complexity [20], especially of Kolmogorov-Sinai entropy [35,36]. The evaluation of Kolmogorov complexity has been the subject of many studies. A dedicated discussion of this literature is out of the scope of this paper, we refer the reader to the discussion presented in Ref. [19] for details. These authors illustrated two research directions aimed at evaluating Kolmogorov complexity; one called compression, aiming to establish the Lyapunov coefficient directly, and the second one is called diffusion, which is based on converting the original time series into a diffusion process. The Kolmogorov complexity is turned into a scaling factor η, which is expected to depart from the ordinary value η = 0.5.
The technique of analysis used here is based on the diffusion approach, and it is called Diffusion Entropy Analysis (DEA). This method was introduced in the literature in the early 2000s [37,38,39,40], and it is based on converting experimental time series, like the emission we recorded with our experimental setup, into a diffusional trajectory and uses the deviation of this diffusion from that of ordinary Brownian motion as a measure of the temporal complexity in the data. The complexity of the signal is determined through the evaluation of the Shannon entropy associated with the diffusional trajectory under the assumption that the complexity of the signal may be revealed by the anomalous scaling of the diffusional trajectory.
The time axis is divided into bins of size s (in our case s = 1 sec), and we assign to the nth bin the value ξ(n), which is the number of photons emitted in that small time interval. In total, we have a time series of length M. For notation simplicity, the time series is considered as a continuous time signal ξ(t), in this way, the diffusional trajectory can be defined as
x t = 0 t ξ t d t + x 0
It is convenient to consider the x 2 t time series because it is directly related to the correlation function of the original time series [17,37,38,40]. The scaling properties are determined through the long-time limit behavior of the correlation function ξ t 1 ξ t 2 , and the average can be made over a large number of realizations of x 2 t using the moving window method. See references [37,39,40] for details. Following the standard approach of assuming that the correlation functions are stationary, it is possible to define a normalized correlation function totally independent of the absolute values of t 1 and t 2 :
Φ ξ τ = ξ t 1 ξ t 2 ξ 2
where τ = t 1 t 2   , and it is related to the x 2 t time series as
x 2 t = 2   ξ 2 0 t d t   0 t d t   Φ ξ t
We can now relate the complexity of ξ(t) to the anomalous scaling of the diffusion trajectory x(t). Using FBM and Hurst notation [21,38], we indicate the scaling factor with the symbol H, instead of η. Differentiating Equation (10) twice with respect to the time and supposing that x t H , we obtain
Φ ξ t 2 H 2 H 1   t 2 H 2
which, when H deviates from the ordinary value H = 0.5, has, in the long-time limit [40], the structure Φ ξ t ± 1 t δ , with δ = 2 2H. Any deviation from the value H = 0.5 indicates the anomalous behavior of the time series, which therefore presents some type of complexity even in the case of a stationary regime.
Although the conversion of the time series ξ(t) into a diffusion trajectory leads naturally to relating the complexity of ξ(t) to the Hurst coefficient H ≠ 0.5, there exists another source of anomalous behavior [41] of the diffusion trajectories that cannot be described through stationary correlation functions.
One of the key features of most complex systems is the presence of renewal events [41,42]. The presence of a renewal event resets the memory of the system, and the sequences τ i of the waiting times between successive renewal events are completely uncorrelated and independent. Renewal events generate a rejuvenation of the system, giving rise to a dynamic where, whenever an event of this type occurs, the system restarts from a completely new state. Renewal events are characterized by the fact that the time interval between successive events is described by a waiting-time probability density function, which has the important asymptotic properties ψ τ 1 τ μ , with μ ranging from 1 to . Crucial events are renewal events corresponding to the condition 1 < μ < 3.
A classic example of a crucial event is the sudden change in direction of the flight of a swarm of birds. When such an event occurs, the global velocity of the swarm vanishes, and the birds fly in a new direction that does not correlate to the previous one [43,44]. These types of events are not confined only to the swarms of birds but can be found in many biological and physiological processes [44] and play an essential role in the self-organization process of the living system and in keeping it healthy [45,46].
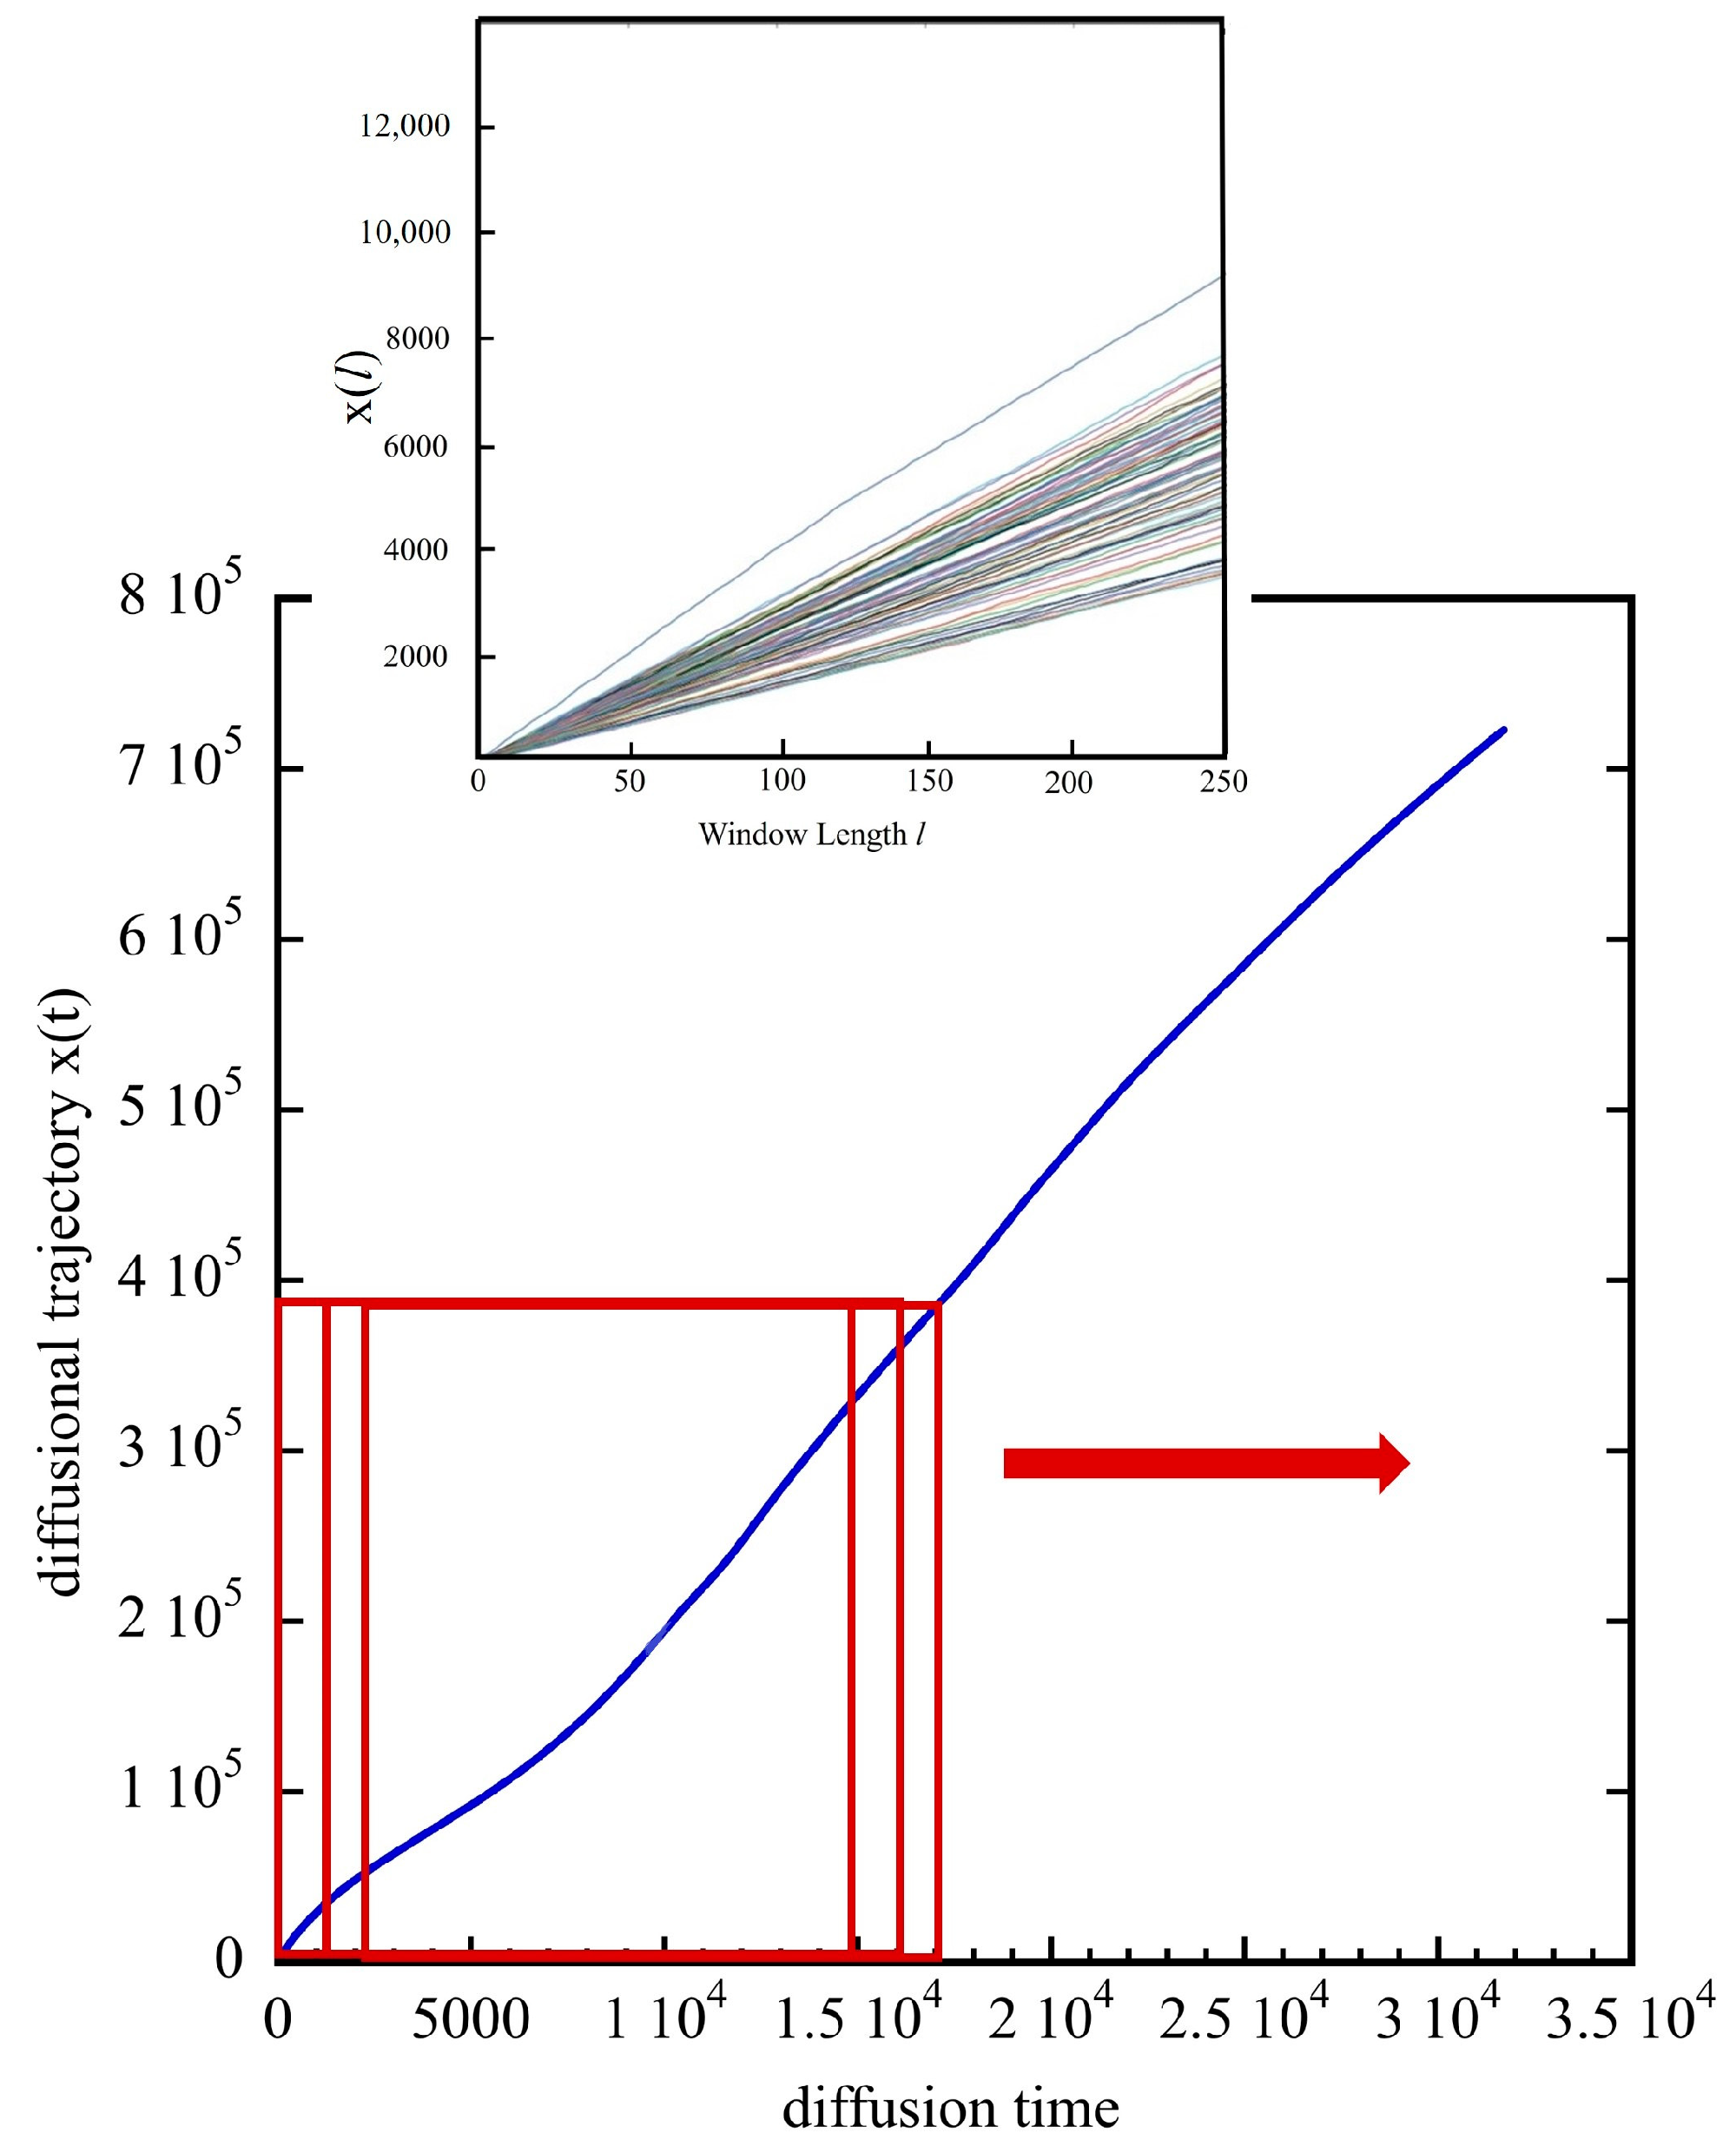
For the analysis of data generated by the emission of biophotons, we have at our disposal only one time series. To perform the statistical analysis, we convert the diffusional trajectory x t   into many realizations so as to make it possible to obtain an ensemble average. These realizations are performed through a window of size l that we move along the trajectory x(t). Assuming a window of length l ranging from t to t + l , the value x t can be thought of as the initial position of a random walker that jumps in a time l from the origin to a value x = x t + l x t . This procedure is represented graphically in Figure 5.
The different realizations obtained using the moving window method are defined as
x ( l , t ) = t t + l d t ξ ( t )
Note that the largest value of l is M t , where M is the number of bins in our time series, and for any given window size l , we can generate N l + 1 realizations changing the initial position of the random walker, i.e., the t value. Some of these new realizations are represented graphically in the inset in Figure 5 for a given value of l . We are now ready to calculate the probability distribution function p x , l and the related Shannon entropy of our diffusion process. For further details, see [18].
With M being very large, as in our case, it is possible to create enough realizations so as to be able to evaluate the probability distribution density p x , l with an accuracy high enough to fit the scaling coefficient η , assuming the scaling condition
p x . l = 1 t η   F ( x t η )
The Shannon entropy related to the probability distribution density p x , l can be written as
S l = d x p x , l   ln [ p x , l ]
and plugging Equation (13) into Equation (14), we obtain
S l = A + η · ln ( l )
This equation means that the entropy S l   increases linearly with ln l , and the slope of the resulting straight line is the scaling factor η , which must be found numerically from the experimental data. The numerical results are expressed in a linear-log scale that transforms the fitting curve with the form K + η ln l into a straight line. Of course, if the FBM condition applies, η = H .
The results in Figure 6 were obtained by examining portions of different lengths L of the experimental sequence of the dark emission. The starting point of these different portions is always the beginning of the experimental sequence. Increasing the length L, the entropy S(l) derived with the DEA algorithm remains essentially the same, which is not surprising as dark emission is stationary over time with an average count of about 2 counts/sec. The main effect is increasing the accuracy in determining the scaling factor η through the fit procedure. In this case, we found an average value η = 0.54 ± 0.07 .
This method allowed us to find the anomalous scaling associated with the experimental data, but it was not able to discriminate whether the scaling factor was due to stationary or nonstationary correlation functions. For this purpose, the DEA algorithm must be modified by introducing the concept of stripes, as discussed in [18]. Rather than converting the original experimental data into a diffusion process x(t) directly, we divide the ordinate axis into many bins of size s and record the times at which the experimental signal crosses the border of two neighboring stripes. In this way, we obtain a new time series t i . At any of these times, an event occurs. We replace the experimental time data with a time series z(t) defined as follows: if time t coincides with one of the times t i , we set z t = 1 , and z t = 0 otherwise. In other words, if time t corresponds to the occurrence of an event, the random walker makes a step ahead by a fixed quantity of one. The diffusion trajectory can be now obtained using Equation (8) again with the surrogate time series z t . This is a very short description of the DEA with and without stripes; details can be found in Ref. [46].
To distinguish the anomalous scaling generated by crucial events from other types of anomalous scaling, we denote it with the symbol η rather than H. It is possible to demonstrate [40,41] that there are several different equations relating η and μ depending upon their values. In detail: η = μ 1 for 1 < μ < 2 ; η = 1 μ 1 for 2 < μ < 3 ; and η = 0.5 for μ > 3 . If complexity is generated by crucial events, the region μ > 3 corresponds in any case to stationary fluctuations and is interpreted as the manifestation of ordinary equilibrium statistical physics; conversely, the region with μ < 3 is the area of nonstationary behavior, either temporary when 2 < μ < 3 or permanent for 1 < μ < 2 .
The experimental data showed extreme variability in terms of observed intensity; for this reason, we decided to divide the total acquisition time of about 72 h into six regions, the first five having a length of 10 h, while the last one was greater, being equal to 22 h. The idea behind this way of analyzing data was to understand if μ changes with time during the germination process, its value at different stages of germination, and how these compare with the values obtained in the analysis of some other physiological processes, like heartbeats [45] and brain dynamics studied via EEG recording [47].
In Figure 7, we show the six regions chosen for the analysis, separated by vertical black lines. For each of these regions, we used DEA with and without stripes to determine the various scaling factors. A similar analysis was also conducted for the dark counts to enable a comparison with the experimental data coming from a case without any seeds.
We found that the dark count yields the ordinary scaling, thereby showing that no temporal complexity of either kind may occur in the absence of any seed in the chamber. In the presence of seeds in the chamber, anomalous scaling emerged. The analysis with no stripes yielded a scaling significantly larger than the scaling obtained by DEA supplemented with stripes. Furthermore, while the scaling factor remained practically constant in all the six different regions when obtained by using the DEA without stripes, there was a significant time dependence for the scaling factor obtained by the DEA with stripes. In the first phase of germination, within the three first temporal regions, the value of μ was significantly less than three, a value that increased with the progress of the germination process. Without stripes, the η value increased from 0.694 (μ = 2.44) to 0.796 (μ = 2.25), while with stripes, it increased from 0.496 (μ = 3.01) to 0.596 (μ = 2.67). For brevity, we do not report here the complete analysis (see Ref. [17] for details), but we present a summary using an average procedure on the different scaling factors. These numbers related to the different temporal regions are divided into two sets: in the first one, the average is determined using the scaling factors obtained in temporal regions #1–3, while in the second set, the average is determined using the scaling factors coming from regions #4–6 (see Table 2 in Ref. [17] for the numbers).
Using DEA without stripes, the average scaling index related to the first 30 h (regions #1–3) was η = 0.77 ± 0.03, which corresponds to a mean μ = 2.30 ± 0.05, while in the second three regions (regions #4–6), the average scaling index was η = 0.72 ± 0.02, corresponding to a mean μ = 2.39 ± 0.04. Essentially, there is no time dependence of the scaling factor throughout the whole germination process. In contrast, when applying the DEA with stripes, the results showed a clear and significant time dependence. In fact, in the first three temporal regions, the same analysis produced a mean scaling factor η = 0.56 ± 0.04, which corresponded to a mean μ = 2.79 ± 0.11, while the last three regions have a mean scaling factor η = 0.50 ± 0.01, which corresponded to a mean μ = 2.99 ± 0.03.
These results indicated that in the first three temporal regions, the departure from the condition of random diffusion was due to the presence of crucial events, while the FBM regime dominated in the last stage of seed growth. In other words, it seems that during the germination process, the nonergodic component tends to vanish with time, and complexity becomes dominated by stationary infinite memory. However, the DEA without stripes gave scaling factors significantly larger than those achieved with the use of the DEA with no stripes. This indicated that the germination process generates both crucial events and noncrucial events of the FBM type. Therefore, the complexity of the emission of biophotons can be thought of as a mixture between two dynamics: one associated with crucial events and the second with noncrucial events of the FBM type having infinite memory. The latter can be interpreted as a form of quantum coherence, which becomes predominant in the late germination phase.
In the upper part in Figure 7, we show the different spectral components of the signal relating to the various wavelength intervals. The experimental data were obtained through the use of long-pass glass color filters, and the curves correspond to the average number of photons in each wavelength interval divided by the total signal without any filter. The complete analysis and a detailed description of the method can be found in Ref. [27]. It is clear that the different ratios changed as a function of time, according to the moment of germination. In particular, the high-energy components (green and violet curves) remained constant for the entire time of the measurement, while the lower-energy parts change in relative intensity; in detail, the orange part decreases at the beginning for a few hours, it remained constant for up to hours 20, and then it slowly decreased until reaching a constant value after 30 hours. This behavior was associated with a simultaneous increase in the yellow-green component of the spectrum at 10–30 hours. After this time interval, all spectral components remained essentially constant until the end of the experiment. It is interesting to note that hour 30 represents the border between the time region where complexity is due to the presence of crucial events and that instead dominated by the FBM type of fluctuations. In our opinion, all these results represent the first empirical data indicating that the germination process of lentil seeds is a process that presents phase transitions [11] accompanied by changes in patterns of complexity (crucial to noncrucial events).
This type of behavior can also be found in the heartbeats of patients under the influence of autonomic neuropathy [48]. The increasing severity of this disease has the effect of making μ move from the healthy condition close to μ = 2 to the border with ordinary statistical physics μ = 3, which corresponds to a pathological state. In human beings, the presence of crucial events is a necessary condition for different organs to “talk” to each other, for example, the heart [45] and brain [47,48]; it is also the condition for maintaining good health [45,48].
This may not be true for plants as they do not have well-defined organs; only at the beginning of the germination process is there a clear differentiation process that may require the presence of crucial events. However, to grow, plants need light to trigger the synthesis of chlorophyll, which is necessary to produce the appropriate nutrients; this did not happen in our experimental apparatus, which was a light-free environment. Therefore, the change in patterns of complexity may also be due to the beginning of a pathological process that leads to the death of the plant.
Discriminating between these two hypotheses is of extreme importance because it could open up the possibility of using the emission of biophotons as a tool to understand the state of health of a living organism through the determination of scaling indices and therefore the presence or absence of crucial events. At the same time, as the emission of biophotons is a universal characteristic of living organisms, this study can lead to confirmation that the presence of crucial events is a necessary condition for the health status of any type of living organism.

4. External Excitation and Biophoton Emission

One of the peculiar characteristics of biophotonic emission is its extreme sensitivity to any type of stress that can be externally applied to a living organism. Typically, a stress reaction is manifested by a sudden increase in the intensity of the emission, generally followed by a decrease, and sometimes a return to the normal nonstressed baseline [1]. However, there is no univocal response to various types of external stimuli (typically mechanical, electromagnetic, or chemical), and, in some cases, very small quantities of chemical substances [49,50] may have the effect of increasing the intensity of the radiation emitted even by a few orders of magnitude, while in other cases, large concentrations of toxic agents may cause small changes [14] in the emission that remain practically stable even for long periods.
The biophotonic emission of plants presents a temperature dependence typical of physiological processes, with the presence of an overshoot of emission when the temperature increases and an undershoot when the temperature decreases [1,50,51]. In the beginning, the emission rapidly increases, in accordance with the fact that the speed of physiological processes typically increases with increasing temperature, obviously within biologically acceptable limits; then, there are two characteristic peaks, followed by a slow decrease to lower values. Very interesting is the hysteresis-like dependence of the emission on the temperature T, as T is cyclically changed. The presence of the two peaks and the hysteresis loop clearly point to the nonlinear and collective behavior of the plant cells and the presence of some type of memory. All this indicates a typical behavior of complex systems, for which the phenomenon of biophoton emission is not the sum of a series of independent microscopic biochemical processes but the result of a cooperative process involving different groups of cells. The DEA supports this idea by highlighting the presence of a nontrivial temporal complexity in the time series representing biophotonic emission.
There is also clear evidence that any type of mechanical damage to some part of the plant produces an effect on biophotonic emission [52,53]; in particular, there is an increase in intensity. This also depends heavily on which part is damaged and on the kind of wounding. For example, in Cucurbita pepo var. styriacae, cutting away part of the seed leaves produces an increase in emission, which slowly reaches a constant value in approximately hundreds of seconds after damage. Cutting the stem produces a rapid increase in intensity followed by a decrease, which brings the emission to values similar to those it had before the wound [53]. This study indicates that reversible perturbations of homeostasis produce an increase in the intensity of the emission until a stationary value is reached. On the contrary, damage that leads to death produces a rapid increase in the intensity of the emission, followed by a decrease until the end of the emission at the moment of death. In other words, if the external stimulus is somehow “manageable” by the plant, the plant reorganizes itself, with changes aiming to bring the organism to the maximum possible well-being considering the new external situation. A local stimulus, such as damage to a small part of the plant, leads to biochemical and electrical events that affect the entire plant and not just the part affected by the wound. Therefore, there must be a very precise coordination of these adaptative events that must pass through a wide network of signals and transduction pathways.
The experimental phenomenology associated with stress phenomena is very broad and varied; at the same time, there is an equally wide variety of interpretative models that attempt to explain the experimental data currently available [51]. In our opinion, much remains to be achieved, especially with regard to the explanation of the temporal trend in the emission following a stress of some kind.
As a final example, let us now examine the phenomenon of delayed luminescence (DL). Several experiments carried out in recent decades have demonstrated how a previous brief illumination of a biological sample can temporarily increase its subsequent emission of biophotons by important factors, up to a few orders of magnitude [54]. Furthermore, this signal lasts longer than usual fluorescence and has been seen in virtually all biological systems studied up to now. DL emission is also very sensitive to the biological state of the system [55], and, for this reason, it is now widely used as a noninvasive method for obtaining biological information.
Typically, a sample is illuminated by a pulse of light generated by a nitrogen laser equipped with a dye laser module to enable the possibility of varying the wavelength of the exciting radiation. In this way, the system generates pulses with a 5 ns width, an energy of about 150 μJ/pulse, and a wavelength ranging from 360 to 710 nm. During this illumination phase, the phototube is off to avoid any damage, and the acquisition starts 10 ms after the end of the laser pulse. Data analysis consists of studying the decay of the emission after the sample was irradiated with the laser pulse, and the decay time to return to normal emission can vary from a few tens of seconds to a few minutes, i.e., a much faster time than the typical one in germination processes, which normally takes place over tens of hours. The typical decay curve takes the form of a power law of the type [56].
I t = I 0 ( 1 + t t 0 ) m
and the total number of emitted photons is the integral of this function between a minimum and a maximum observation time. Hyperbolic forms such as this have already been used to describe the decay in delayed fluorescence and the temporal decay of coherent systems. The different parameters in this equation are determined from experimental data with a fitting procedure, and they characterize both the biological system under study and its physiological state [55]. The main characteristics of DL, in particular its long decay times and its existence at physiological temperatures, indicate that it can hardly be connected with delocalized states such as normal electronic bands. On the other hand, it is currently thought that DL is connected to the formation and dissociation of self-localized nonlinear electronic states of the soliton type, which could form in the low-dimensional macromolecular structures normally present within cellular structures [56,57].
This type of model has a more general value, and it is not only confined to the DL, but, on the other hand, it is unable to explain cases of nonhyperbolic decay or the wide variability in the observed decay times. For this reason, a two-phase model was recently proposed: a stress transfer phase that transforms stress into a generation of photons, followed by a photon propagation phase [58]. In our opinion, spontaneous and stimulated emissions originate from substantially different excitation/deexcitation channels, although they probably involve the same types of molecules.

5. Biophotons in Living Materials

In this short section, we give a brief overview of the use of biophotons in recent studies in living matter; biophotons are in fact emitted by all living organisms. Since Gurwitch’s first studies, many groups all over the world have studied, and are currently studying, this phenomenon in completely different contests. Hundreds of articles have been written. For an extensive review, see Ref. [31].

5.1. Seeds and Plants

Many groups are interested in studying germinating seeds for several reasons, mainly to test the germinal goodness of the seeds and to verify how plant growth is affected by pests, pollution agents, insecticides, fertilizers, and extreme atmospheric conditions. The assessment of the quality of a seed is one of the most essential tasks for seed certification: the study of the biophotons emitted by a sample of seeds is a rapid method to assess various seed-quality parameters, as Sarmah states in Ref. [59].
Extensive studies on the consequences of pests have been performed at the Hungarian University of Agriculture and Life Sciences [60,61], observing plants in vivo. The same group studied the effect of pollution agents, for example, cadmium on barley [62]. When pests are present and insecticides are used, it is important to understand their effects on plants. For example, a group at the Universidade Tecnologica Federal do Paraná (Brazil) is studying Triticum aestivum treated with thiamethoxam [63].
It is also important to know how fertilizers affect plants: Salieres’s group studied how hydrogenated water acts on Medicago sativa plants, affecting growth and development [64]. Kobayashi’s group studied azuki seeds and their behavior under heat shock [65].
Other studies were conducted for understanding which parts of plants emit biophotons: Mackenzie’s group separately observed the biophotons emitted by roots and the upper part of a-mung sprouts [66].

5.2. Food Quality

Observation of biophoton emission is widely used in this field because it is a fast and noninvasive technique. Recently, the Iranian-Brazilian group headed by Nematollahi produced an extended list of studies on food quality and food production quality [67]. For example, biophoton emissions coming from chicken eggs were used regarding the possibility for quality verification [68], while the emission from wine has been used to test the different winery practices in France [69] and in Hungary [70] to improve the quality of production.
Nowadays, food is stored for several days before arriving in our houses. Biophotons can help in this case too. Several groups have used this emission to understand the degree of freshness of several types of food in many different conditions [59,61,71] and the security of storage of food, as in the study by Gong [72].
Pulsed electric field technology is an important emerging modality for both biomedicine and the food industry, e.g., in medicine (electrochemotherapy, tissue ablation, novel methods for drug and gene delivery and therapy), in the food industry (pasteurization, food compounds extraction), and in biotechnology. Biophotons are used in this case for sensing the protein oxidation generated by pulsed electric fields [73].

5.3. Humans and Animals

Many studies have been conducted on human beings and animals. The production of biophotons inside the human body was demonstrated by Zangari’s group, observing a signature left by biophotons, using a technique based on the principle that the ionic Ag+ in solution precipitates as insoluble Ag granules when exposed to light [74]. Other groups have tried to understand why and where these biophotons are produced [75,76,77].
Some studies have observed biophotons emitted by cell culture or tissue slices. Tumor cells displayed increased photon emissions compared to nonmalignant cells: it is possible to use biophoton emissions as a noninvasive, early-malignancy detection tool, both in vitro and in vivo [78]. Mice synaptosome and brain slice biophoton emissions were used for studying the differences between Alzheimer’s disease and vascular dementia, discovering that communications and the information processing of biophotonic signals in the brain are crucial for advanced cognitive functions [79]
Both in vivo and in vitro studies have been conducted to evaluate the oxidative stress of human skin, which is important for skin cancer prevention [80,81,82].
Many studies have been conducted on Traditional Chinese Medicine (TCM). Recently, Wang and colleagues stated that “the study of the super weak glowing phenomenon of biology and death of people’s thoughts, anger and death process is expected to promote the combination of Chinese and western medicine” [83]. Guo and colleagues proposed studying changes in the ultra-weak luminous intensity of acupuncture points and meridians before and after needling stimulation [84]. Biophoton emission was measured at four sites on the hands of people with type 2 diabetes before treatment and after 1 and 2 weeks of treatment with TCM: the biophoton emission intensity decreased gradually over the course of the treatment [85].
Biophoton emission has been also correlated to mental states. An increase spontaneous human biophoton emission is caused by anger emotional states [51,86]. Stress levels can be detected by making a specific analysis of biophoton emission (in conjunction with other physiological parameters; this kind of assessment is under study for Ukrainian military personnel after frontline service) [87].

6. Future Experimental Upgrade and Perspective

For any experimental apparatus that aims to perform biophotonic measurements, possible improvements involve two approaches: increasing the number of detectors to enhance counts or enhancing the collection capacity. The first approach may be a double-edged sword. Biophotons are an endogenous production of a very small flux of photons, of the order of 100 ph/sec, within an energy range between 200 and 800 nm. Even in the darkest environment, a low background counter could have some spare counts per second. Increasing the number of detectors means increasing the sources of background noise and the covered solid angle, but this last can in practice be increased by a very small percentage, and therefore produce a modest gain in signal-to-noise ratio. In our opinion, enhancing the biophoton measurement capability of an experimental setup would be best achieved by improving its collection capacity. In this section, we introduce and assess various upgrades aimed at increasing the ability to collect luminescence biophotons in a scientific apparatus. Such improvements could also be applied to different apparatuses that aim to make measurements of rare low-background luminescence processes.
A first improvement is the introduction of a Fresnel lens to the apparatus. The Fresnel lens is a “sectioned” convex lens with vertical parallel planes forming concentric rings. Refraction bends the light rays and makes them converge into a single focus. Placing a Fresnel lens in front of the emitting source (germinating plants, for example), luminescence photons can be focused to the counter (distances can be evaluated with a simulation), and thus the geometrical efficiency of the apparatus can be improved up to two orders of magnitude, as shown in Figure 8.
A second improvement would be the building of an integrating sphere made with white Teflon. Teflon reflects more than 99% of the incident light in the visible energy range, so the light originally generated by the sample is reflected many times by the walls and finally reaches the hole where the photomultiplier is housed. In this way, it collects the emission coming from every part of the sample, and it is as if we have increased the solid angle of measurement by certain factors. The integrating sphere can be located inside a black PVC chamber to avoid any light contamination (see the right panel in Figure 8).
The third improvement is the installation of light sources for calibration and validation testing of the experimental setup. Specifically, the best solution would be the installation of two light sources: one emitting coherent light and another emitting incoherent light. This can be of extreme importance as there are many works investigating the coherence state of biophotonic emission; we range from an analysis in terms of a totally chaotic field to those based on the presence of coherent and squeezed states. The introduction of coherent and incoherent light sources in the apparatus can provide a reference to compare the biophoton emission.
So far, we mentioned the upcoming improvements. However, several further improvements may be made. One is the installation of an infrared camera to obtain fundamental information about growing cells. Such an improvement can be tested in lentils, but their chaotic vertical growth may produce an incomplete response collection. In cell cultures, where the layer is uniform, an infrared camera can collect more complete and clean information. Other improvements include the installation of devices and sensors to modify and monitor the temperature inside the chamber, the installation of irradiation systems, and the variation in atmosphere or pH and constituents of the soil of the plants to characterize the spectrometric response of germinating seeds. In this way, the lentil experiment represents a pioneering study on biophotons. In addition to being a valuable source of information concerning plant growth, it also serves as a testing ground for evaluating devices and solutions applicable in the future, extending to the study of biophotons emitted by both healthy and cancerous cell cultures [88,89,90].

7. Conclusions and Suggestions for Future

There is growing interest in the literature in the role that biophotons appear to have in biology, from studies on seeds and plants to those involving humans. In this short review, we essentially presented the results that our group has obtained in the study of seed germination processes, relating them to the results already reported in the literature. We have seen a kind of phase transition during the germination process, highlighted by changes in the complexity patterns (crucial and noncrucial events) and by a different behavior of the spectral components. At the same time, the analysis of the intensity and the shape of the emission in terms of a generalized logistic equation seems to indicate that during the germination period, the parts of the organism involved in the emission process change according to the degree of plant development.
In this contest, the germination process can be thought of as a spontaneous organization of a biological system generating nonequilibrium events and deviations from the dynamical processes of ordinary thermodynamics. The system evolution and the interaction between the different units lead to criticality [41], which therefore emerges directly from the processes of the spontaneous organization of biological systems as a delicate balance between order and disorder.
The idea that biophotons, beyond the molecular mechanisms that generate them, are also a manifestation of the degree of complexity of the system can help us answer the question of how such a small signal can transmit information. This can be achieved using complexity matching theory, which was introduced to extend linear response theory of Kubo from the ordinary condition of thermodynamic equilibrium to the more general condition of perennial nonequilibrium.
All living beings seem to emit biophotons, and this emission is extremely sensitive to the “state” of the organism that is emitting them. Changes in biophoton emission spectra under any type of stress indicate that something is happening in the living system; the changes in pattern complexity may be an indicator of a loss of cellular communication, identified by crucial events [46], signaling a “loss of complexity”, with the disappearance of crucial events, where loss of complexity may be an early sign of disease. From this point of view, biophotons could have a role in establishing links between the units of the complex living system, despite their ultra-weak intensity.
Following this line of thought, we can hypothesize that biophotons are another communication route developed by nature to allow the exchange of information between different cells as well as organisms. If this is true, we can imagine an active role for biophotons in the treatment of various pathologies, cancer, or Alzheimer’s, just to give a few examples, through the development of a system that emits biophotons of the right degree of complexity and intensity and which therefore can be “interpreted” by diseased cells to lead them through a healing process.
It is extremely important to increase the signal-to-noise ratio, and, in this review, we proposed an extremely economical possibility that could open the doors for experiments carried out on single seeds that have a better energy resolution than the one we obtained. We should also mention the possibility of using a CCD camera in experiments with plants and seeds to map the emitting parts as already conducted in the case of human beings.
A lot has been achieved, and perhaps some answers are starting to emerge, but a lot remains to be accomplished. This requires work and imagination, but this is the fun part of the story.

Author Contributions

All authors contributed equally to this review. All authors have read and agreed to the published version of the manuscript.

Funding

We acknowledge support from the Foundational Questions Institute, FQxI, a donor-advised fund of Silicon Valley Community Foundation (grant Nos. FQXi-RFP-CPW-2008 and FQXi-MGB-2011), and from the John Templeton Foundation, Grant 62099. The opinions expressed in this publication are those of the authors and do not necessarily reflect the views of the John Templeton Foundation.

Data Availability Statement

All relevant data are available from the authors upon request.

Acknowledgments

We warmly thank I. H. von Herbing, L. Tonello, and D. Lambert for the conversation we had during the writing of this paper.

Conflicts of Interest

The authors declare no conflicts of interest.

References

  1. Popp, F.A.; Gu, Q.; Li, K.H. Biophoton Emission: Experimental Background and Theoretical Approaches. Mod. Phys. Lett. B 1994, 8, 1269–1296. [Google Scholar] [CrossRef]
  2. Van Wijk, R. Light in Shaping Life: Biophotons in Biology and Medicine; Boekenservice: Almere, The Netherlands, 2014. [Google Scholar]
  3. Mayburov, S.; Volodyaev, I. Photon production and communications in Biological Systems. In Proceedings of the Progress In Electromagnetics Research Symposium Proceedings, Moscow, Russia, 18–21 August 2009; pp. 1937–1941. [Google Scholar]
  4. Gurwitsch, A.G. Die Natur des spezifischen Erregers der Zellteilung. Arch. Entw. Mech. Org. 1923, 100, 11–40. [Google Scholar] [CrossRef]
  5. Reiter, T.; Gabor, D. Ultraviolette Strahlung und Zellteilung; Wiss. Verffentlichungen Aus Dem Siemens-Konzern; Springer: Berlin/Heidelberg, Germany, 1928; p. 184. [Google Scholar]
  6. Colli, L.; Facchini, U. Light Emission by Germinating Plants. Il Nuovo C. 1954, 12, 150–153. [Google Scholar] [CrossRef]
  7. Colli, L.; Facchini, U.; Guidotti, G.; Dugnani Lonati, R.; Orsenigo, M.; Sommariva, O. Further Measurements on the Bioluminescence of the Seedlings. Experientia 1955, 11, 479–481. [Google Scholar] [CrossRef]
  8. Fels, D. Cellular Communication through light. PLoS ONE 2009, 4, e5086. [Google Scholar] [CrossRef]
  9. Mayburov, S.N. Photonic Communications in Biological Systems. J. Samara State Tech. Univ. Ser. Phys. Math. Sci. 2011, 15, 260–265. [Google Scholar]
  10. Kucera, O.; Cifra, M. Cell-to-cell signaling through light: Just a ghost of chance? Cell Commun. Signal. 2013, 11, 87. [Google Scholar] [CrossRef] [PubMed]
  11. Hunt von Herbing, I.; Tonello, L.; Benfatto, M.; Pease, A.; Grigolini, P. Crucial Development: Criticality Is Important to Cell-to-Cell Communication and Information Transfer in Living Systems. Entropy 2021, 23, 1141. [Google Scholar] [CrossRef]
  12. Beloussov, L.V.; Burlakov, A.B.; Louchinskaia, N.N. Biophotonic Pattern of optical interaction between fish eggs and embryos. Indian J. Exp. Biol. 2003, 41, 424–430. [Google Scholar]
  13. Volodyaev, I.; Beloussov, L.V. Revisiting the mitogenetic effect of ultra-weak photon emission. Front. Physiol. 2015, 6, 241. [Google Scholar] [CrossRef]
  14. Gallep, C.M.; Dos Santos, S.R. Photon-count during germination of wheat (Triticum aestivum) in waste water sediment solution correlated with seedling growth. Seed Sci. Technol. 2007, 35, 607–614. [Google Scholar] [CrossRef]
  15. Tessaro, L.W.E.; Dotta, B.T.; Persinger, M.A. Bacterial biophotons as non-local information carriers: Species-specific spectral characteristics of a stress response. Microbiol. Open 2019, 8, e761. [Google Scholar] [CrossRef]
  16. Popp, F.A. Cancer growth and its inhibition in terms of Coherence. Electromagn. Biol. Med. 2009, 28, 53–60. [Google Scholar] [CrossRef]
  17. Benfatto, M.; Pace, E.; Curceanu, C.; Scordo, A.; Clozza, A.; Davoli, I.; Lucci, M.; Francini, R.; De Matteis, F.; Grandi, M.; et al. Biophotons and Emergence of Quantum Coherence—A Diffusion Entropy Analysis. Entropy 2021, 23, 554. [Google Scholar] [CrossRef]
  18. Allegrini, P.; Grigolini, P.; Hamilton, P.; Palatella, L.; Raffaelli, G. Memory beyond memory in heart heating, a sign of a healthy physiological condition. Phys. Rev. E 2002, 65, 041926. [Google Scholar] [CrossRef]
  19. Allegrini, P.; Benci, V.; Grigolini, P.; Hamilton, P.; Ignaccolo, M.; Menconi, G.; Palatella, L.; Raffaelli, G.; Scafetta, N.; Virgilio, M.; et al. Compression and diffusion: A joint approach to detect complexity. Chaos Solitons Fractals 2003, 15, 517–535. [Google Scholar] [CrossRef]
  20. Falconi, M.; Loreto, V.; Vulpiani, A. Kolmogorov Legacy about Entropy; Springer: Berlin/Heidelberg, Germany, 2003; pp. 85–105. [Google Scholar]
  21. Mandelbrot, B.B.; Wallis, J.R. Noah, Joseph, and operational hydrology. Water Resour. Res. 1968, 4, 909–918. [Google Scholar] [CrossRef]
  22. Mancuso, S. The Revolutionary Genius of Plants: A New Understanding of Plant Intelligence and Behaviour; Simon and Shuster: New York, NY, USA, 2018. [Google Scholar]
  23. Mancuso, S.; Viola, A. Brilliant Green: The Surprising History and Science of Plant Intelligence; Island Press: Washington, DC, USA, 2015. [Google Scholar]
  24. Photon Counting Head H12386-210. Available online: https://www.hamamatsu.com/eu/en/product/optical-sensors/pmt/pmt-module/photon-counting-head/H12386-210.html (accessed on 12 June 2024).
  25. Test Sheet Hamamatsu for the Phototube H12386-210, Serial Number 30050260. (This Test Sheet Is Specific for the Phototube We Have Used). Available online: https://www.hamamatsu.com/resources/pdf/etd/H12386_TPMO1073E.pdf (accessed on 12 June 2024).
  26. Saeidfirozeh, H.; Shafiekhani, A.; Cifra, M.; Masoudi, A.A. Endogenous Chemiluminescence from Germinating Arabidopsis thaliana Seeds. Sci. Rep. 2018, 8, 16231. [Google Scholar] [CrossRef]
  27. Benfatto, M.; Pace, E.; Davoli, I.; Francini, R.; De Matteis, F.; Scordo, A.; Clozza, A.; De Paolis, L.; Curceanu, C.; Grigolini, P. Biophotons: New Experimental Data and Analysis. Entropy 2023, 25, 1431. [Google Scholar] [CrossRef]
  28. Verhulst, P.F. Recherches mathmatiques sur la loi d’accroissement de la population. Nouv. Mem. Acad. R. Sci. Brux. 1845, 18, 1–40. [Google Scholar]
  29. Alvermann, M.; Srivastava, Y.N.; Swain, J.; Widom, A. Biological electric fields and rate equations for biophotons. Eur. Biophys. J. 2015, 44, 165–170. [Google Scholar] [CrossRef]
  30. Mahmoodi, K.; West, B.J.; Grigolini, P. Self-organizing Complex Networks: Individual versus global rules. Front. Physiol. 2017, 8, 478. [Google Scholar] [CrossRef]
  31. Volodyaev, I.; van Wijk, E.; Cifra, M.; Vladimirov, Y.A. (Eds.) Ultra-Weak Photon Emission from Biological Systems; Springer International Publishing: Berlin/Heidelberg, Germany, 2023. [Google Scholar]
  32. Cifra, M.; Brouder, C.; Nerudova, M.; Kucera, O. Biophotons, coherence and photo-count statistics: A critical review. J. Lumin. 2015, 164, 38–51. [Google Scholar] [CrossRef]
  33. Loudon, R. The Quantum Theory of Light; Oxford University Press: Oxford, UK, 2000; ISBN 978-0-19-850176-3 (Pbk). [Google Scholar]
  34. Mandel, L.; Wolf, E. Optical Coherence and Quantum Optics; Cambridge University Press: Cambridge, UK, 1995. [Google Scholar]
  35. Latora, V.; Baranger, M. Kolomogorov-Sinai Entropy Rate versus Physical Entropy. Phys. Rev. Lett. 1999, 82, 520. [Google Scholar] [CrossRef]
  36. Scafetta, N.; Hamilton, P.; Grigolini, P. The thermodynamics of social processes: The teen birth phenomenon. Fractals 2001, 9, 193–208. [Google Scholar] [CrossRef]
  37. Scafetta, N.; Grigolini, P. Scaling detection in time series: Diffusion Entropy analysis. Phys. Rev. E 2002, 66, 036130. [Google Scholar] [CrossRef]
  38. Hurst, H.E. Long-term storage capacity of reservoirs. Trans. Am. Soc. Civ. Eng. 1951, 116, 770–799. [Google Scholar] [CrossRef]
  39. Cakir, R.; Grigolini, P.; Krokhin, A.A. Dynamical origin of memory and renewal. Phys. Rev. E 2006, 74, 021108. [Google Scholar] [CrossRef] [PubMed]
  40. Grigolini, P.; Palatella, L.; Raffaelli, G. Anomalous Diffusion: An Efficient Way to Detect Memory in Time Series. Fractals 2001, 9, 439–449. [Google Scholar] [CrossRef]
  41. Grigolini, P. Emergence of biological complexity: Criticality, renewal and memory. Chaos Solitons Fractals 2015, 81, 575–588. [Google Scholar] [CrossRef]
  42. Vanni, F.; Lukovi’c, M.; Grigolini, P. Criticality and Transmission of Information in a Swarm of Cooperative Units. Phys. Rev. Lett. 2011, 107, 078103. [Google Scholar] [CrossRef]
  43. Attanasi, A.; Cavagna, A.; Del Castello, L.; Giardina, I.; Melillo, S.; Parisi, L.; Pohl, O.; Rossaro, B.; Shen, E.; Silvestri, E.; et al. Finite-Size Scaling as a Way to Probe Near-Criticality in Natural Swarms. Phys. Rev. Lett. 2014, 113, 238102. [Google Scholar] [CrossRef]
  44. Bohara, G.; Lambert, D.; West, B.J.; Grigolini, P. Crucial events, randomness and multifractality in heartbeat. Phys. Rev. E 2017, 96, 062216. [Google Scholar] [CrossRef]
  45. West, B.J.; Grigolini, P.; Bologna, M. Crucial Event Rehabilitation Therapy; Springer Briefs in Bioengineering; Springer: Berlin/Heidelberg, Germany, 2023. [Google Scholar]
  46. Culbreth, G.; West, B.J.; Grigolini, P. Entropic Approach to the Detection of Crucial Events. Entropy 2019, 21, 178. [Google Scholar] [CrossRef]
  47. Allegrini, P.; Menicucci, D.; Bedini, R.; Fronzoni, L.; Gemignani, A.; Grigolini, P.; West, B.J.; Paradisi, P. Spontaneous brain activity as a source of ideal 1/f noise. Phys. Rev. E 2009, 80, 061914. [Google Scholar] [CrossRef]
  48. Jelinek, H.F.; Tuladhar, R.; Culbreth, G.; Bohara, G.; Cornforth, D.; West, B.J.; Grigolini, P. Diffusion Entropy versus Multiscale and Renyi Entropy to detect progression of Autonomic Neuropathy. Front. Physiol. 2020, 11, 607324. [Google Scholar] [CrossRef]
  49. Popp, F.A. Electromagnetic Bio-Information, 2nd ed.; Popp, F.A., Becker, G., Konig, H.L., Peschka, W., Hershberger, W., Eds.; Urban & Schwarzenberg: Muchen, Germany, 1989; pp. 144–167. [Google Scholar]
  50. Slawinski, J.; Popp, F.A. Temperature Hysteresis of Low-Level Luminescence from Plants and its Thermodynamical Analysis. J. Plant Physiol. 1987, 130, 111–123. [Google Scholar] [CrossRef]
  51. Slawinski, J.; Ezzahir, A.; Godlewski, M.; Kwiecinska, T.; Rajfur, Z.; Sitko, D.; Wierzuchowska, D. Stress-induced photon emission from perturbed organisms. Experientia 1992, 48, 1041–1058. [Google Scholar] [CrossRef]
  52. Salin, M.L.; Bridges, S.M. Chemiluminescence in Wounded Root Tissue. Plant Physiol. 1981, 67, 43–46. [Google Scholar] [CrossRef]
  53. Winkler, R.; Guttenberger, H.; Klima, H. Ultraweak and Induced Photon Emission after Wounding of Plants. Photochem. Photobiol. 2009, 85, 962–965. [Google Scholar] [CrossRef]
  54. Tudisco, S.; Musumeci, F.; Scordino, A.; Privitera, G. Advanced research equipment for fast ultraweak luminescence analysis. Rev. Sci. Instrum. 2003, 74, 4485–4490. [Google Scholar] [CrossRef]
  55. Scordino, A.; Triglia, A.; Musumeci, F.; Grasso, F.; Rajfur, Z. Influence of the presence of atrazine in water on the in-vivo delayed luminescence of Acetabularia acetabulum. J. Photochem. Photobiol. B Biol. 1996, 32, 11–17. [Google Scholar] [CrossRef]
  56. Brizhik, L.; Scordino, A.; Triglia, A.; Musumeci, F. Delayed luminescence of biological systems arising from correlated many soliton states. Phys. Rev. E 2001, 64, 031902. [Google Scholar] [CrossRef]
  57. Scordino, A.; Grasso, R.; Gulino, M.; Lanzanò, L.; Musumeci, F.; Privitera, G.; Tedesco, M.; Triglia, A.; Brizhik, L. Delayed. luminescence from collagen as arising from soliton and small polaron states. Int. J. Quantum Chem. 2010, 110, 221–229. [Google Scholar] [CrossRef]
  58. Daqing, P. On the stress-induced photon emission from organism: II, how will the stress-transfer kinetics affect the photo-genesis? Appl. Sci. 2020, 2, 1556. [Google Scholar] [CrossRef]
  59. Sarmah, B.; Rajkhowa, R.; Chakraborty, I.; Govindaraju, I.; Dwivedi, S.K.; Mazumder, N.; Baruah, V.J. Precision opto-imaging techniques for seed quality assessment: Prospects and scope of recent advances. In Earth Observation, Remote Sensing in Precision Agriculture; Academic Press: Cambridge, MA, USA, 2024; Chapter 21. [Google Scholar]
  60. Jócsák, I.; Lukács, H.; Varga-Visi, É.; Somfalvi-Tóth, K.; Keszthelyi, S. Identification and investigation of barley powdery mildew (Blumeria graminis f. sp. tritici) infection in winter wheat with conventional stress reactions and non-invasive biophoton emission parameters. J. Biosci. 2024, 49, 6. [Google Scholar]
  61. Lukaács, H.; Joócsaák, I.; Somfalvi-Tóth, K.; Keszthelyi, S. Physiological Responses Manifested by Some Conventional Stress Parameters and Biophoton Emission in Winter Wheat as a Consequence of Cereal Leaf Beetle Infestation. Front. Plant Sci. 2022, 13, 839855. [Google Scholar] [CrossRef]
  62. Jócsák, I.; Malgwi, I.; Rabnecz, G.; Szegő, A.; Varga-Visi, É.; Végvári, G.; Pónya, Z. Effect of cadmium stress on certain physiological parameters, antioxidative enzyme activities and biophoton emission of leaves in barley (Hordeum vulgare L.) seedlings. PLoS ONE 2020, 15, e024470. [Google Scholar] [CrossRef]
  63. Cordeiro, A.C.; Henning, F.A.; Couto, G.H.; Kamikawachi, R.C. Optical analysis of the physiological quality of Triticum aestivum L. seeds with two vigor levels treated with Thiamethoxam. Concilium 2023, 23, 250–263. [Google Scholar] [CrossRef]
  64. Salieres, O.L.H.; Oussedik, S.A.D. Mesure de l’impact de l’eau hydrogéneée H2 sur la germination des graines de Luzerne (Medicago sativa L.). Int. J. Nat. Resour. Environ. 2023, 5, 31–57. [Google Scholar]
  65. Kobayashi, K.; Okabe, H.; Kawano, S.; Hidaka, Y.; Hara, K. Biophoton Emission Induced by Heat Shock. PLoS ONE 2014, 9, e105700. [Google Scholar] [CrossRef]
  66. Mackenzie, A.M.; Smith, H.E.; Mould, R.R.; Bell, J.D.; Nunn, A.V.W.; Botchway, S.W. Rooting out ultraweak photon emission a-mung bean sprouts. J. Photochem. Photobiol. 2024, 19, 100224. [Google Scholar] [CrossRef]
  67. Nematollahi, M.A.; Alinasab, Z.; Nassiri, S.M.; Khaneghah, A.M. Ultra-weak photon emission: A nondestructive detection tool for food quality and safety assessment. Qual. Assur. Saf. 2020, 12, 18–31. [Google Scholar] [CrossRef]
  68. Sekulska-Nalewajko, J.; Gocławski, J.; Korzeniewska, E.; Kiełbasa, P.; Dróżdż, T. The verification of hen egg types by the classification of ultra-weak photon emission data. Expert Syst. Appl. 2023, 238, 122130. [Google Scholar] [CrossRef]
  69. Salières, O. Mesurer le niveau d’émission de biophotons de vins issus de différentes pratiques viti-vinicoles. Laboratoire ENERLAB. 2021. Available online: https://www.chateau-de-la-vieille-chapelle.com/file/Measurements_of_the_level_of_biophoton_emission.pdf (accessed on 12 June 2024).
  70. Sipka, S.; Nagy, A.; Nagy, J.; Nokhoijav, E.; Csősz, É.; Baráth, S. Measurement of chemiluminescence induced by cytochrome c plus hydrogen peroxide to characterize the peroxidase activity of various wines and the Botrytis cinerea related quality of Aszú wines of Tokaj in Hungary. Eur. Food Res. Technol. 2024, 250, 111–118. [Google Scholar] [CrossRef]
  71. Jócsák, I.; Végvári, I.G.; Klász, K.; Andrássy-Baka, G.; Somfalvi-Tóth, K.; Varga-Visi, E. Analytical and bioluminescence-based non-invasive quality assessment of differentially grown strawberry (Fragaria x ananassa Duch. ‘Asia’) during household refrigeration storage. Heliyon 2023, 9, e18358. [Google Scholar] [CrossRef]
  72. Gong, Y.; Yu, L.; Liu, Y.; Zhao, W.; Peng, W.; Nie, X.; Ge, H. Non-destructive detection method for wheat freshness degree based on delayed luminescence. J. Cereal Sci. 2023, 113, 103748. [Google Scholar] [CrossRef]
  73. Vahalová, P.; Havelka, D.; Vaněčková, E.; Zakar, T.; Kolivoška, V.; Cifra, M. Biochemiluminescence sensing of protein oxidation by reactive oxygen species generated by pulsed electric field. Sens. Actuators B Chem. 2023, 385, 133676. [Google Scholar] [CrossRef]
  74. Zangari, A.; Micheli, D.; Galeazzi, R.; Tozzi, A.; Balzano, V.; Bellavia, G.; Caristo, M.E. Photons detected in the active nerve by photographic technique. Sci. Rep. 2021, 11, 3022. [Google Scholar] [CrossRef]
  75. Moro, C.; Valverde, A.; Dole, M.; Hoh Kam, J.; Hamilton, C.; Liebert, A.; Bicknell, B.; Benabid, A.-L.; Magistretti, P.; Mitrofanis, J. The effect of photobiomodulation on the brain during wakefulness and sleep. Front. Neurosci. 2022, 16, 942536. [Google Scholar] [CrossRef]
  76. Moro, C.; Liebert, A.; Hamilton, C.; Pasqual, N.; Jeffery, G.; Stone, J.; Mitrofanis, J. The code of light: Do neurons generate light to communicate and repair? Neural Regen. Res. 2022, 17, 1251–1252. [Google Scholar]
  77. Gillmore, B.; Chevalier, G.; Kasian, S. Resolving Specific Psychological Stressors Can Instantly Reduce or Relieve Chronic Neck Pain and Upper Back Pain: Case Reports. Health 2023, 15, 1116–1149. [Google Scholar] [CrossRef]
  78. Murugan, N.J.; Persinger, M.A.; Karbowski, L.M.; Dotta, B.T. Ultraweak biophoton photon emissions as a non-invasive, early- malignancy detection tool: An in vitro and in vivo study. Cancers 2020, 12, 1001. [Google Scholar] [CrossRef]
  79. Wang, Z.; Xu, Z.; Luo, Y.; Peng, S.; Song, H.; Li, T.; Zheng, J.; Liu, N.; Wu, S.; Zhang, J.; et al. Reduced biophotonic activities and spectral blueshift in Alzheimer’s disease and vascular dementia models with cognitive impairment. Front. Aging Neurosci. 2023, 15, 1208274. [Google Scholar] [CrossRef] [PubMed]
  80. Tsuchida, K.; Iwasa, T.; Kobayashi, M. Imaging of ultraweak photon emission for evaluating the oxidative stress of human skin. J. Photochem. Photobiol. B 2019, 198, 111562. [Google Scholar] [CrossRef]
  81. Tsuchida, K.; Sakiyama, N. Blue light-induced lipid oxidation and the antioxidant property of hypotaurine: Evaluation via measuring ultraweak photon emission. Photochem. Photobiol. Sci. 2023, 22, 345–356. [Google Scholar] [CrossRef]
  82. Tsuchida, K.; Sakiyama, N.; Ogura, Y.; Kobayashi, M. Skin lightness affects ultraviolet A induced oxidative stress: Evaluation using ultraweak photon emission measurement. Exp. Dermatol. 2023, 32, 146–153. [Google Scholar] [CrossRef] [PubMed]
  83. Wang, X.; Zhou, D.; Xu, R.; Chen, L.; Song, X.; Wang, Y. Research on the application of biological ultra-weak luminescence in the medical field. J. Laser Biol. 2022, 31, 289–294. [Google Scholar]
  84. Guo, L.; Guo, Y.; Zhang, G.X.; Zhao, X.W.; Fan, Z.J.; Zhi, M.J.; Li, T.; Wang, F.C. Biological Ultra-weak Luminescence and Its Application to Research of Acupuncture. Zhen Ci Yan Jiu 2018, 43, 384–387. [Google Scholar]
  85. Yang, M.; Zhang, Z.; Fu, J.; Liu, J.; Pang, J.; Fan, H.; Yang, Z.; Zhang, Y.; Han, J. Ultra-weak photon emission as a potential tool for evaluating the therapeutic effect of traditional Chinese medicine in patients with type 2 diabetes. Heliyon 2023, 9, e18055. [Google Scholar] [CrossRef]
  86. Zapata, F.; Pastor-Ruiz, V.; Ortega-Ojeda, F.; Montalvo, G.; García-Ruiz, C. Increment of spontaneous human biophoton emission caused by anger emotional states. Microchem. J. 2021, 169, 106558. [Google Scholar] [CrossRef]
  87. Nevoit, G.V.; Korpan, A.S.; Nastroga, T.V.; Kitura, O.E.; Sokolyuk, N.L.; Lyulka, N.A.; Potiazhenko, M.M. Assessment of the stress and metabolism levels by using electro-photonic emission analysis method in Ukrainian military personnel after frontline service. Актуальні прoблеми сучаснoї медицини: Вісник Українськoї медичнoї стoматoлoгічнoї академії 2023, 23, 46–51. [Google Scholar] [CrossRef]
  88. Murugana, N.M.; Rouleaub, N.; Karbowskic, L.M.; Persingerb, M.A. Biophotonic markers of malignancy: Discriminating cancers using wavelength-specific biophotons. Biochem. Biophys. Rep. 2018, 13, 7–11. [Google Scholar] [CrossRef]
  89. Takeda, M.; Kobayashi, M.; Takayama, M.; Suzuki, S.; Ishida, T.; Ohnuki, K.; Moriya, T.; Ohuchi, N. Biophoton detection as a novel technique for cancer imaging. Cancer Sci. 2004, 95, 656–661. [Google Scholar] [CrossRef]
  90. Takeda, M.; Tanno, Y.; Kobayashi, M.; Usa, M.; Ohuchi, N.; Satomi, S.; Inaba, H. A novel method of assessing carcinoma cell proliferation by biophoton emission. Cancer Lett. 1998, 127, 155–160. [Google Scholar] [CrossRef]
Figure 1. Schematic view of the experimental setup used in our experiment. The germination chamber is built with black PVC to avoid any contamination of light from outside. This figure is a part of Figure 1 in [17].
Applsci 14 05496 g001
Figure 2. Biophoton emission of germinating lentil seeds. In the insert, a comparison between the emission of a single bean (orange curve) with that of lentil seeds (black curve); the two curves are the raw data (count/sec) averaged over one minute. This figure is depicted using the time scale for lentils. The capital letters in the figure indicate the main emission peaks observed in the experimental data.
Applsci 14 05496 g002
Figure 3. Comparison between the biophoton emission of the 76 lentils (red line) with two fits using Equation (4) with J = 1 (blue dashed line) and J = 5 (green line). The experimental data are counts per second averaged over 1 min. The time scale is now the original one used in the raw experimental data presented in Figure 2.
Applsci 14 05496 g003
Figure 4. Comparison between the experimental count probability distribution function (red points) relative to lentil emission with two fits using a Poisson function (solid blue line) and a many-mode thermal function (dashed green line). The emission period is between 20 and 30 h.
Applsci 14 05496 g004
Figure 5. Graphical representation of the algorithm underlying the DEA. The blue line represents the diffusional trajectory in Equation (8), while the red squares are the moving windows. The inset represents a cloud of the various realizations obtained by moving a window of length l and using Equation (12).
Applsci 14 05496 g005
Figure 6. Entropy S(l) as a function of window size l. This plot has a linear-log scale, in accordance with Equation (15). The different curves illustrate S(l) for time series of different lengths obtained using the experimental data from time origin up to L.
Applsci 14 05496 g006
Figure 7. Number of photons emitted during the germination of lentil seeds (violet points). The black lines represent the six different regions used for the DEA. The different spectral components of the signal relating to four spectral windows are also indicated with different colors in the inset at the top of the figure.
Applsci 14 05496 g007
Figure 8. On the left, (a) a schematic view of the apparatus with a Fresnel lens inserted to improve the number of light photons collected by the counter. On the right, (b) a schematic view of the apparatus with an integrative sphere made of white Teflon. The sphere allows the reflection of the light rays, enhancing the collection capability of the apparatus.
Applsci 14 05496 g008
Disclaimer/Publisher’s Note: The statements, opinions and data contained in all publications are solely those of the individual author(s) and contributor(s) and not of MDPI and/or the editor(s). MDPI and/or the editor(s) disclaim responsibility for any injury to people or property resulting from any ideas, methods, instructions or products referred to in the content.