Article

A Preliminary Protocol of Radiographic Image Processing for Quantifying the Severity of Equine Osteoarthritis in the Field: A Model of Bone Spavin

by
Bernard Turek
1,
Marta Borowska
2,*,
Krzysztof Jankowski
3,
Katarzyna Skierbiszewska
1,
Marek Pawlikowski
3,
Tomasz Jasiński
1 and
Małgorzata Domino
1,*
1
Department of Large Animal Diseases and Clinic, Institute of Veterinary Medicine, Warsaw University of Life Sciences (WULS–SGGW), 02-787 Warsaw, Poland
2
Institute of Biomedical Engineering, Faculty of Mechanical Engineering, Białystok University of Technology, 15-351 Bialystok, Poland
3
Institute of Mechanics and Printing, Warsaw University of Technology, 02-524 Warsaw, Poland
*
Authors to whom correspondence should be addressed.
Appl. Sci. 2024, 14(13), 5498; https://doi.org/10.3390/app14135498
Submission received: 30 April 2024 / Revised: 19 June 2024 / Accepted: 21 June 2024 / Published: 25 June 2024
(This article belongs to the Special Issue New Insights into Digital Image Processing and Denoising)

Abstract

:
Osteoarthritis (OA) of the tarsal joint, also known as bone spavin, is a progressive joint disease that increases in severity with age. It is a significant cause of hind limb lameness, leading to a deterioration in the quality of life of horses, particularly in old age. In this study, the tarsal joints of 20 older horses aged 15 to 35 years were radiographically imaged and processed using the computed digital absorptiometry (CDA) method for bone mineral density (BMD) assessment. The radiological signs of bone spavin were scored on a scale ranging from normal (0) to severe OA (3), and the examined joints were grouped according to the severity of OA. The percentage of color pixels (%color pixels), representing successive steps on the scale of X-ray absorption by a density standard, differed between the steps in a BMD characteristic manner for each group. Furthermore, two examined ranges of relative density allowed for the distinction of joints affected by severe OA from other joints, while another two ranges allowed for the differentiation of joints affected by moderate and severe OA from normal joints. The proposed color annotation-assisted decomposition of radiological images based on the CDA protocol shows promise for advancing research on the quantification of radiological signs of OA. This approach could be valuable for monitoring the progression of the disease in older horses.

1. Introduction

Nowadays, as the human population ages at an accelerated pace [1,2], the rise in aging-related diseases is emerging as a significant global concern [2,3,4]. However, it is important to note that aging affects not only the human population but also companion animals, including dogs [5,6], cats [7,8], and horses [9,10,11]. Over recent decades, the role of horses in society has evolved from working animals to performance and companion animals. A survey found that 56.5% of horse owners considered their horse to be a companion animal, with 38.4% even viewing their horse as a family member [9]. Companion animals typically receive better geriatric care compared to working animals, leading to a shift in the demographic structure of the horse population towards an aging one. Consequently, as the number of older horses increases, comprising up to 25–29% of the total horse population [10,12,13], there is a growing need to monitor the progression of age-related diseases in equine medicine [9].
Older individuals, including both humans [2] and animals [14,15], are prone to injuries and degenerative musculoskeletal conditions that significantly impact their quality of life [16,17]. In humans, sarcopenia [3] and osteoarthritis (OA) [18] are recognized as the most prevalent age-related musculoskeletal disorders. Similarly, in horses, OA is a primary cause of lameness [15], often leading to chronic pain and euthanasia in older equines [19]. The parallel occurrence of OA in elderly humans and horses is supported by similarities in pathogenesis, prompting the widespread use of equine models to study OA-related pathological changes [20]. Additionally, apart from naturally occurring OA [21], anatomical and histological resemblances exist between the human knee and tarsal joints and the equine tarsal joint [22,23,24]. In both cases, the thickness and properties of the articular cartilage exhibit striking similarities, enabling the successful modeling of cellular structure and biochemical outcomes [22,23,24]. Moreover, due to their larger body size, horses offer ease of tissue and fluid collection, along with a wide array of imaging modalities and clinical examination possibilities [25,26]. These factors collectively underscore the significance of monitoring OA signs during treatment and rehabilitation in both human [20,21,22,23,24,25,26] and veterinary [23,26,27,28,29,30,31,32,33] medicine. Therefore, this study focuses on enhancing diagnostic strategies for equine tarsal joint OA, commonly referred to as bone spavin [34,35].
The diagnostic approach to equine OA typically begins with assessing clinical symptoms, such as lameness and joint stiffness [28,29,33], which often stem from the mild chronic inflammation associated with OA. Consequently, the diagnostic protocol involves a basic clinical examination and a thorough orthopedic assessment, complemented using flexion tests, local anesthesia, and diagnostic imaging [28,36]. Various imaging modalities may be employed to evaluate the affected joint, including conventional radiography [29,33,36,37], ultrasound [32], computed tomography (CT) [38], magnetic resonance imaging (MRI) [37,39], and, to a lesser extent, positron emission tomography (PET) [40]. These modalities help identify structural changes within the clinically suspected joint [41], such as subchondral bone lysis or sclerosis, joint space alterations, and osteophyte formation [28,29,33,36,37].
However, assessments of bone mineral density (BMD) and its correlation with the progressive loss of muscle mass, strength, and function [42] are less frequently conducted.
BMD evaluation can be performed using X-ray beam attenuation measurements, including single-energy X-ray computed digital absorptiometry (CDA) [43,44,45,46,47,48] or dual-energy X-ray absorptiometry (DXA) [45,47,49]. While DXA is the preferred method in human medicine [50,51,52], its application in equine clinical settings is limited [46,47]. In equine practice, conventional radiography serves as the primary method for the initial diagnostic imaging of bone spavin [53,54]. In the field of veterinary practice, the use of ultrasound to measure the progression of bone lesions is limited due to ultrasound reflection at the bone interface [38]. CT, MRI, and the latest PET imaging require transporting the horse to specialized clinics and are expensive, often necessitating general anesthesia [38,39,40]. Consequently, their availability for routine field monitoring of OA progression is strongly limited. Therefore, developing a BMD assessment via CDA in conventional radiography [43,46,47,48,55,56] represents a promising avenue in equine clinical practice. The CDA technique employs a density standard [48], referred to as aluminum markers [46] or radiographic bone aluminum equivalence (RBAE) [43,47,55,56], for grayscale calibration on radiographs. By comparing the grayscale of the imaged bone with the density standard, indices such as the brightness/darkness index (BDI) [46] or number of pixels (NPs) [48] are quantified, allowing the estimation of BMD.
Just as the CDA method has been employed in equine medicine to evaluate skeletal development in young horses [56], identify periods predisposing to bone disorders [56], predict bone stress injuries [44] and fractures [47], as well as assess teeth resorption and hypercementosis [48], this study aims to preliminarily introduce a BMD assessment via CDA for quantifying the severity of the radiological signs of OA in the context of bone spavin in a simple protocol that can be implemented in the routine field monitoring of disease progression.

2. Materials and Methods

2.1. Study Design

This retrospective, observational, controlled study was conducted on privately owned, warm-blood older horses with a history of long-term under-saddle use. The horses were selected from a population of 72 horses kept in homogeneous environmental conditions for over 2 years housed in the Pegasus Sanctuary for Older Horses.
In this large population of mainly older horses, the goal of screening was to find horses with tarsal joint OA. Considering that taking X-rays in healthy horses is not justified, the horses were pre-examined during a routine screening examination for hind limb lameness. The horses underwent a basic clinical examination and a detailed orthopedic examination following the protocol outlined by Taguchi et al. [57]. Lameness was scored according to the guidelines and scale of the American Association of Equine Practitioners (AAEP) [58], the description of which is summarized here in Table 1. On this basis, 20 out of 72 horses (28%) were considered further.
The sub-population of the 20 pre-selected horses underwent two selection criteria: they were at least 15 years of age and had at least 10 years of riding experience. The data for inclusion were verified based on the horses’ histories and individual identification documents for age determination.
Then, a conventional radiographic examination of the tarsal joint was conducted using an X-ray tube (Orange 9020HF, Ecoray Co., Seoul, Republic of Korea), a radiographic cassette (Saturn 8000, Vieworks Co., Seoul, Republic of Korea), and a portable computer (HP Inc. UK Ltd., Reading, UK). The X-ray tube settings were 1.25 mAs and 60 kV, with an 80 cm distance between the X-ray tube and the radiographic cassette. Each horse underwent two radiographs of the right and two radiographs of the left tarsal joint in the dorsoplantar and lateral medial views. During the radiographic examination, the density standard-based CDA method was employed, following the protocol described for equine teeth radiography [48] and applied to normal tarsal joint radiography [59].
The radiographic signs of bone spavin were scored using a scale based on the findings of Driesang and Böhm [60], Eksell et al. [28], and Denoix [61], as summarized in Table 2. Bone spavin was confirmed when the visible radiographic signs of OA involved the tarsocrural joints (TCJs), distal intertalsal joint (DIJ), proximal intertalsal joint (PIJ), and/or tarsometatarsal joint (TMJ). The structural changes identified using the radiographs in the affected joints included subchondral cyst formation (lucency in the subchondral bone making the joint space appear wider), a local periosteal reaction, collapse of the central and third tarsal bones (osteolytic lesions), ossification of the central and third tarsal bones (sclerosis lesions), bone spur (exostosis, osteophyte, enthesophyte) formation, narrowing of the joint space, and ankylosis (bone fusion between the tarsal bones, which is possible with bony callus bridging the joint) [28,60,61,62]. Exemplary radiographs of scores 0–3 are presented in Figure 1.

2.2. Radiograph Processing

In the CDA method, for each acquired radiograph, the density standard was positioned perpendicular to the surface of a radiographic cassette. The aluminum-produced density standard (92.71–98.92 Atom% of aluminum) is detailed in Górski et al. [48]. The density standard was shaped like an irregular cuboid with 10 steps (S1–S10) decreasing in height. The height, volume, metal density, and radiological relative density measured in Hounsfield units (HUs) are known and are described in detail in Górski et al. [48]. Each radiograph included the imaged area of the tarsal joint and the density standard. The radiographs were acquired using DxWorks software (https://advanced-inst.com/dxworks-2/) (Vieworks Co., Ltd., Seoul, Republic of Korea) as DICOM files.
Materialise’s Interactive Medical Image Control System (MIMICS) software version 14.0 (Materialise HQ, Leuven, Belgium) was used to analyze the attenuation of the X-ray beam passing through the density standard and tarsal joint. The mean relative density of each step (S1–S10) was identified and expressed in HUs (Table 3). Subsequently, each dorsopalmar radiograph was decomposed by masking each relative density range with an assigned color, resulting in ten sub-images, as illustrated in Figure 2. Additionally, the pixels representing the relative density of all steps were masked in white (HEX #FFFFFF) in a separate sub-image to calculate the total number of pixels for a particular radiograph, while the next sub-image displayed all the annotated color pixels. In each sub-image, the corresponding relative density was masked with the appropriate color.

2.3. Radiograph Quantification

The BMD was quantified using the color pixel-counting (CPC) protocol [63]. Each sub-image was resized to 423 pixels wide by 536 pixels high to ensure the visibility of the entire calcaneus and a fragment of the proximal epiphysis of the second, third, and fourth metatarsal bones. Then, each sub-image was saved as a BMP file. If necessary, the background was manually masked using the HEX color #000000 in Paint.NET v.4.3.2 software, ensuring that the entire non-#000000 pixel area represented the tarsal joint. As a result, automatic segmentation was applied without the need for manual image segmentation. The entire tarsal joint was designated as the region of interest (ROI) for pixel counting.
The CPC protocol was applied to the decomposed sub-images using the color histogram method from the extcolors package in Python (https://pypi.org/project/extcolors/, accessed on 11 April 2024). Visual similarity was calculated using the CIE76 Formula (1) in the CIELAB color space, and based on this calculation, the colors were grouped.
∆E* = √((∆L*) + (∆a*) + (∆b*))
The CIELAB color space, denoted as L*a*b*, comprises three components: L* represents the perceptual lightness, while a* and b* represent the colors of vision in the chrome plane (red, green, blue, and yellow). A difference of approximately ∆E* ≈ 2.3 signifies detectable differences in colors [64].
The quantification results were presented as the number of pixels of each color within the non-#000000 ROI segmented on the sub-image. The total count of non-#000000 pixels was determined on the sub-image where the S1–S10 relative density was masked in white. This count was used for each sub-image to calculate the percentage of color-annotated pixels (%color pixels). The results were depicted as a list detailing the most frequently used colors in the sub-image, along with the corresponding number of pixels for each color. The colors were identified using HEX codes from the rgb2hex library (https://colormap.readthedocs.io/en/latest/, accessed on 11 April 2024).

2.4. Statistical Analysis

The scores for the AAEP and radiographic signs of tarsal joint OA were summarized, and individuals were grouped based on the OA severity into four categories: normal tarsal joint (group 0), mild tarsal joint OA (group 1), moderate tarsal joint OA (group 2), and severe tarsal joint OA (group 3). The normality of %color pixels within each group was evaluated with the Kolmogorov–Smirnov test. First, the %color pixels was compared among the steps of the density standard (S1–S10) for each group. Since all data series followed a normal distribution, a one-way ANOVA was applied. Tukey’s multiple comparisons post hoc test was conducted when statistically significant differences between the steps were observed. Tukey’s multiple comparisons post hoc test was again employed when statistically significant differences between the groups were detected. The data are presented on plots as the mean + standard deviation (SD). The statistical significance was set at p < 0.05. The statistical analysis was performed using GraphPad Prism v6 (GraphPad Software Inc., San Diego, CA, USA).

3. Results

In a basic population of 75 horses, 20 horses showed hind limb lameness. Only twenty horses showed clinical signs of hind limb lameness, with AAEP scores ranging from two and four (nine horses scored two, eight horses scored three, and two horses scored four). These horses were pre-selected for further consideration.
The study population comprised eleven mares and nine geldings, ranging in age from 15 to 35 years (mean age 25.7 ± 5.4 years), representing various breeds: thirteen Polish half-bred horses (PHHs), two French trotter horses (FTHs), three Silesian horses (SHs), and two mixed-breed warm-blood (MBW) horses. None of the horses had participated in competitive sports or professional races. However, all had been ridden for at least 10 years. Thus, horses’ under-saddle work was considered leisure work. Radiological signs of OA were observed in 17 out of the 40 examined tarsal joints. The predominant radiological signs included narrowed and irregular joint spaces, the presence of multiple osteophytes, subchondral bone sclerosis, and intra-articular mineralization. Based on the OA scoring system used, twenty-three tarsal joints were classified as healthy (group 0), six with mild OA (group 1), six with moderate OA (group 2), and five with severe OA (group 3). The specific demographics of the included horses, including separate lameness/OA scores for the left and right hind limb/tarsal joint, are summarized in Table 4.
The BMD characteristics of the horses in each group are summarized in Figure 3. In group 0, representing normal tarsal joints, the %color pixels gradually increased from S1 to S9, with no differences observed between S1, S2, S3, and S4, as well as between S3, S4, S5, and S10. Additionally, no differences were found between S6, S7, and S10, as well as between S7 and S8 and S8 and S9 (Figure 3A). In group 1, representing mild tarsal joint OA, the %color pixels similarly gradually increased from S1 to S9, however, with no differences observed between S1, S2, S3, S3, S5, S6, S7, and S10. Moreover, no differences were found between S8 and S9 (Figure 3B). In group 2, representing moderate tarsal joint OA, the %color pixels similarly gradually increased from S1 to S9, however, with no differences observed between S1, S2, S3, S4, S5, and S10. No differences were also found between S2, S3, S4, S5, S6, and S10 as well as between S6, S7, and S10. Additionally, none were found between S7 and S8 as well as between S8 and S9 (Figure 3C). In group 3, representing moderate tarsal joint OA, the %color pixels gradually increased from S3 to S9. No differences were found between S1, S2, S3, S4, and S5, as well as between S1, S2, S4, S5, S6, and S7. Moreover, no differences were found between S6, S7, and S10. However, S8 and S9 differed from the %color pixels for other steps and from each other (Figure 3D). The visualizations of the BMD characteristics in each group are displayed in Figure 4. One may observe that the pixels in a range of different grayscale masked with subsequent colors corresponding to different tissue densities are visible in each sub-image. However, visually determining the variability between group 0 (Figure 4A), group 1 (Figure 4B), group 2 (Figure 4C), and group 3 (Figure 4D) is challenging.
Considering the differences in the BMD between the groups related to OA severity (Figure 5), one can observe that there are no differences between the OA scores for the %color pixels quantified for S1 (Figure 5A), S2 (Figure 5B), S5 (Figure 5E), S6 (Figure 5F), S7 (Figure 5G), and S10 (Figure 5J). However, for S3 (Figure 5C) and S4 (Figure 5D), the %color pixels was lower in group 3 than in the remaining groups. Moreover, for S8 (Figure 5H) and S9 (Figure 5I), the %color pixels was higher in groups 2 and 3 than in group 1.

4. Discussion

Highlighting the key findings of this study, one may observe that the CDA protocol may be successfully implemented for the quantification of BMD on the field conventional radiographs of normal and OA-affected equine tarsal joints. Through the CPC protocol, the individual BMD characteristics of the decomposed sub-images, representing the increasing severity of the radiological signs of bone spavin, were obtained. Comparing these characteristics among the groups that represent different OA severities revealed that two out of the ten examined relative density ranges allowed the differentiation of the joints affected by severe OA from the others, while another two ranges allowed the differentiation of the joints affected by moderate and severe OA from the normal ones. Considering the discussed limitations and potential clinical applications of the proposed preliminary protocol, it can be suggested that the color annotation-assisted radiographic image decomposition using the CDA protocol holds promise for advancing research on quantifying OA radiological signs, aiding in the field disease progression monitoring in older horses.
Bone spavin stands as a prominent cause of hind limb lameness in performance horses [28,29,33,36,37,38,65], with its severity progressively increasing with age [9,12,13,19]. While identifying the tarsal joint as the origin of lameness may be evident in horses with clear clinical signs of tarsal region abnormalities, a comprehensive lameness examination, supported by diagnostic imaging, is advisable in all cases [38]. Typically, the tarsal joint is assessed using ultrasonography, conventional radiography [61], and CT [38], with the latter two modalities enabling qualitative bone assessment. Therefore, advancements in radiological image processing, both in conventional and CT-based modalities, can facilitate the quantitative assessment of bone lesions in the context of bone spavin. Despite the increasing use of equine CT, recent equipment advancements, and modifications allowing for fan-beam CT use in standing sedated horses [66,67], CT examination is still much more expensive than conventional radiographic examination and requires transporting the horse to a reference clinic, limiting the use of CT for the initial monitoring of disease progression in the field. However, CT-based BMD can be successfully used in future scientific research as a cross-validation method.
In the equine tarsal joint, three radiographic rating systems have already been proposed for quantifying OA structural changes [68,69,70]. These systems assign scores based on the appearance and severity of the radiological signs of OA [68,69] or consider the expert consultation process in the Delphi technique [70]. The latter, the most accurate rating system, qualitatively assesses the total extent of the affected DTJ surface, leading to a subjective quantitative assessment of OA severity [70]. In the recent study, the four-point scale concerning no OA, mild OA, moderate OA, and severe OA [70] was also considered in the current research. However, none of the developed rating systems have quantified the severity of the radiographic signs based on BMD. The current study was the first to use a quantitative BMD assessment method using the CDA protocol, which may be used in the field of clinical practice in the future. Labens et al. [70] suggested that a good rating system should consider a scale based on the recognition of selected radiographic signs of OA and the assignment of numeric values. Therefore, this preliminary methodology proposes an easy-to-implement method based on conventional radiography and a free protocol for the quantitative assessment of the BMD of the entire tarsal joint. This study showed that the preliminary protocol used allowed for the detection of severe OA and the differentiation of normal joints from moderate and severe OA. Despite a significant limitation of this study, which is the small sample size, we managed to obtain this promising preliminary result, which will be improved in further studies on a much larger and more diverse population of horses by a combination of the described protocol and image segmentation.
One may observe that the CDA protocol used was based on the automatic segmentation and detection of all pixels in the range of 1009 ± 163 to 2803 ± 147 HU, corresponding to the absorption of the radiation beam by the aluminum density standard [48]. The lower range of relative densities, annotated in yellow, orange, and red for grades S1–S3, fell within the ranges returned for trabecular bone in humans [71] and horses [45,46,47,55,56], while the upper ranges of relative densities, annotated in green and light blue for grades S7–S10, fell within regurgitated compartments for cortical bone in humans [71] and horses [45,46,47,55,56]. In this study, annotations corresponding to S1 and S2 were detectable in the soft tissue projection, suggesting the need for the additional downscaling of the density standard and the consideration of broadening the scales corresponding to radiation beam absorption. However, regardless of the range returned, the present study found a decrease in the number of pixels in the trabecular bone range (red annotated pixels for S3) in severe OA and an increase in the number of pixels in the cortical bone range (navy green annotated pixels for S8; light green annotated pixels for S9) in moderate and severe OA. The obtained results suggest an escalation in bone density with the severity of OA, a trend discernible throughout the entire joint utilizing the proposed protocol. This augmented bone density could stem from the heightened superimposition of the affected bones, encompassing sizable osteophytes, enthesiophytes, intra-articular mineralization, and subchondral bone sclerosis, as delineated in the progression of bone spavin [28,38,60,61,62]. However, in further research, the use of more advantageous imaging modalities and adaptive density standards may allow for better insight into the specific bone composition, which may be more informative for scientific purposes.

4.1. Limitations

The main limitation of this study is the lack of investigation into the relationship between hind limb lameness and the radiological signs of tarsal joint OA. It is important to note that intra-articular analgesia is utilized as a clinical tool to localize the source of lameness and remains the gold standard for diagnosing tarsal joint OA as a cause of lameness [53].
However, in this study, a lameness assessment was only a screening test performed as part of the Sanctuary for Older Horses’ good practice in the routine veterinary examination of maintained horses. A lameness diagnosis using local anesthesia was not continued in these horses due to their free-range housing and the risk of injury after diagnostic analgesia. While radiography of the tarsus is routinely used to demonstrate and monitor changes in clinical cases of OA [53], its use in the current study is justified. Nevertheless, there was no evidence that lameness was related to the radiological signs of OA.
The further limitation of this study primarily results from the small sample size. In previous studies on the equine tarsal joint, three radiographic rating systems were conducted on 54 horses [68], 15 horses [69], and 17 horses [70]. Even though the first studies were more than twice as large and the next two studies used fewer animals than ours, we would like to emphasize that the results of our research should be treated as preliminary. These findings are not intended to be generalized but rather to introduce progress in the quantification methodology. Hence, one of the next steps is to conduct this preliminary protocol on the larger, more diverse equine population covering different ages, housing systems, and geographic locations.
Moreover, the current preliminary methodology requires expansion with subsequent steps of manual or computer-aided segmentation of the individual tarsal joint structures. In this preliminary study, the entire tarsal joint was designated as the ROI for pixel counting. Thus, manual image segmentation was not applied. However, the lack of manual segmentation in the proposed protocol limits its ability to identify the specific level of the tarsal joint and which bones are affected by radiological signs. The radiological signs of OA are primarily visible in the DIJ, less frequently in the PIJ, and occasionally in the TCJ or TMJ [28,29,33,36,37,38,65].
Moreover, the subchondral bone (SCB) thickness pattern showed alterations in painful tarsi relative to the horses’ sport and exercise history, with SCB pattern changes occurring at different locations throughout the tarsal joints as the disease progresses [41]. Thus, addressing bone remodeling in specific tarsal regions is strongly indicated. After demonstrating the feasibility of BMD quantification in the current study, further development of radiographic image processing techniques to quantify OA severity by segmenting individual joint structures is required to avoid oversimplification. Finally, one may postulate that the development of BMD and/or SCB patterns in bone spavin may differ depending on the primary cause of the disease. As bone spavin is a multifactorial disease [28,29,30,32,33,36,37,38,41,53,65,70], it is important to investigate whether any primary cause of tarsal joint OA is related to specific bone patterns. Tarsal joint OA can originate from low-grade chronic inflammation, synovitis, subchondral bone remodeling, and/or articular cartilage degeneration [33]; however, the changes may be caused by trauma, developmental pathologies, infections, overload in the tarsus due to the incomplete ossification of the tarsal bones, overload in the tarsus due to pathologies in other limb regions, the instability of the tarsus caused by intra-articular or extra-articular ligament damage, and instability in other limb regions. Therefore, further research is needed on a much larger group of horses, with precisely diagnosed cases of bone spavin and long-term follow-up to identify the specific locations and patterns related to the disease.

4.2. Further Directions

In a study conducted by our research group on normal cadaverous limbs [59], attempts were made to address the issue of the segmentation of individual tarsal joint structures. The study utilized a scaled pixel-counting protocol to quantify the radiological features of the anatomical structures of the equine normal tarsal joint. This approach allowed for the quantification of the radiological features of joint spaces and bones, enabling the distinction between the lucency of the joint space and the opacity of bone structure [59]. By separately quantifying each bone and joint, this protocol facilitated the differentiation of individual radiographic features. Implementing this approach in further research may potentially enable the differentiation of the individual radiographic signs of OA. Since the sclerosis of subchondral bone, osteophyte/enthesophyte formation, intra-articular mineralization, and joint space narrowing are major radiological signs of bone spavin [29,33,37], further BMD quantification supported by joint space segmentation could significantly enhance the discrimination of OA severity. This hypothesis warrants further investigation in studies involving OA-affected tarsal joints. Combining the color annotation-assisted decomposition of radiological images based on the CDA protocol proposed in this study with manual segmentation, as proposed in previous research, may offer a promising further approach. The potential use of combined protocols in monitoring disease progression holds promise for improving the quality of life and welfare of older horses [9,10,13], which is the long-term goal of this scientific application.
Furthermore, the proposed pixel-counting protocol may introduce computational overheads that could be optimized for efficiency. This progress would require the introduction of computer-aided quantification, such as using artificial intelligence protocols, the implementation of which has begun in the segmentation of equine paranasal sinuses [72]. This would be a very promising and necessary direction of research. Additionally, evaluating the concentration of OA biomarkers in synovial fluid could provide valuable data on cartilage degradation, chondrocyte apoptosis, chondrocyte hypertrophy, subchondral bone sclerosis, inflammation, angiogenesis, pain, and overload [73]. More comprehensive research could shed new light on the pathogenesis of bone spavin. However, this research focused on preliminarily introducing BMD assessment via CDA for quantifying the severity of the radiological signs of OA.

5. Conclusions

The preliminary protocol of BMD quantification on conventional radiographs may be implemented for the evaluation of normal and OA-affected equine tarsal joints. The BMD characteristics differed between the OA-affected groups, allowing for the differentiation of moderate and severe radiological signs of bone spavin when the total joint area is included. The proposed protocol of CDA with the color annotation-assisted decomposition of radiological images seems to be promising for further research on the quantification of radiological signs of OA. Since only old horses were included in the current research, one may suggest that the proposed preliminary protocol may be useful in the field of monitoring the disease’s progression in older horses.

Author Contributions

Conceptualization, B.T. and M.D.; methodology, B.T., M.B., K.J. and M.D.; software, M.B., K.J., M.P. and M.D.; validation, B.T. and T.J.; formal analysis, B.T., M.B., K.J. and M.D.; investigation, B.T., K.S., T.J. and M.D.; resources, B.T., M.B. and M.P.; data curation, B.T; writing—original draft preparation, B.T., K.S., T.J. and M.D.; writing—review and editing, B.T., M.B., K.J., K.S., M.P., T.J. and M.D.; visualization, K.J. and M.D.; supervision, M.D.; project administration, B.T. and M.D. All authors have read and agreed to the published version of the manuscript.

Funding

The study was supported by the Polish Ministry of Science and Higher Education as part of the project WZ/WM–IIB/2/2024.

Institutional Review Board Statement

The research used the results of veterinary clinical examinations which does not fall under the legislation for the protection of animals used for scientific purposes (national decree-law Dz. U. 2015 poz. 266 and European directive 2010-63-EU). No ethical approval was needed.

Informed Consent Statement

Not applicable.

Data Availability Statement

The data presented in this study are available upon request from the corresponding author.

Acknowledgments

The authors would like to express their gratitude to the Pegasus Sanctuary for Older Horses for their cooperation and for sharing the clinical data of the horses under the foundation’s care for this study.

Conflicts of Interest

The authors declare no conflicts of interest.

References

  1. Lutz, W.; Sanderson, W.; Scherbov, S. The coming acceleration of global population ageing. Nature 2008, 451, 716–719. [Google Scholar] [CrossRef]
  2. Li, Z.; Zhang, Z.; Ren, Y.; Wang, Y.; Fang, J.; Yue, H.; Guan, F. Aging and age-related diseases: From mechanisms to therapeutic strategies. Biogerontology 2021, 22, 165–187. [Google Scholar] [CrossRef] [PubMed]
  3. Tarantino, U.; Scimeca, M.; Piccirilli, E.; Tancredi, V.; Baldi, J.; Gasbarra, E.; Bonanno, E. Sarcopenia: A histological and immunohistochemical study on age-related muscle impairment. Aging Clin. Exp. Res. 2015, 27, 51–60. [Google Scholar] [CrossRef]
  4. Visconti, V.V.; Cariati, I.; Fittipaldi, S.; Iundusi, R.; Gasbarra, E.; Tarantino, U.; Botta, A. DNA methylation signatures of bone metabolism in osteoporosis and osteoarthritis aging-related diseases: An updated review. Int. J. Mol. Sci. 2021, 22, 4244. [Google Scholar] [CrossRef] [PubMed]
  5. Fleming, J.M.; Creevy, K.E.; Promislow, D.E.L. Mortality in North American dogs from 1984 to 2004: An investigation into age-, size-, and breed-related causes of death. J. Vet. Intern. Med. 2011, 25, 187–198. [Google Scholar] [CrossRef]
  6. McKenzie, B.A.; Chen, F.L. Assessment and management of declining physical function in aging dogs. Top. Companion Anim. Med. 2022, 51, 100732. [Google Scholar] [CrossRef]
  7. Bellows, J.; Center, S.; Daristotle, L.; Estrada, A.H.; Flickinger, E.A.; Horwitz, D.F.; Shoveller, A.K. Aging in cats: Common physical and functional changes. J. Feline Med. Surg. 2016, 18, 533–550. [Google Scholar] [CrossRef] [PubMed]
  8. Ladiges, W. The unrecognized potential of pet cats for studying aging and age-related diseases. Aging Pathobiol. Ther. 2021, 3, 134. [Google Scholar] [CrossRef]
  9. McGowan, C. Welfare of aged horses. Animals 2011, 1, 366–376. [Google Scholar] [CrossRef]
  10. Malalana, F.; McGowan, T.W.; Ireland, J.L.; Pinchbeck, G.L.; McGowan, C.M. Prevalence of owner-reported ocular problems and veterinary ocular findings in a population of horses aged ≥15 years. Equine Vet. J. 2019, 51, 212–217. [Google Scholar]
  11. Masko, M.; Domino, M.; Skierbiszewska, K.; Zdrojkowski, Ł.; Jasinski, T.; Gajewski, Z. Monitoring of the mare during the perinatal period at the clinic and in the stable. Equine Vet. Educ. 2020, 32, 654–663. [Google Scholar] [CrossRef]
  12. Ireland, J.L. Demographics, Management, Preventive Health Care and Disease in Aged Horses. Vet. Clin. N. Am. Equine Pract. 2016, 32, 195–214. [Google Scholar] [CrossRef]
  13. Welsh, C.E.; Duz, M.; Parkin, T.D.H.; Marshall, J.F. Prevalence, survival analysis and multimorbidity of chronic diseases in the general veterinarian-attended horse population of the UK. Prev. Vet. Med. 2016, 131, 137–145. [Google Scholar] [CrossRef]
  14. Innes, J.F.; Clegg, P. Comparative rheumatology: What can be learnt from naturally occurring musculoskeletal disorders in domestic animals? Rheumatology 2010, 49, 1030–1039. [Google Scholar] [CrossRef] [PubMed]
  15. Van Weeren, P.R.; Back, W. Musculoskeletal disease in aged horses and its management. Vet. Clin. N. Am. Equine Pract. 2016, 32, 229–247. [Google Scholar] [CrossRef] [PubMed]
  16. Vos, T.; Barber, R.M.; Bell, B.; Bertozzi-Villa, A.; Biryukov, S.; Bolliger, I.; Brugha, T.S. Global, regional, and national incidence, prevalence, and years lived with disability for 301 acute and chronic diseases and injuries in 188 countries, 1990–2013: A systematic analysis for the Global Burden of Disease Study 2013. Lancet 2015, 386, 743–800. [Google Scholar] [CrossRef]
  17. Long, M.; Dürnberger, C.; Jenner, F.; Kelemen, Z.; Auer, U.; Grimm, H. Quality of Life within Horse Welfare Assessment Tools: Informing Decisions for Chronically Ill and Geriatric Horses. Animals 2022, 12, 1822. [Google Scholar] [CrossRef]
  18. Grote, C.; Reinhardt, D.; Zhang, M.; Wang, J. Regulatory mechanisms and clinical manifestations of musculoskeletal aging. J. Orthopaed. Res. 2019, 37, 1475–1488. [Google Scholar] [CrossRef]
  19. Ireland, J.L.; Clegg, P.D.; McGowan, C.M. Factors associated with mortality of geriatric horses in the United Kingdom. Prev. Vet. Med. 2011, 101, 204–218. [Google Scholar] [CrossRef]
  20. Cope, P.J.; Ourradi, K.; Li, Y.; Sharif, M. Models of osteoarthritis: The good, the bad and the promising. Osteoarthr. Cartil. 2019, 27, 230–239. [Google Scholar] [CrossRef]
  21. Gregory, M.H.; Capito, N.; Kuroki, K.; Stoker, A.M.; Cook, J.L.; Sherman, S.L. A review of translational animal models for knee osteoarthritis. Arthritis 2012, 2012, 764621. [Google Scholar] [CrossRef] [PubMed]
  22. Frisbie, D.D.; Cross, M.W.; McIlwraith, C.W. A comparative study of articular cartilage thickness in the stifle of animal species used in human pre-clinical studies compared to articular cartilage thickness in the human knee. Vet. Comp. Orthop. Traumatol. 2006, 19, 142–146. [Google Scholar] [CrossRef] [PubMed]
  23. Malda, J.; Benders, K.E.; Klein, T.J.; de Grauw, J.C.; Kik, M.J.; Hutmacher, D.W. Comparative study of depth-dependent characteristics of equine and human osteochondral tissue from the medial and lateral femoral condyles. Osteoarthr. Cartil. 2012, 20, 1147–1151. [Google Scholar] [CrossRef] [PubMed]
  24. Kuyinu, E.L.; Narayanan, G.; Nair, L.S.; Laurencin, C.T. Animal models of osteoarthritis: Classification, update, and measurement of outcomes. J. Orthop. Surg. Res. 2016, 11, 19. [Google Scholar] [CrossRef] [PubMed]
  25. Little, C.B.; Zaki, S. What constitutes an “animal model of osteoarthritis”—The need for consensus? Osteoarthr. Cartil. 2012, 20, 261–267. [Google Scholar] [CrossRef] [PubMed]
  26. Strauss, E.J.; Goodrich, L.R.; Chen, C.T.; Hidaka, C.; Nixon, A.J. Biochemical and biomechanical properties of lesion and adjacent articular cartilage after chondral defect repair in anequine model. Am. J. Sports Med. 2005, 33, 1647–1653. [Google Scholar] [CrossRef] [PubMed]
  27. McIlwraith, C.W.; Van Sickle, D.C. Experimentally induced arthritis of the equine carpus: Histologic and histochemical changes in the articular cartilage. Am. J. Vet. Res. 1981, 42, 209–217. [Google Scholar] [PubMed]
  28. Eksell, P.; Axelsson, M.; Broström, H.; Ronéus, B.; Hägg-ström, J.; Carlsten, J. Prevalence and risk factors of bone spavin in Icelandic horses in Sweden: A radiographic field study. Acta Vet. Scand. 1998, 39, 339–348. [Google Scholar] [CrossRef] [PubMed]
  29. Baxter, G.M.; Southwood, L.L.; Dechant, J.E. Diagnosis of distal tarsal osteoarthritis in horses. Comp. Cont. Ed. Pract. Vet. 2003, 2, 138–147. [Google Scholar]
  30. Bolam, C.J.; Hurtig, M.B.; Cruz, A.; McEwen, B.J. Characterization of experimentally induced post-traumatic osteoarthritis in the medial femorotibial joint of horses. Am. J. Vet. Res. 2006, 67, 433–447. [Google Scholar] [CrossRef]
  31. De Grauw, J.C.; van de Lest, C.H.; Brama, P.A.; Rambags, B.P.; van Weeren, P.R. In Vivo effects of meloxicam on inflammatory mediators, MMP activity and cartilage biomarkers in equine joints with acute synovitis. Equine Vet. J. 2009, 41, 693–699. [Google Scholar] [CrossRef]
  32. Bertoni, L.; Jacquet-Guibon, S.; Branly, T.; Legendre, F.; Desancé, M.; Mespoulhes, C.; Audigié, F. An experimentally induced osteoarthritis model in horses performed on both metacarpophalangeal and metatarsophalangeal joints: Technical, clinical, imaging, biochemical, macroscopic and microscopic characterization. PLoS ONE 2020, 15, e0235251. [Google Scholar] [CrossRef] [PubMed]
  33. Coppelman, E.B.; David, F.H.; Tóth, F.; Ernst, N.S.; Trumble, T.N. The association between collagen and bone biomarkers and radiographic osteoarthritis in the distal tarsal joints of horses. Equine Vet. J. 2020, 52, 391–398. [Google Scholar] [CrossRef]
  34. Carmalt, J.L.; Bell, C.D.; Panizzi, L.; Wolker, R.R.; Lanovaz, J.L.; Bracamonte, J.L.; Wilson, D.G. Alcohol-facilitated ankylosis of the distal intertarsal and tarsometatarsal joints in horses with osteoarthritis. J. Am. Vet. Med. Assoc. 2012, 240, 199–204. [Google Scholar] [CrossRef]
  35. Lamas, L.P.; Edmonds, J.; Hodge, W.; Zamora-Vera, L.; Burford, J.; Coomer, R.; Munroe, G. Use of ethanol in the treatment of distal tarsal joint osteoarthritis: 24 cases. Equine Vet. J. 2012, 44, 399–403. [Google Scholar] [CrossRef] [PubMed]
  36. Björnsdóttir, S.; Axelsson, M.; Eksell, P.; Sigurdsson, H.; Carlsten, J. Radiographic and clinical survey of degenerative joint disease in the distal tarsal joints in Icelandic horses. Equine Vet. J. 2000, 32, 268–272. [Google Scholar] [CrossRef] [PubMed]
  37. Ley, C.J.; Björnsdóttir, S.; Ekman, S.; Boyde, A.; Hans-son, K. Detection of early osteoarthritis in the centrodistal joints of I celandic horses: Evaluation of radiography and low-field magnetic resonance imaging. Equine Vet. J. 2016, 48, 57–64. [Google Scholar] [CrossRef] [PubMed]
  38. Raes, E.; Bergman, H.J.; Van Ryssen, B.; Vanderperren, K.; Stock, E.; Saunders, J.H. Computed tomographic features of lesions detected in horses with tarsal lameness. Equine Vet. J. 2014, 46, 189–193. [Google Scholar] [CrossRef]
  39. Biggi, M.; Dyson, S.J. Use of high-field and low-field magnetic resonance imaging to describe the anatomy of the proximal portion of the tarsal region of nonlame horses. Am. J. Vet. Res. 2018, 79, 299–310. [Google Scholar] [CrossRef] [PubMed]
  40. Espinosa-Mur, P.; Spriet, M.; Manso-Diaz, G.; Arndt, S.; Perez-Nogues, M.; Lopez-San Roman, J.; Galuppo, L.D. 18F-sodium fluoride positron emission tomography provides pertinent additional information to computed tomography for assessment and management of tarsal pain in horses. J. Am. Vet. Med. Assoc. 2023, 261, 1638–1645. [Google Scholar] [CrossRef]
  41. Branch, M.V.; Murray, R.C.; Dyson, S.J.; Goodship, A.E. Alteration of distal tarsal subchondral bone thickness pattern in horses with tarsal pain. Equine Vet. J. 2023, 39, 101–105. [Google Scholar] [CrossRef]
  42. St George, L.B.; Spoormakers, T.J.; Smit, I.H.; Hobbs, S.J.; Clayton, H.M.; Roy, S.H.; Serra Bragança, F.M. Adaptations in equine appendicular muscle activity and movement occur during induced fore-and hindlimb lameness: An electromyographic and kinematic evaluation. Front. Vet. Sci. 2022, 9, 989522. [Google Scholar] [CrossRef]
  43. Bell, R.A.; Nielsen, B.D.; Waite, K.; Rosenstein, D.; Orth, M. Daily access to pasture turnout prevents loss of mineral in the third metacarpus of Arabian weanlings. J. Anim. Sci. 2001, 79, 1142–1150. [Google Scholar] [CrossRef]
  44. Firth, E.C.; Rogers, C.W. Musculoskeletal responses of 2–year–old Thoroughbred horses to early training. 7. Bone and articular cartilage response in the carpus. N. Z. Vet. J. 2005, 53, 113–122. [Google Scholar] [CrossRef]
  45. Vaccaro, C.; Busetto, R.; Bernardini, D.; Anselmi, C.; Zotti, A. Accuracy and precision of computer–assisted analysis of bone density via conventional and digital radiography in relation to dual–energy X–ray absorptiometry. Am. J. Vet. Res. 2012, 73, 381–384. [Google Scholar] [CrossRef]
  46. Bowen, A.J.; Burd, M.A.; Craig, J.J.; Craig, M. Radiographic calibration for analysis of bone mineral density of the equine third metacarpal bone. J. Equine Vet. Sci. 2013, 33, 1131–1135. [Google Scholar] [CrossRef]
  47. Yamada, K.; Sato, F.; Higuchi, T.; Nishihara, K.; Kayano, M.; Sasaki, N.; Nambo, Y. Experimental investigation of bone mineral density in Thoroughbreds using quantitative computed tomography. J. Equine Sci. 2015, 26, 81–87. [Google Scholar] [CrossRef]
  48. Górski, K.; Borowska, M.; Turek, B.; Pawlikowski, M.; Jankowski, K.; Bereznowski, A.; Polkowska, I.; Domino, M. An application of the density standard and scaled–pixel–counting protocol to assess the radiodensity of equine incisor teeth affected by resorption and hypercementosis: Preliminary advancement in dental radiography. BMC Vet. Res. 2023, 19, 116. [Google Scholar] [CrossRef]
  49. McClure, S.R.; Glickman, L.T.; Glickman, N.W.; Weaver, C.M. Evaluation of dual energy x–ray absorptiometry for in situ measurement of bone mineral density of equine metacarpi. Am. J. Vet. Res. 2001, 62, 752–756. [Google Scholar] [CrossRef] [PubMed]
  50. El Maghraoui, A.; Roux, C. DXA scanning in clinical practice. QJM 2008, 101, 605–617. [Google Scholar] [PubMed]
  51. Johnson, T.R. Dual–energy CT: General principles. Am. J. Roentgenol. 2012, 199, S3–S8. [Google Scholar] [CrossRef]
  52. Ulivieri, F.M.; Rinaudo, L. Beyond bone mineral density: A new dual X–ray absorptiometry index of bone strength to predict fragility fractures, the bone strain index. Front. Med. 2021, 7, 590139. [Google Scholar] [CrossRef]
  53. Byam-Cook, K.L.; Singer, E.R. Is there a relationship between clinical presentation, diagnostic and radiographic findings and outcome in horses with osteoarthritis of the small tarsal joints? Equine Vet. J. 2009, 41, 118–123. [Google Scholar] [CrossRef]
  54. Ramos, S.; Pinto, A.; Cardoso, M.; Alexandre, N.; Bettencourt, E.; Monteiro, S.; Gama, L.T. Prevalence of Radiographic Signs of Osteoarthritis in Lusitano Purebred Horses. J. Equine Vet. Sci. 2020, 94, 103196. [Google Scholar] [CrossRef]
  55. Kobayashi, M.; Ando, K.; Kaneko, M.; Inoue, Y.; Asai, Y.; Taniyama, H. Measurement of equine bone mineral content by radiographic absorptiometry using CR and ortho systems. J. Equine Sci. 2006, 17, 105–112. [Google Scholar] [CrossRef]
  56. Kobayashi, M.; Ando, K.; Kaneko, M.; Inoue, Y.; Asai, Y.; Taniyama, H. Clinical usefulness of the measurement of bone mineral content by radiographic absorptiometry in the young thoroughbred. J. Equine Sci. 2007, 18, 99–106. [Google Scholar] [CrossRef]
  57. Taguchi, T.; Morales Yniguez, F.J.; Takawira, C.; Andrews, F.M.; Lopez, M.J. Agmatine Administration Effects on Equine Gastric Ulceration and Lameness. J. Clin. Med. 2022, 11, 7283. [Google Scholar] [CrossRef]
  58. American Association of Equine Practitioners. LAMENESS EXAMS: Evaluating the Lame Horse. Available online: https://aaep.org/horsehealth/lameness-exams-evaluating-lame-horse (accessed on 15 October 2023).
  59. Borowska, M.; Turek, B.; Lipowicz, P.; Jasiński, T.; Skierbiszewska, K.; Domino, M. The quantification of the radiological features of osteoarthritis using scaled–pixel–counting protocol on the model of spavin in the horse’s tarsal joint. In Proceedings of the 33rd Polish Conference on Biocybernetics and Biomedical Engineering, Łódź, Polska, 27–29 September 2023; p. 109. [Google Scholar]
  60. Driesang, I.; Böhm, D. Spavin in horses--clinical, radiological and scintigraphic findings. Tierarztl. Prax. 1993, 21, 141–148. [Google Scholar]
  61. Denoix, J.M. Imaging the hock. J. Equine Vet. Sci. 2000, 20, 713. [Google Scholar]
  62. Ross, M.W.; Dyson, S.J. Diagnosis and Management of Lameness in the Horse; Elsevier Health Sciences: Philadelphia, PA, USA, 2010; pp. 59–60. [Google Scholar]
  63. Maśko, M.; Borowska, M.; Sikorska, U.; Ciesielska, A.; Zdrojkowski, Ł.; Domino, M. Quantification of the Area of the Highest Temperature in Equine Infrared Images. Appl. Sci. 2023, 13, 11006. [Google Scholar] [CrossRef]
  64. Sharma, G.; Bala, R. Digital Color Imaging Handbook; CRC Press: Boca Raton, FL, USA, 2017; ISBN 978-1-351-83597-8. [Google Scholar]
  65. Labens, R.; Voûte, L.C.; Mellor, D.J. Retrospective study of the effect of intra-articular treatment of osteoarthritis of the distal tarsal joints in 51 horses. Vet. Rec. 2007, 161, 611–616. [Google Scholar] [CrossRef]
  66. Brounts, S.H.; Henry, T.; Lund, J.R.; Whitton, R.C.; Ergun, D.L.; Muir, P. Use of a novel helical fan beam imaging system for computed tomography of the head and neck in sedated standing horses: 120 cases (2019–2020). J. Am. Vet. Med. Assoc. 2022, 260, 1361–1368. [Google Scholar] [CrossRef] [PubMed]
  67. Stieger-Vanegas, S.M.; Hanna, A.L. The role of computed tomography in imaging non-neurologic disorders of the head in equine patients. Front. Vet. Sci. 2022, 9, 798216. [Google Scholar] [CrossRef]
  68. Dechant, J.E.; Baxter, G.M.; Southwood, L.L.; Crawford, W.H.; Jackman, B.R.; Stashak, T.S.; Trotter, G.W.; Hendrickson, D.A. Use of a three-drill-tract technique for arthrodesis of the distal tarsal joints in horses with distal tarsal osteoarthritis: 54 cases (1990–1999). J. Am. Vet. Med. Assoc. 2003, 223, 1800–1805. [Google Scholar] [CrossRef]
  69. Zubrod, C.J.; Schneider, R.K.; Hague, B.A.; Ragle, C.A.; Gavin, P.R.; Kawcak, C.E. Comparison of three methods for arthrodesis of the distal intertarsal and tarsometatarsal joints in horses. Vet. Surg. 2005, 34, 372–382. [Google Scholar] [CrossRef]
  70. Labens, R.; Innocent, G.T.; Voûte, L.C. Reliability of a quantitative rating scale for assessment of horses with distal tarsal osteoarthritis. Vet. Radiol. Ultrasound 2007, 48, 204–211. [Google Scholar] [CrossRef]
  71. Chougule, V.N.; Mulay, A.; Ahuja, B.B. Clinical case study: Spine modeling for minimum invasive spine surgeries (MISS) using rapid prototyping. Bone 2018, 226, 3071. [Google Scholar]
  72. Borowska, M.; Lipowicz, P.; Daunoravičienė, K.; Turek, B.; Jasiński, T.; Pauk, J.; Domino, M. Three-Dimensional Segmentation of Equine Paranasal Sinuses in Multidetector Computed Tomography Datasets: Preliminary Morphometric Assessment Assisted with Clustering Analysis. Sensors 2024, 24, 3538. [Google Scholar] [CrossRef] [PubMed]
  73. Jasiński, T.; Turek, B.; Kaczorowski, M.; Brehm, W.; Skierbiszewska, K.; Bonecka, J.; Domino, M. Equine Models of Temporomandibular Joint Osteoarthritis: A Review of Feasibility, Biomarkers, and Molecular Signaling. Biomedicines 2024, 12, 542. [Google Scholar] [CrossRef]
Figure 1. Exemplary dorsopalmar radiographs of the equine tarsal joint and density standard scored as (A) normal, (B) mild OA, (C) moderate OA, and (D) severe OA.
Applsci 14 05498 g001
Figure 2. Exemplary dorsopalmar view radiographs of the tarsal joint decomposited to ten sub-images related to the relative density of the ten steps (S1–S10) of the density standard. (A) S1 relative density masked in yellow, (B) S2 relative density masked in orange, (C) S3 relative density masked in red, (D) S4 relative density masked in light purple, (E) S5 relative density masked in dark purple, (F) S6 relative density masked in dark blue, (G) S7 relative density masked in dark green, (H) S8 relative density masked in navy green, (I) S9 relative density masked in light green, (J) S10 relative density masked in light blue, (K) S1–S10 relative density masked in white, (L) S1–S10 relative density masked in annotated colors with the density standard displayed.
Applsci 14 05498 g002
Figure 3. The %color pixels of (A) the normal tarsal joint (group 0), (B) mild tarsal joint osteoarthritis (OA) (group 1), (C) moderate tarsal joint OA (group 2), and (D) severe tarsal joint OA (group 3). The data for each step of the density standard (S1–S10) are presented in the bar graph mean + SD. The lowercase letters indicate the differences between the steps. The significance level was established as p < 0.05.
Applsci 14 05498 g003
Figure 4. Exemplary dorsopalmar view radiographs of four tarsal joints decomposited to ten sub-images related to the relative density of the ten steps (S1–S10) of the density standard. (A) The tarsal joint in group 0 represents the normal joint, (B) the tarsal joint in group 1 represents mild osteoarthritis (OA), (C) the tarsal joint in group 2 represents moderate OA, and (D) the tarsal joint in group 3 represents severe OA.
Applsci 14 05498 g004
Figure 5. The %color pixels for each step of the density standard are presented as follows: (A) S1, (B) S2, (C) S3, (D) S4, (E) S5, (F) S6, (G) S7, (H) S8, (I) S9, and (J) S10. The data are compared between the groups, representing the severity of tarsal joint osteoarthritis (OA). Group 0 represents the normal tarsal joint, group 1 represents mild tarsal joint OA, group 2 represents moderate tarsal joint OA, and group 3 represents severe tarsal joint OA. The data for each group are presented in the bar graph mean + SD. The lowercase letters indicate the differences between the steps. The black points represent single individuals. The significance level was established as p < 0.05.
Applsci 14 05498 g005
Table 1. The scale used for grading the clinical symptoms of lameness summarized based on the AAEP guidelines [58].
GradeClinical Symptoms
0Lameness that is not perceptible
1Lameness that is difficult to observe regardless of the circumstances
2Lameness that is difficult to observe at a walk; lameness that is difficult to observe when trotting in a straight line; lameness that is observable when trotting in a circle, on an incline, on a hard surface, or under weight-carrying conditions
3Lameness that is observable at a trot regardless of the circumstances
4Lameness that is observable at a walk
5Lameness that is strongly observable at a walk; minimal weight bearing in motion and/or at rest or a complete inability to move
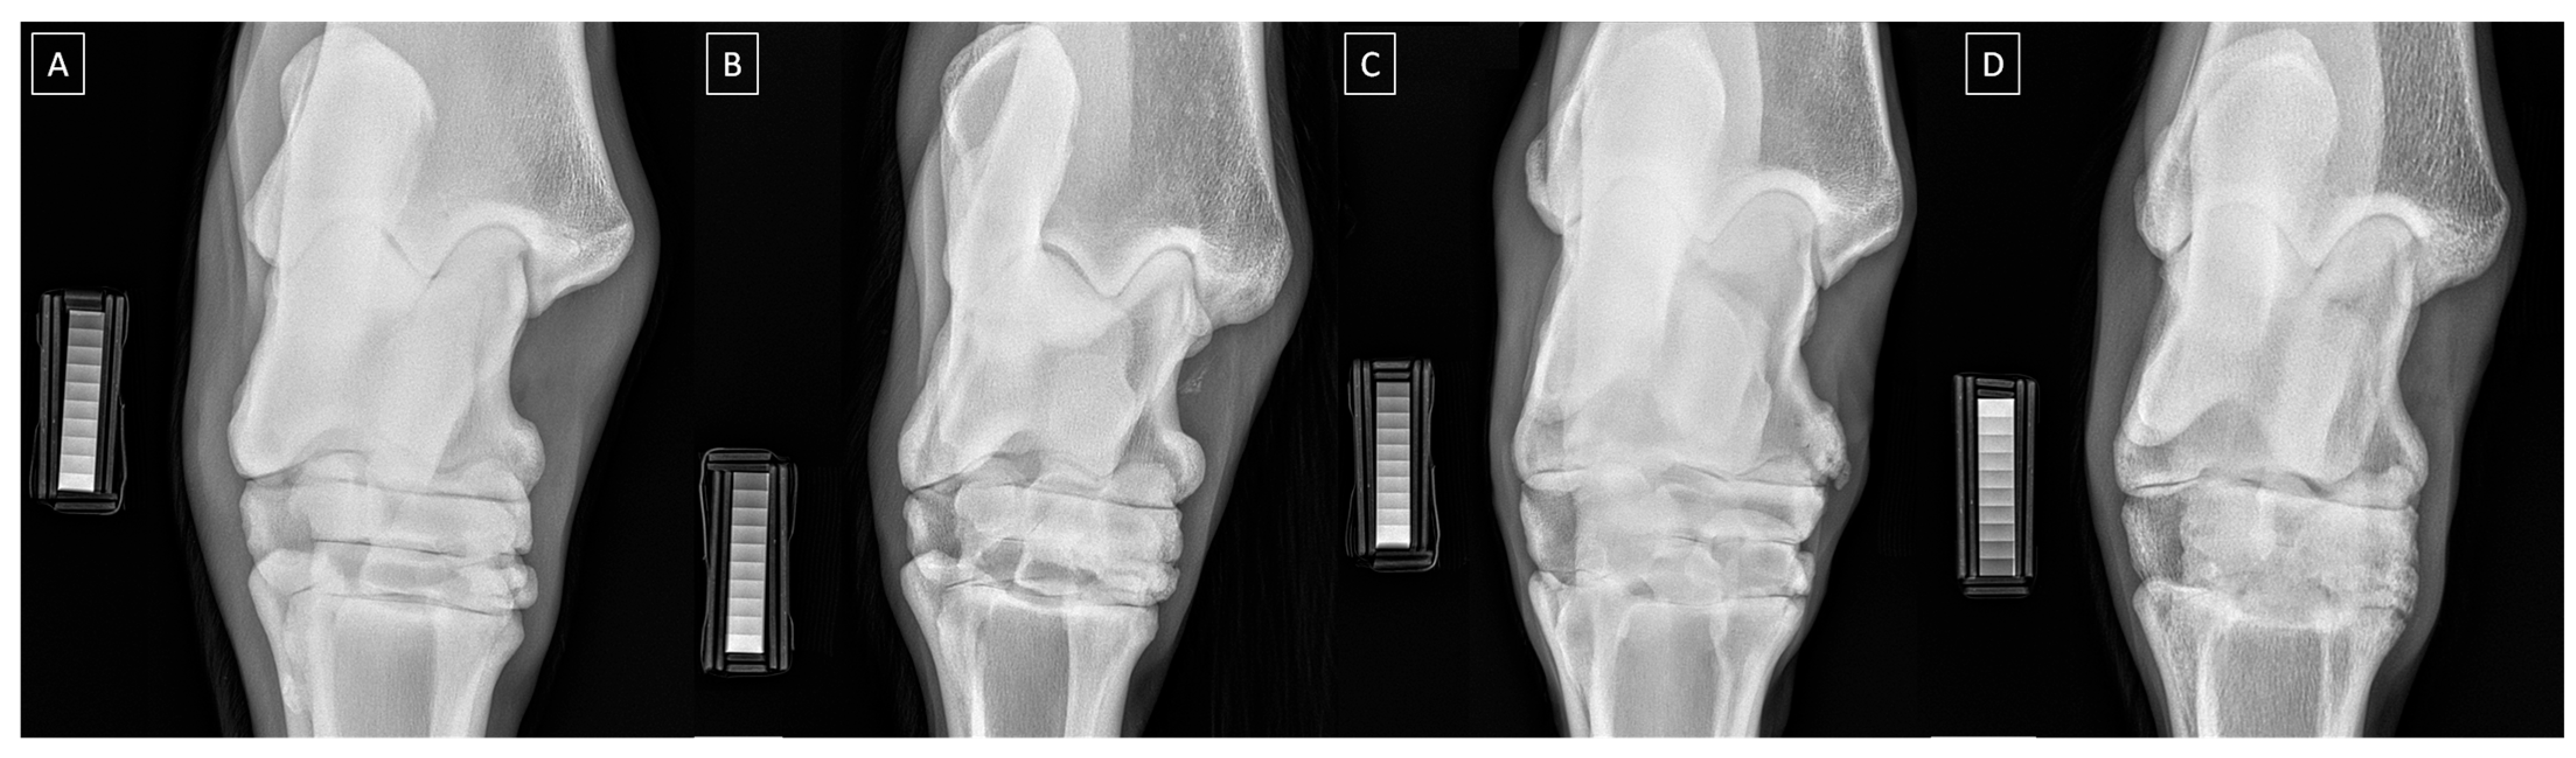
Table 2. The scale used for grading the radiographic signs of tarsal joint osteoarthritis (OA) summarized based on the descriptions of previously published radiographic signs [28,60,61,62].
GradeSeverityRadiographic Signs
0NormalNormal width and shape of the joint space; smooth cortical bone surface; normal subchondral bone pattern; no periosteal proliferation; no intra-articular mineralization
1MildNarrow and irregular joint space with osteophytes; irregular cortical bone surface with well-defined protuberance; smooth subchondral bone pattern; flat periosteal proliferation; mild intra-articular mineralization
2ModerateNarrow and irregular joint space with multiple osteophytes, enthesiophytes, and marked asymmetry; irregular cortical bone surface with well-defined bone proliferation; subchondral bone cyst; flat periosteal proliferation; moderate intra-articular mineralization
3SevereCompletely narrow joint space with large osteophytes and enthesiophytes; severe deformation of cortical bone surface; subchondral bone sclerosis; flat or intense periosteal proliferation; severe intra-articular mineralization
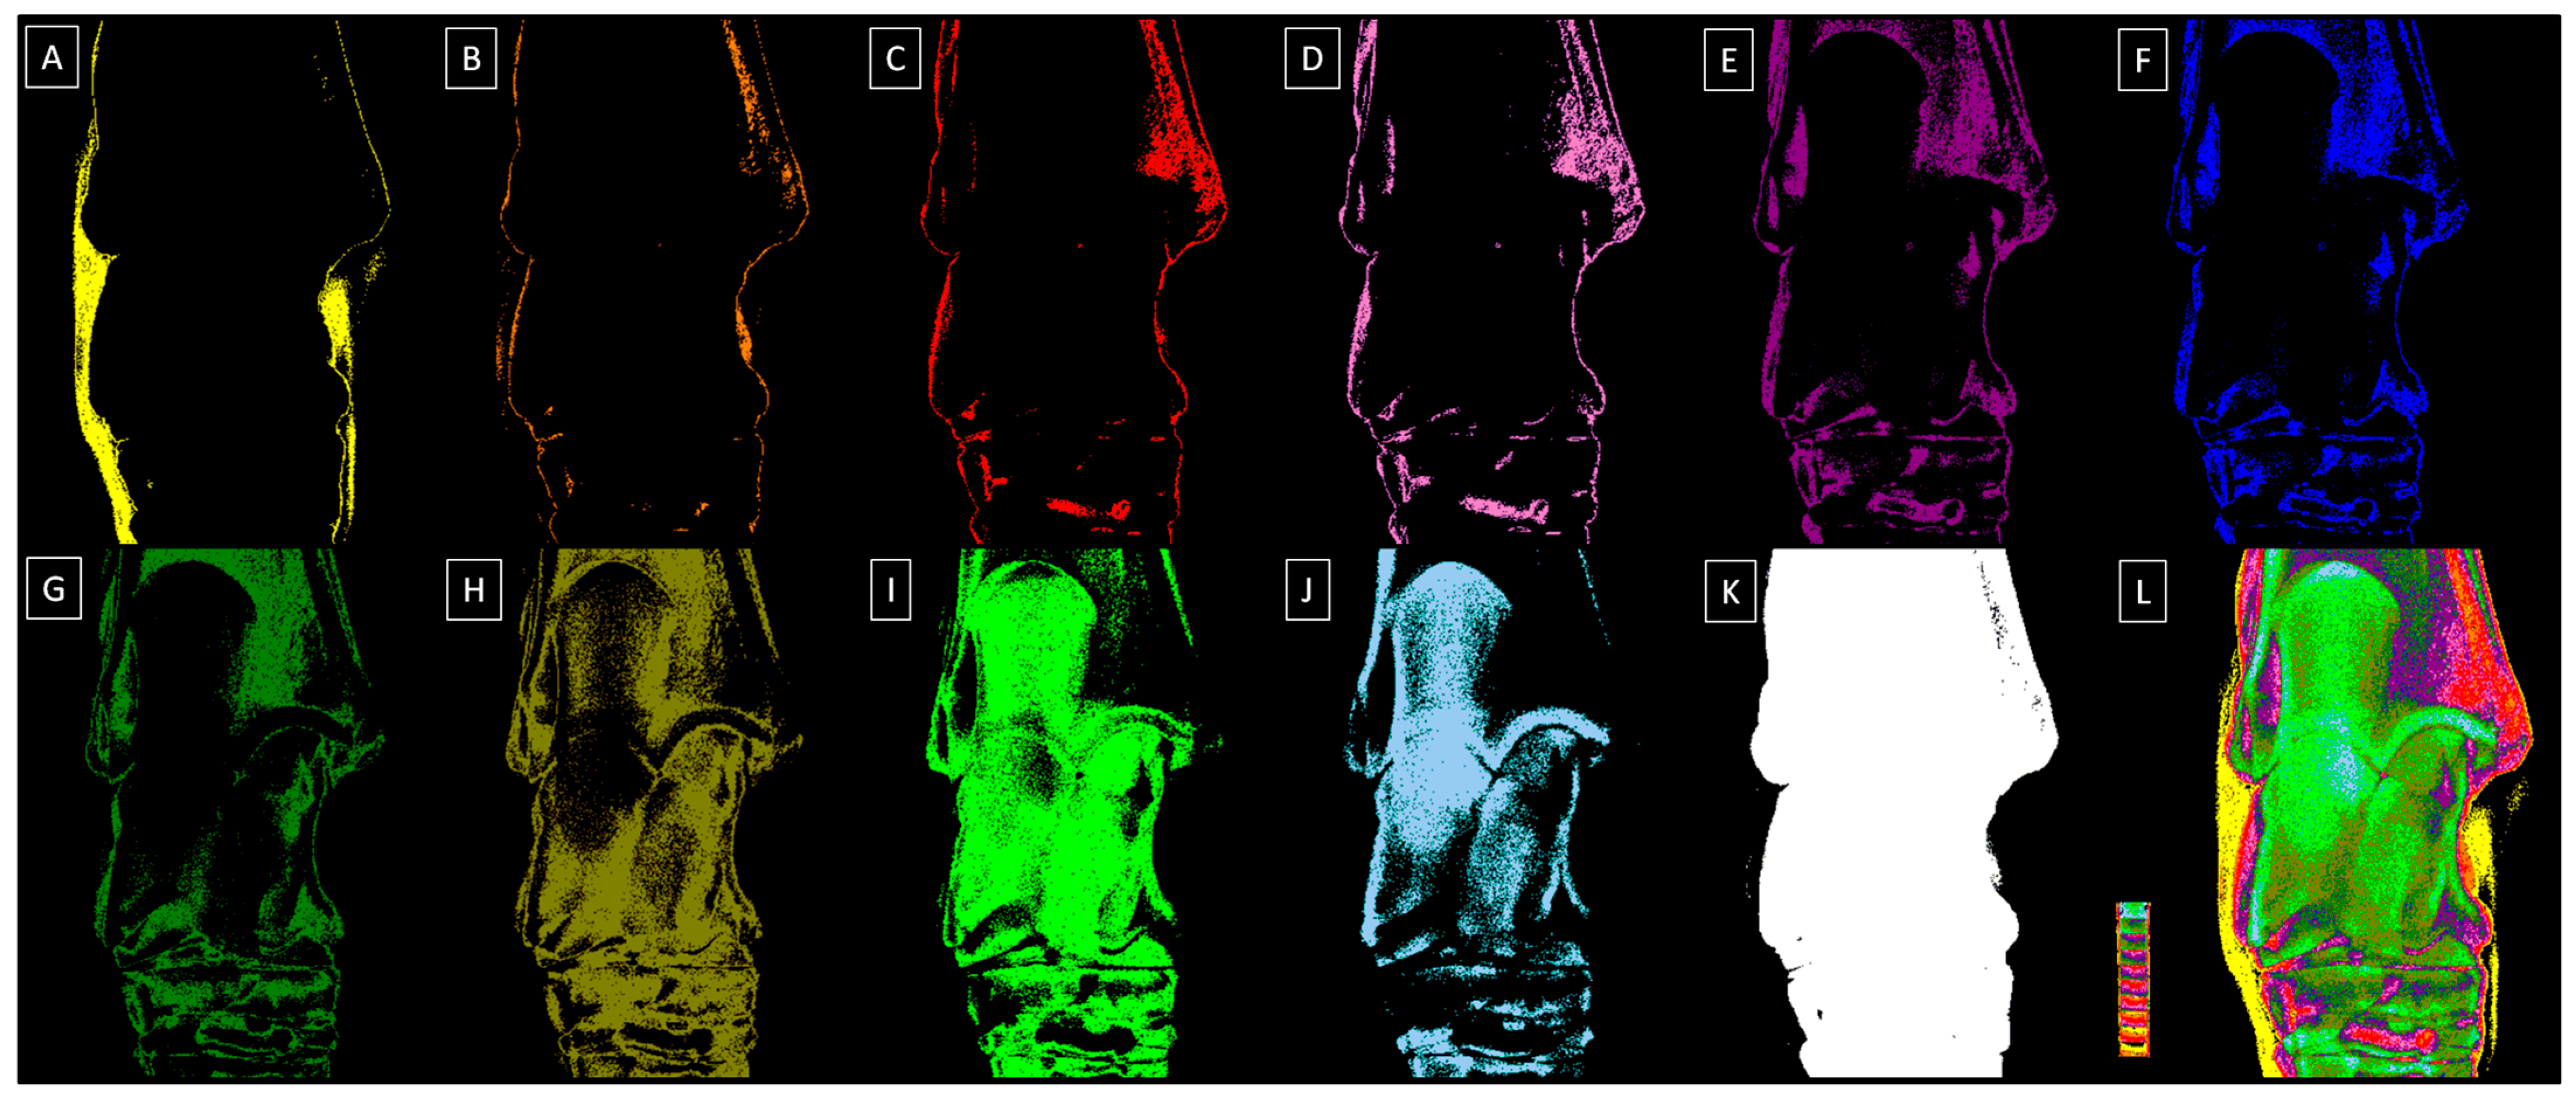
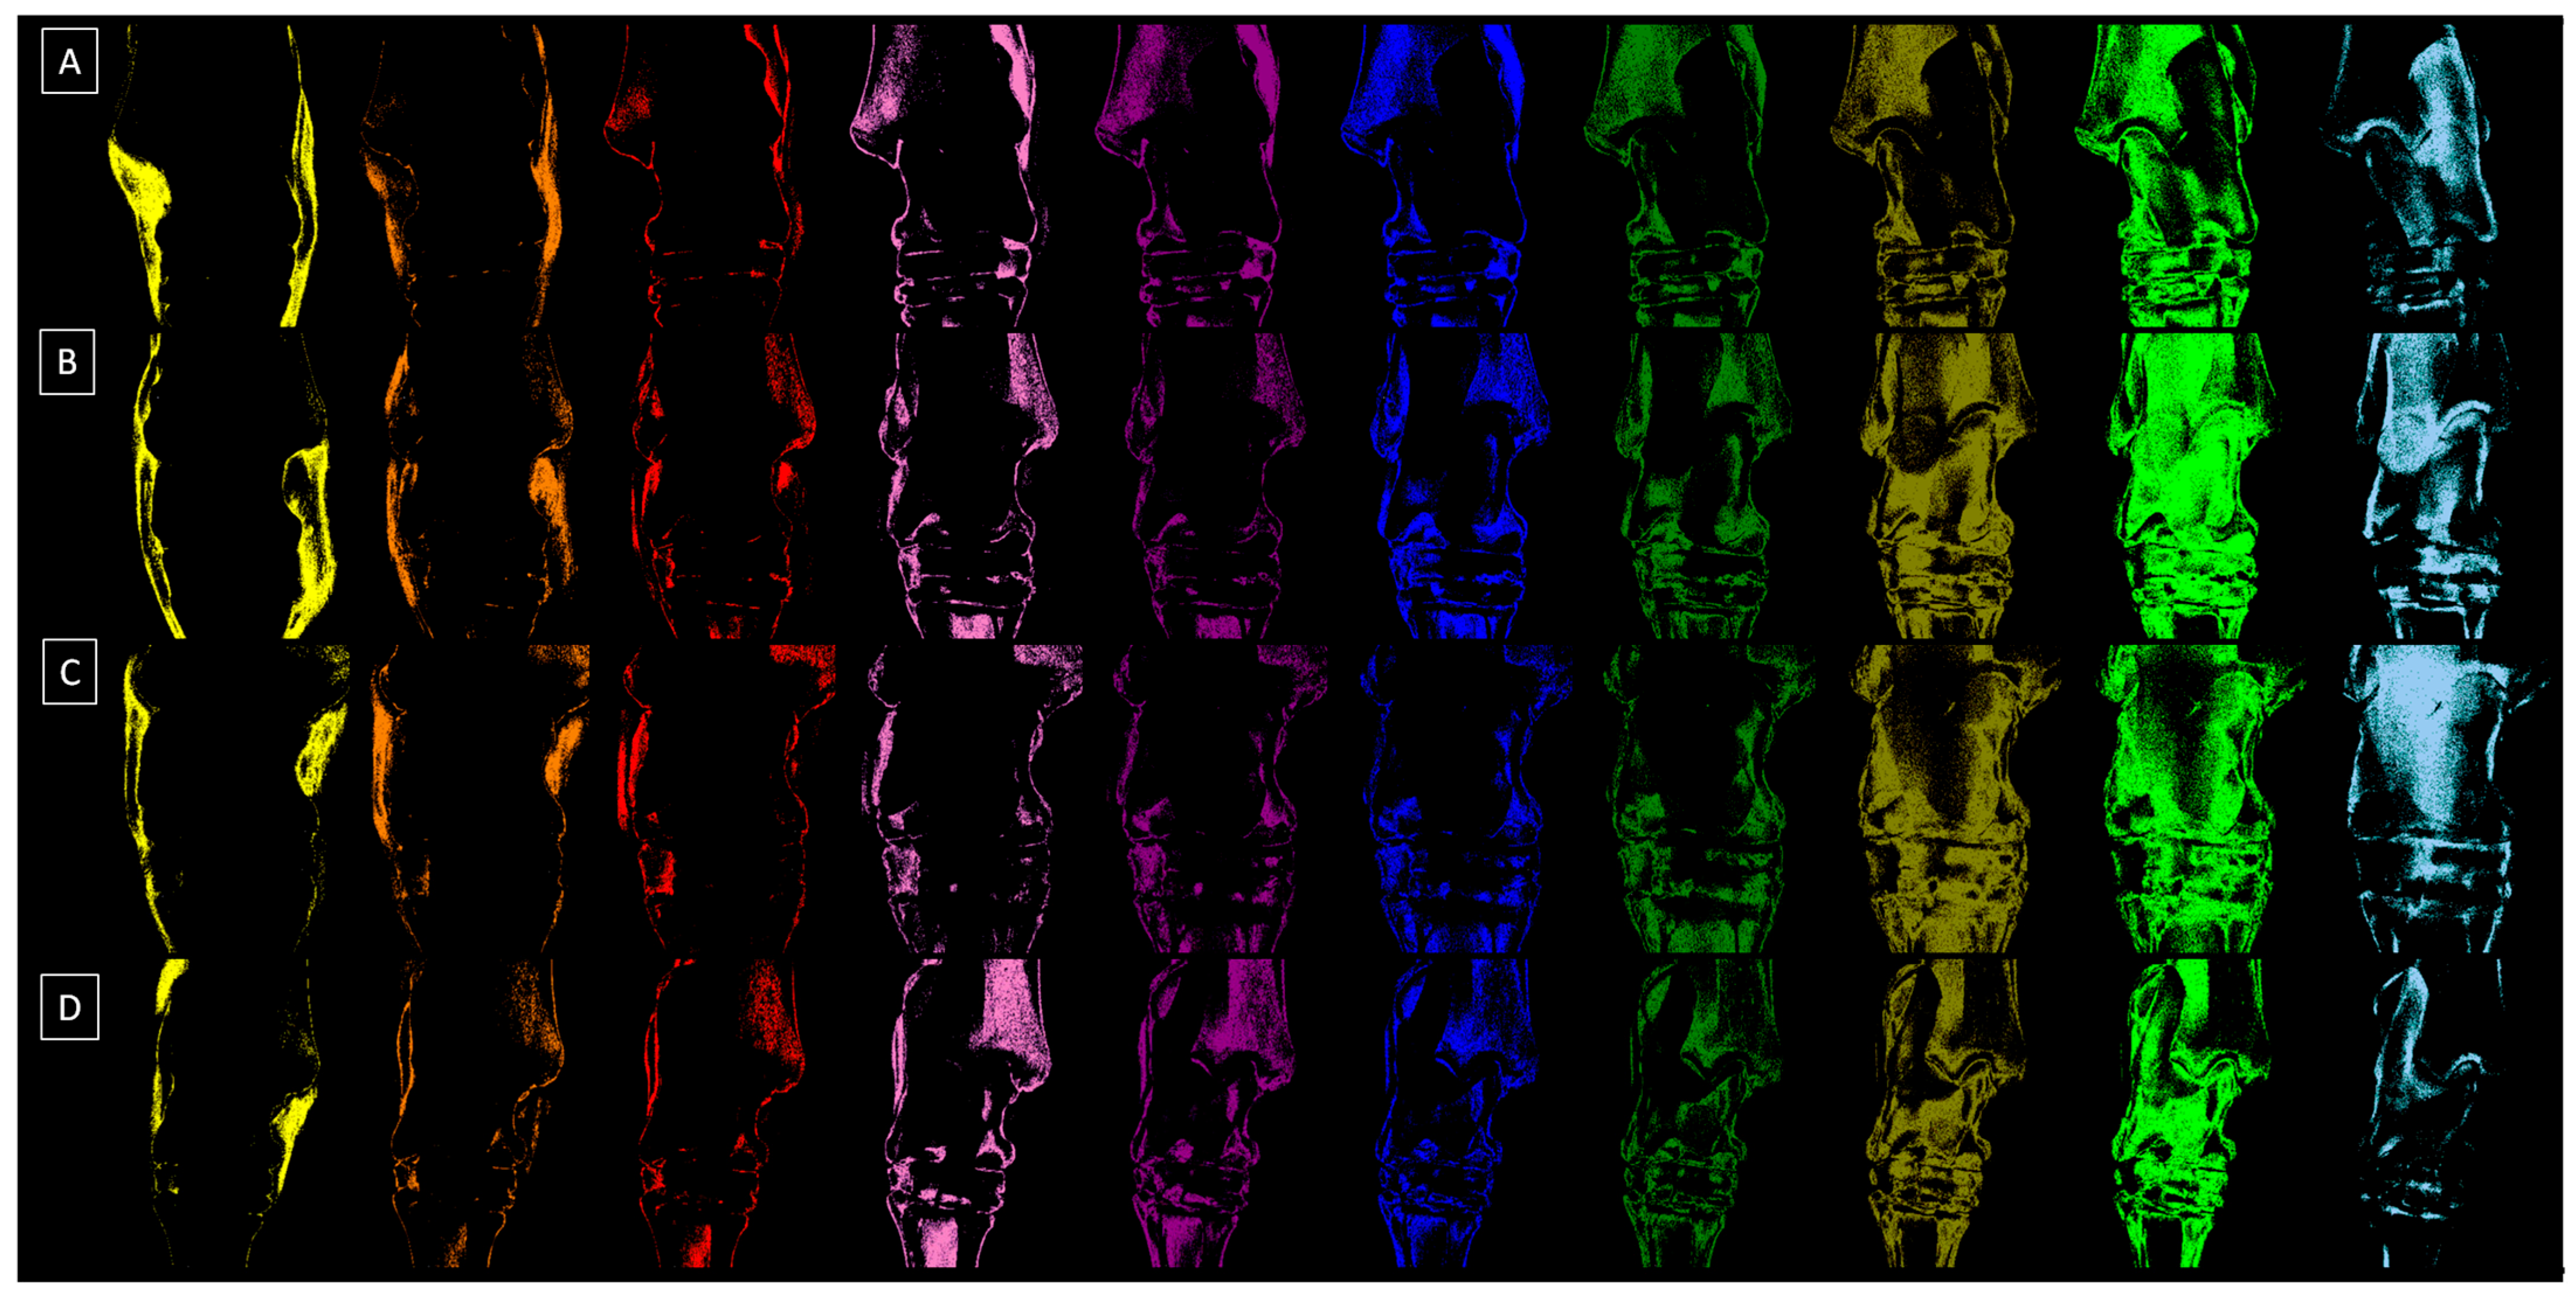
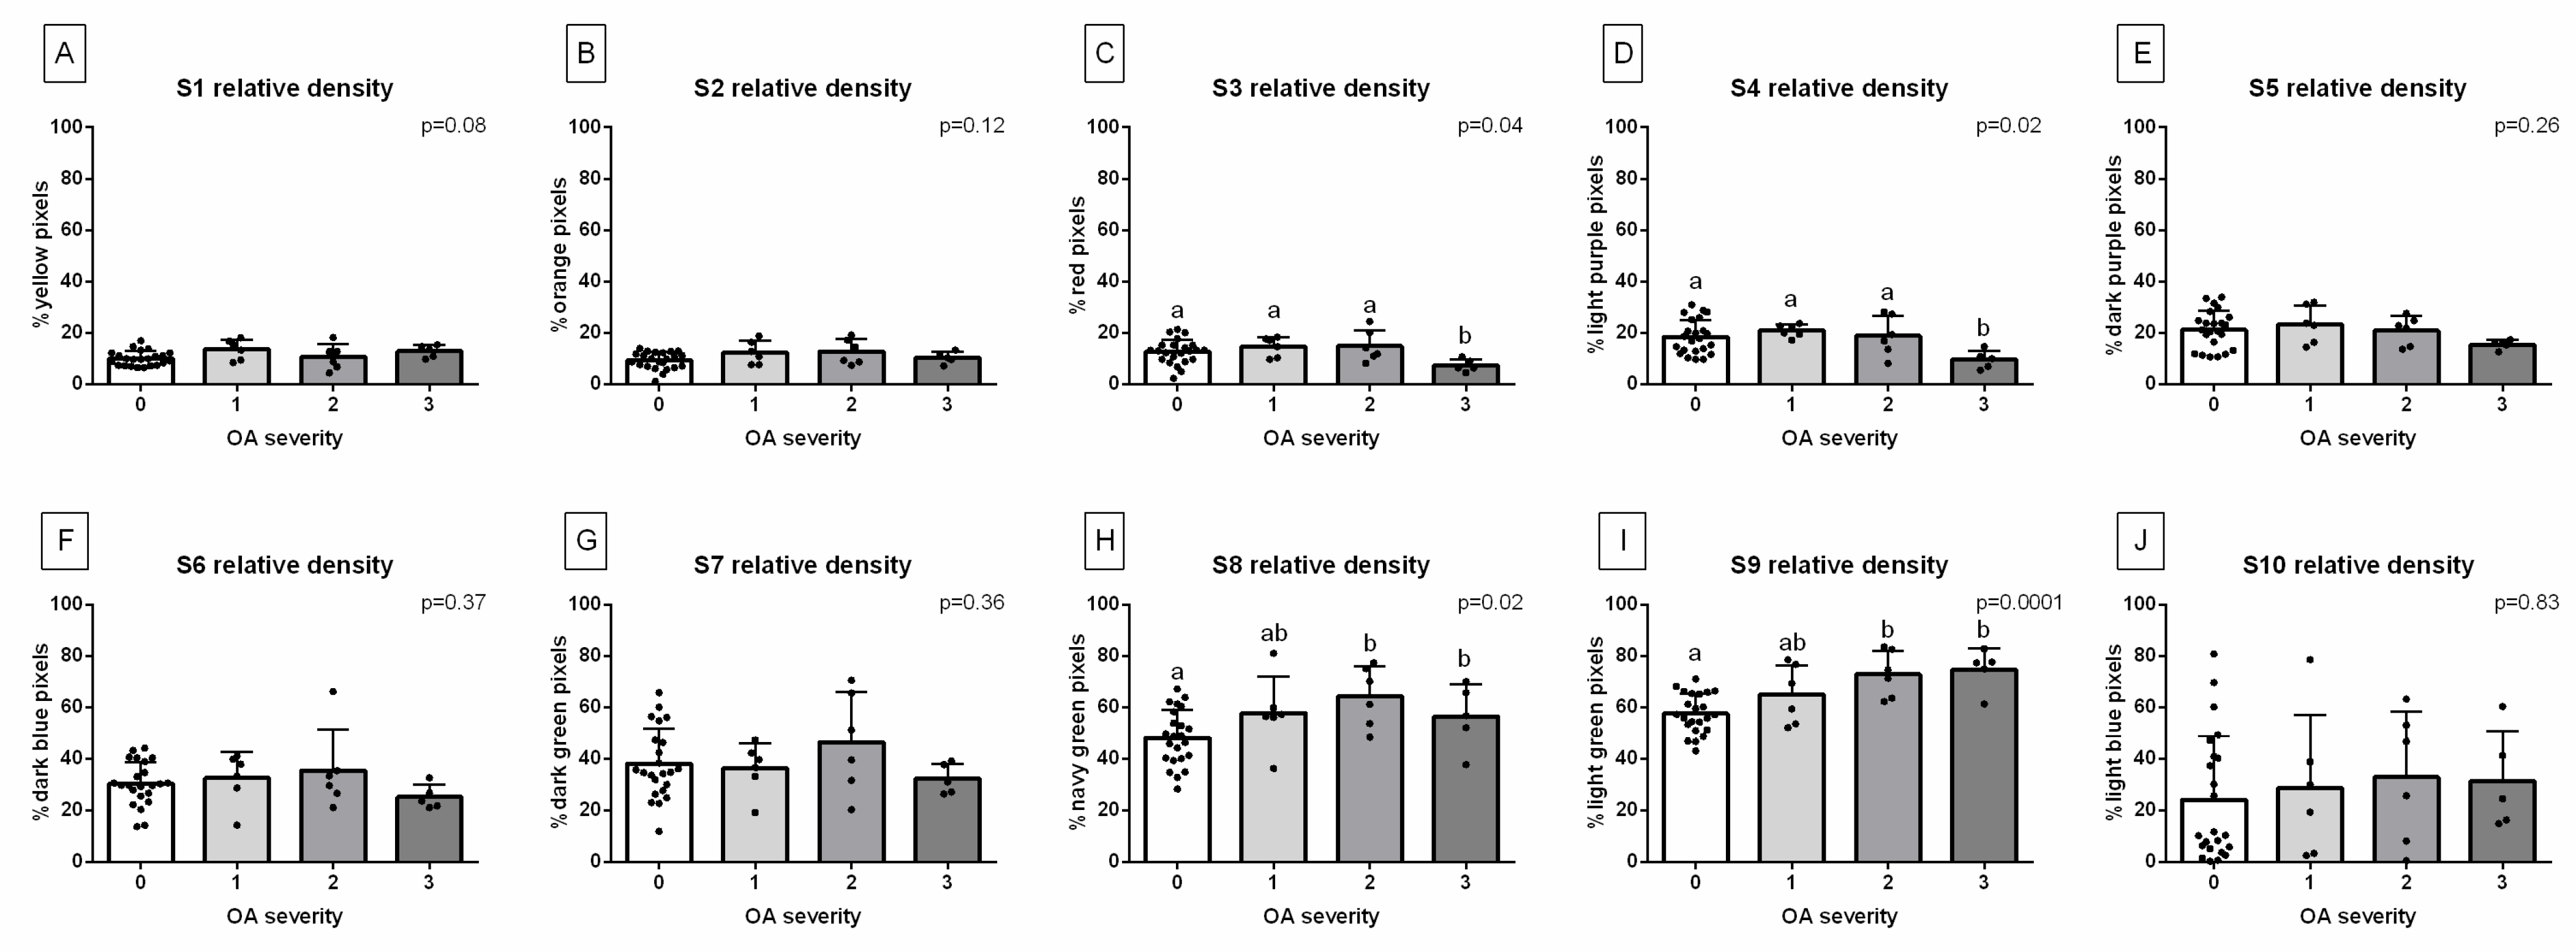
Table 3. The values (mean ±SD) of relative density measured for the ten steps of the density standard (S1–S10) with an assigned color and HEX code.
DecompositionS1S2S3S4S5S6S7S8S9S10
Relative density (HU)1009 ± 1631212 ± 1111407 ± 981600 ± 1341804 ± 1122011 ± 992204 ± 1072400 ± 1332607 ± 1292803 ± 147
ColorYellowOrangeRedLight purpleDark purpleDark
blue
Dark greenNavy greenLight greenLight blue
HEX code#FFFF00#E08000#FF0000#E080C0#800080#0000FF#008000#808000#00FF00#A6CAF0
Table 4. Specific demographics of the included horses (sex, breed, age, lameness score of the hind limbs, training background, and osteoarthritis (OA) severity).
NoSexBreedLameness Score *AgeTraining BackgroundOA Severity Scores
1MFTHLeft 2; Right 234 yearsLeisure work for 18 yearsLeft 0; Right 0
2MSHLeft 3; Right 335 yearsLeisure work for 13 yearsLeft 0; Right 0
3MMBWLeft 4; Right 428 yearsLeisure work for 14 yearsLeft 0; Right 3
4MPHHLeft 2; Right 228 yearsLeisure work for 15 yearsLeft 2; Right 0
5MSHLeft 3; Right 333 yearsLeisure work for 14 yearsLeft 0; Right 0
6MPHHLeft 2; Right 219 yearsLeisure work for 12 yearsLeft 0; Right 2
7MSHLeft 3; Right 321 yearsLeisure work for 11 yearsLeft 2; Right 2
8GPHHLeft 3; Right 326 yearsLeisure work for 19 yearsLeft 0; Right 3
9GPHHLeft 4; Right 422 yearsLeisure work for 16 yearsLeft 3; Right 3
10MPHHLeft 2; Right 215 yearsLeisure work for 10 yearsLeft 0; Right 0
11MMBWLeft 3; Right 325 yearsLeisure work for 14 yearsLeft 0; Right 0
12MFTHLeft 2; Right 223 yearsLeisure work for 16 yearsLeft 0; Right 3
13MPHHLeft 3; Right 327 yearsLeisure work for 12 yearsLeft 0; Right 0
14GPHHLeft 2; Right 232 yearsLeisure work for 17 yearsLeft 1; Right 1
15GPHHLeft 2; Right 226 yearsLeisure work for 15 yearsLeft 0; Right 0
16GPHHLeft 4; Right 428 yearsLeisure work for 15 yearsLeft 2; Right 2
17GPHHLeft 3; Right 322 yearsLeisure work for 16 yearsLeft 1; Right 1
18GPHHLeft 2; Right 218 yearsLeisure work for 11 yearsLeft 1; Right 1
19GPHHLeft 3; Right 327 yearsLeisure work for 14 yearsLeft 0; Right 0
20GPHHLeft 2; Right 224 yearsLeisure work for 15 yearsLeft 0; Right 0
Sex: M: mare, G: gelding; breed: PHH: Polish half-bred horse; FTH: French trotter horse; SH: Silesian horse; MBW: mixed-breed warm-blood horse. * the lameness score was used only for pre-selection.
Disclaimer/Publisher’s Note: The statements, opinions and data contained in all publications are solely those of the individual author(s) and contributor(s) and not of MDPI and/or the editor(s). MDPI and/or the editor(s) disclaim responsibility for any injury to people or property resulting from any ideas, methods, instructions or products referred to in the content.

