Article

Borehole Condition and Limit Pressure Differential Analysis in Carbonate Reservoirs

1
Northwest Oilfield Branch of China Petrochemical Co., Urumqi 830011, China
2
State Key Laboratory of Petroleum Resources and Engineering, China University of Petroleum (Beijing), Beijing 102249, China
*
Author to whom correspondence should be addressed.
Appl. Sci. 2024, 14(13), 5676; https://doi.org/10.3390/app14135676
Submission received: 20 May 2024 / Revised: 23 June 2024 / Accepted: 25 June 2024 / Published: 28 June 2024
(This article belongs to the Special Issue Development and Production of Oil Reservoirs)

Abstract

:
In deep carbonate reservoirs, testing and production with open-hole completion can help release the maximum production capacity. However, because the reservoir is subjected to high in situ stress, if the test pressure differential is too large, the wellbore collapse and instability will occur easily, causing downhole accidents. Therefore, it is necessary to determine the state of the borehole during the open-hole test in the carbonate reservoir and analyze the ultimate test pressure differential accordingly to ensure test safety. Considering the characteristics of open-hole completion, based on the mechanical properties of the carbonate reservoir and the stress distribution around the borehole during testing, a calculation method of the elastic zone, plastic zone, and residual failure zone around the open-hole wellbore was proposed. Regarding actual engineering data, a criterion for the overall stability of the open-hole section had been established from three aspects: the volume ratio of the plastic zone; the failure zone around the wellbore; and the failure angle on the borehole wall. According to this criterion, it is possible to determine the ultimate pressure differential during the open-hole test process and provide theoretical support for designing the open-hole completion test and production parameters for deep carbonate reservoirs.

1. Introduction

Carbonate reservoirs constitute nearly half of global oil reserves, signifying a pivotal role in hydrocarbon exploration and production endeavors [1,2]. Western China boasts abundant resources of fractured-vuggy carbonate reservoirs, comprising two-thirds of proven carbonate reserves [3]. Notably, the Tahe and Shunbei oilfields in the Tarim Basin represent ultra-deep fractured-vuggy carbonate reservoirs with promising exploitation prospects [4].
In carbonate reservoir development, open-hole completions enhance productivity but are more susceptible to wellbore collapse during testing or production operations, leading to subsurface accidents. From a rock mechanics standpoint, borehole collapse predominantly arises from severe stress concentrations on the borehole wall, surpassing the compressive strength of the reservoir rock.
Currently, wellbore stability studies largely concentrate on drilling operations, with limited attention given to well testing and production phases. Drilling-focused wellbore stability analyses primarily consider the impacts of geomechanical parameters and drilling fluid-induced mass, heat, and pressure transfers on borehole wall stresses and rock strength, with a predominant focus on shale formations [5,6]. Conversely, well-test instability investigations target reservoir rocks, incorporating distinct factors compared to drilling scenarios. Besides in situ stresses and rock strength, drilling-related factors—such as drilling fluid leakage, tool rotation/vibration, and pressure variations from pipe movements—also contribute to borehole collapse, though quantifying these engineering aspects for collapse pressure calculations proves challenging, rendering drilling collapse pressure estimations inherently conservative. The underlying principle assumes that any breach of the elastic limit at the borehole wall may induce instability.
During well completion tests, reservoir fluids infiltrate the wellbore, and once a negative pressure differential is established, the formation–hydrostatic equilibrium suggests a stable condition, minimizing borehole perturbations. Hence, the presence of plastic deformation zones or minor failure areas on the borehole wall does not necessarily compromise overall wellbore stability under these circumstances.
Therefore, by investigating the stress distribution around the borehole and the effect of completion fluids on reservoir strength during open-hole completion tests in carbonate reservoirs, complemented with the application of strength criteria, we evaluate the borehole wall condition and adjacent formation stability. This process facilitates the establishment of a comprehensive wellbore stability assessment criterion, ultimately leading to the determination of the permissible maximum pressure differential.

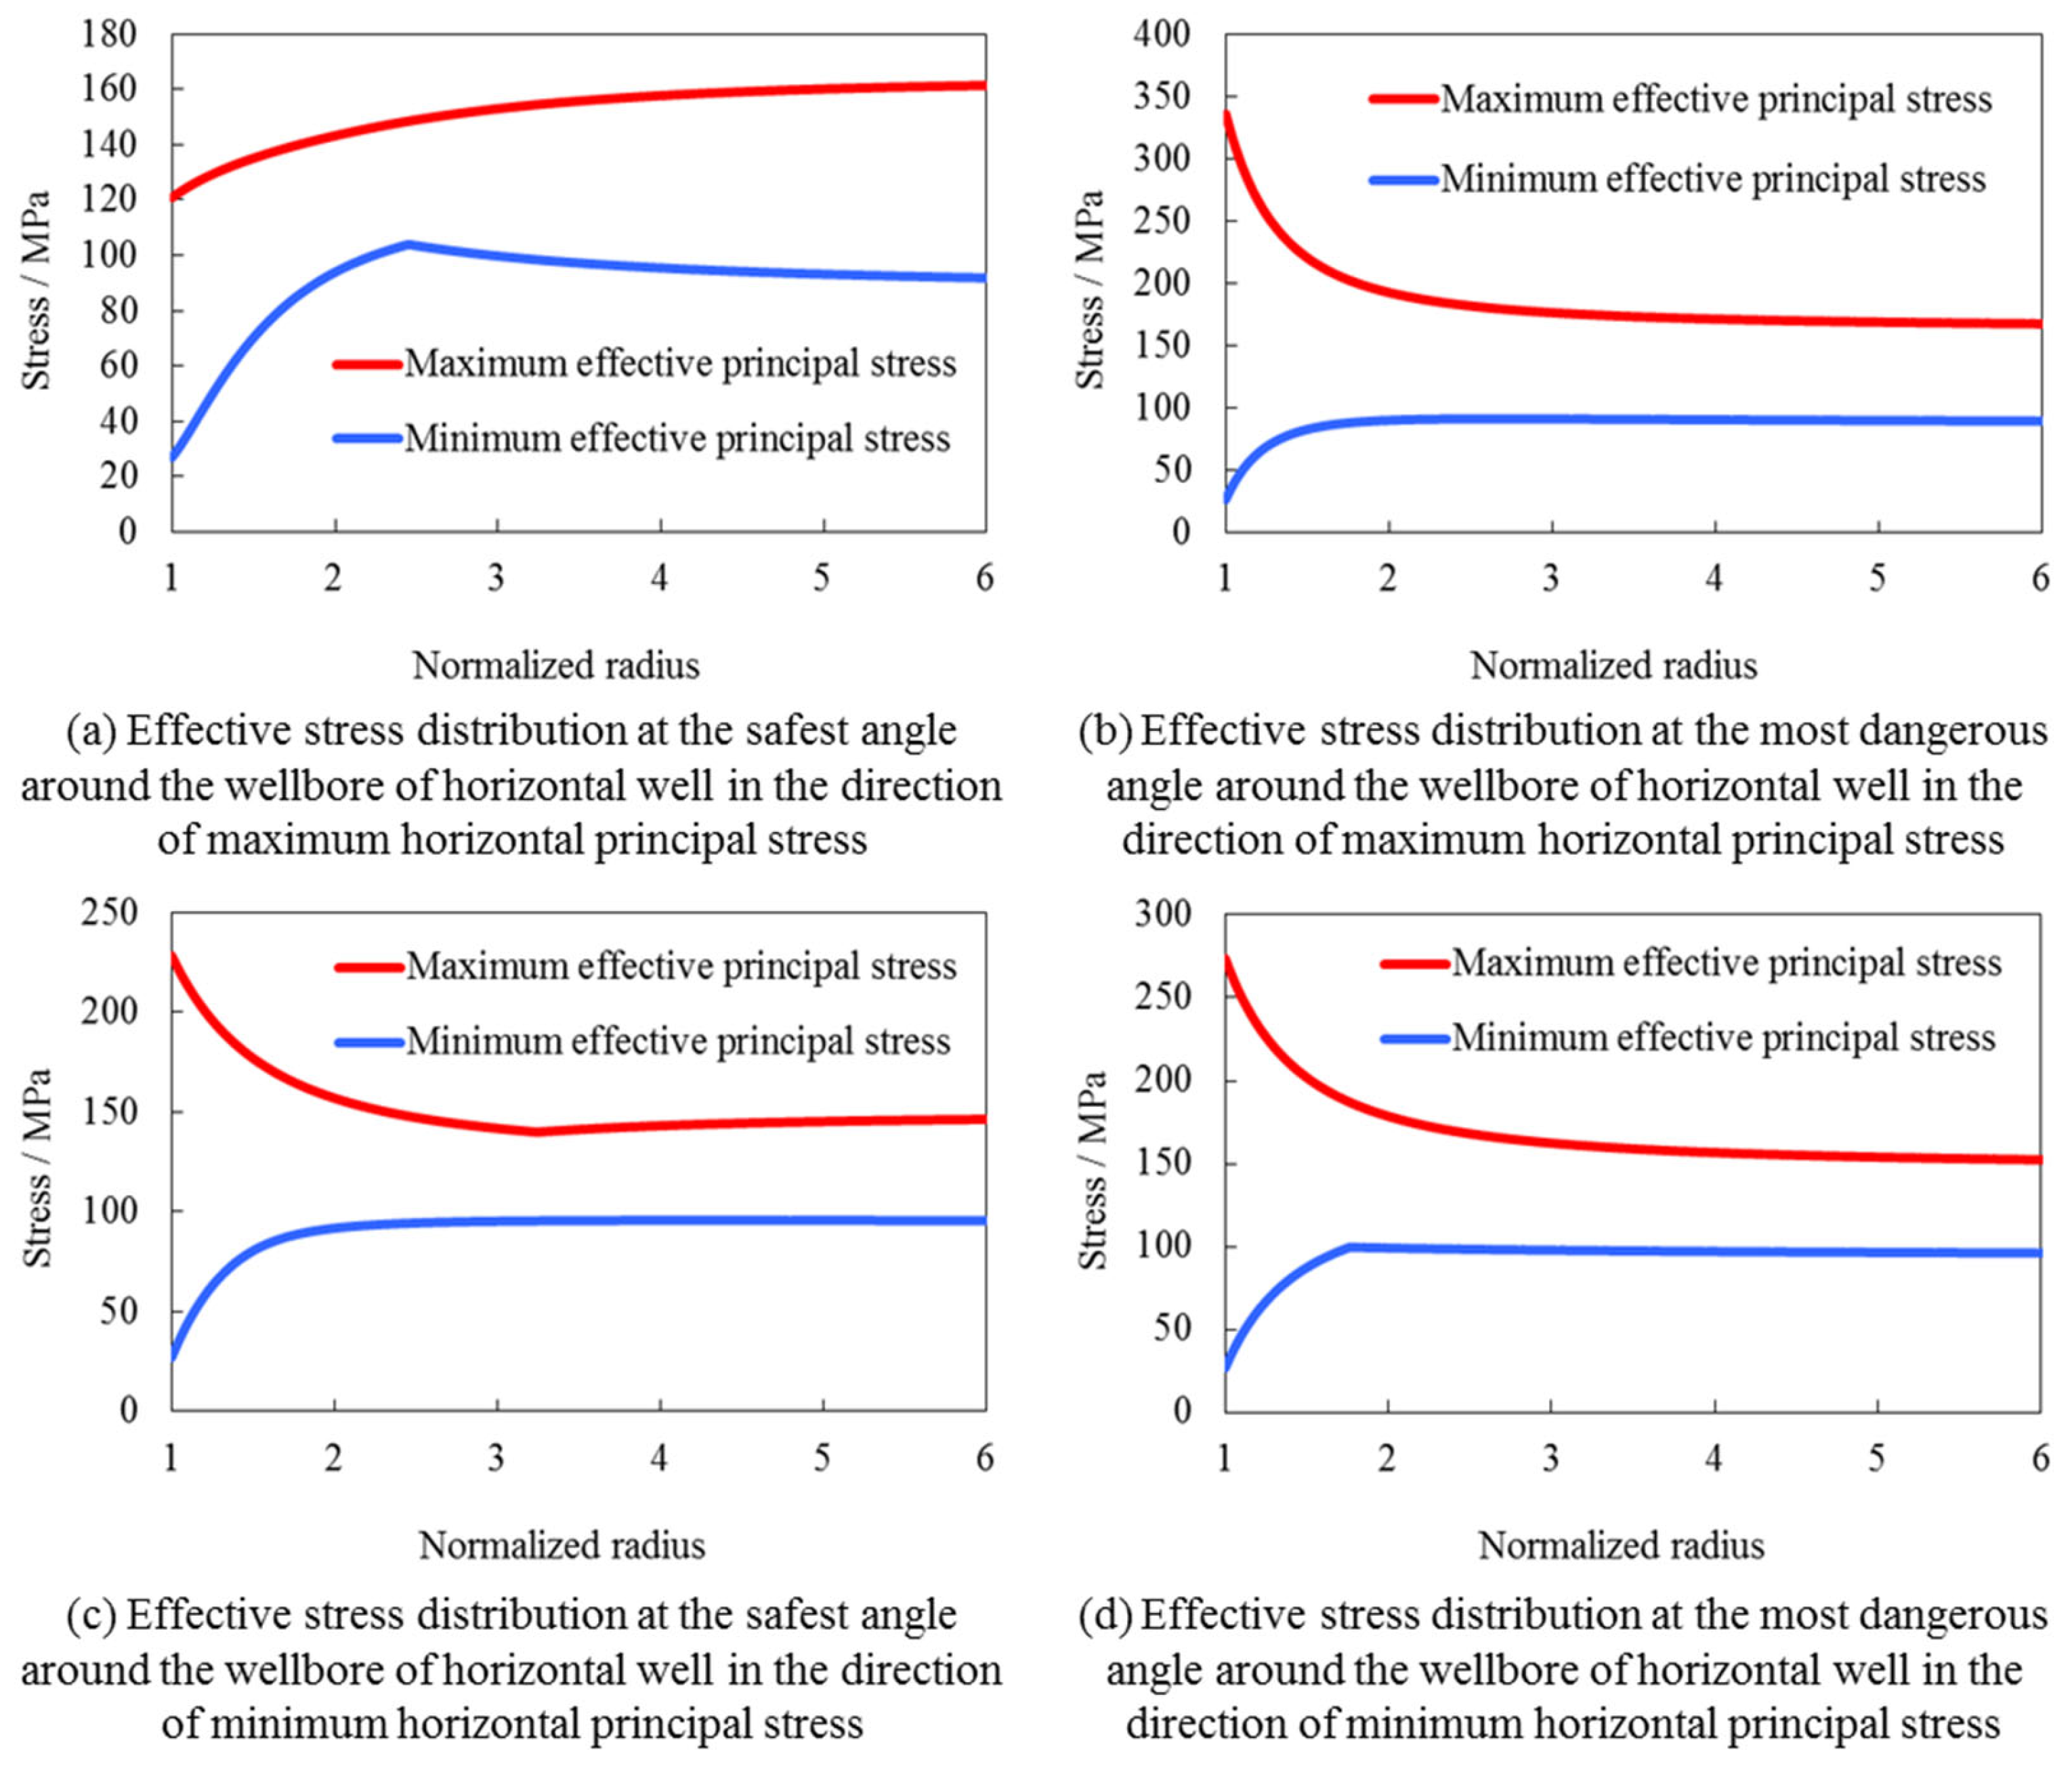
2. Stress Distribution around Borehole in Open-Hole Completion

During the test, pore pressure around the borehole and stress on the rock skeleton are redistributed. Assume that the original in situ stress state is the following: the overburden pressure σ V ; the maximum horizontal stress σ H ; and the minimum horizontal stress σ h . For any directional well with inclination angle α and azimuth angle β , the far-field stress with the borehole axis as z-axis can be calculated by the following formula [7]:
σ x x = σ H cos 2 α cos 2 β + σ h cos 2 α sin 2 β + σ V sin 2 α σ y y = σ H sin 2 β + σ h cos 2 β σ z z = σ H sin 2 α cos 2 β + σ h sin 2 α sin 2 β + σ V cos 2 α τ x y = σ H cos α cos β sin β + σ h cos α cos β sin β τ y z = σ H sin α cos β sin β + σ h sin α cos β sin β τ z x = σ H cos α sin α cos 2 β + σ h cos α sin α sin 2 β σ V sin α cos α
Based on the plane strain assumption, the stress component around the wellbore can be expressed as follows:
σ r = r w r p i + σ x x + σ y y 2 ( 1 r w 2 r 2 ) + σ x x σ y y 2 ( 1 + 3 r w 4 r 4 4 r w 2 r 2 ) cos 2 θ + τ x y ( 1 + 3 r w 4 r 4 4 r w 2 r 2 ) sin 2 θ σ θ = r w r p i + σ x x + σ y y 2 ( 1 + r w 2 r 2 ) σ x x σ y y 2 ( 1 + 3 r w 4 r 4 ) cos 2 θ τ x y ( 1 + 3 r w 4 r 4 ) sin 2 θ σ z = σ z z μ [ 2 ( σ x x σ y y ) r w 2 r 2 cos 2 θ + 4 τ x y r w 2 r 2 sin 2 θ ] τ r θ = σ x x σ y y 2 ( 1 3 r w 4 r 4 + 2 r w 2 r 2 ) sin 2 θ + τ x y ( 1 3 r w 4 r 4 + 2 r w 2 r 2 ) cos 2 θ τ θ z = τ y z ( 1 + r w 2 r 2 ) cos θ τ z x ( 1 + r w 2 r 2 ) sin θ τ z r = τ x z ( 1 r w 2 r 2 ) cos θ + τ y z ( 1 r w 2 r 2 ) sin θ
where σ x x , σ y y , σ z z , τ x y , τ y z , and τ z x are stress components in borehole rectangular coordinates, MPa; σ r , σ θ , σ z , and τ θ z are stress components in borehole cylindrical coordinates, MPa; p i is wellbore fluid column pressure, MPa; θ is the relative angle of any point in borehole wall, radian; μ is Poisson’s ratio; r w and r are the borehole radius and polar radius of a point in formation, m.
According to the basic principle of stress transformation [8], the stress matrix at any point in formation near the borehole wall can be transformed into the principal stress matrix.
σ r τ r θ τ z r τ r θ σ θ τ θ z τ z r τ θ z σ z σ 1 σ 2 σ 3
where σ 1 , σ 2 and σ 3 are three principal stresses, MPa.
For fractured carbonate formations, when fractures are highly developed, pressure changes around the borehole during open-hole testing are similar to those in porous media, as shown below [9]:
p ( r ) = p p μ Q 4 π K f h [ E i ( μ C f r 2 4 K f t ) ]
where p ( r ) is the pore pressure around the wellbore from the axis r , MPa; p p is the original pore pressure of the formation, MPa; Q is the test yield, m3/s; K f is the permeability of fracture system, μ m 2 ; h is reservoir thickness, m; μ is the underground viscosity of crude oil, mPa·s; C f is the compression coefficient of fractured reservoir, MPa−1; t is the test time, s; E i is a power integral function.
According to the principle of effective stress, the effective stress acting on the rock skeleton controls the rock deformation and failure, namely,
σ = σ α p ( r )
According to Equations (1) to (5), the effective stress distribution around the wellbore can be calculated. Taking a deep carbonate reservoir as an example, its basic characteristic parameters are shown in Table 1.
When the test pressure differential is 20 MPa, the stress distribution around the borehole is shown in Figure 1. Due to the difference in the redistribution of stress at different well angles after its formation, there are “safest” and “most dangerous” angles around the well. At the safest angle, the difference between the maximum and minimum effective principal stresses is relatively small, making the well less prone to failure. Conversely, at the most dangerous angle, the difference between the maximum and minimum effective principal stresses is large, which makes it easy to cause wellbore collapse and instability. According to the calculation results, it can also be seen that the stress distribution around the borehole in different directions is also different. When drilling in the direction of the maximum horizontal principal stress, the stress difference on the safest angle of the wellbore is small, only about 94 MPa, whereas, at the most dangerous angle, the stress difference reaches approximately 309 MPa. When drilling in the direction of horizontal minimum principal stress, the differential stress on the wellbore at the safest angle is about 201 MPa, and the differential stress on the wellbore at the most dangerous angle is about 247 MPa. The difference between the two is not significant, which is related to the relative size of the three principal stresses.

3. Evaluation of Open-Hole Wellbore Condition in Carbonate Rock

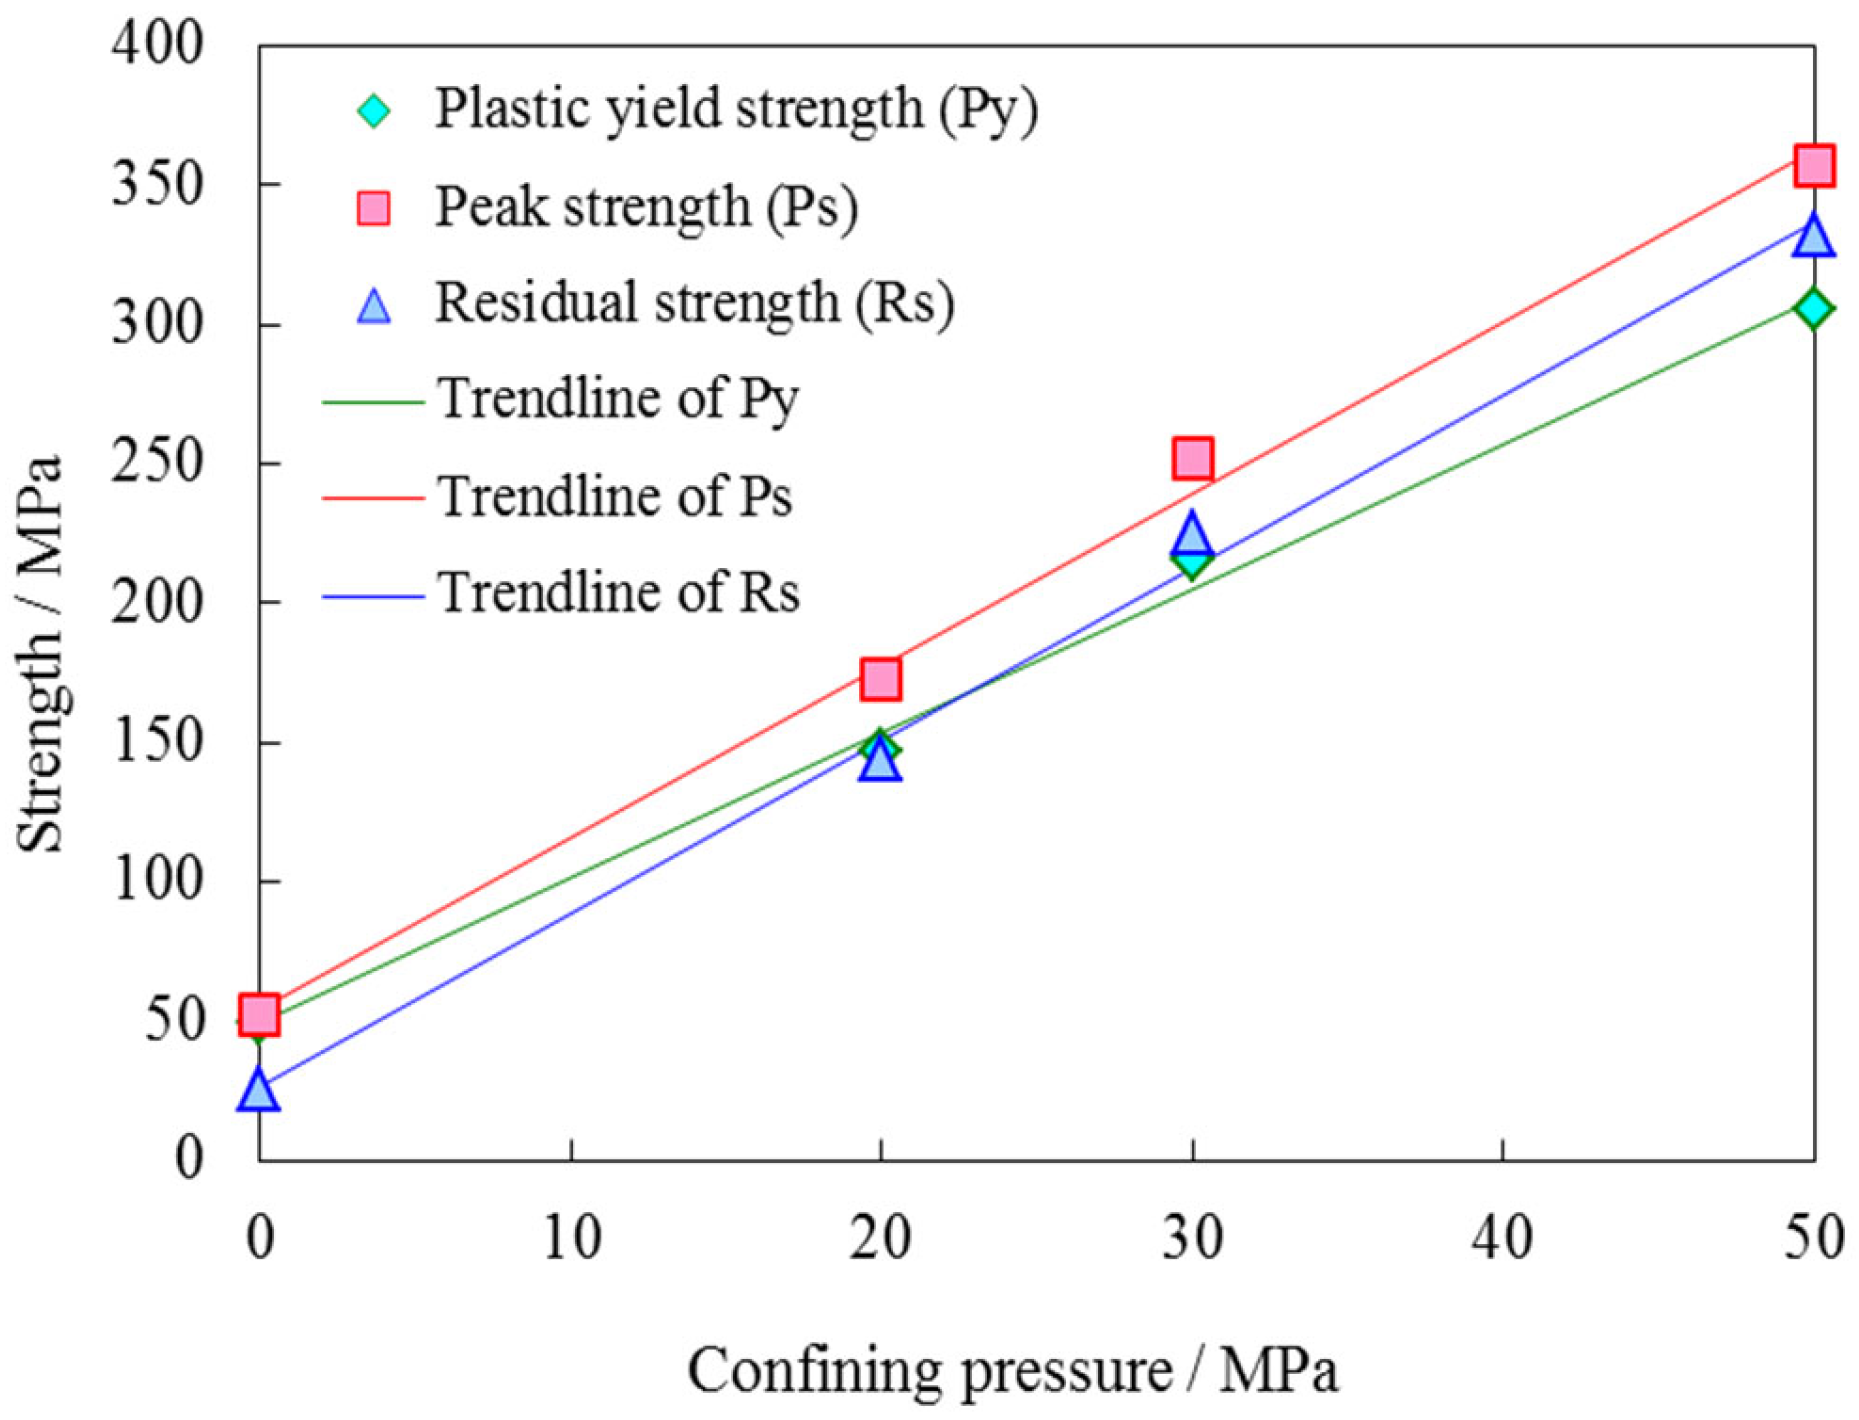
3.1. Core Mechanical Parameters of Carbonate Reservoir

Laboratory testing constitutes a direct means of acquiring core mechanical properties. The specimen cores, originating from a depth of 7350 to 7560 m in an oilfield located within the Tarim Basin, exhibit upon visual inspection a distribution of irregular fractures, predominantly well-sealed (Figure 2). During laboratory procedures, when machining standard core columns measuring 25 mm in diameter and 50 mm in length utilizing clear water as the circulating medium, the cores exhibit a propensity to fracture post-water invasion. This observation further attests to the prevalence and high brittleness of these fractures in the absence of confining pressure.
The native core was machined into standard core specimens, approximately 25 mm in diameter and 50 mm in length, via wire-cutting, followed by conducting compressive strength tests to derive the core’s strength and deformation parameters. Figure 3 illustrates the stress–strain curves obtained under varying confining pressure regimes. Under minimal confining pressures, the core exhibits brittle failure. Conversely, as confining pressure escalates, the core demonstrates increased plasticity, with a rise observed in residual strength post-failure.
Based on the experimental results, the plastic yield strength, peak strength, and residual strength values of the core under differing confining pressure levels have been tabulated (Table 2). These three-strength metrics are depicted collectively in a graphical representation, with separate linear regression analyses applied, as illustrated in Figure 4.
According to Mohr–Coulomb strength criterion and plastic yield strength data, the core cohesion and internal friction angle are C y = 10.8 MPa and ϕ y = 42 . 6 ; calculated by the peak failure strength, the core cohesion and internal friction angle are C p = 10.8 MPa and ϕ p = 46 . 1 ; based on the residual strength, the core cohesion and internal friction angle are C r = 5.2 MPa and ϕ r = 46 . 3 , respectively.

3.2. Description of Wellbore Conditions

At present, the criteria for describing the shear failure of rock in a plane strain state mainly include the Mohr–Coulomb criterion, Drucker–Prager criterion, and Hoek–Brown criterion.
The yield surface of the Mohr–Coulomb criterion in stress space constitutes an irregular hexagonal prismatic cone, exhibiting a complex geometry that aptly depicts the shearing behavior of many rock masses. Its independent accommodation of cohesion and internal friction angle renders it widely applicable in the analysis of granular materials such as soils, gravel, and numerous rocks, particularly when accounting for the concurrent effects of shear and normal stresses. The standard expression of the Mohr–Coulomb criterion is as follows:
σ 1 = σ 3 tan 2 π 4 + ϕ 2 + 2 C tan π 4 + ϕ 2
where, σ 1 and σ 3   is the maximum and minimum effective principal stress, respectively. C is cohesion; ϕ is internal friction angle.
The Drucker–Prager criterion, whose yield surface in stress space forms a conical section, simplifies computations and is commonly employed in analyzing the plastic behavior of metals and other materials with superior continuity. It is especially suited to materials where cohesion is relatively minor, and friction dominates; however, in addressing the intricate deformation behavior of rocks, especially within the realm of elastic–plastic mechanics, the D–P criterion lacks the precision of the Mohr–Coulomb criterion in depicting complex rock behaviors. The standard expression of the Drucker–Prager criterion is as follows:
J 2 + α I 1 k = 0
where I 1 and J 2 denote the first and second invariants of the stress deviator tensor, respectively; α and k are constants related to the cohesion C and the internal friction angle ϕ .
The Hoek–Brown criterion captures the inherent nonlinear failure characteristics of rocks and rock masses, along with the influence of structural features and stress states on strength. Nonetheless, limitations include neglect of the intermediate principal stress effect, challenges in accurately determining the criterion parameters, and reduced suitability for rocks with pronounced anisotropy due to prominent joints.
σ 1 = σ 3 + σ c m i σ 3 σ c + 1 0.5
where σ 1 and σ 3   is the maximum and minimum effective principal stress, respectively. σ c represents the uniaxial compressive strength of the rock; m i is an empirical parameter with dimensions reflecting the hardness of the rock, whose value ranges from 0.001 to 25.0.
Owing to its broad applicability and comprehensive consideration of physical parameters, the Mohr–Coulomb criterion is adopted herein to characterize the plastic and residual regions of carbonate rocks.
Let F y = σ 1 σ 3 K y 2 + 2 C y K y , F p = σ 1 σ 3 K p 2 + 2 C p K p , respectively, where K y = tan π 4 + ϕ y 2 ; K p = tan π 4 + ϕ p 2 .
The stress state around the borehole and the strength parameters obtained from the core experiments are substituted into the above formula, and the F y and F p values are calculated. When F y < 1 , it indicates that the surrounding rock of the wellbore is in an elastic state; when F y 1 and F p < 1 , it shows that the surrounding rock of the wellbore is in a plastic state; when F p 1 , it indicates that the surrounding rock of the wellbore is in a post-peak residual state. When the surrounding rock of a wellbore is in an elastic state, the deformation will also recover when the stress is restored (such as reducing the test pressure differential), and the wellbore is safe. When the surrounding rock of the wellbore is in a plastic state, it will not immediately collapse and the wellbore is safe, but there may be some damage inside the rock, which could lead to collapse when it is immersed in completion fluid for a long time. When the surrounding rock of the wellbore enters the post-peak residual state, spalling and loss of blocks will occur in the wellbore.
Taking the carbonate reservoir shown in Table 1 as an example, the state of the surrounding formations of the borehole while drilling horizontally in different directions under a pressure differential of 20 MPa during testing is calculated, as shown in Figure 5. The calculation results show that within a formation range of twice the borehole diameter, there will be elastic, plastic, and post-peak residual zones around the wellbore while drilling in both the direction of maximum and minimum horizontal principal stresses. However, due to the differences in the stress distribution around the wellbore, the plastic and residual zones around the borehole in the direction of maximum horizontal principal stress only occur in the horizontal direction while maintaining an elastic state in the vertical direction. This means that the range is smaller in the circumferential direction and larger in the radial direction. On the other hand, for the horizontal well drilled in the direction of minimum horizontal principal stress, the plastic and residual zones appear almost all around the wellbore in the circumferential direction, but they are shallower in the radial direction.

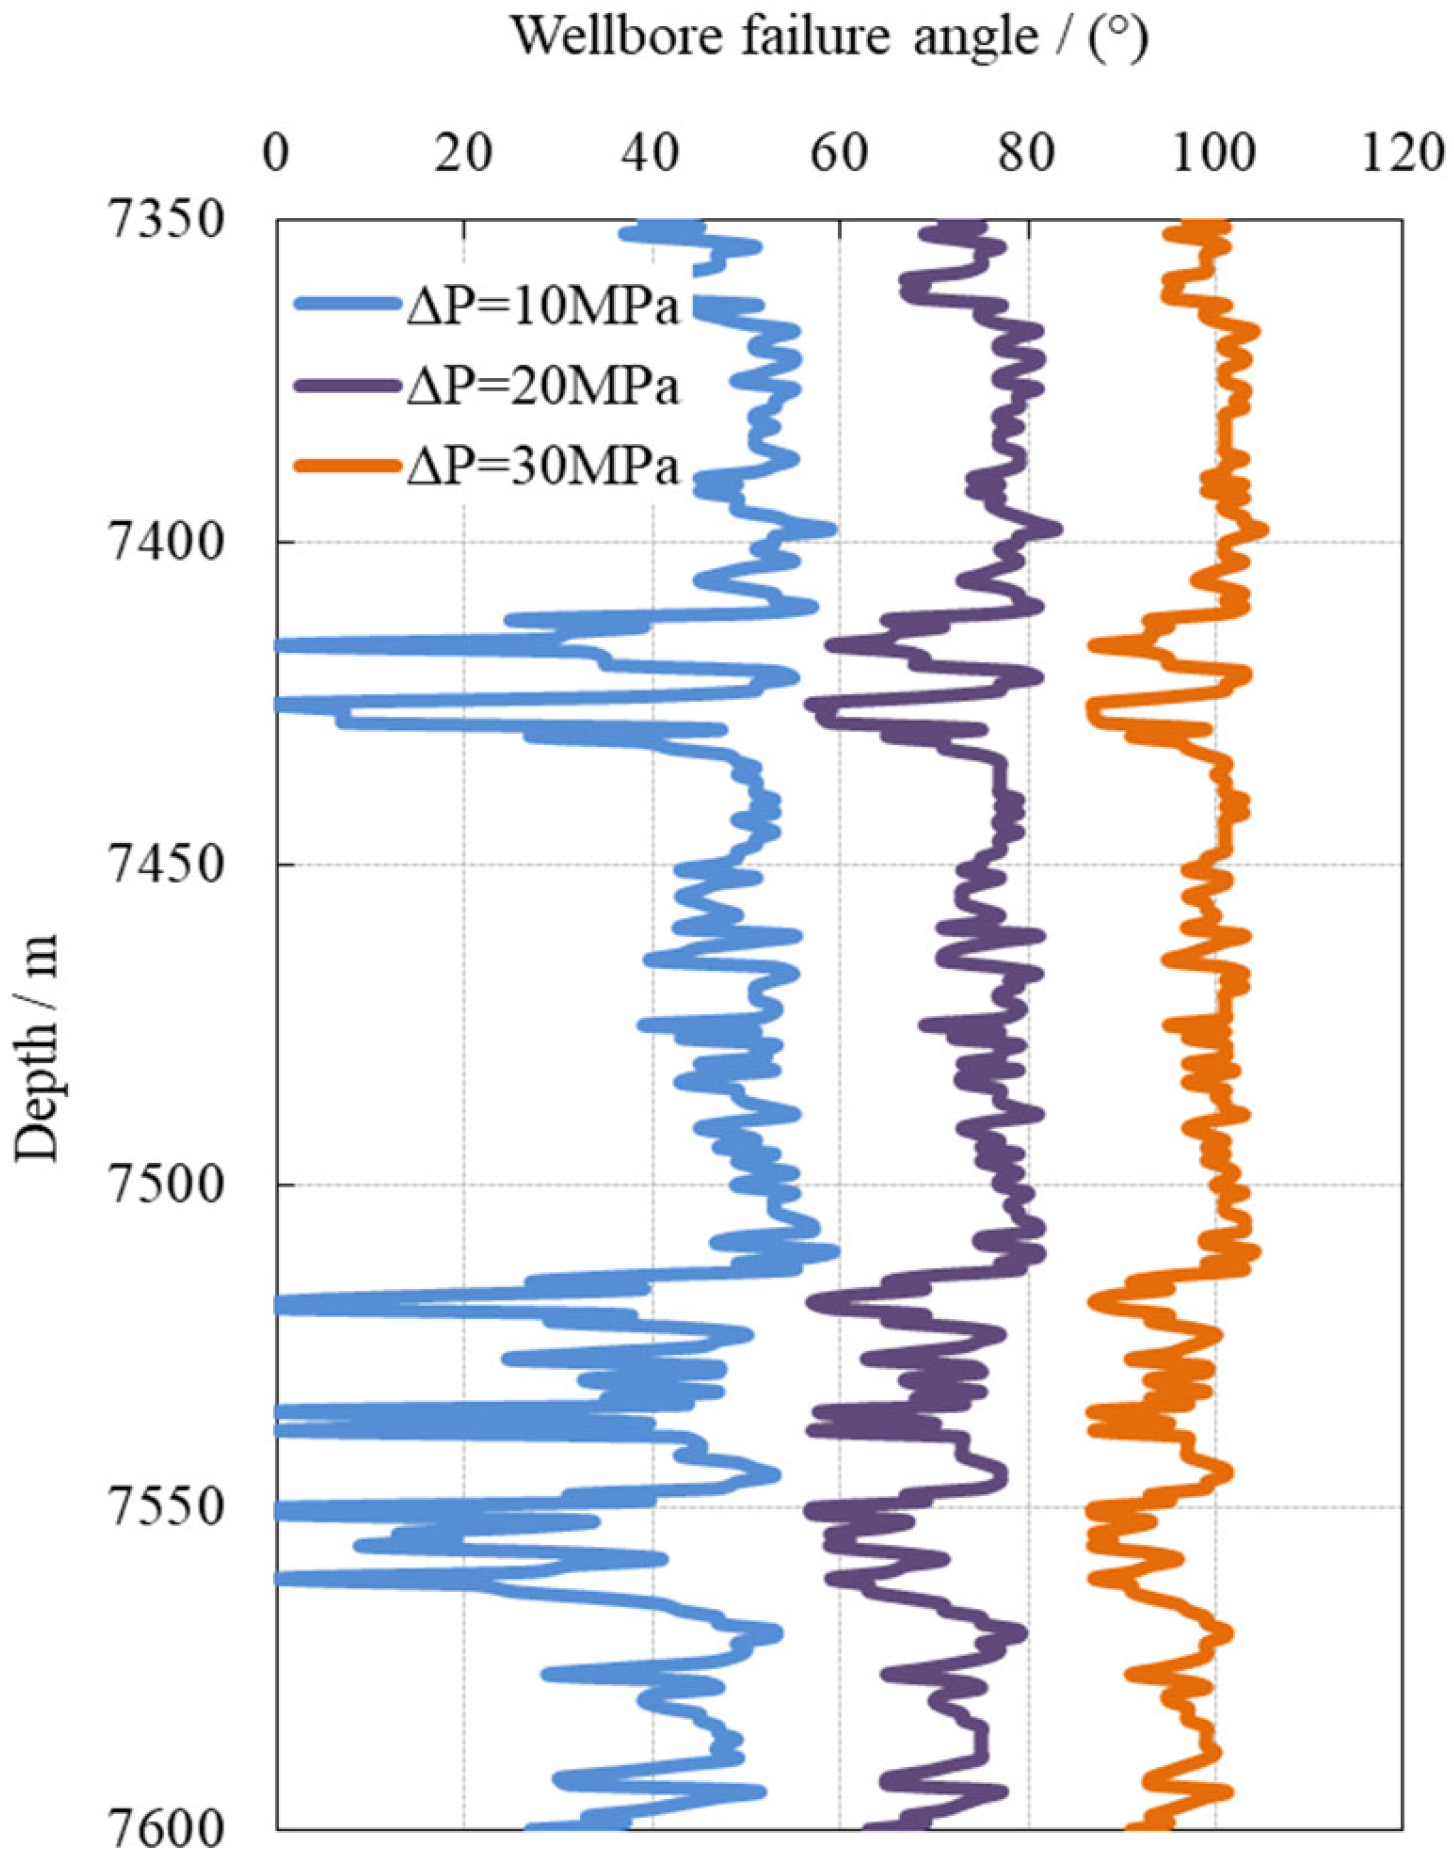
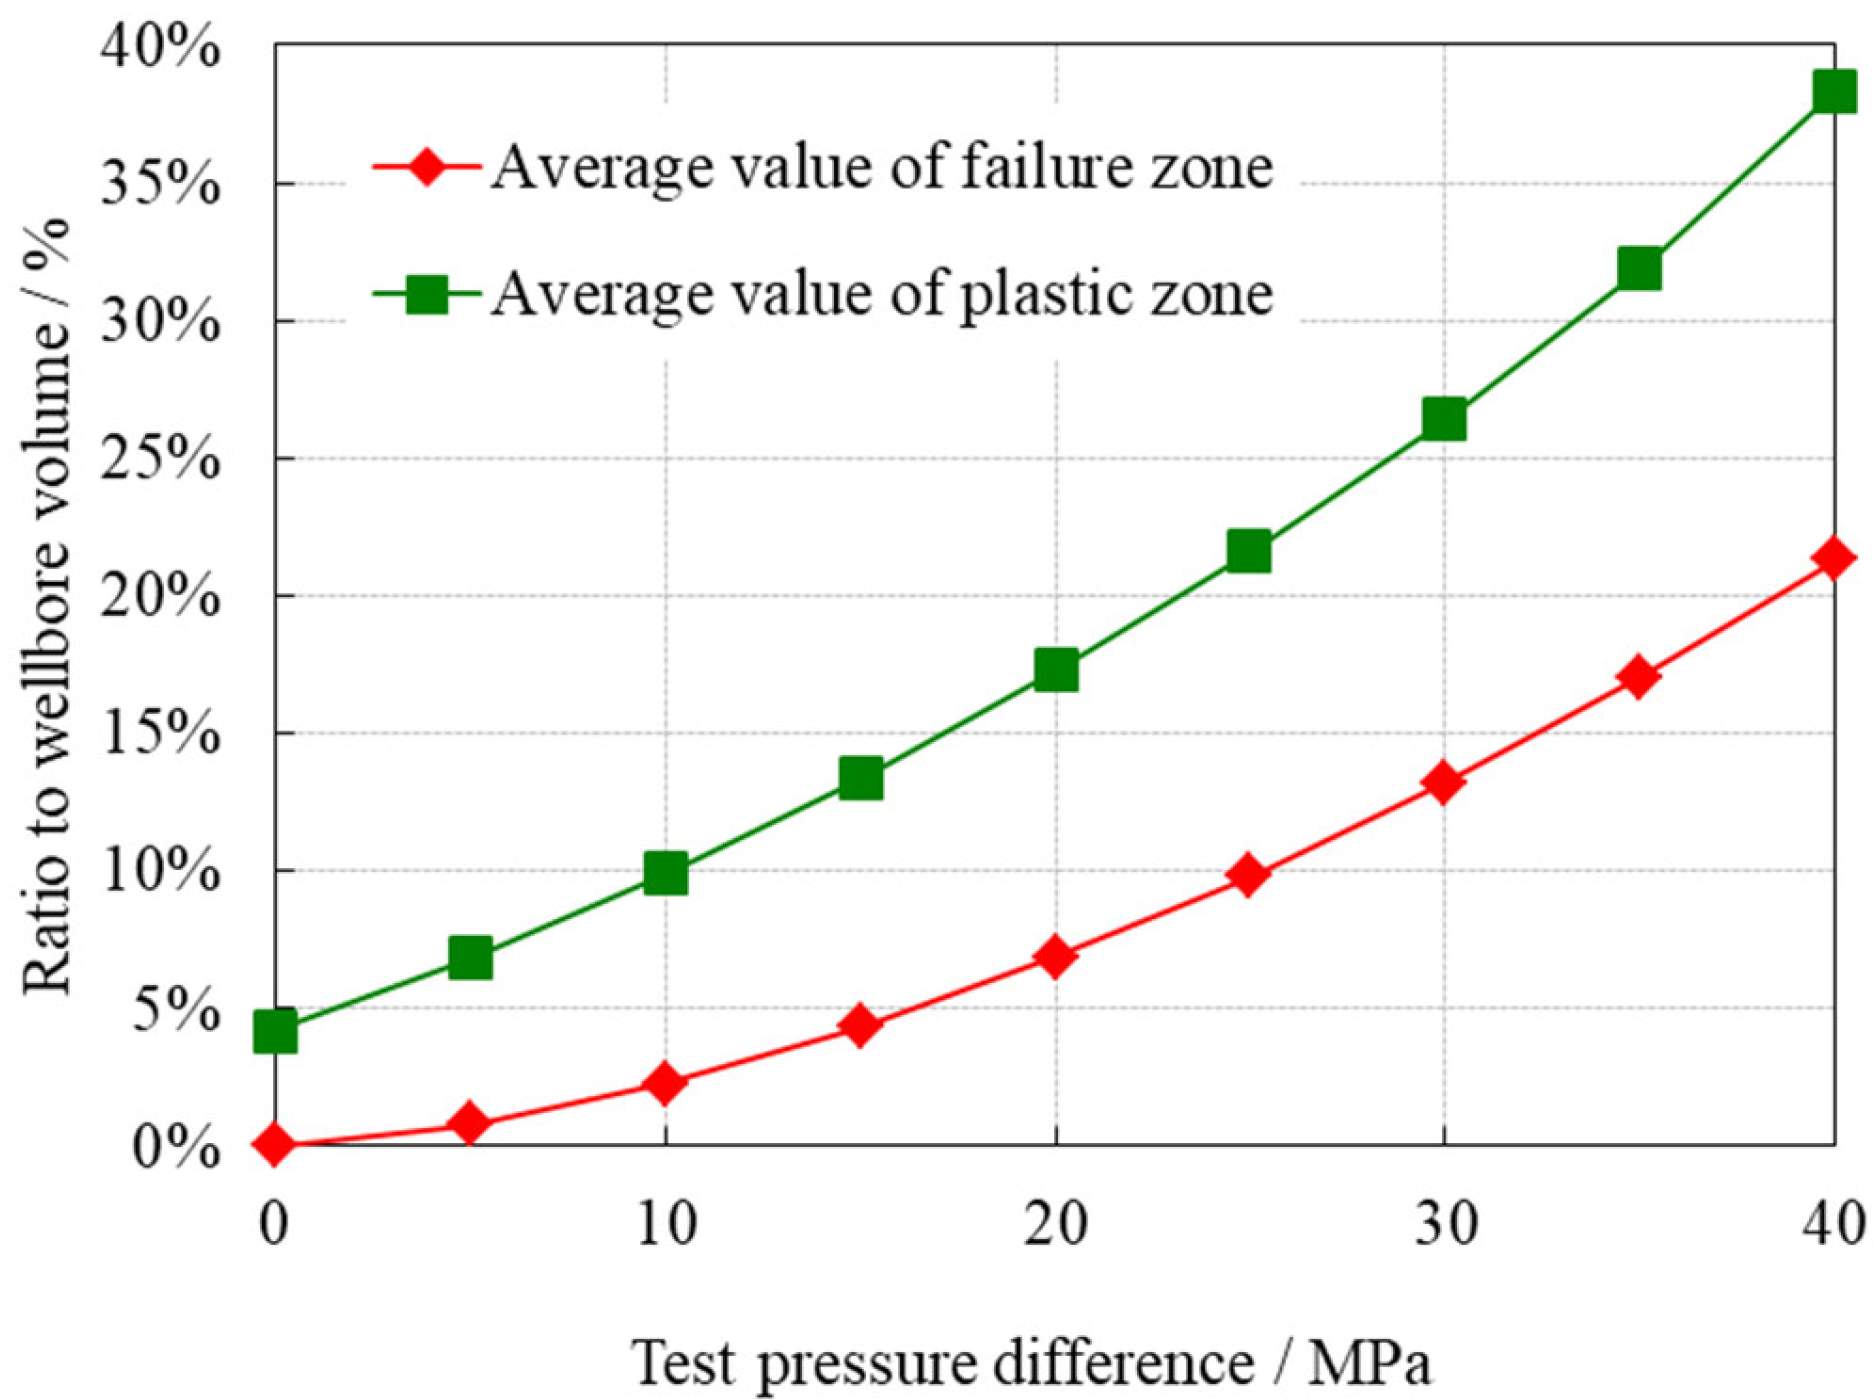
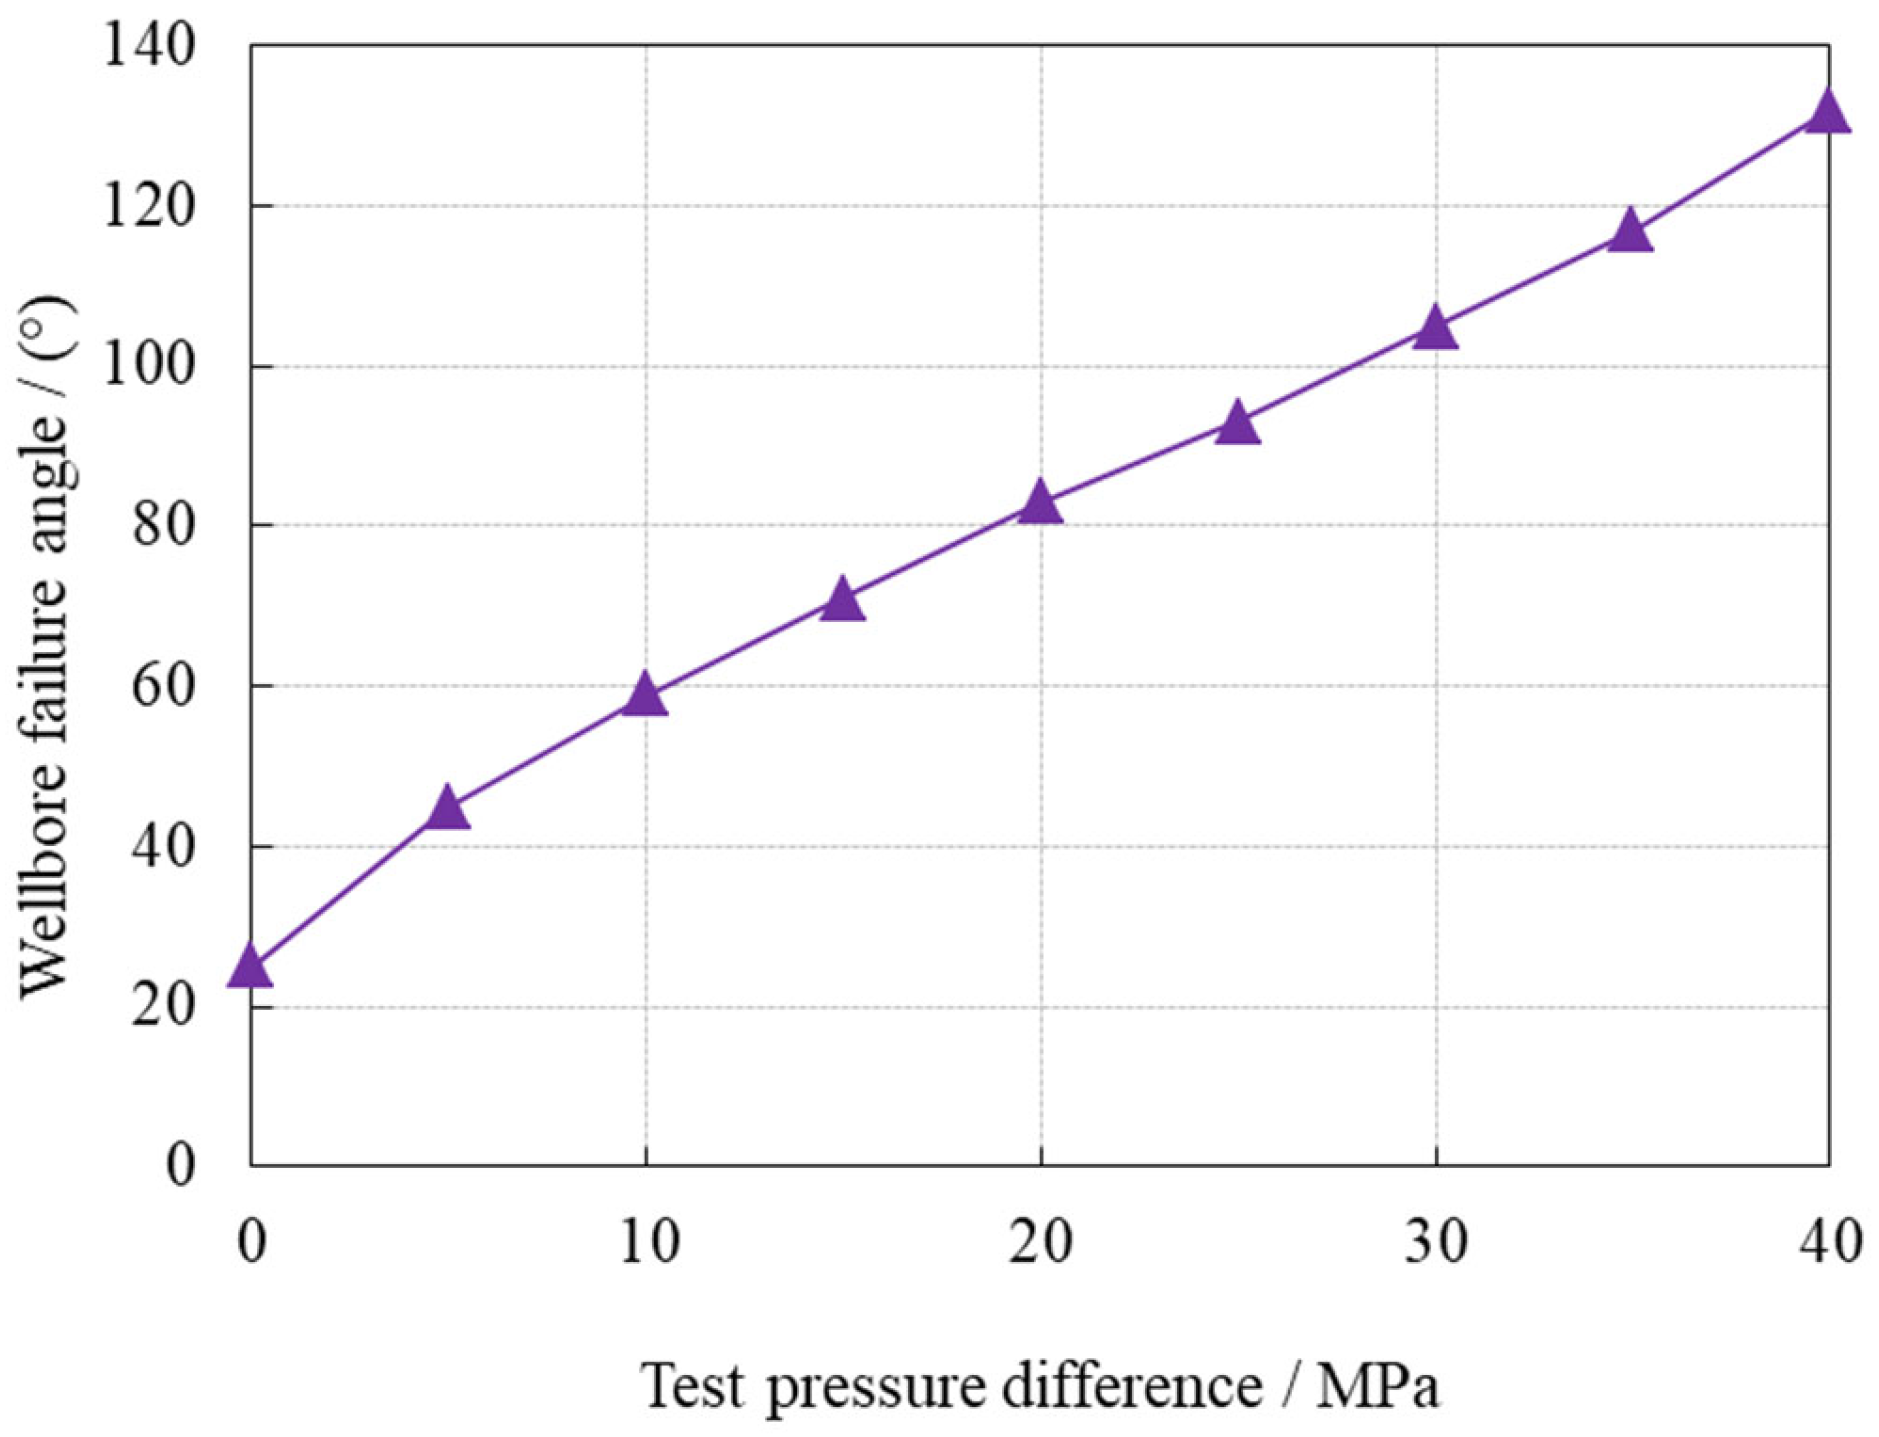
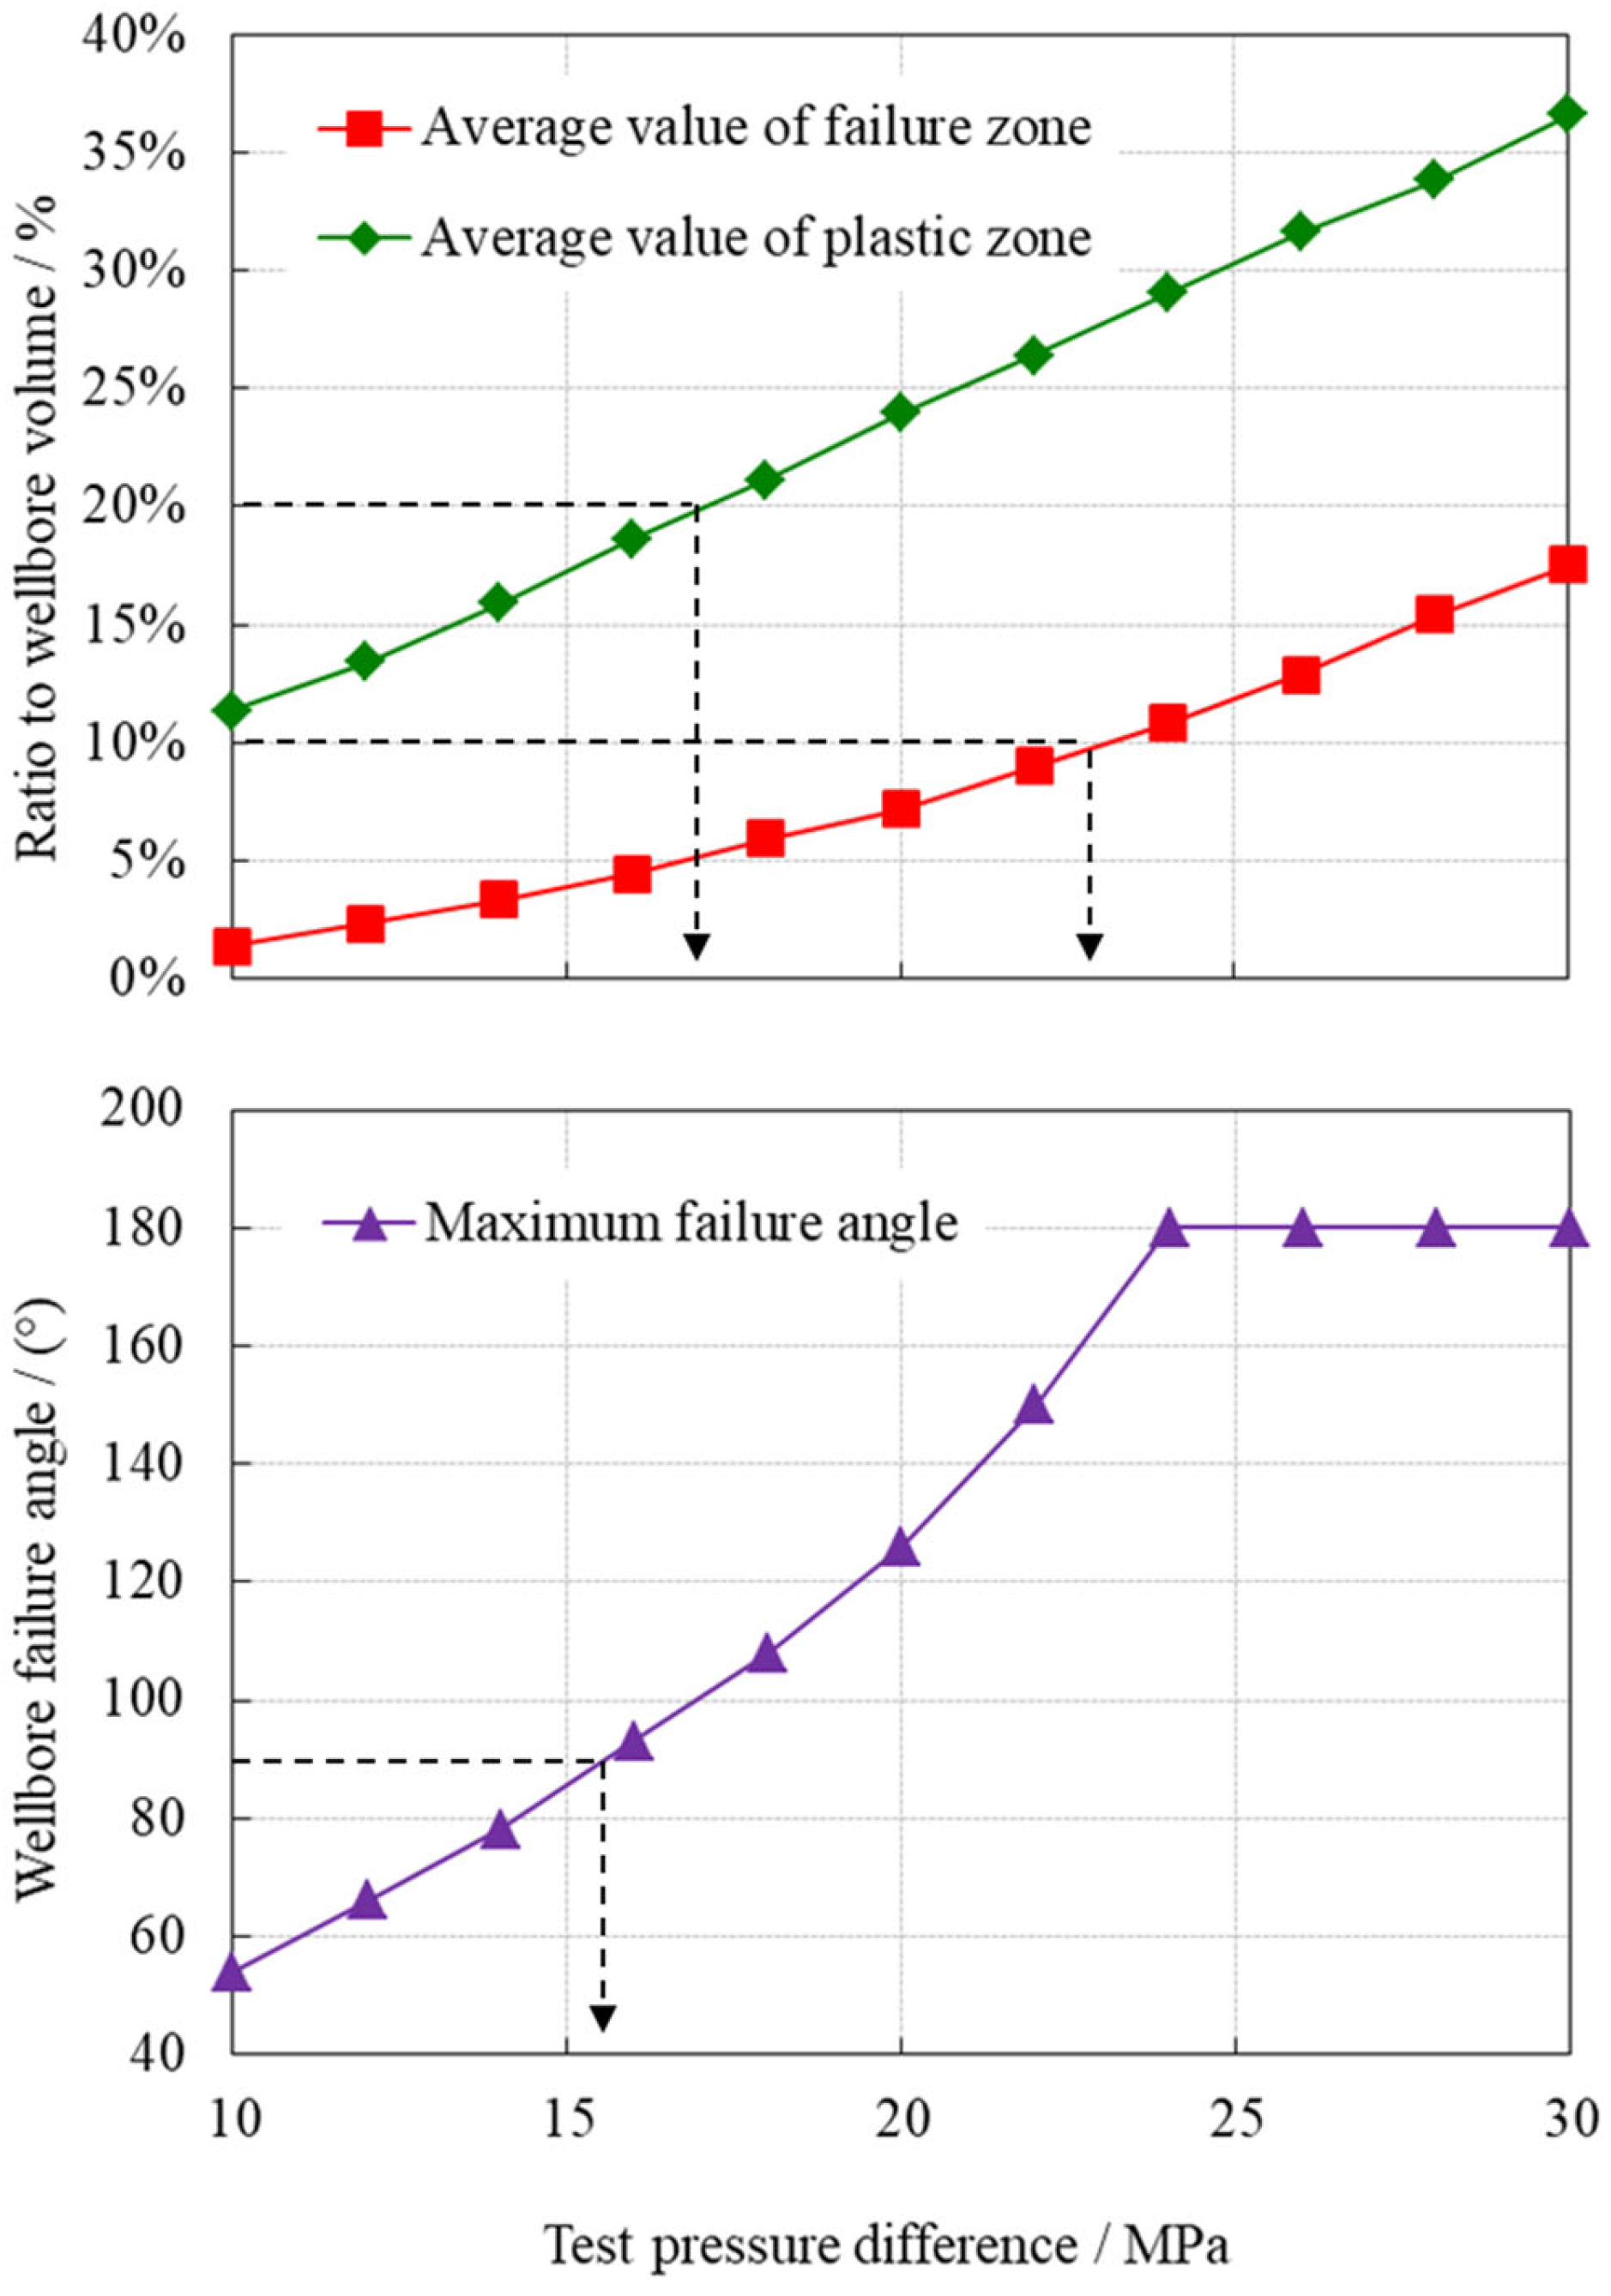
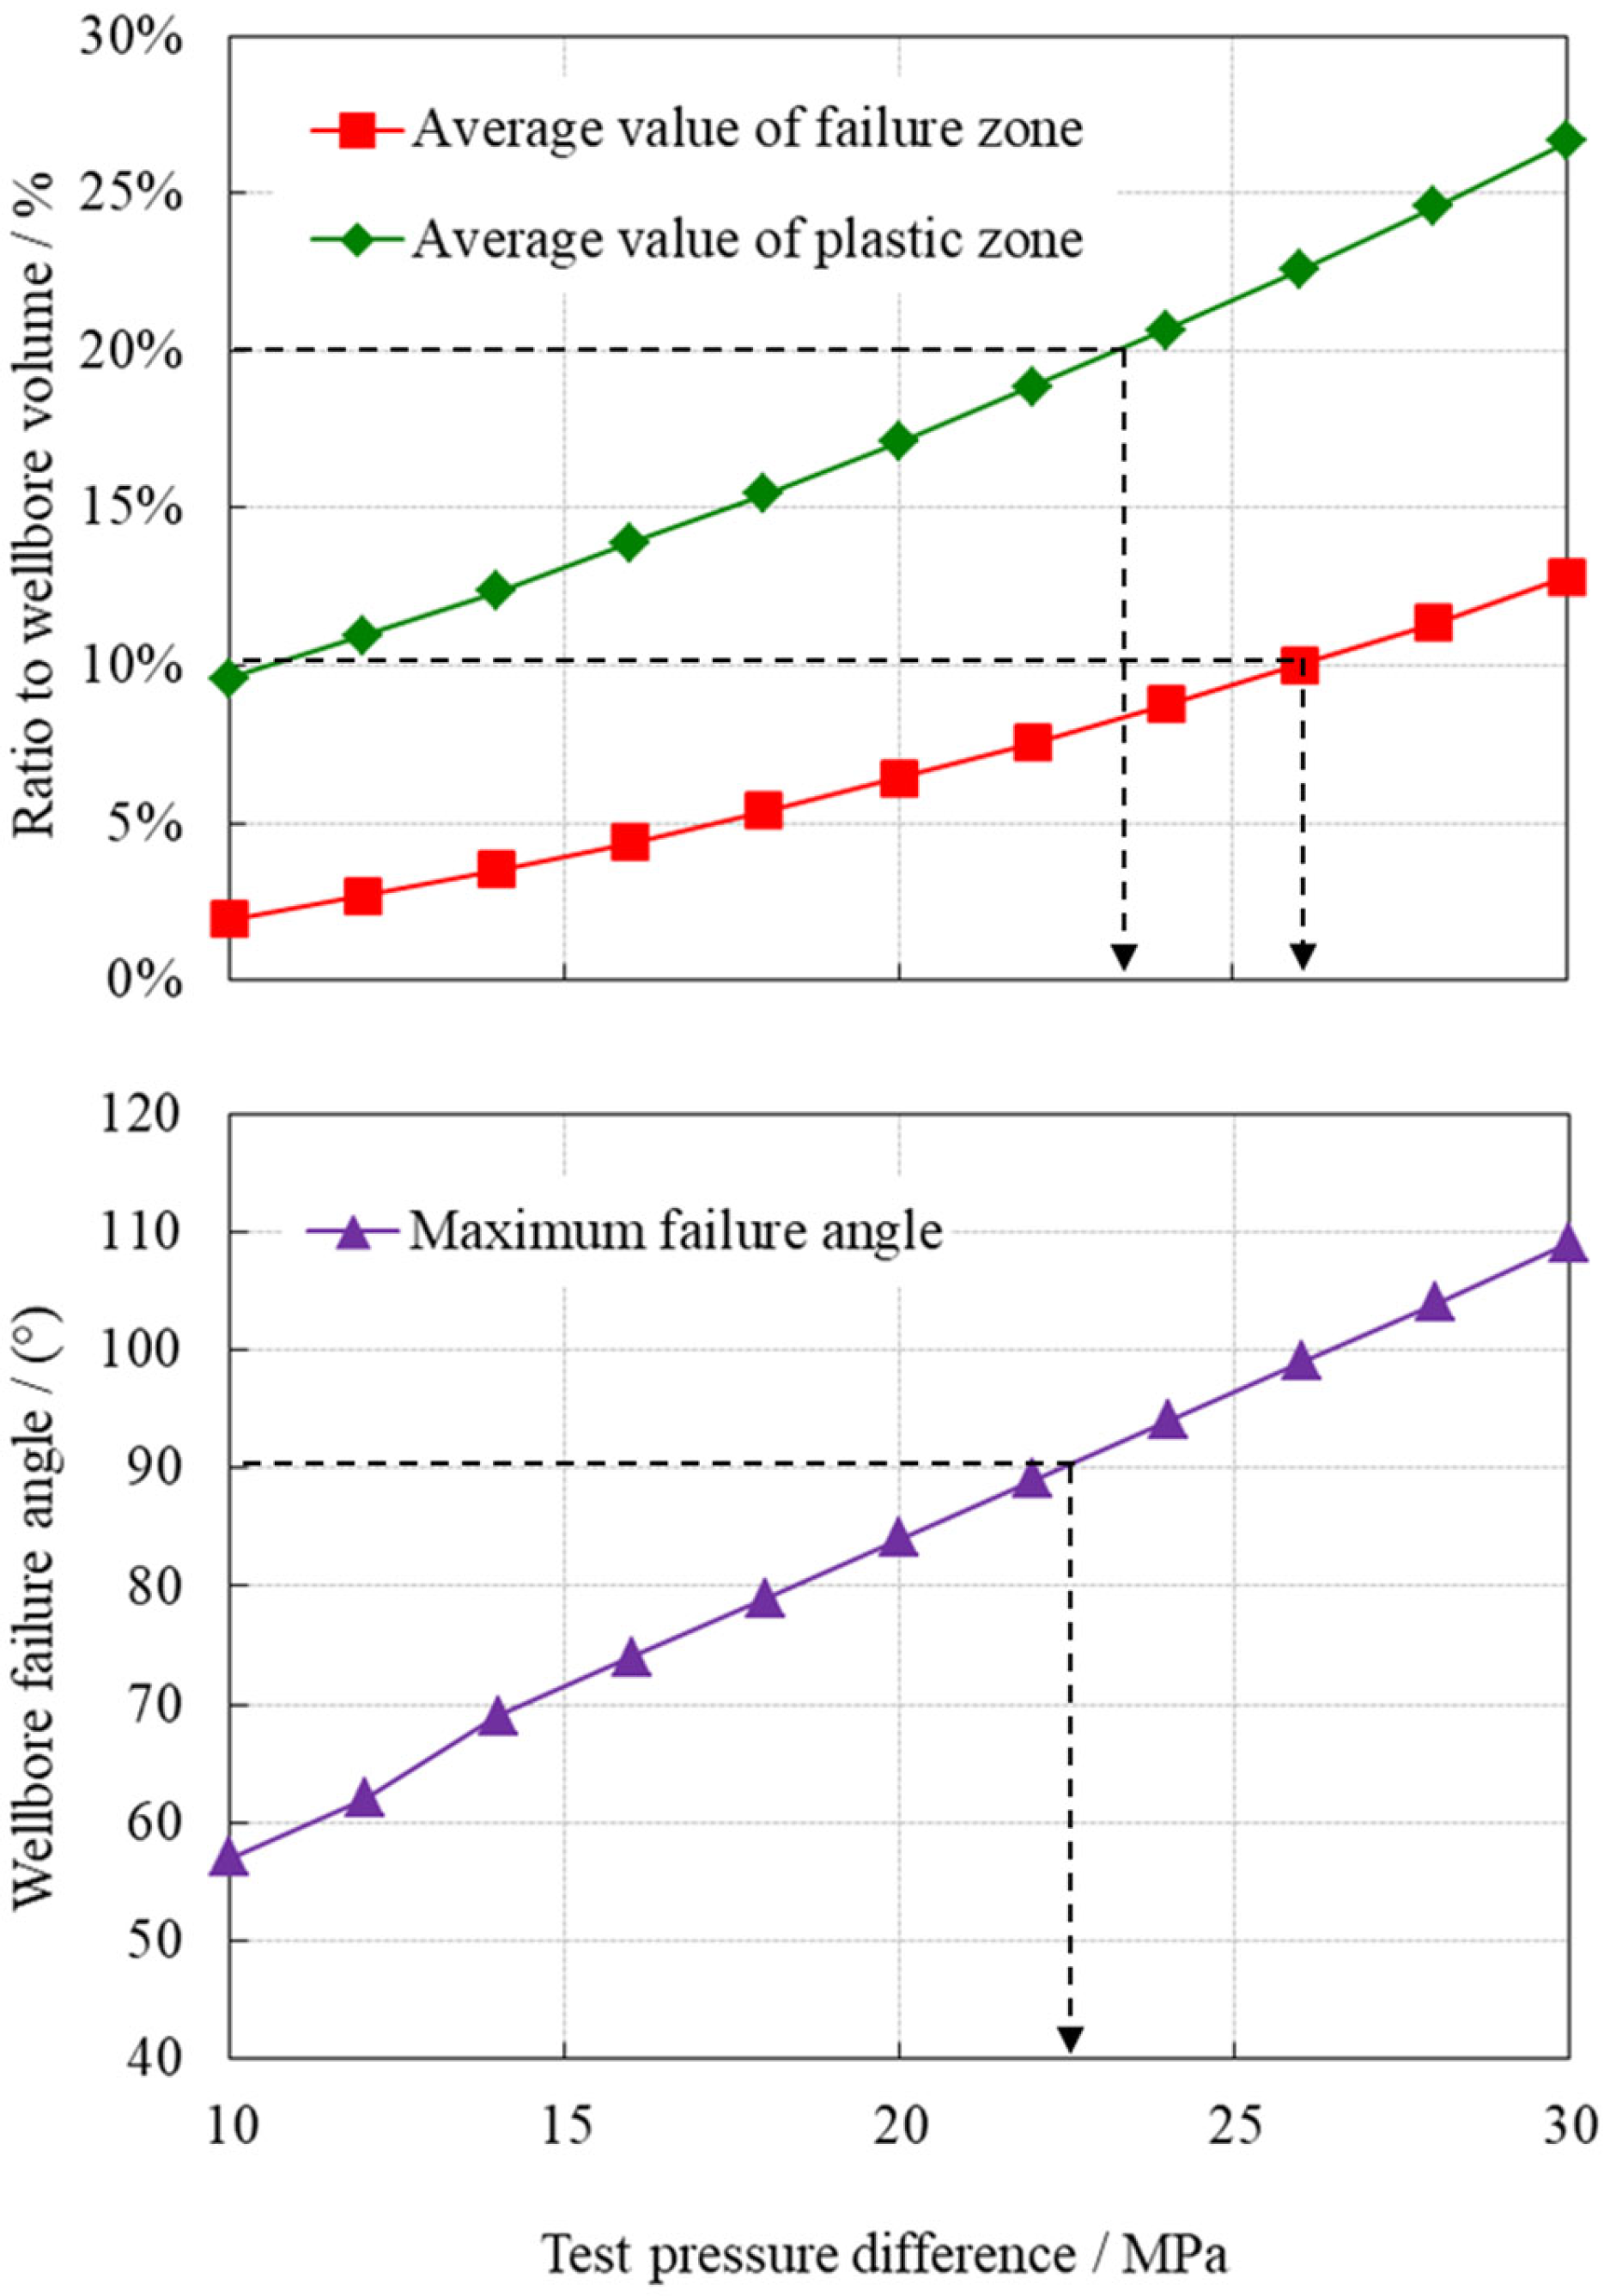
4. Determination of Limit Test Pressure Differential

In the actual testing, maintaining the hundreds-of-meters-long rock surrounding the wellbore in a uniformly safe elastic or plastic state is fraught with challenges, given the along-axis heterogeneity of the formation. It is pragmatically tolerated for isolated segments of the wellbore to encounter localized wall collapse, provided the collapse remains within manageable limits and does not compromise the overarching safety of the horizontal open-hole section.
Domestic and international researchers alike have delved into wellbore stability issues on localized wall collapse. Hawkes and McLellan postulated that wellbore instability was highly probable when the plastic zone circumference twice exceeded the wellbore’s cross-sectional area [10]. Conversely, Zoback and Ma inferred that wellbore stability prevailed until the failure angle surpassed 90°, beyond which the collapse progressed uncontrollably, triggering instability [11,12]. While these perspectives find credence in selected engineering datasets, they are confined to instability at discrete points within a well section under plane strain assumptions, inadequately addressing the comprehensive wellbore instability dynamics encountered in practical testing.
Consequently, building upon methodologies alluded to in references [10,11,12], a novel approach was devised to scrutinize the open-hole wellbore wall condition as a function of depth, thereby facilitating the determination of a critical test pressure differential. This innovative method entails quantifying the extent of the elastic, plastic, and post-failure residual zones adjacent to the wellbore throughout the testing phase, alongside estimating the magnitude of the failure angle along the wellbore perimeter. A scenario wherein the test pressure differential is substantial, accompanied by excessive fractions of the plastic and failure zones, coupled with a pronounced failure angle on the wellbore wall, is indicative of an unsafe testing environment.
Considering the reservoir interval spanning 7350 m to 7600 m in a vertical well as a case study, Figure 6 and Figure 7 illustrate, respectively, the variations in the ratios of the failure zone volume, plastic zone volume to the wellbore volume, and the dependency of the wellbore wall failure angle on depth under differing test pressure differentials. Longitudinally, the reservoir exhibits a depth-dependent dichotomy characterized by frail strata susceptible to failure intermixed with robust, resilient layers. This stratigraphic heterogeneity gives rise to localized formation collapse at specific differential pressures, whereas other strata maintain stability. In the lateral context, increments in the test pressure differential correlate with proportional escalations in the plastic zone extent, the ratio of failure zone volume to wellbore volume, and the wellbore collapse angle. Delineating the threshold of wellbore failure is pivotal for ascertaining the maximum tolerable test pressure differential.
Based on the analysis of actual test data from the well, the maximum test pressure differential is approximately 20 MPa, and no significant wellbore instability issues have been observed. According to the calculation results, when the test pressure differential is 20 MPa, the ratio of the plastic zone volume to wellbore volume is generally within 20%, and the ratio of the failure zone volume to the wellbore rock volume is within 10%. The majority of well sections have a wellbore wall failure angle smaller than 80°, which is consistent with the criterion mentioned in references [11,12] stating that the well wall failure angle should be smaller than 90°. By using the wellbore wall state analysis method proposed in Section 2, the average ratio of the plastic zone, failure zone to wellbore volume, and the maximum failure angle on the wellbore wall concerning the test pressure differential were calculated, as shown in Figure 8 and Figure 9. The results indicate that the variation trend of the plastic zone and failure zone around the wellbore with test pressure differential is nonlinear, with an accelerating increase as the pressure differential increases. However, the wellbore wall failure angle increases linearly with the test pressure differential. Therefore, considering the three factors directly related to the instability of the open-hole testing well, the following three criteria are proposed to maintain wellbore stability during the testing process:
  • The average ratio of the failure zone volume to wellbore volume should be less than 10%;
  • The average ratio of the plastic zone volume to wellbore volume should be less than 20%;
  • The maximum failure angle on the wellbore wall should be less than 90°.
Breach of any of these three criteria signifies uncontrolled wellbore collapse, potentially leading to extensive instability and compromising the safety of the testing operation.
According to the calculation results of Figure 8 and Figure 9, when the average ratio of the volume of the damage zone around the borehole to the volume of the borehole is less than 10%, the corresponding test pressure differential is less than 25.3 MPa; when the average ratio of the plastic zone volume around the borehole to the borehole volume is less than 20%, the corresponding test pressure differential is less than 23.2 MPa. When the maximum angle of the failure zone on the borehole wall is less than 90°, the corresponding test pressure differential is less than 23.5 MPa. Therefore, the limit test pressure differential of the vertical well section is 23.2 MPa.

5. Field Application Examples

The basic parameters of the reservoir section of Well S1-4 located in an ultra-deep carbonate reservoir are shown in Table 3. The open hole length of the reservoir section is about 730 m, which is a highly deviated well with a maximum deviation angle of about 66°. The drilling azimuth is N270° E, which is located between the horizontal maximum principal stress and the horizontal minimum principal stress, and the angle with the horizontal maximum principal stress is about 60°.
According to the parameters of the reservoir intervals in Well S1-4, the volume ratio of the plastic zone and failure zone near the wellbore and the wellbore volume, as well as the maximum failure angle on the wellbore wall, were calculated under different test pressure differentials, as shown in Figure 10. Based on the three criteria for maintaining wellbore stability during testing, the volume ratio of the failure zone to the wellbore volume should not exceed 10%, with a test pressure differential below 23.1 MPa. The volume ratio of the plastic zone to the wellbore volume should not exceed 20%, with a test pressure differential below 17.1 MPa. To ensure that the maximum failure angle on the wellbore wall does not exceed 90°, the test pressure differential should be below 15.6 MPa. Based on comprehensive judgment, the maximum test pressure differential for the reservoir interval in Well S1-4 is 15.6 MPa.
Well S1-4 was completed by an open hole with a hole diameter of 149.2 mm. To fully release the production capacity, the maximum test pressure differential reaches 30 MPa, which is significantly higher than the calculated maximum test pressure differential of 15.6 MPa. During the actual testing process, a mixture of cuttings and fluids blocked the oil choke, causing the pressure gauge reading to drop from the initial 40 MPa to 0. When the testing string was pulled out, it was discovered that five oil tubes at the bottom were blocked by debris, indicating wellbore collapse and instability, consistent with the engineering situation and model calculation results.
In the subsequent operation of the reservoir, the same model was used to theoretically analyze the ultimate test pressure differential of Well S5-6. The main parameters of the well are shown in Table 4. The length of the open-hole section is about 406 m; the maximum deviation angle is 44.5°, and the drilling azimuth is located at N40°–45° E, which is close to the direction of the horizontal maximum principal stress.
Figure 11 shows the variations in the volume ratio of the plastic zone and failure zone near the wellbore and the maximum failure angle on the wellbore wall with the test pressure differential in the reservoir interval of Well S5-6. According to the calculation results, to maintain the volume ratio of the failure zone to the wellbore volume below 10%, the test pressure differential should be below 26.0 MPa. To maintain the volume ratio of the plastic zone to the wellbore volume below 20%, the test pressure differential should be below 23.3 MPa. To ensure that the maximum failure angle on the wellbore wall does not exceed 90°, the test pressure differential should be below 22.4 MPa. Based on comprehensive judgment, the maximum test pressure differential for the reservoir interval in Well S5-6 is 22.4 MPa.
In adherence to the reservoir development plan’s stipulations, Well S5-6 was designed with a maximum test pressure differential of circa 25 MPa, marginally exceeding the computed threshold of 22.4 MPa. To guarantee subterranean safety throughout the testing phase, perforated liners were strategically deployed within the open hole section to bolster the wellbore’s integrity and avert extensive collapses. Implementation of these perforated liners as a protective measure effectively ensured that the actual testing proceedings unfolded without any safety incidents.

6. Discussion

  • This study proposes three criteria for maintaining wellbore stability during testing: (i) the average ratio of the total plastic zone volume in the open-hole section to the wellbore volume should not exceed 20%; (ii) the average ratio of the failure zone volume to the wellbore volume must remain under 10%; and (iii) the maximum failure angle on the wellbore wall should be less than 90°. Each criterion approaches defining the critical drawdown pressure from a distinct perspective and with varied considerations, reflecting differing margins of safety. The disparities among these criteria stem from their varied emphasis on the mechanisms of wellbore failure; the first criterion prioritizes accumulated plastic deformation, while the second and third directly address the extent and morphology of failure occurrences. Consequently, due to their divergent focuses and definitions, discrepancies exist in the numerically determined critical pressure differences according to these three criteria. Practically, to ensure wellbore stability, the minimum value among these is often adopted as the limiting figure. This conservative approach acknowledges the complexity of wellbore stability assessment and aims to mitigate risk during operational implementation;
  • The proposed stability criteria for open-hole sections, derived from carbonate reservoir mechanics and borehole stress profiles, show broad applicability in the study area. These criteria can serve as a foundation for other lithologies with necessary adaptations. Sandstone applications require a focus on granular stresses, structure stability, and sensitivity issues while accounting for brittle fracture tendencies. Shale stability assessment necessitates significant adjustments, emphasizing water content, swelling pressures, and plastic deformation, indicating fundamental differences from carbonate-based criteria.

7. Conclusions

  • The analysis of stress distributions in deep carbonate reservoirs during open-hole testing has been conducted, employing principles of elasticity theory. It revealed a dichotomy in wellbore angles influenced by stress anisotropy: those oriented toward lesser differential stresses, deemed safe, and those aligned with higher differentials, posing a risk;
  • Laboratory rock mechanics assays were instrumental in delineating the failure attributes and mechanical characteristics of carbonate reservoirs. Deep carbonate core specimens displayed brittle fracture under reduced confining pressures, transitioning to marked plastic behavior en route to peak strength at elevated pressures, and retained considerable residual strength post-failure;
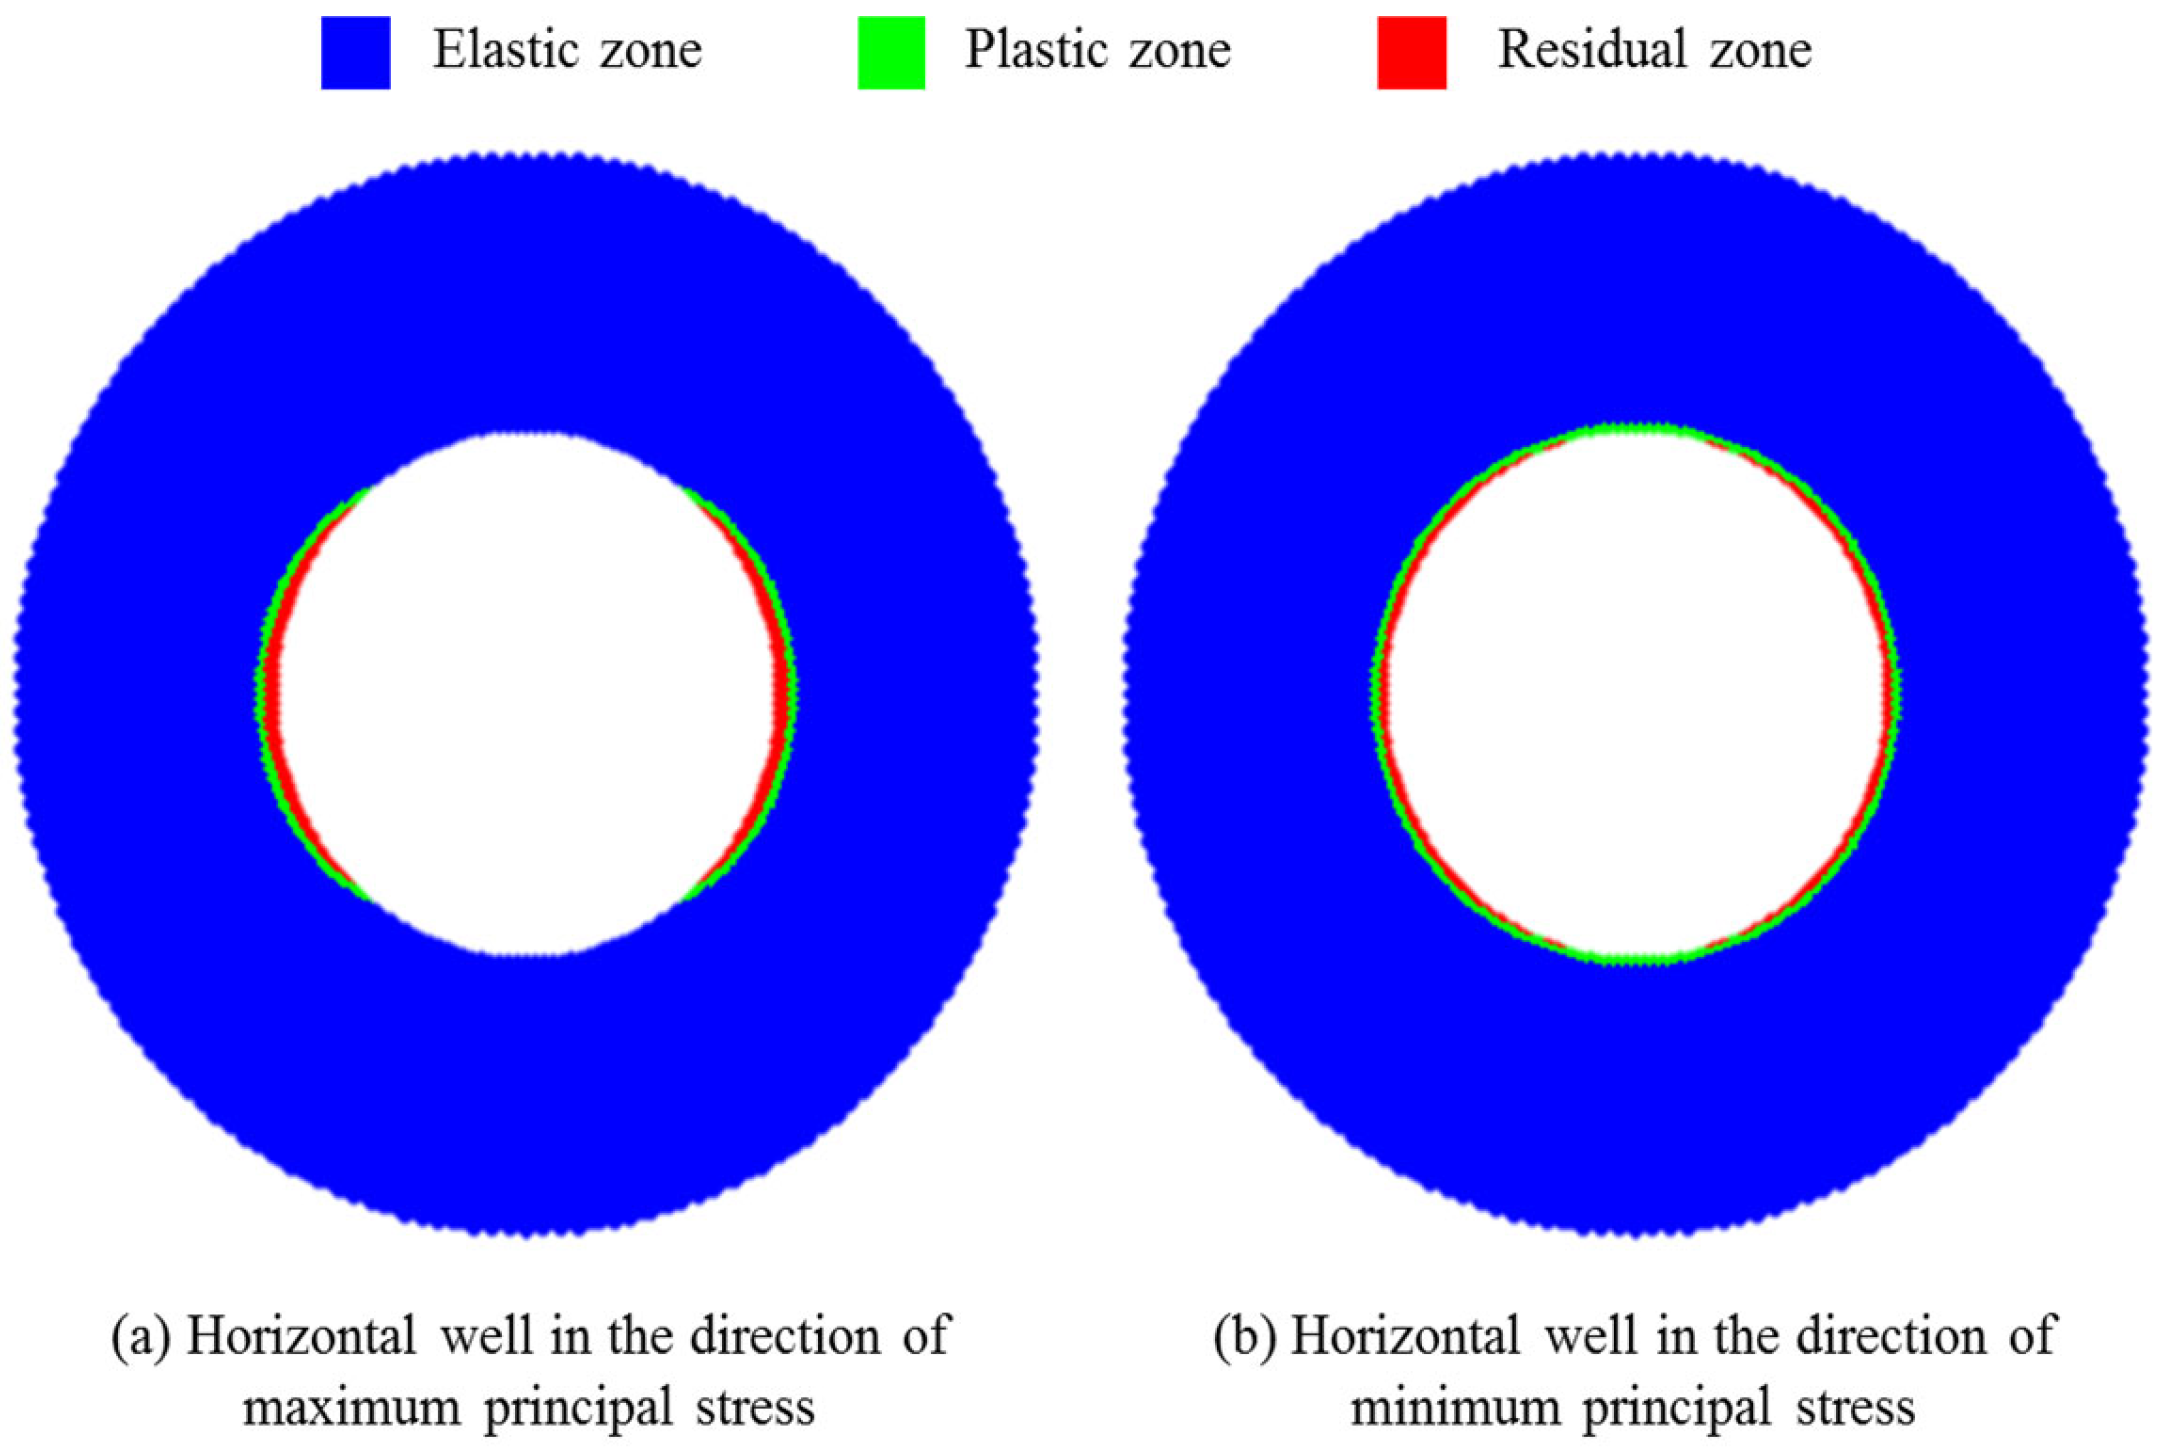
  • Incorporating the peak, yield, and residual strength profiles of carbonate rocks, the zones surrounding the wellbore were delineated into elastic, plastic, and residual failure regions, guided by the Mohr–Coulomb criterion. The transition of the adjacent rocks into the residual failure regime signifies impending wellbore collapse and block detachment;
  • To establish the analysis method for the limit testing pressure differential, we used criteria such as the ratio of the total volume of the plastic region to the wellbore volume not exceeding 20%, the ratio of the volume of the failure region to the wellbore volume not exceeding 10%, and the maximum failure angle of the wellbore of less than 90°. Implemented in ultra-deep carbonate reservoir field settings, this approach yielded congruent and satisfactory outcomes, affirming its alignment with practical engineering realities.

Author Contributions

Methodology, L.W. and Q.T.; validation, L.W. and P.S.; formal analysis, Q.T. and P.S.; investigation, Q.T.; data curation, L.W., P.S., and K.L.; writing—original draft, Q.T.; writing—review and editing, K.L. and N.H.; visualization, Q.T. and N.H.; project administration, L.W. and P.S.; funding acquisition, L.W. All authors have read and agreed to the published version of the manuscript.

Funding

This research was funded by Research on Key Technologies for Drilling and Completing of Ultra-deep Wells in the Shunbei Block (key project of Sinopec Northwest Oilfield Branch, No. 34400007-21-ZC0607-0199) and Research and Engineering Application of Key Technologies for Completion and Reconstruction of 10000m Deep Wells in Tarim Basin (Project of Sinopec Ministry of Science and Technology, No. P24157).

Institutional Review Board Statement

Not applicable.

Informed Consent Statement

Not applicable.

Data Availability Statement

Data are contained within this article.

Conflicts of Interest

Authors Long Wang and Peng Su were employed by the company Northwest Oil-field Branch of China Petrochemical Corporation. The remaining authors declare that the research was conducted in the absence of any commercial or financial relationships that could be construed as a potential conflict of interest. The authors declare that this study received funding from China Petrochemical Corporation. The funder was not involved in the study design, collection, analysis, interpretation of data, the writing of this article or the decision to submit it for publication.

References

  1. Kang, Z.; Li, Y.; Ji, B.; Zhang, Y. Key technologies for EOR in fractured-vuggy carbonate reservoirs. Oil Gas Geol. 2020, 41, 434–441. [Google Scholar]
  2. Dai, C.; Fang, J.; Jiao, B. Development of the research on EOR for carbonate fractured-vuggy reservoirs in China. J. China Univ. Pet. (Ed. Nat. Sci.) 2018, 42, 67–78. [Google Scholar]
  3. Li, Y. The theory and method for development of carbonate fractured-cavity reservoirs in Tahe oilfield. ACTA Pet. Sin. 2013, 34, 115–121. [Google Scholar]
  4. Jiao, F. Significance and prospect of ultra-deep carbonate fault-karst reservoirs in Shunbei area, Tarim basin. Oil Gas Geol. 2018, 39, 207–216. [Google Scholar]
  5. Li, X.; Feng, Y.; El Mohtar, C.S. Transient modeling of borehole breakouts: A coupled thermo-hydro-mechanical approach. J. Pet. Sci. Eng. 2019, 172, 1014–1024. [Google Scholar] [CrossRef]
  6. Xiao, Z.; Jia, S.; Qi, X. Hydraulic-mechanical-chemical coupling evaluation for progressive failure of hard brittle shale wellbore. J. Cent. South Univ. (Sci. Technol.) 2019, 50, 2464–2480. [Google Scholar]
  7. Jin, Y.; Chen, M. Wellbore Stability Mechanics; Science Press: Beijing, China, 2012; pp. 11–14. [Google Scholar]
  8. Yang, G. Introduction to Elasticity and Plasticity; Tsinghua University Press: Beijing, China, 2004; pp. 20–25. [Google Scholar]
  9. Cheng, L. Advanced Seepage Mechanics; Petroleum Industry Press: Beijing, China, 2011; p. 173. [Google Scholar]
  10. McLellan, P.; Hawkes, C. Borehole stability analysis for underbalanced drilling. J. Can. Pet. Technol. 2001, 40, 31–38. [Google Scholar] [CrossRef]
  11. Zoback, M.D. Reservoir Geomechanics; Cambridge University Press: Cambridge, Britain, 2007; pp. 135–137. [Google Scholar]
  12. Ma, T.; Chen, P.; Yang, C. Wellbore stability analysis and well path optimization based on the breakout width model and Mogi-Coulomb criterion. J. Pet. Sci. Eng. 2015, 135, 678–701. [Google Scholar] [CrossRef]
Figure 1. The effective stress distribution around the borehole of open-hole test in horizontal well.
Applsci 14 05676 g001
Figure 2. Full-size core photos of deep carbonate rocks.
Applsci 14 05676 g002
Figure 3. Test stress–strain curves under different confining pressures.
Applsci 14 05676 g003
Figure 4. Linear fitting results of deep carbonate rock strength parameters.
Applsci 14 05676 g004
Figure 5. The calculation results of horizontal wellbore state in different directions.
Applsci 14 05676 g005
Figure 6. The percentage curves of plastic zone and failure zone to borehole volume under different test pressure differentials.
Applsci 14 05676 g006
Figure 7. The failure angle curve of wellbore under different test pressure differential.
Applsci 14 05676 g007
Figure 8. The average ratio of plastic zone, failure zone to borehole volume varies with the test pressure differential.
Applsci 14 05676 g008
Figure 9. Variation in the maximum failure angle on the wellbore with the test pressure differential.
Applsci 14 05676 g009
Figure 10. The variation in the failure zone around the wellbore, the volume ratio of the plastic zone to the wellbore, and the failure angle of the wellbore with the test pressure differential in the reservoir section of Well S1-4.
Applsci 14 05676 g010
Figure 11. The variation in the failure zone around the wellbore, the volume ratio of the plastic zone to the wellbore, and the failure angle of the wellbore with the test pressure differential in the reservoir section of Well S5-6.
Applsci 14 05676 g011
Table 1. Characteristics and test parameters of a carbonate reservoir.
ParameterValue
Vertical depth/m7735
Pore pressure/MPa89.0
Overburden pressure/MPa185.6
Max horizontal principal stress/MPa193.4
Min horizontal principal stress/MPa135.4
Effective stress coefficient0.6
Poisson’s ratio of formation0.20
Viscosity/mPa·s3.06
Fracture permeability/mD1.44
Reservoir thickness/m100
Coefficient of compressibility/MPa−10.41 × 10−4
Reservoir porosity/%0.6
Testing time/h72
Table 2. Compressive strength test data of deep carbonate rock.
Confining Pressure (MPa)Plastic Yield Strength (MPa)Peak Strength (MPa)Residual Strength (MPa)
049.252.224.9
20147.0172.8144.0
30215.1251.8224.7
50305.4357.0331.8
Table 3. Basic parameter Table of reservoir section of Well S1-4.
ParameterValue
Vertical depth/m7655–8124
Measured depth/m7655–8385
Maximum deviation angle/(°)65.85
Borehole azimuth/(°)270
Pore pressure/MPa84.2–89.4
Overburden pressure/MPa183.5–196.2
Maximum horizontal principal stress/MPa169.3–181.7
Minimum horizontal principal stress/MPa126.3–135.9
Effective stress coefficient0.6
Plastic yield strength/MPa58.9–71.6
Peak strength/MPa63.0–80.5
Table 4. Basic parameter Table of reservoir section of Well S5-6.
ParameterValue
Vertical depth/m7478–7839.6
Measured depth/m7478–7884
Maximum deviation angle/(°)44.5
Borehole azimuth/(°)40–45
Pore pressure/MPa81.5–91.7
Overburden pressure/MPa173.7–183.5
Maximum horizontal principal stress/MPa175.5–192.3
Minimum horizontal principal stress/MPa122.5–151.3
Effective stress coefficient0.6
Plastic yield strength/MPa53.9–72.8
Peak strength/MPa56.3–82.2
Disclaimer/Publisher’s Note: The statements, opinions and data contained in all publications are solely those of the individual author(s) and contributor(s) and not of MDPI and/or the editor(s). MDPI and/or the editor(s) disclaim responsibility for any injury to people or property resulting from any ideas, methods, instructions or products referred to in the content.

