Article

Wearable Voice Dosimetry System

by
Marcos Llorente
1,
Adam Podhorski
2 and
Secundino Fernandez
1,3,*
1
Medical Engineering Laboratory, School of Medicine, University of Navarra, 31080 Pamplona, Spain
2
Department of Biomedical Engineering and Sciences, Tecnun, University of Navarra, Manuel Lardizábal 13, 20018 Donostia-San Sebastián, Spain
3
Voice Laboratory, Department of Ear, Nose and Throat, Clinica Universidad de Navarra, 31080 Pamplona, Spain
*
Author to whom correspondence should be addressed.
Appl. Sci. 2024, 14(13), 5806; https://doi.org/10.3390/app14135806
Submission received: 19 April 2024 / Revised: 30 May 2024 / Accepted: 18 June 2024 / Published: 3 July 2024
(This article belongs to the Special Issue Speech and Language Technology Applied to Speech Impediment Therapy)

Abstract

:
The objective quantification of voice acoustic parameters is used for the diagnosis, monitoring, and treatment of voice disorders. Such assessments are carried out with specialised equipment within the doctor’s office. The controlled conditions employed are usually not those of the real environment of the patient. The results, although very informative, are specific to those measurement conditions and to the time when they were performed. A wearable voice monitoring system, based on an accelerometer to ensure the message, can overcome these limitations. We present a miniaturised, low-power, and low-cost wearable system to estimate and record voice fundamental frequency (F0), intensity and phonation time for long intervals in the everyday environment of the patient. It was tested on two subjects for up to two weeks of recording time. It was possible to identify distinct periods in vocal activity, such as normal, professional, demanding or hyperfunctional. It provided information on the workload that the vocal cords needed to cope with over time and when and to what extent that workload was concentrated. The proposed voice dosimetry system enables the extraction and recording of voice parameters for long periods of time in the everyday environment of the patient, allowing the objectification of vocal risk situations and personalised treatment and monitoring.

1. Introduction

The quantitative assessment of vocal parameters is an essential practice performed by laryngologists and voice researchers for diagnosing and managing phonatory disorders. This process includes measuring aspects like the fundamental frequency (F0 in Hz), intensity (I in decibels Sound Pressure Level, dBSPL), and the acoustic spectrogram among other relevant variables. Typically conducted in specialised voice laboratories within laryngology departments and voice research centres, these analyses are pivotal for identifying risk patterns linked to voice disorders and assessing treatment efficacy. Although these evaluations provide highly specific data, they are confined to particular times and settings that do not necessarily reflect the patient’s everyday environment. The emerging field of personalised medicine emphasises the need for individualised diagnostic and therapeutic approaches, which significantly enhance outcomes in terms of diagnostic precision, therapeutic effectiveness, and overall quality of life. Advances in technology now facilitate continuous, real-time health monitoring—including voice parameters—via increasingly sophisticated yet affordable devices. However, the capability of monitoring vocal parameters over extended periods, particularly for medical and therapeutic applications, remains relatively underdeveloped, despite the prevalence of voice disorders, which affect approximately 6.6% of the working-age population in the United States alone [1,2]. The three primary vocal parameters, fundamental frequency, intensity, and phonation time, are crucial for understanding the health of the vocal apparatus:
-
The variability in F0 is often indicative of an increased vocal load, which occurs when the vocal effort intensifies, potentially leading to organic lesions if not managed with proper technique [3,4,5,6,7,8,9,10];
-
Similarly, an increase in intensity can reflect a prolonged vocal load [3,4,8,9], measurable using sound level meters or accelerometer vibrations [11,12,13];
-
Phonation time, defined as the duration the vocal cords are in motion, is an important metric, particularly in distinguishing between healthy individuals and those with vocal issues [14,15,16].
This paper introduces a novel wearable device designed to monitor these parameters continuously without external hardware, promoting non-invasive, long-term health monitoring in daily settings. The device features onboard signal processing, a compact size for minimal interference, low power consumption suitable for up to 14 days of continuous use, data storage on removable microSD cards, and affordability. Our aim is to provide healthcare professionals and patients with objective data on voice usage for enhanced diagnostic and therapeutic outcomes.

2. Related Work

2.1. Voice Dosimetry Devices

Voice dosimetry devices fall into two main categories: monitoring devices, which record parameters for later analysis, and feedback devices, which analyse signals in real time and provide alerts if certain thresholds are exceeded. Historically, these devices have predominantly used microphones for signal capture, with recent innovations incorporating accelerometers [17,18]. Positioned either in front of the mouth or attached to the skin beneath the larynx, these devices measure fundamental frequency, intensity, and phonation time, among other parameters [19]. A chronological review of these devices reveals (Table 1) that only a few, such as the “Ambulatory Phonation Monitor” (KayPENTAX, Lincoln Park, NJ, USA), VoxLog (Sonvox AB, Umea, Sweden), VocaLog (Griffin Laboratories, Temecula, CA, USA), and Voice-Care (PR.O. VOICE, Turin, Italy), remain on the market. Despite their potential, their use has been largely restricted to research due to high costs ranging from USD 500 to USD 5000 and practical challenges such as size, weight, and sensor attachment [19,20,21,22,23]. These devices measure the basic parameters, and some, like the Ambulatory Phonation Monitor, also calculate additional metrics such as the number of vocal cycles or the travel distance of the vocal cords [20]. The built-in features in devices like VoxLog include ambient noise measurement and intensity self-calibration, aiding in the comprehensive assessment of vocal health and preventing the misuse of the vocal apparatus [21,22,23]. As shown in Table 2, three of the devices that have been commercialised for voice dosimetry measure the three basic parameters.

2.2. Voice Dosimetry Studies

Voice dosimetry studies predominantly focus on professions where vocal demands are significant, such as teaching. These studies help understand the vocal strain associated with these professions and explore potential mitigations.
  • Teachers and Vocal Load: Rantala and Vilkman noted that teachers with frequent vocal fatigue complaints exhibited a higher fundamental frequency (F0) and intensity (I) at the day’s end and week’s end, indicating significant vocal strain [7]. In contrast, Hunter and Titze found that teachers’ vocal usage during work was substantially higher in duration, intensity, and pitch compared to non-working periods. They documented that speaking constituted 29.9% of work hours compared to 12% during rest, with a higher pitch and intensity of about 2.5 dBSPL [45,46];
  • Mitigation Strategies: The use of audio amplification systems has been shown to effectively reduce the vocal load by lowering the need for vocal intensity [8,47,48]. Additionally, classroom acoustics play a crucial role; poor acoustics often lead teachers to increase their voice intensity, further straining their voices [49]. Similarly, a noisy environment forces an increase in voice intensity [50,51];
  • Voice Monitoring and Feedback Systems: McGillivray et al. successfully used a voice response/feedback system in children to achieve and maintain lower intensity levels during speech activities [28]. However, Van Stan et al. noted that without the continuous use of such devices, the learned behaviours were not maintained, indicating the need for regular use [52]. These systems have also been applied to study vocal pauses and their effects on vocal health [53,54];
  • Clinical Applications: Holbrook et al. reported the use of a voice response dosimetry system that helped avoid surgeries by aiding in the recovery of vocal fold pathologies, such as polyps and nodules, through regular monitoring [24]. Similarly, Horii and Fuller observed that short-term orotracheal intubation increased shimmer and jitter in sustained vowels, affecting vocal quality [55];
  • Post-Surgery Voice Rest Monitoring: After laryngeal surgeries, voice rest is crucial. Misono et al. demonstrated that voice dosimetry devices could effectively monitor and enforce voice rest, showing significant reductions in phonation time and intensity [56];
  • Innovative Measurement Techniques: Apart from acoustic signal analysis, other methods like using accelerometers to measure skin vibrations at the larynx provide a non-invasive and privacy-respecting way to assess vocal cord activity during phonation. These measurements can be crucial for diagnosing and prognosticating voice disorders [55,57].
These studies underscore the importance of monitoring and managing vocal load, particularly in vocally demanding professions, to prevent long-term damage and improve vocal health outcomes.

3. Materials and Methods

3.1. System Design

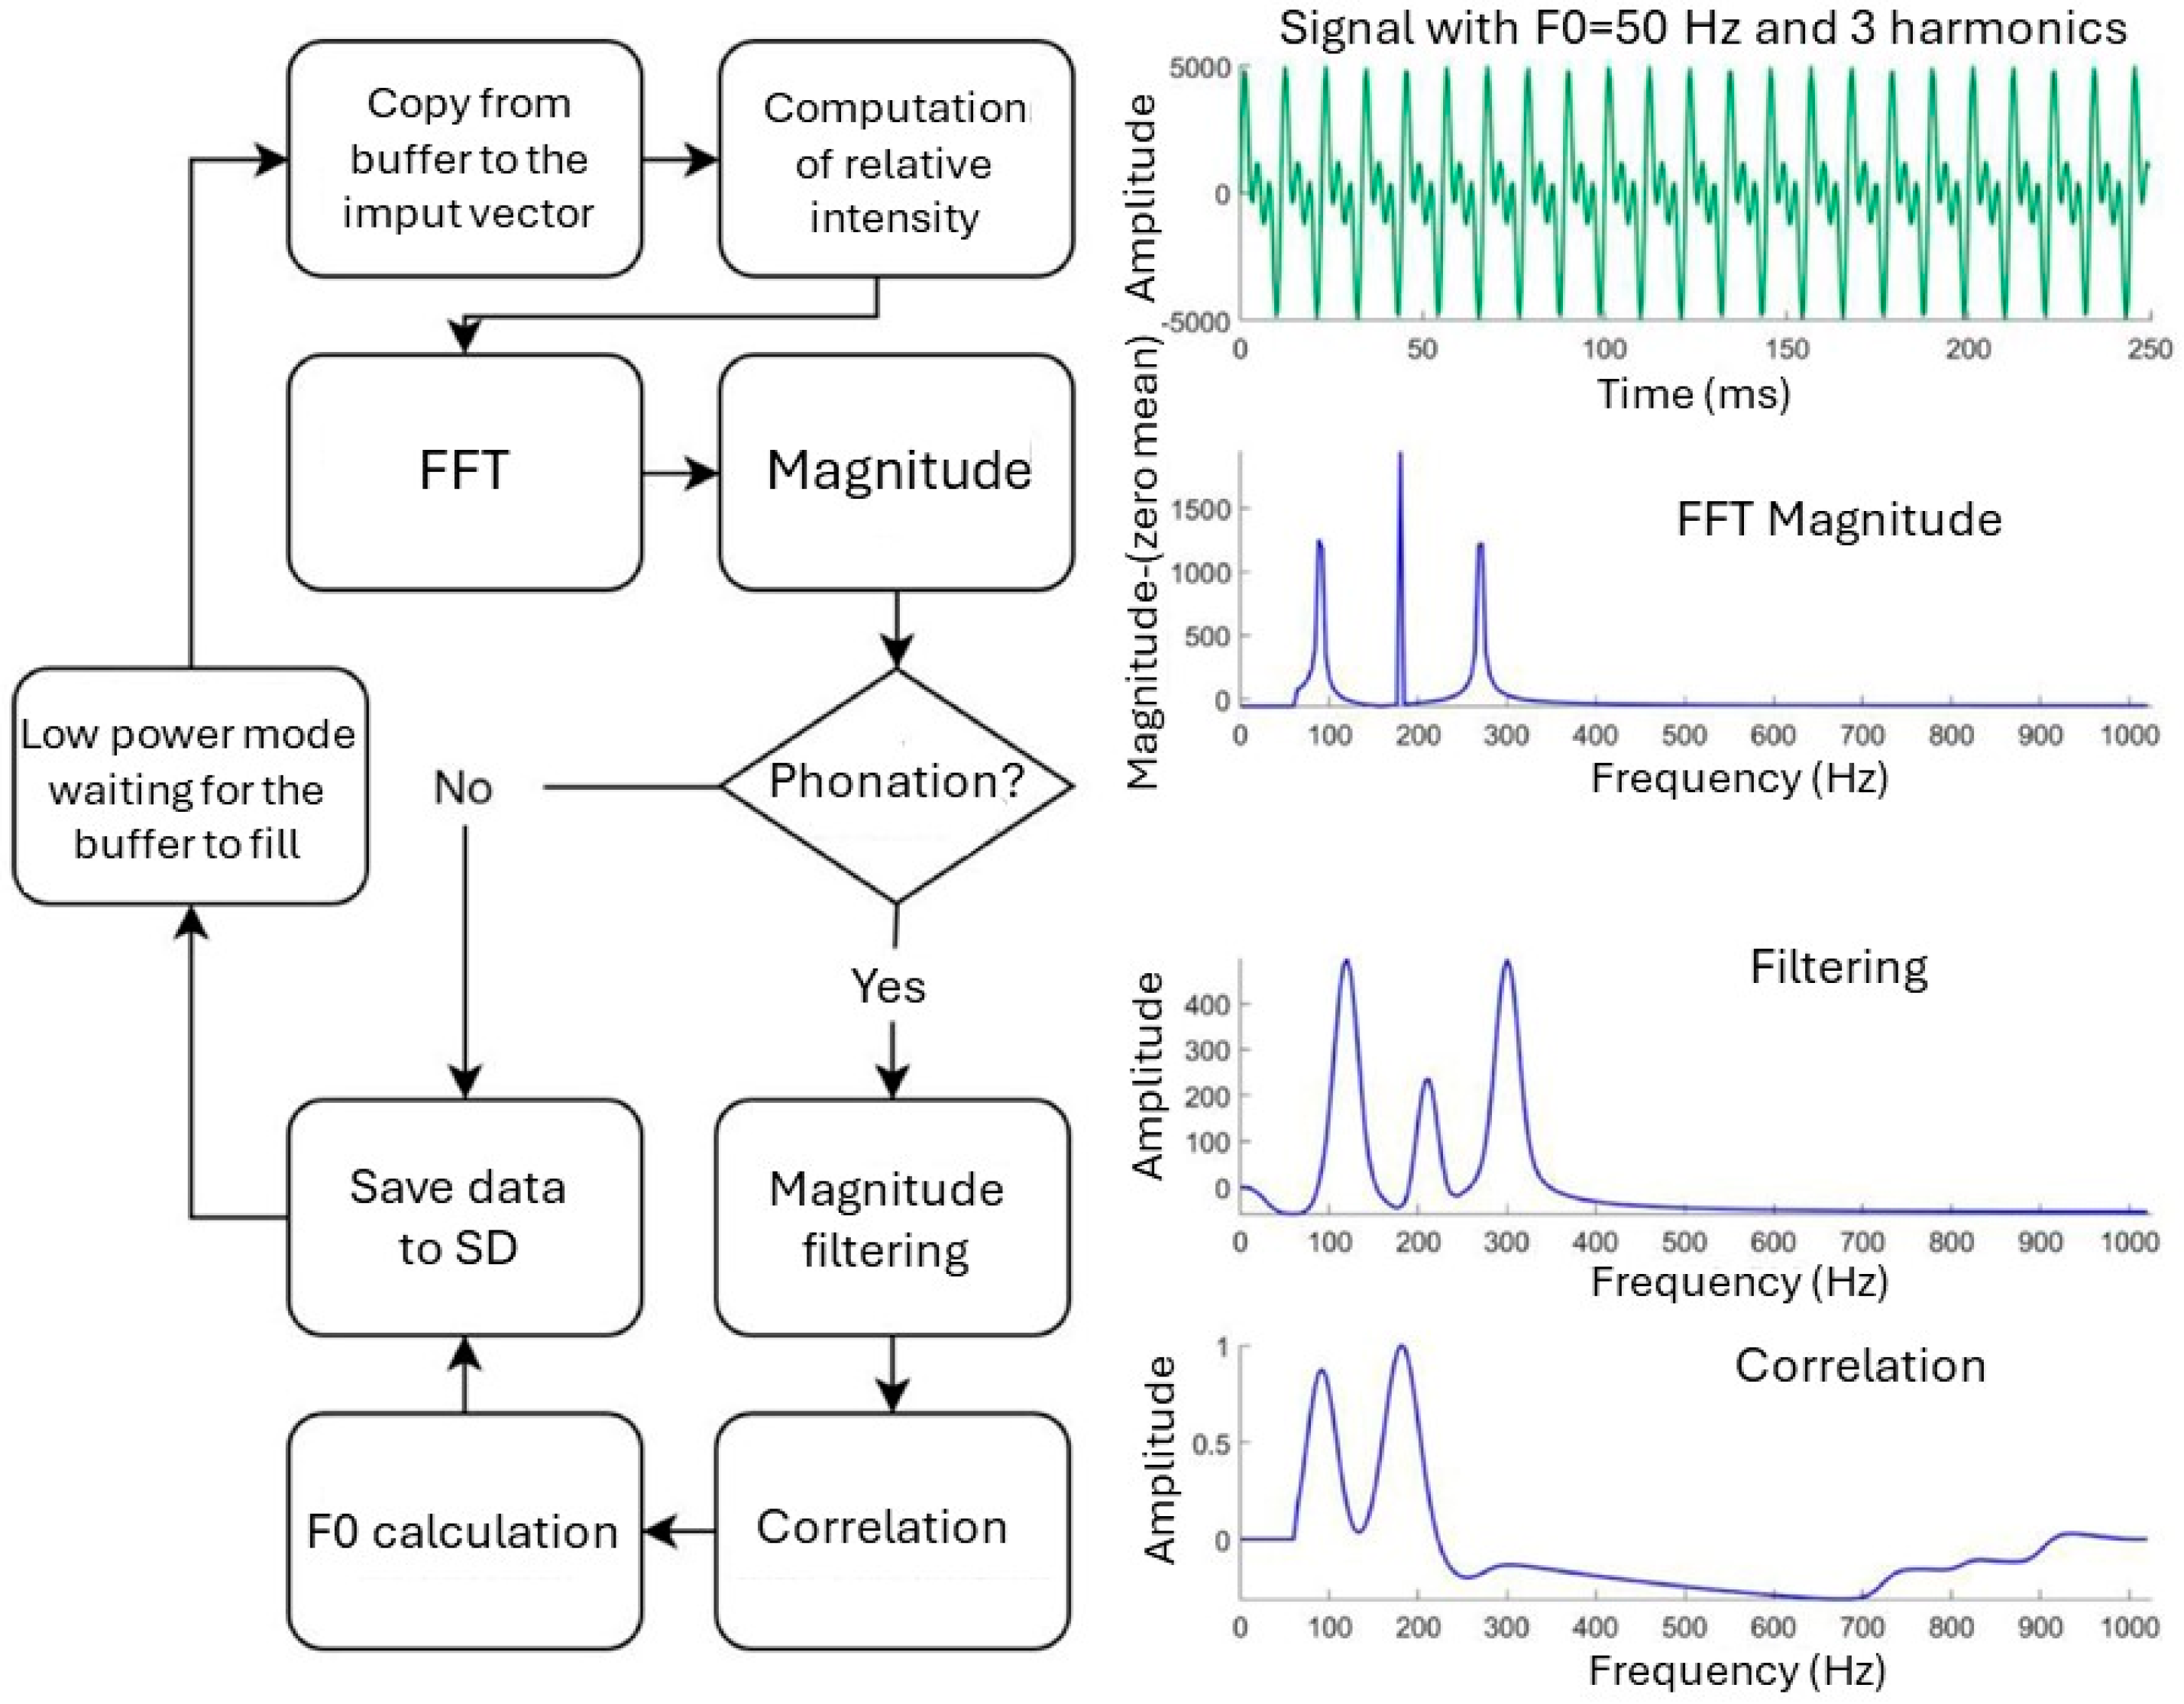
The proposed system consists of an accelerometer and microcontroller-based signal acquisition, processing, and storage, as shown in Figure 1. The microcontroller board is powered through the micro USB port by an external 5 V 2000 mAh battery (Adafruit Industries, LLC, New Yor, NY, USA). The general structure of the signal processing flow is shown in Figure 2. The accelerometer signal is processed on a frame-by-frame basis with no overlap between frames. The relative intensity is calculated directly from the time-domain signal, while F0 is estimated in the frequency domain. When phonation is detected, F0 is computed using a novel method that combines the magnitude spectrum and the autocorrelation of its smoothed version which works very well for a wide range of values of F0 and voicing characteristics. The computed voice parameters are stored on a removable non-volatile memory, part of the device.

3.1.1. Accelerometer

The motivation behind the choice of using an accelerometer over a microphone has been two-fold. First, unlike the microphone, which picks up signals from its surroundings that are not the object of measurement (including the voice of other persons), the accelerometer is not affected by other signals than the vibrations of the skin, providing a high signal-to-noise ratio [58]. Second, there is the question of privacy. A person is less willing to wear a system that is recording their voice. Similarly, other people who are around or talk with the user may not be willing for a device to record their voices even if it is not the goal of the device. We used the BU-27135-0000 accelerometer from Knowles Electronics because of its small form factor (7.92 mm × 5.59 mm × 2.24 mm), and unidirectional and flat frequency response between 20 and 2000 Hz. The small size, the key to achieving a wearable device, allows correct positioning between the upper part of the sternum and the lower part of the larynx. It is important that it is in this area as it is the closest to the vocal cords without being directly over the larynx, which translates into good reception of the vibrations generated by the vocal cords. The small size will also provide greater comfort for the patient. For the measurement of relative intensity, it is essential that the response of the device be linear in the range of measured frequencies. This allows the same amplitude to be correlated with the same relative intensity independent of the frequency.

3.1.2. Microcontroller

We used the Texas Instruments ultra-low power MSP430FR5994 microcontroller which features a low consumption math coprocessor (LEA—Low Energy Accelerator) that is capable of performing Fast Fourier Transform (FFT) and linear filtering. These are essential in our design, have low base energy consumption, and additional low consumption modes in which different parts of the microcontroller are turned off when not in use, and incorporate an Analog to Digital Converter (ADC), thus combining all the required functionality in one integrated circuit. It also provides an internal real-time clock (RTC), SD card controller and direct memory access (DMA).

3.1.3. Accelerometer Placement

The sensor should rest on the skin with the same pressure throughout the measurement so that the data collected over a number of days can be comparable. Other works used double-sided adhesive tape to fix the sensor to the skin, but the tape is frequently annoying to the user or ends up peeling off [33,59]. We used a custom-designed support on which the sensor is positioned and also has an anchoring system for an elastic band that passes around the neck and keeps the sensor in a fixed position as shown in Figure 3a. The band tension was adjustable. The support was 3D printed in Clear resin. The accelerometer was hot glued to the support and an elastic tape was attached. The three cables that were visible are connected to the microcontroller board.

3.1.4. Final Device Version

We used an off-the-shelf development microcontroller board, while the final version of the proposed system will use a custom Printed Circuit Board (PCB) to hold only those components that are necessary. In that way, the size of the entire system could be drastically reduced. Figure 3b shows what would be the final size of the entire device including the battery. It could be worn on the neck without any extra components to be stored in the pockets or in the vicinity of the patient. The necessary components are shown in Table 3 together with their volume, weight, and price. The selected battery capacity allows for 7 days of uninterrupted recording.

3.2. Signal Processing

For the algorithm design, we assumed F0 was in the range of 100–250 Hz. As the F0 estimation algorithm will also use up to the third harmonic information, the minimum sampling rate that is an integer power of two is 2048 Hz. The preferred length of the frame, or analysis interval, was set to 2048 samples so that the frequency resolution could be 1 Hz. However, this was incompatible with the use of the Low Energy Accelerator (LEA), which is a key component to achieve low power consumption. Because of memory allocation and alignment requirements imposed by the hardware, the maximum possible FFT order that would make the necessary variables fit inside the memory segment available to that LEA is 512. With that, the frame duration is 250 ms and the spectral resolution is 4 Hz.

3.2.1. Signal Acquisition

The accelerometer signal is captured directly by the microcontroller through its ADC. The samples are copied to the memory using Direct Memory Access (DMA), Texas Instruments, Dallas, TX, USA) to save Central Processing Unit (CPU) cycles and reduce power consumption. Double buffering is used so that the incoming samples are stored in one buffer while the samples from the other buffer are being processed.

3.2.2. Relative Intensity

The duration of the analysis interval has been chosen taking into account the estimation of the fundamental frequency and providing a small temporal resolution. We divided the analysis interval into eight subintervals to circumvent it. With this additional step, the temporal resolution is increased to 31.25 ms. The second advantage of using subintervals is that the phonation time resolution will be improved accordingly. The relative intensity for each subinterval is computed where k is the subinterval number, and N and L are the duration in the samples of the analysis interval and analysis subinterval, respectively.

3.2.3. Voiced Activity Detection

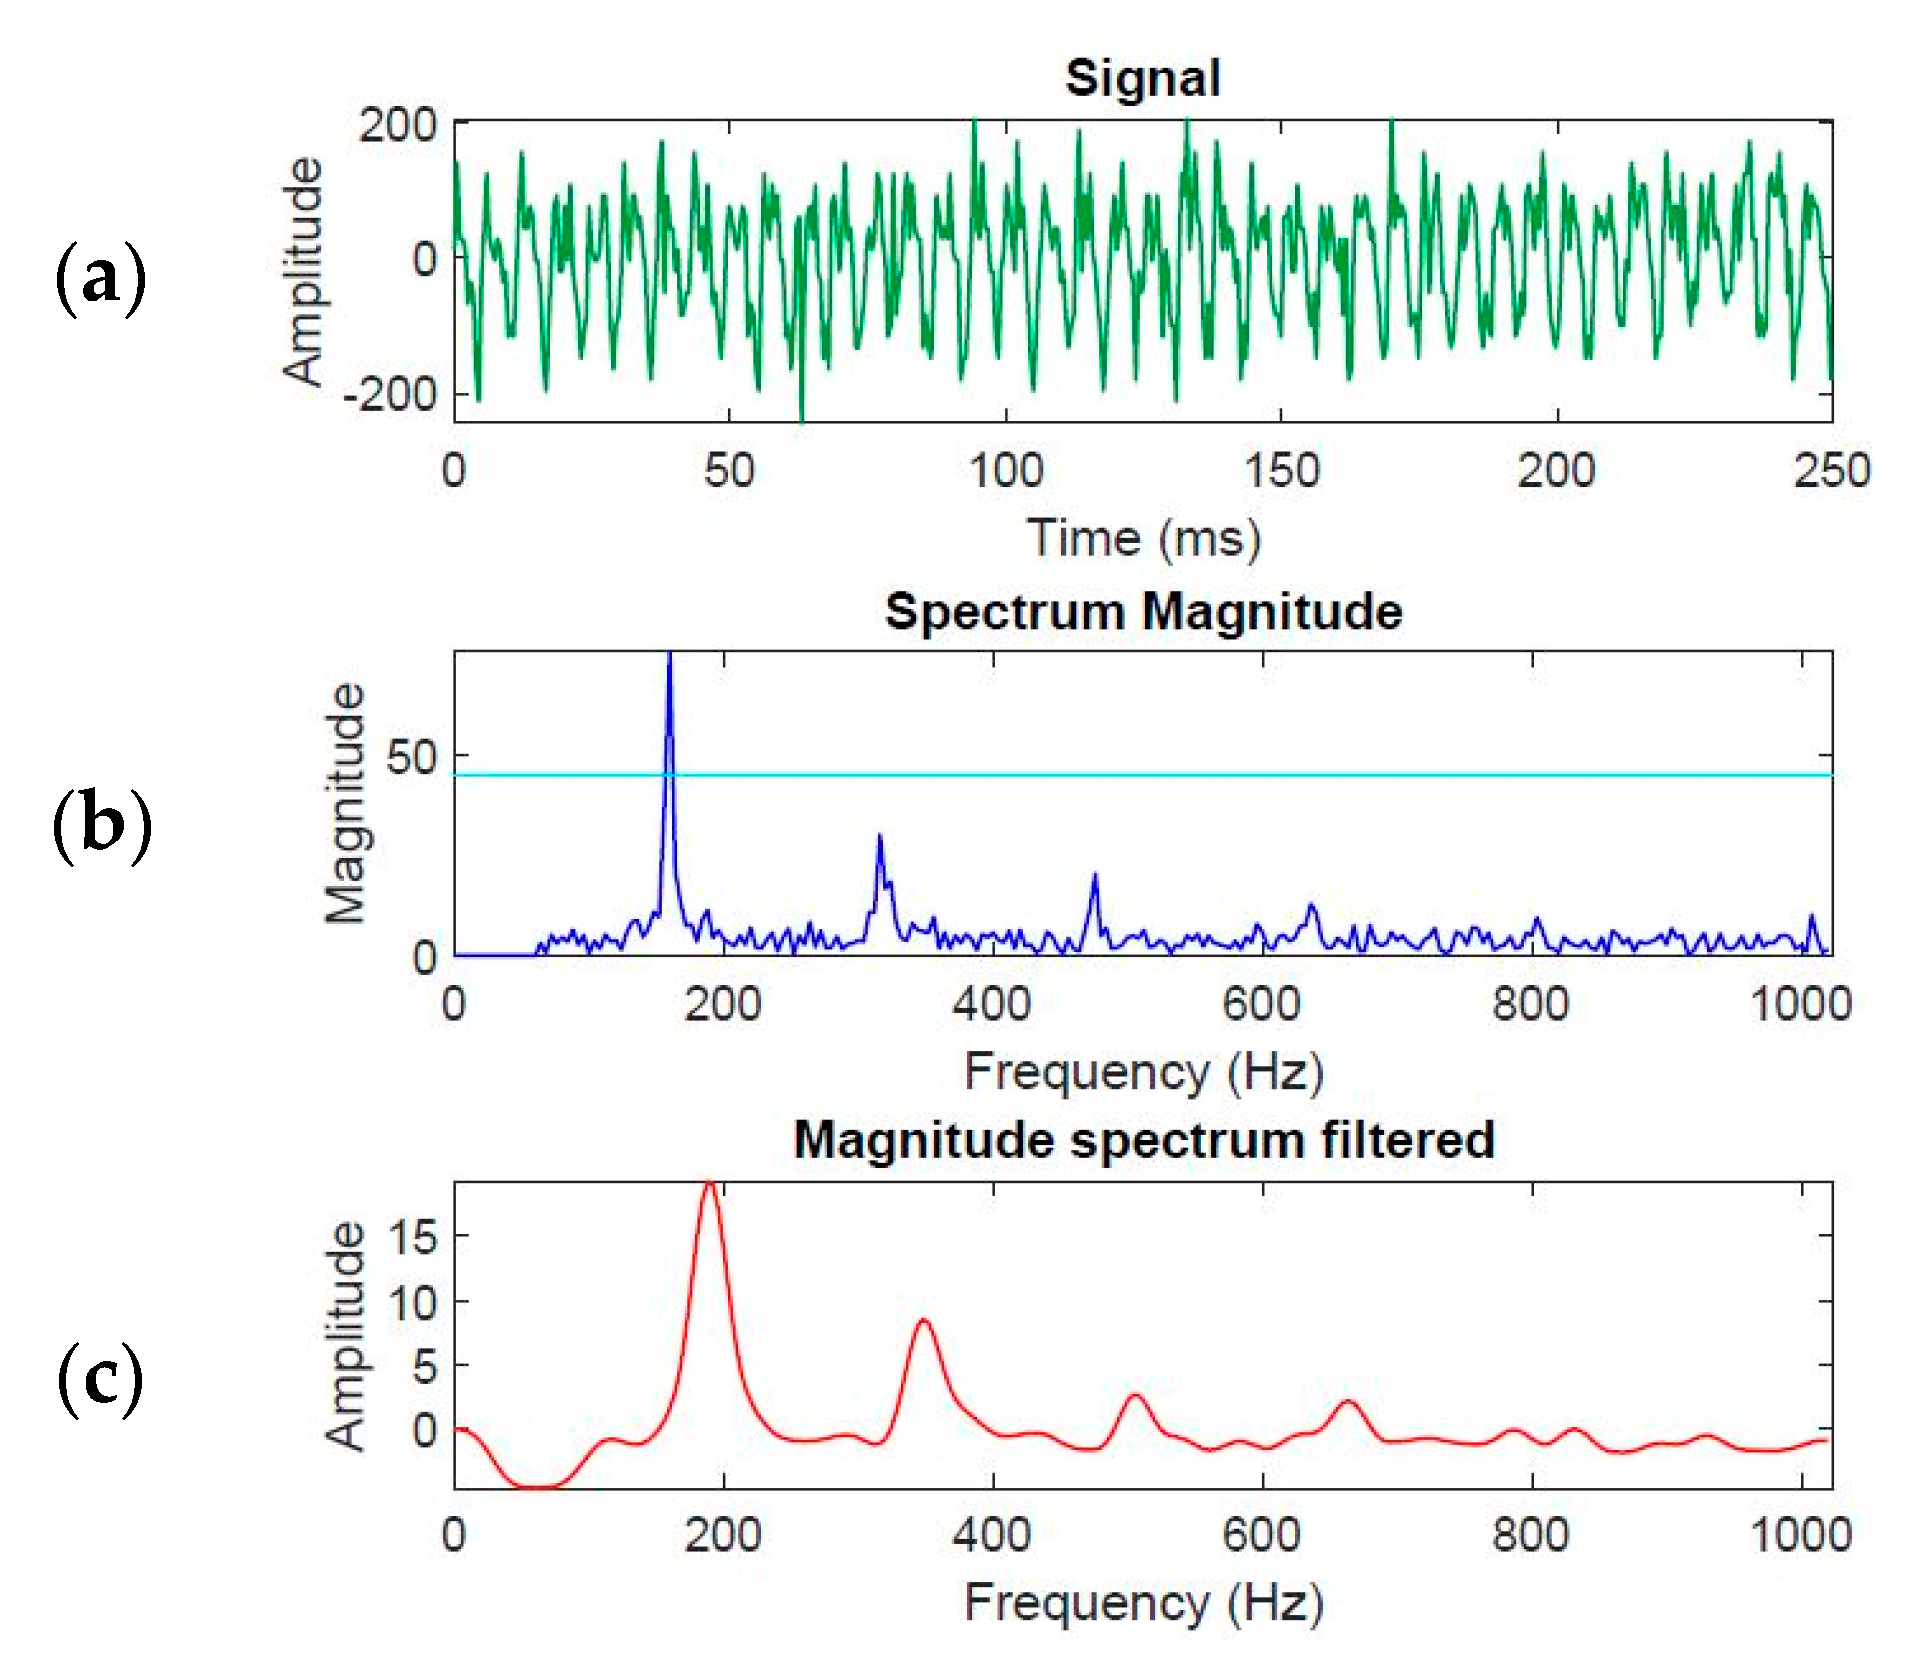
We used a simple voiced activity detection based on thresholding the amplitude of the magnitude spectrum at F0 as shown in Figure 4. The threshold value of 45 units was determined experimentally from several data sets. If the threshold is exceeded, the analysis interval is considered to contain voiced activity and F0 estimation is performed. Otherwise, F0 = 0 Hz is assigned to the interval and, consequently, to each of its subintervals. The value of F0 is stored together with the relative intensity in the nonvolatile memory, and the processor is placed into the power-saving mode until a new signal frame is acquired. As most of the time there is no voice activity (approximately 20–50% of the analysis time during reading or conversation corresponds to pauses [60]) the energy consumption of the device is considerably reduced and its recording time extended.

3.2.4. Magnitude Spectrum

If voiced activity is detected in a frame, the algorithm will estimate F0 from the magnitude spectrum. Computing the magnitude spectrum on the chosen hardware platform is the most computationally expensive part of the algorithm as LEA cannot be employed. It takes 300 ms and exceeds the duration of the analysis interval making the entire system incapable of real-time operation. As a solution, we approximated the magnitude of a complex number z = a + ib as |z| = |a| + |b|. The committed error is (|a| + |b|)2 − |z|2 = 2|a||b|. It is always positive, and monotonic in a and b, so it neither changes the position of the peaks corresponding to F0 and its harmonics, nor their relative amplitudes. In the following, we will call |z| = |a| + |b| the magnitude. With this modification, the time saving is ten-fold, allowing for real-time processing. We also assume a lowest F0 of 72 Hz and spectral components for frequencies lower than this value are removed by setting the corresponding magnitude spectrum samples to zero. The mean of the magnitude is removed to avoid numerical overflow errors in the subsequent processing steps.

3.2.5. F0 Estimation

Existing devices estimate F0 using either the magnitude of the short-time spectrum or its autocorrelation [41]. In the first method, the spectral peaks are found that correspond to F0 and its harmonics. In the second method, the autocorrelation of the magnitude spectrum is computed and the first peak corresponds to F0. Both methods have their limitations. The magnitude spectrum approach fails when the voice signal intensity and F0 are low, as the spectral peak of any of the harmonics can be easily confused with spectral peaks due to noise. In the case of the autocorrelation method, at least two harmonics (F0 counts as a harmonic) must fall within the frequency range analysed, that is 0–Fs/2, where Fs is the sampling rate. If the F0 > Fs/6 (340 Hz in our case), only two harmonics will be present in the signal spectrum, and if F0 > Fs/4 (512 Hz in our case), there will be only one, which is when the method will fail as shown in Figure 5. Merging the two methods allows us to combine the strengths of both while avoiding the pitfalls of either. The strategy is to use the autocorrelation of the magnitude spectrum for F0 estimation whenever possible and only if that fails, resort to F0 estimation from the magnitude spectrum. Autocorrelation is more robust at low frequencies (F0 < 480 Hz) and for analysis intervals that contain signals with more than one F0 (for example the ending of one vowel, a pause, and the beginning of another vowel).
  • F0 estimation from magnitude spectrum:
The speech signal of voiced phonemes is assumed to be quasi-periodic and, consequently, the F0 and its harmonics are equidistant in frequency. Intuitively, we expect that the frequency corresponding to the highest peak of the magnitude spectrum is F0 (up to the frequency resolution, which is 4 Hz in our case). Although in many cases this is true, it may also happen that the F0 peak is not the one with the highest magnitude and, consequently, this fact must be determined for every analysis interval. We have observed experimentally that, if there is any harmonic peak prior to the one with the highest magnitude, its magnitude is always greater than 1/3 of the maximum of the magnitude spectrum vector, which we will denote by vFFT. We will consider two cases: the highest peak corresponds to the second harmonic, or the highest peak corresponds to the third harmonic. In the first case, we denote the sample position of the second harmonic peak by pFFT. Consequently, there must be another peak corresponding to the first harmonic at the sample position pFFT/2. As the peak positions can only be integer numbers, we extend the search to round (pFFT/2) – 1 … round(pFFT/2) + 1. Out of the three, the position that has the maximum magnitude is selected and if that magnitude is greater than 1/3 vFFT, that position is declared the F0 (in samples). In the second case, we test if the maximum corresponds to the third harmonic: we repeat the above procedure, except that the pFFT is divided by three. The value of frequency F0 is stored in pFFT and the corresponding magnitude is in vFFT. See Algorithm A1 in Appendix A for a formal description;
2.
F0 estimation from magnitude spectrum autocorrelation:
Given the F0 and its harmonics are approximately equidistant in frequency for voiced phonemes, the first peak of the autocorrelation of the magnitude spectrum corresponds to F0. Clearly the higher the number of harmonics present in the spectrum and the smaller the noise, the more accurate the identification of the peak. Noise causes spurious peaks in autocorrelation that can be mistaken for the F0 peak. To improve robustness, the magnitude spectrum is low-pass filtered first to “smooth” it and to make the harmonic peaks “stand out” from the noise. This, in turn, produces a very “smooth” autocorrelation in which the F0 peak can be identified with a much smaller chance of error. The filtering delay does not need to be compensated as only the distance between harmonics is being measured. The F0 peak is detected as the first positive peak (recall that the magnitude is zero-mean) in the autocorrelation. Figure 5d shows a spurious peak that has been avoided by requiring the positive magnitude of the peak. The position of the peak is stored in pacorr and the position of the maximum of the autocorrelation is stored in p a c o r r ( m a x ) . The autocorrelation has been implemented using LEA and linear filtering. As LEA uses fixed-point arithmetic, proper pre-scaling has been applied to avoid numerical overflows;
3.
Final value of F0:
Lastly, the pFFT, vFFT, pacorr, and p a c o r r ( m a x ) are combined to produce the final F0 estimate. For that, two conditions are evaluated. First, we examine if pacorr equals p a c o r r ( m a x ) and if pacorrpFFT + p F F T ( o f f s e t ) , where p F F T ( o f f s e t ) = 10 (determined experimentally). Second, if pFFT > p F F T ( m i n ) and if vFFT > v F F T ( m i n ) , then the value of p F F T ( m i n ) = 120, corresponding to 480 Hz and v F F T ( m i n ) = 100, determined experimentally by analysing hundreds of intervals for F0 in the range of 80 Hz to 500 Hz and for I in the range that could be produced by a human. If only the first condition is fulfilled, the autocorrelation result is chosen and F0 = 4pacorr Hz (because 4 Hz/sample is the frequency resolution). Otherwise, it is likely that there are not enough harmonics to obtain F0 from the autocorrelation or that we are dealing with a signal whose fundamental frequency exceeds 480 Hz. In those cases, the algorithm falls back to F0 estimation from the magnitude spectrum and sets F0 = 4pFFT Hz.

3.2.6. Data Storage

For each analysis interval, consisting of 8 subintervals, 16 values are computed: one value of F0 repeated 8 times and 8 values of relative intensity. They are stored in the FRAM memory region of the microcontroller and transferred every 2 min to the microSD memory. It was not possible to directly store data in the microSD as accelerometer signal acquisition and the SPI communication with the microSD memory could not be performed simultaneously due to hardware limitations (writing to microSD card switches off and interrupts). Also, the communication with the microSD is time and energy-consuming, making it more efficient (in time and energy consumption) to transfer data in sets instead of individually. However, the more data sent during the transfer, the longer the device is not acquiring the signal. For this reason, 2 min of recording with a transfer pause of approximately 5 s was chosen as a balance between recording and non-recording time.

3.3. Power Consumption

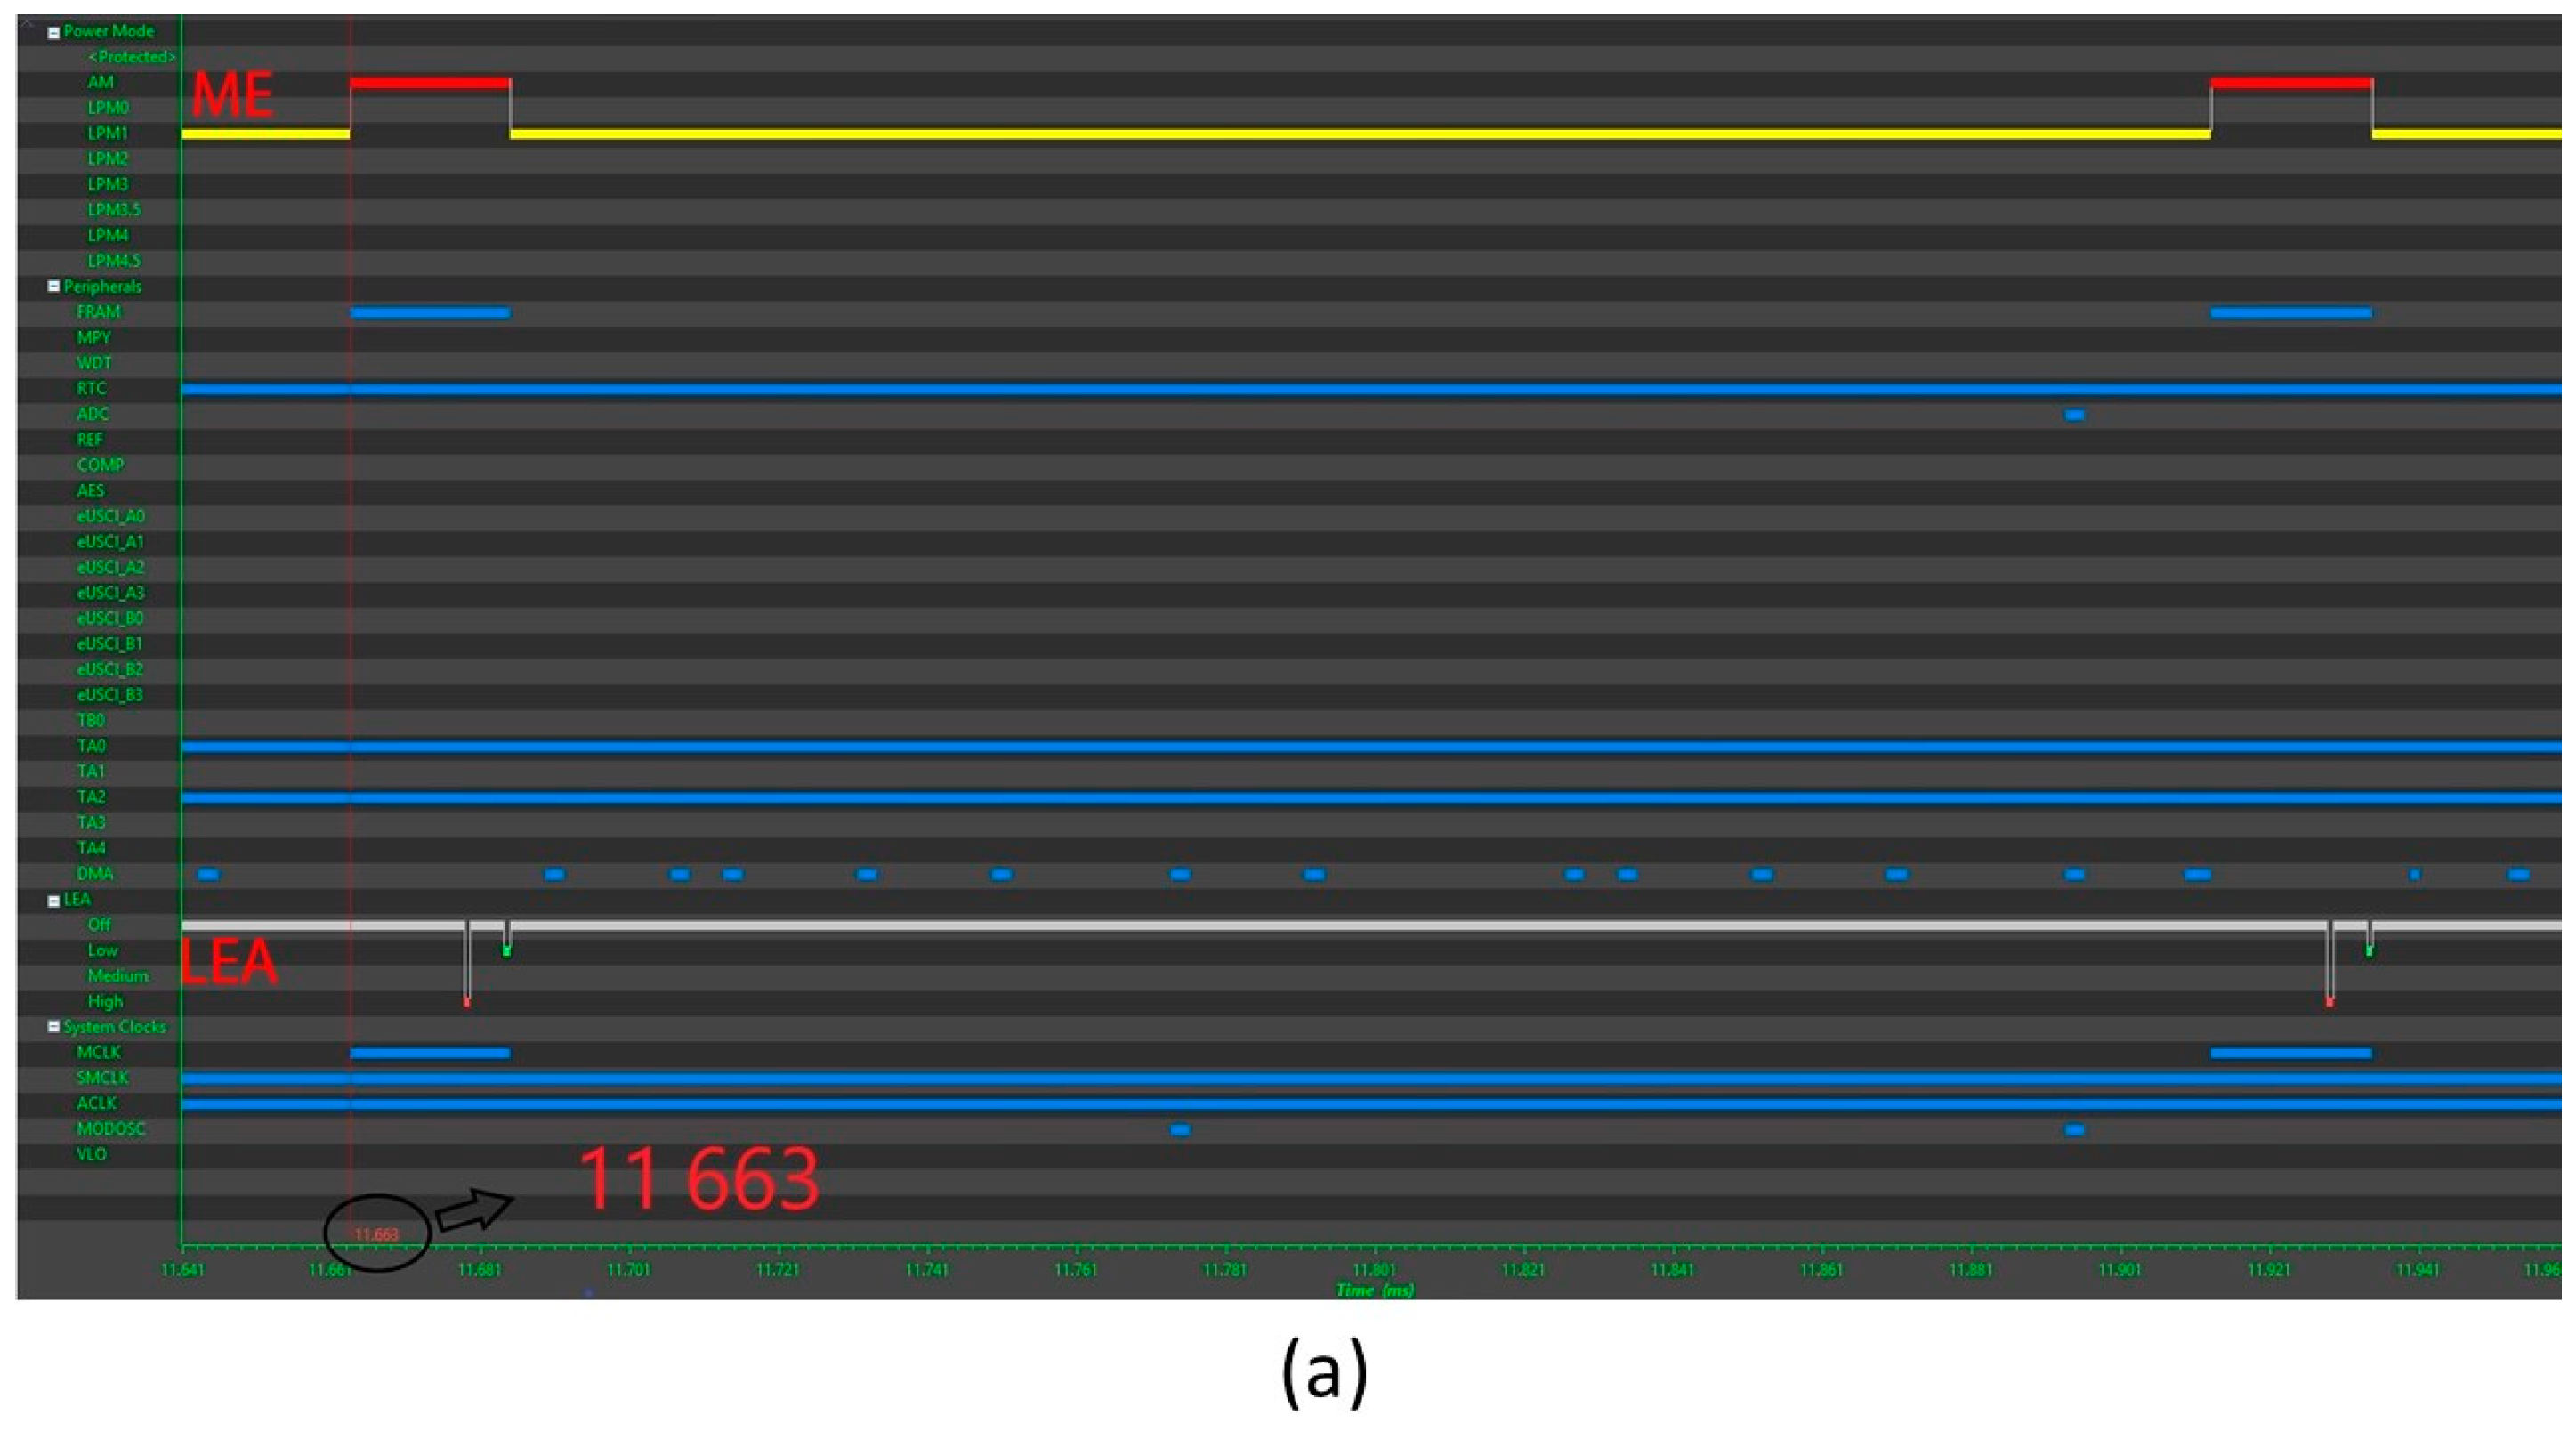
In the case no voiced activity is detected, the processing time is approximately 21 ms and when it is, the processing takes 53 ms (per 250 ms interval). Thus, the microcontroller is in low power mode 79% and 91% of the time, respectively. If the data recording periods are also taken into account, the microcontroller is in low power mode 73% of the time. Figure 6 shows microcontroller activity in typical scenarios. The average current consumption is 2.44 mA. With two rechargeable AAA batteries (1150 mAh) the device could operate continuously for more than 19 days without recharging. This excellent result is achieved by structuring the algorithm in such a way that LEA can be used for most operations.

3.4. System Validation

3.4.1. Microcontroller and Algorithm Validation

The implementation of the algorithm in the microcontroller has been verified using Matlab (Matlab R2018b, Mathworks Inc., Natic, MA, USA) implementation as a reference. For this purpose, several test signals with known characteristics, whose magnitude spectra are shown in Figure 2 and in Figure 5 cases (a)–(d). These specific signals exemplify the various scenarios that may arise with real signals. Case (a) illustrates the reason why exclusively using the autocorrelation method is not sufficient and how the algorithm uses the information of the magnitude of the FFT to correctly calculate the F0 when the first harmonic is not the one that contributes the most energy (the spectral peak corresponding to F0 is not the highest one), and, when in the autocorrelation function, the highest peak is not the first peak. Therefore, the algorithm searches for the highest peak in the magnitude spectrum. That peak is further examined as to whether it is the first harmonic or not. In this case, it is not, and another harmonic is found before it. The position of this earlier harmonic is used to set the pFFT variable and, consequently, to calculate F0. In case (b), the maximum of the magnitude spectrum is at the first harmonic, and, in the autocorrelation, the maximum coincides with the first peak. Since the maximum of the autocorrelation coincides with the first peak of the magnitude of the FFT, the position of this peak, pacorr, is used to compute F0. In case (c), the maximum of the magnitude spectrum is in the third harmonic. This is discovered by finding another peak at 1/3 of the position of the third harmonic. Since, in the autocorrelation, the maximum coincides with the first peak, the algorithm uses pacorr to calculate F0. Case (d) is similar to case (c), except that the maximum of the magnitude spectrum occurs at the second harmonic. Again, this is detected by finding another peak at 1/2 of the position of the second harmonic. Similarly, since, in the autocorrelation, the maximum coincides with the first peak, the algorithm uses the pacorr to calculate F0. Cases (b)–(d) differ in the way the FFT magnitude peak corresponding to F0 is being detected but in all of them, the autocorrelation method was sufficient to calculate F0. In case (e), the algorithm does not use the autocorrelation results since the frequency corresponding to the maximum of the magnitude spectrum is greater than 480 Hz and only one harmonic is present. As no prior peak to the highest one is found in the magnitude, its position pFFT corresponds to F0. In all cases, the results obtained in Matlab and in the device were the same. In case (a), however, both the Matlab code and the device produced an F0 estimate of 88 Hz. This is because the true F0 of 90 Hz was purposely not a multiple integer of 4 Hz, the spectral resolution of the system. There is no such problem in cases (b)–(e) and the results obtained in Matlab and in the device were equal to the true value of F0 in the test signals.

3.4.2. Validation of the Parameters of Interest in the Human Voice

To validate the results obtained by the device regarding the parameters of the voice we are studying (F0, relative intensity, and phonation time), the device was placed on three subjects (two men and one woman) and recordings were made with the device and, simultaneously, with the audio recording and sound level measurement equipment at the Voice Laboratory of the Clínica Universidad de Navarra.
  • Validation of F0 estimation:
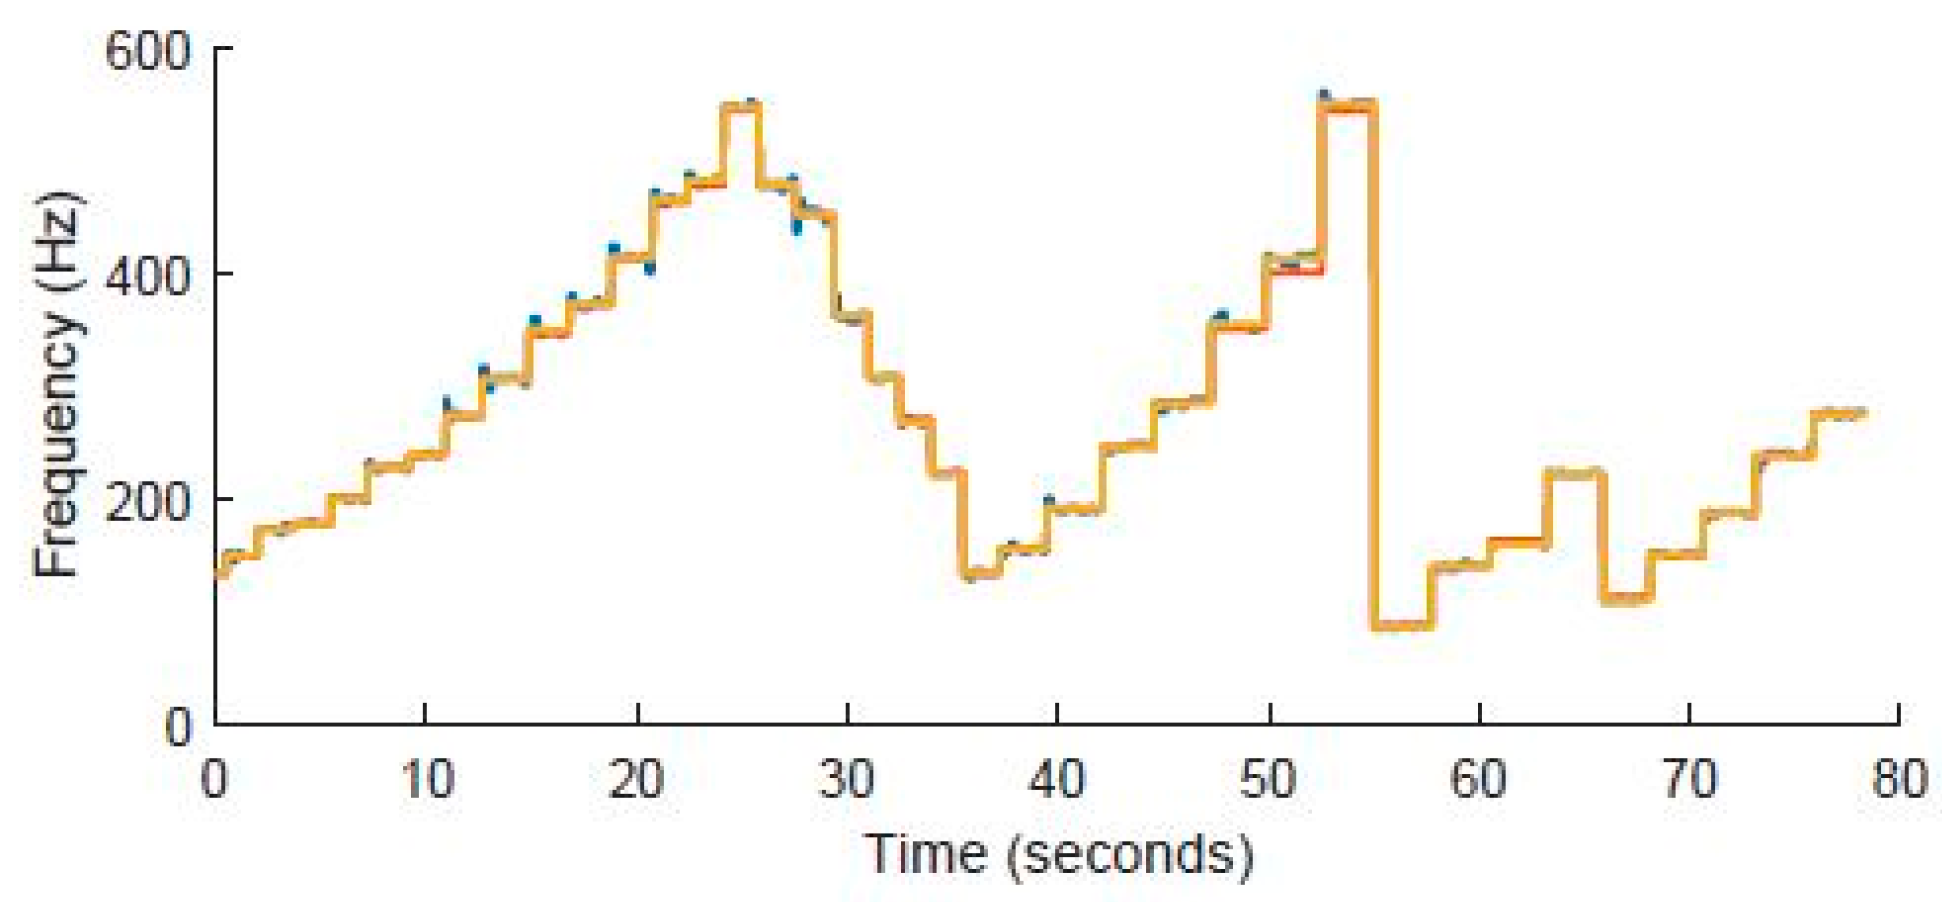
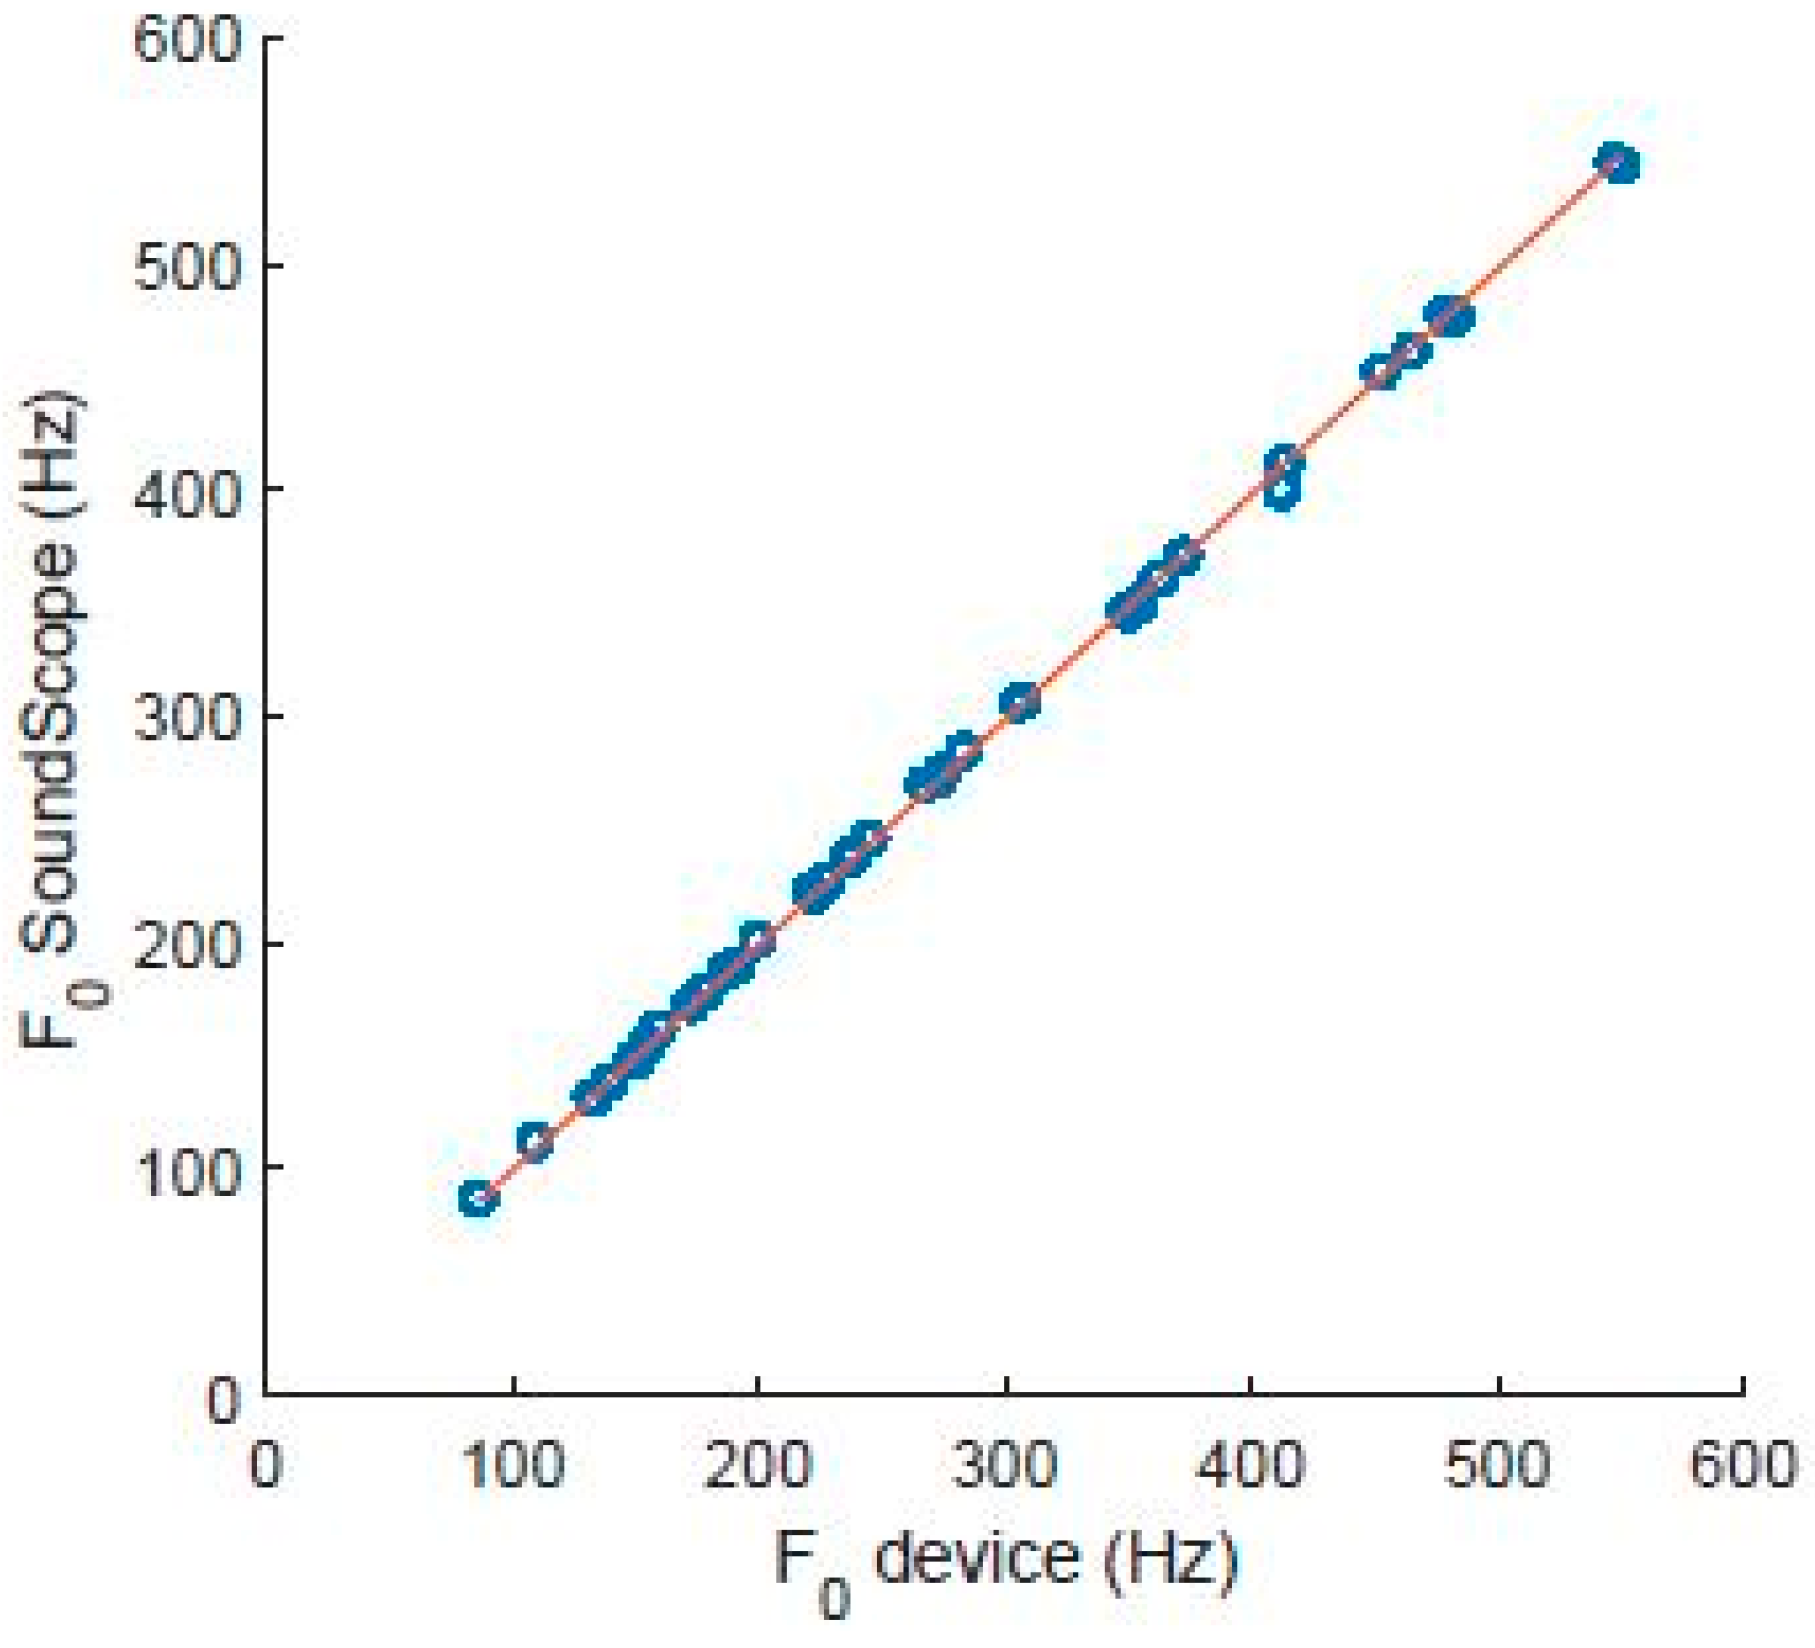
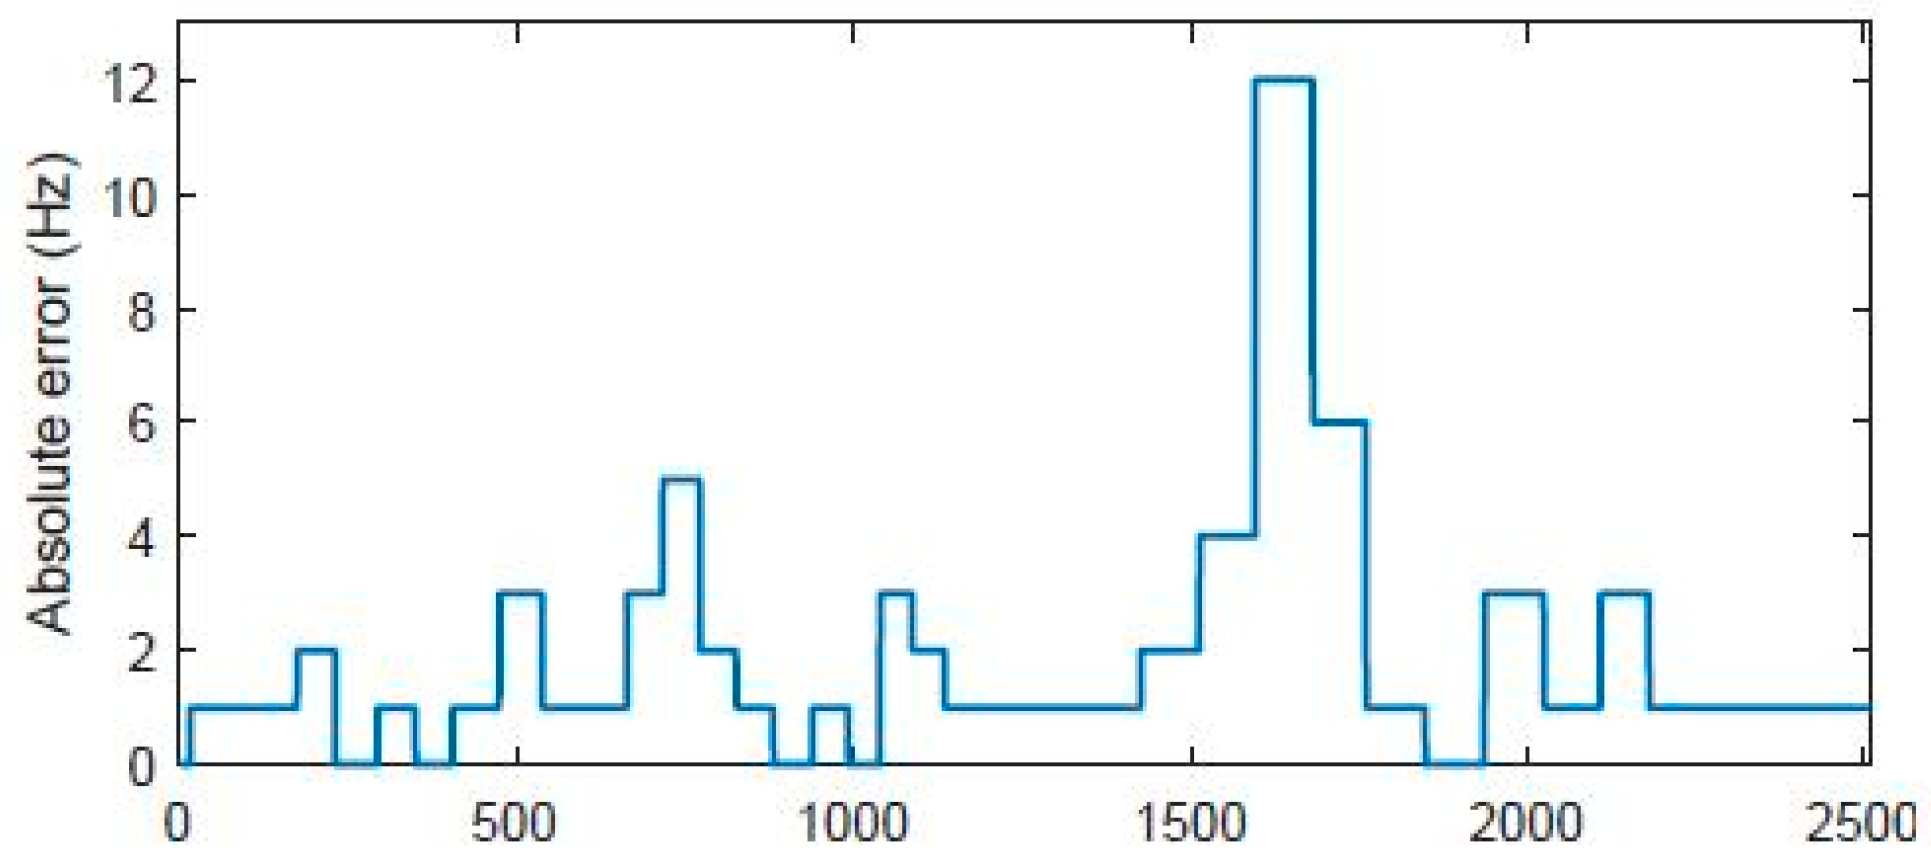
For the validation of the F0 measurement, the device was placed on each of the subjects. Those subjects generated a tone scale, each within their comfortable range and without predetermining the frequency of each of the tone steps. Each of the tones, produced as a vowel, was kept constant for 1 to 3 s with a brief silence in between. The F0 measurement was performed using the proposed system and a microphone connected to a PC through the A/D SoundScope/16 card and analysed with SoundScope 1.2 software. For each tonal step, the result obtained from SoundScope measurements is a frequency value that corresponds to the mean F0 measured by the program during that step. Subsequently, both recordings were analysed using the correlation statistic to determine the absolute error of the measurements performed by the device with SoundScope measurements as the reference. Figure 7 shows the 2508 data collected by the device in the 38 tonal steps. The first 29 steps correspond to subject 1 and were taken in 2 measurements of 21 and 8 tonal steps, respectively. The next four tonal steps correspond to subject 2 and the last five to subject 3. The SoundScope measurements have the form of steps with a constant value of F0 during the tonal step. This is because SoundScope only produces one frequency value for each F0 step that corresponds to the average frequency of the F0 during that step. The results provided by the device are consistent with those provided by SoundScope. The temporal resolution of the proposed device offers the advantage of the possibility of observing how the fundamental frequency is slightly higher during the attack phase (when starting a tone) and subsequently stabilises. For the comparison, the mean fundamental frequency for each tonal step was calculated from data obtained by the device to mimic the behaviour of SoundScope. Figure 8 shows the correlation between the fundamental frequency values obtained using the SoundScope and the fundamental frequency values obtained with the device. The correlation is R = 0.9998. Finally, the absolute device error, taking the SoundScope value as a reference, is shown in Figure 9. The mean absolute error is 1.94 Hz with a standard deviation of 2.32 Hz.
2.
Relative intensity validation:
The relative intensity measurements from the device were compared with the intensity measurements recorded by the sound level meters: ISO-TECH SLM-1352A, (RS Integrated Supply, Birchwood, Warrington WA2 6UT, UK) and LingWAVES SPL (WEVOSYS medical technology GmbH, Bamberg 96052, Germany) meter. Again, the three subjects produced tones of increasing intensity within their range of comfort. Each of the tones was kept at constant intensity for 1 to 3 s with a brief silence in between. Subsequently, the statistical comparison of the obtained data was performed. For the validation of the relative intensity, measurements of constant intensity of subject 1 were taken. During the recording, the sound level meter produced 77 values, while the device produced 5190 values. In the case of subject 2, these were 8 and 646 measurements, respectively. The measurements for subject 3 were discarded because she did not perform the vocal exercise correctly, i.e., vowels were not kept at constant intensity. The results are shown in Figure 10. A very high linear correlation is observed for both subjects. These results show the robustness of the device as the measurements with subject 1 were made over several days, including taking off and putting on the device, with the possible small variation in pendant tension.
3.
Phonation time validation:
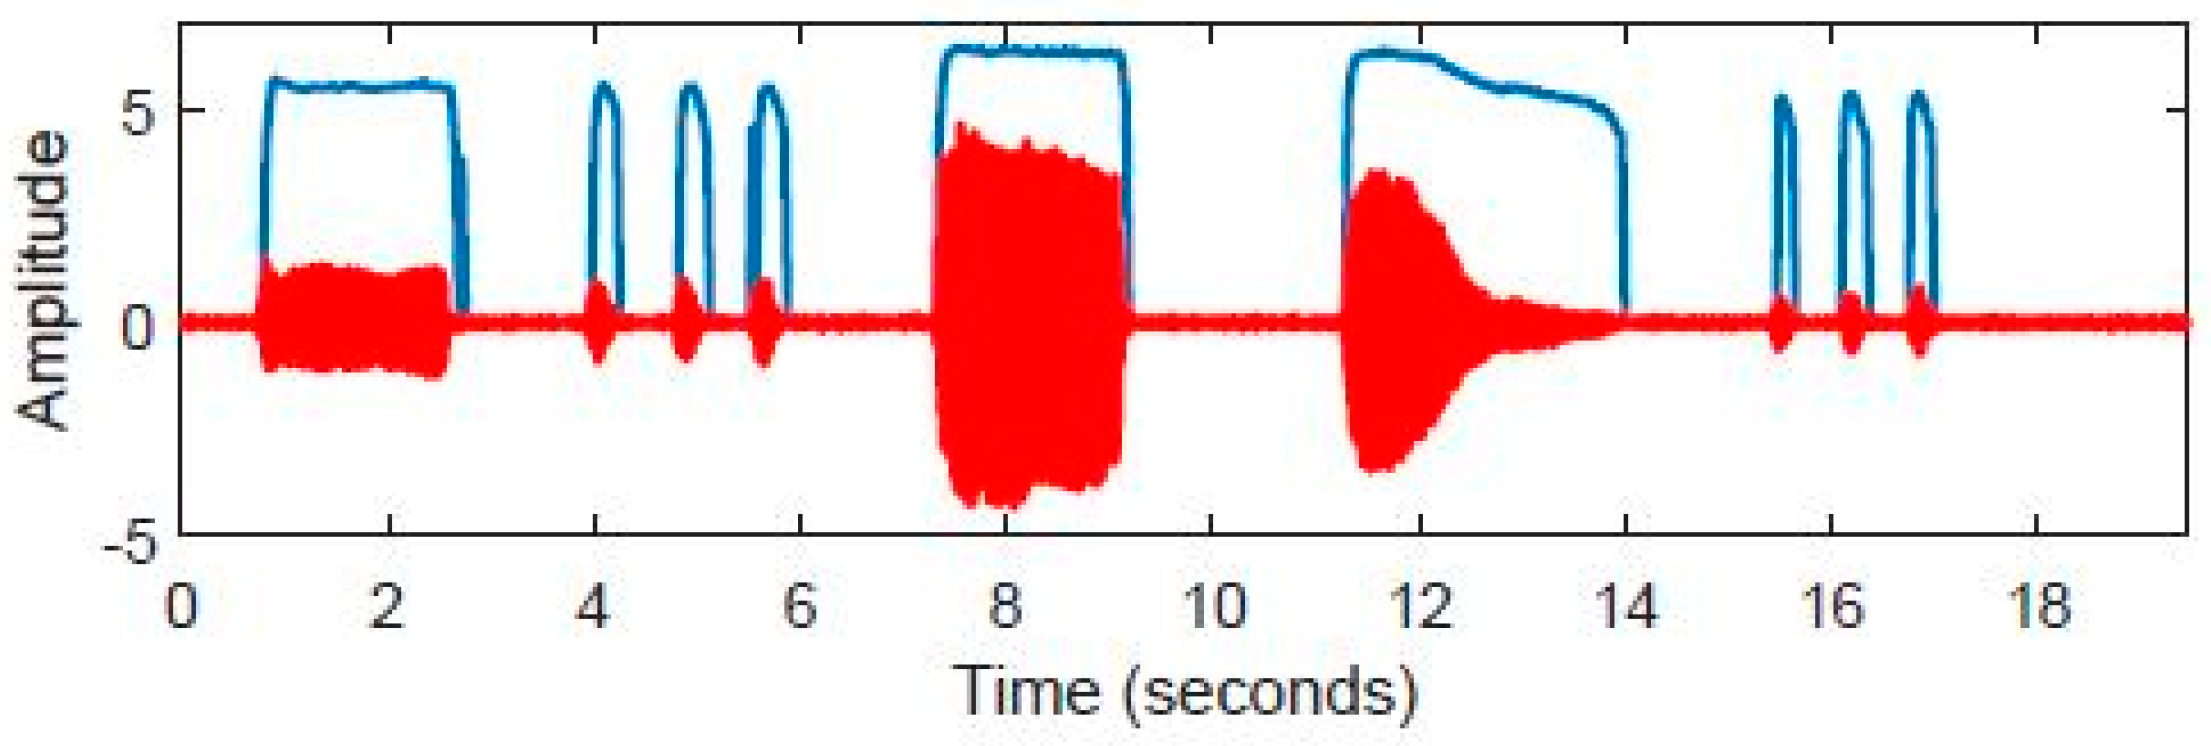
The phonation time measured by the device was compared with that recorded using the YETI PRO microphone and the Sound Forge 10.0 software. During the experiment, each of the three subjects performed a monologue for 2–3 min. The microphone recording was analysed using Audacity 2.3.1 software. Since the device stores data in microSD memory every 120 s, the first 100 s of the monologue were used for comparison. All pauses in the audio recording were eliminated. The duration of the remaining recording is the phonation time. With this, an audio signal is obtained that concatenates all the voice fragments recorded by the microphone. The number of subsegments in the device recording that show a non-zero F0 during the first 100 s of the recording is multiplied by the segment duration (31.25 ms) to obtain the total time that has been considered phonation speech. The results of the recordings are shown in Table 4. In the case of subject 1, the total phonation time differs by more than 80% between using a microphone and Audacity, and the time recorded by the device. This happens because, obviously, not all speech needs to be voiced. If only vowels are produced, the values calculated by the device coincide with those obtained from the acoustic recording, as shown in Figure 11.

3.5. Subjects

Three subjects were studied, a 46-year-old female, a 57-year-old male and a 26-year-old male who used the device for several 9 days.
All three subjects were asked to use their voice normally in a communicative setting with family and friends while wearing the device (comfortable fundamental phonatory frequency and loudness). On one of the days, they were asked to make, in addition to normal voice use, professional use of their voice by performing their usual job in which the voice is a relevant work tool that puts a phonatory strain on them. On another day they were asked to make intensive use of their voice by singing for a prolonged period of time.
In addition to the speech utterance, they should utter the sound of sustained vowels in order to study the correspondence with the usual microphone analysis systems, in this case, Audacity.
For each of these days, F0, amplitude, and phonation time were analysed.

4. Results

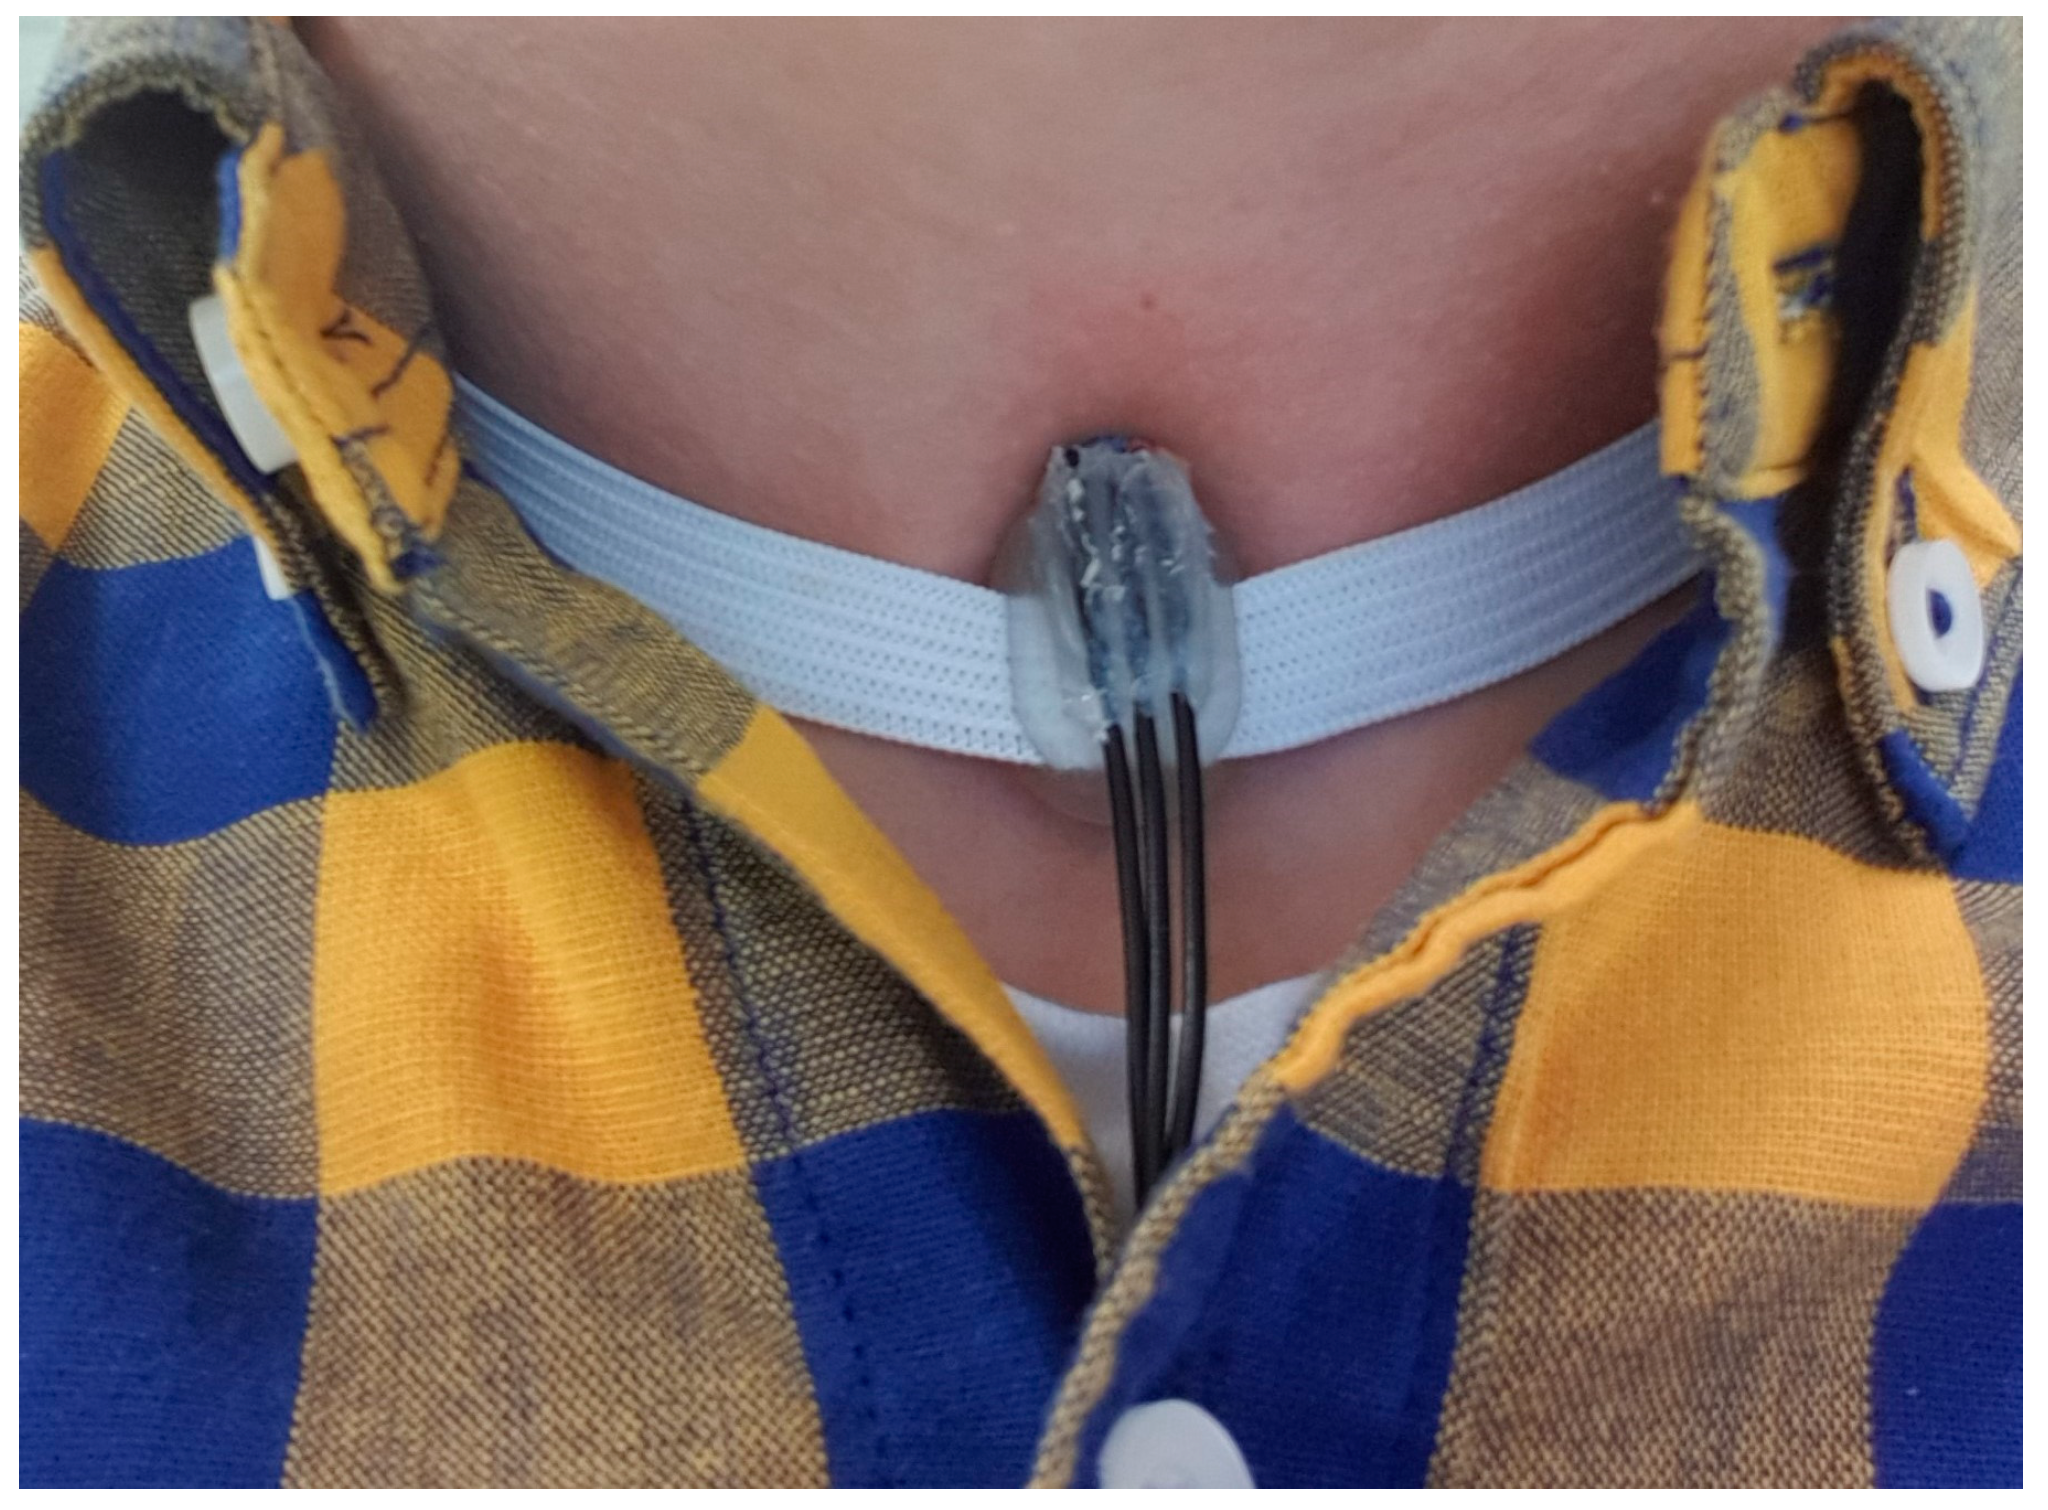
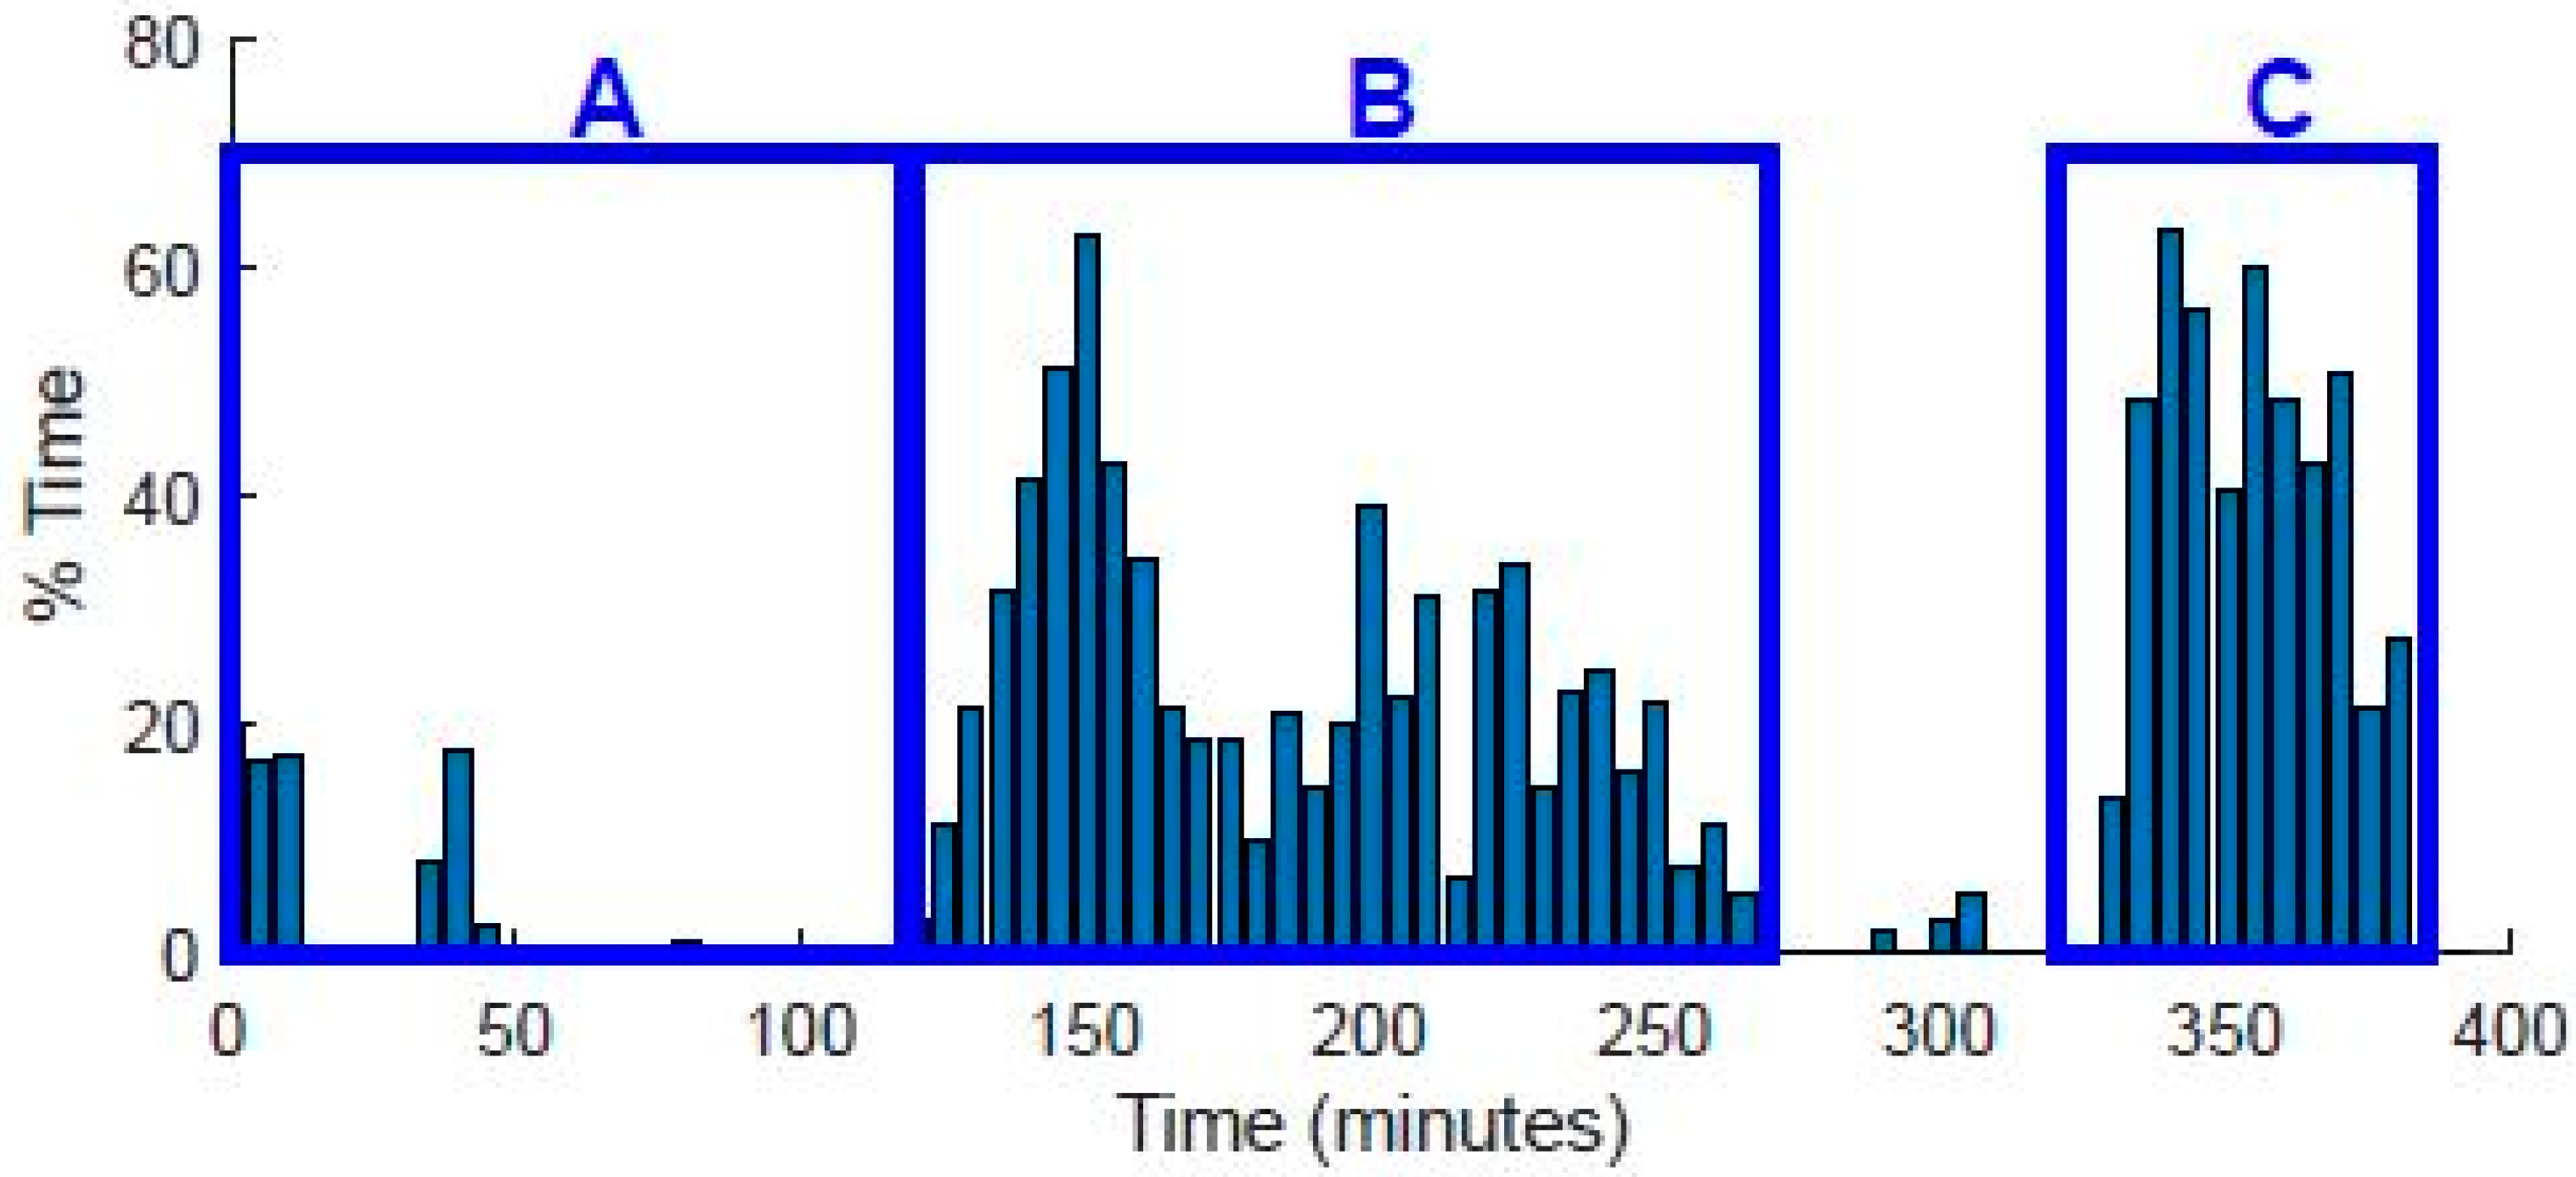
Several recordings were made for long periods of time with a number of subjects, each using the device for approximately two weeks. The microcontroller board and a 2000 mAh external battery were placed in a small box. The accelerometer was connected to the box with approx. 1 m of wired cable. The subjects would keep the box in the pocket of their lab coats and the pendant was placed as shown in Figure 12. Subjects were asked to make normal use of their voices except for one day when they should simulate a hyperfunctional pattern consisting of using frequencies or intensities, or both, outside the usual range and outside the working environment. Here we present the results for subject 1. For subject 1 the recording time ranged between 4.5 and 7.1 h per day and the percentage of voiced speech between 4.5 and 20%, as shown in Table 5. Figure 13 shows the evolution of the F0 throughout the recording of day 7 of subject 1. Four distinct phases were noticeable. In phase (A), the frequency range was moderate and the phonation time was short. This indicated a normal phonatory activity. In phase (B), the frequency range was considerable and also the phonation was extended over a much longer period of time and was continuous. This indicated professional phonatory activity. Phase (C) entailed a very wide frequency range and maximum frequency values observed over the recording period. This was a singing exercise, a demanding phonatory activity. In phase (D), the subject returned to the “normal phonatory” activity with a small frequency range and normal fundamental frequency values for everyday conversation. Figure 14 shows the percentage of the phonation time of the subject. It provides very valuable information on the workload that the vocal cords need to cope with over time and how and when that workload or use of the voice is concentrated. Three different intervals of the subject’s professional activity with different workloads on the vocal cords are prominent. In the first part of recording (A), from the beginning until approximately minute 120, the subject used their voice for very few moments and for short intervals of time. During that time the subject was setting up the recording equipment in the lab. In the second part (B), from minute 120 to minute 260, the subject spoke continuously including prolonged intervals (30–60%) of speech activity. During that time the subject was having a conversation, giving instructions, and showing phonatory exercises to the patients who were being evaluated in the laboratory. In the last part (C), the subject used their voice continuously and during prolonged intervals that corresponded to the singing performed by the subject during that time.

5. Discussion and Conclusions

It is very important to assess how the fundamental frequency and its variability are distributed over periods of intensive and lower phonatory activity in order to make precise clinical decisions and propose a personal treatment. With this approach, it is possible to objectify risk situations in persons who use their voice as a work tool to justify treatments that entail reviewing work schedules in some aspects, e.g., teaching for three or four hours continuously, answering the phone for hours without a break, situations of prolonged speech activity with high fundamental frequency or intensity, concentration of vocal activity (classes, public service, rehearsals, etc.) in certain days of the week, etc. It is also possible to evaluate how well the patient follows the treatment indications of the speech therapist in relation to the “placement of the frequency” or the intensity in the different phonation areas and therefore assess the prognosis and the possible efficacy of the treatment aimed at the correction of an altered phonatory pattern. The proposed miniaturised, extremely low-power, lightweight, and low-cost wearable voice dosimetry device enables continuous monitoring of the F0, voice intensity, and phonation time in the everyday environment of the patient for up to 14 days. It uses an accelerometer for low-noise measurements and avoids privacy concerns. The proposed algorithm for F0 estimation is very robust and works across a wide range of frequencies. The signal processing is performed onboard, mostly by a Low Energy Accelerator that is part of the microprocessor, and the results are stored on an SD card. The data that this device records enables the diagnosis and explanation of the different altered phonatory patterns, tiredness or vocal fatigue, the compensation mechanisms that the patient may have developed, and the establishment of risk indicators regarding the chronification of some disorders of the voice or the appearance of organic lesions. With that information, the speech therapist can develop a personalised treatment and can monitor the vocal quality and phonatory efficiency and thus evaluate the treatment progress.

Author Contributions

M.L., conceptualization, methodology, investigation, software, writing—original draft, visualization. S.F., supervision, conceptualization, writing—review and editing, visualization. A.P., supervision, conceptualization, formal analysis, writing—review and editing, visualization. All authors have read and agreed to the published version of the manuscript.

Funding

This study has been supported by the “Asociacion de Amigos de la Universidad de Navarra”.

Institutional Review Board Statement

The study was conducted in accordance with the Declaration of Helsinki, and approved by the Research Ethics Committee of the University of Navarra (protocol approval Code: 2023.146, approval date: 29 September 2023) for studies involving humans.

Informed Consent Statement

Informed consent was obtained from all subjects involved in the study.

Data Availability Statement

The data presented in this study are available on request from the corresponding author. The data are not publicly available due to ethical and data confidentiality.

Conflicts of Interest

The authors declare no conflicts of interest.

Correction Statement

This article has been republished with a minor correction to the existing affiliation information. This change does not affect the scientific content of the article.

Appendix A

Algorithm A1.  F 0 estimation from the magnitude spectrum
1:   x   D a t a   f r o m   A D C
2:   n 512                                                                           Analysis   interval   lenght ,   FFT   order
3:   p a c o r r m i n 18                                                                           S k i p 0 72 H z   in   autocorrelation
4:   h LP   filter   coefficients
5:   p FFT ( min ) 120 Threshold   for   p FF
6:   v FFT ( min ) 100 Threshold   for   v FFT
7:   P F F T offset 120                                                                                   Threshold   for p a c o r r   p FFT
8:   x fft x , n
9:   for   k = 1 : n   do
10:   x k x k
11:  end   for
12:   y 0                                                                                                                                                 Low - pass   filtering
13:   for   k = n   : 1 : 1   do
14:    for   m = 1 : p   do
15:       if   k m + 1 > 0   then
16:         y k y k + h m x k m + 1
17:       end   if
18:     end   for
19:   end   for
20:   x y
21:   p FFT arg   max k = 0 . . . n x k                                                                                 Computation   of   v FFT
22:   v FFT x p FFT
23:   p FFT 1 / 2 round p FFT / 2
24:   p FFT 1 / 3 round p FFT / 3
25:   if   max x p FFT ( 1 / 2 ) 1 . . . p FFT ( 1 / 2 ) + 1 > 1 / 3 v FFT   then
26:     p FFT arg max k = p FFT ( 1 / 2 ) 1 . . . p FFT ( 1 / 2 ) + 1 x k
27:     v FFT = x p FFT
28:   else   if   max x p FFT ( 1 / 3 ) 1 . . . p FFT ( 1 / 3 ) + 1 > 1 / 3 v FFT   then
29:    p FFT arg max k = p FFT ( 1 / 3 ) 1 . . . p FFT ( 1 / 3 ) + 1 x k
30:    v FFT = x p FFT
31:   end   if
32:   y 0                                                                                                                                                         Autocorrelation
33:   for   k = p a c o r r m i n :   n   do                                                                                                                                                                                                               Skip   first   72 Hz
34:    for   m = 1 :   n   do
35:       if   k m + 1 > 0   then
36:         y n k + 1 y k + x n m + 1 x k m + 1
37:       end   if
38:     end   for
39:   end   for
40:   for   k = p a c o r r m i n :   n   do                                                                                                                                                                                                               Remove   mean
41:     y k y k mean y
42:  end   for
43:   x y
44:   k = 1                                                                                                     Find   first   non - negative   peak
45:   if   x 1 > 0   then
46:     x 1
47:   else
48:     while   x k 0   and   k < n   do
49:       k = k + 1
50:     end   while

51:  end   if
52:   while   x k + 1 x k > 0   and   k < n   do
53:     k = k + 1
54:   end   while
55:   p acorr k
56:   p F F T m a x arg max k = 0 ,   . . . n x k                                                                                                                                                         Find   highest   peak
57:   if   p accor = p F F T m a x   and   p accor < p FFT + p F F T o f f s e t   then
58:    if   p FFT > p F F T m i n   and   v FFT > v FFT ( min )   then
59:     F 0 4 p FFT
60:     else
61:     F 0 4 p acorr
62:     end   if
63:   else
64:     F 0 4 p acorr
65:   end   if

References

  1. Roy, N.; Merrill, R.M.; Gray, S.D.; Smith, E.M. Voice Disorders in the General Population: Prevalence, Risk Factors, and Occupational Impact. Laryngoscope 2005, 115, 1988–1995. [Google Scholar] [CrossRef] [PubMed]
  2. Vilkman, E. Occupational safety and health aspects of voice and speech professions. Folia Phoniatr. Logop. 2004, 56, 220–253. [Google Scholar] [CrossRef] [PubMed]
  3. Artkoski, M.; Tommila, J.; Laukkanen, A.M. Changes in voice during a day in normal voices without vocal loading. Logoped. Phoniatr. Vocology 2002, 27, 118–123. [Google Scholar] [CrossRef] [PubMed]
  4. Laukkanen, A.M.; Ilomäki, I.; Leppänen, K.; Vilkman, E. Acoustic measures and self-reports of vocal fatigue by female teachers. J. Voice 2008, 22, 283–289. [Google Scholar] [CrossRef] [PubMed]
  5. Lehto, L.; Laaksonen, L.; Vilkman, E.; Alku, P. Changes in objective acoustic measurements and subjective voice complaints in call center customer-service advisors during one working day. J. Voice 2008, 22, 164–177. [Google Scholar] [CrossRef] [PubMed]
  6. Rantala, L.; Vilkman, E. Relationship between subjective voice complaints and acoustic parameters in female teachers’ voices. J. Voice 1999, 13, 484–495. [Google Scholar] [CrossRef] [PubMed]
  7. Rantala, L.; Vilkman, E.; Bloigu, R. Voice changes during work: Subjective complaints and objective measurements for female primary and secondary schoolteachers. J. Voice 2002, 16, 344–355. [Google Scholar] [CrossRef] [PubMed]
  8. Jónsdottir, V.; Laukkanen, A.M.; Vilkman, E. Changes in teachers’ speech during a working day with and without electric sound amplification. Folia Phoniatr. Logop. 2002, 54, 282–287. [Google Scholar] [CrossRef] [PubMed]
  9. Vilkman, E.; Lauri, E.R.; Alku, P.; Sala, E.; Sihvo, M. Effects of prolonged oral reading on F0, SPL, subglottal pressure and amplitude characteristics of glottal flow waveforms. J. Voice 1999, 13, 303–312. [Google Scholar] [CrossRef]
  10. Rantala, L.; Lindholm, P.; Vilkman, E. F0 change due to voice loading under laboratory and field conditions. A pilot study. Logop. Phoniatr. Vocology 1998, 23, 164–168. [Google Scholar] [CrossRef]
  11. Švec, J.G.; Titze, I.R.; Popolo, P.S. Estimation of sound pressure levels of voiced speech from skin vibration of the neck. J. Acoust. Soc. Am. 2005, 117, 1386–1394. [Google Scholar] [CrossRef] [PubMed]
  12. Zañartu, M. Smartphone-Based Detection of Voice Disorders by Long-Term Monitoring of Neck Acceleration Features. In Proceedings of the 2013 IEEE International Conference on Body Sensor Networks, Cambridge, MA, USA, 6–9 May 2013; Available online: https://www.academia.edu/65461206/Smartphone_based_detection_of_voice_disorders_by_long_term_monitoring_of_neck_acceleration_features (accessed on 8 April 2024).
  13. Searl, J.; Dietsch, A.M. Tolerance of the VocaLogTM Vocal Monitor by Healthy Persons and Individuals with Parkinson Disease. J. Voice 2015, 29, 518.e13–518.e20. [Google Scholar] [CrossRef] [PubMed]
  14. Masuda, T.; Ikeda, Y.; Manako, H.; Komiyama, S. Analysis of vocal abuse: Fluctuations in phonation time and intensity in 4 groups of speakers. Acta Otolaryngol. 1993, 113, 547–552. [Google Scholar] [CrossRef] [PubMed]
  15. Ainsworth, W.A. Clinical Voice Disorders: An Interdisciplinary Approach, 3rd edn. By Arnold E. Aronson.Pp. 394. Thieme, 1990. DM 78.00 hardback. ISBN 3 13 598803 1. Exp. Physiol. 1992, 77, 537. [Google Scholar] [CrossRef]
  16. Ahlander, V.L.; Garc, D.P.; Whitling, S.; Rydell, R.; Löfqvist, A. Teachers’ Voice Use in Teaching Environments: A Field Study Using Ambulatory Phonation Monitor. J. Voice 2014, 28, 841.e5–841.e15. [Google Scholar] [CrossRef]
  17. Cheyne, H.A.; Hanson, H.M.; Genereux, R.P.; Stevens, K.N.; Hillman, R.E. Development and testing of a portable vocal accumulator. J. Speech Lang. Hear. Res. 2003, 46, 1457–1467. [Google Scholar] [CrossRef] [PubMed]
  18. Van Stan, J.H.; Mehta, D.D.; Zeitels, S.M.; Burns, J.A.; Barbu, A.M.; Hillman, R.E. Average Ambulatory Measures of Sound Pressure Level, Fundamental Frequency, and Vocal Dose Do Not Differ Between Adult Females With Phonotraumatic Lesions and Matched Control Subjects. Ann. Otol. Rhinol. Laryngol. 2015, 124, 864–874. [Google Scholar] [CrossRef] [PubMed]
  19. Zanartu, M.; Ho, J.C.; Mehta, D.D.; Hillman, R.E.; Wodicka, G.R. Subglottal Impedance-Based Inverse Filtering of Voiced Sounds Using Neck Surface Acceleration. IEEE Trans. Audio Speech Lang. Process. 2013, 21, 1929–1939. [Google Scholar] [CrossRef]
  20. Van Stan, J.H.; Gustafsson, J.; Schalling, E.; Hillman, R.E. Direct Comparison of Three Commercially Available Devices for Voice Ambulatory Monitoring and Biofeedback. Perspect. Voice Voice Disord. 2014, 24, 80–86. [Google Scholar] [CrossRef]
  21. Fryd, A.S.; van Stan, J.H.; Hillman, R.E.; Mehta, D.D. Estimating Subglottal Pressure From Neck-Surface Acceleration During Normal Voice Production. J. Speech Lang. Hear. Res. 2016, 59, 1335–1345. [Google Scholar] [CrossRef]
  22. Morrow, S.L.; Connor, N.P. Comparison of voice-use profiles between elementary classroom and music teachers. J. Voice 2011, 25, 367–372. [Google Scholar] [CrossRef] [PubMed]
  23. Mehta, D.D.; Van Stan, J.H.; Hillman, R.E. Relationships between vocal function measures derived from an acoustic microphone and a subglottal neck-surface accelerometer. IEEE/ACM Trans. Audio Speech Lang. Process. 2016, 24, 659–668. [Google Scholar] [CrossRef] [PubMed]
  24. Holbrook, A.; Rolnick, M.I.; Bailey, C.W. Treatment of vocal abuse disorders using a vocal intensity controller. J. Speech Hear. Disord. 1974, 39, 298–303. [Google Scholar] [CrossRef] [PubMed]
  25. Zicker, J.E.; Tompkins, W.J.; Rubow, R.T.; Abbs, J.H. A portable microprocessor-based biofeedback training device. IEEE Trans. Biomed. Eng. 1980, 27, 509–515. [Google Scholar] [CrossRef] [PubMed]
  26. Ryu, S.; Komiyama, S.; Kannae, S.; Watanabe, H. A newly devised speech accumulator. ORL J. Otorhinolaryngol. Relat. Spec. 1983, 45, 108–114. [Google Scholar] [CrossRef]
  27. Ohlsson, A.C.; Brink, O.; Lofqvist, A. A voice accumulation--validation and application. J. Speech Hear. Res. 1989, 32, 451–457. [Google Scholar] [CrossRef] [PubMed]
  28. McGillivray, R.; Proctor-Williams, K.; McLister, B. Simple biofeedback device to reduce excessive vocal intensity. Med. Biol. Eng. Comput. 1994, 32, 348–350. [Google Scholar] [CrossRef] [PubMed]
  29. Rantala, L.; Haataja, K.; Vilkman, E.; Körkkö, P. Practical arrangements and methods in the field examination and speaking style analysis of professional voice users. Scand. J. Logop. Phoniatr. 1994, 19, 43–54. [Google Scholar] [CrossRef]
  30. Buekers, R.; Bierens, E.; Kingma, H.; Marres, E.H.M.A. Vocal load as measured by the voice accumulator. Folia Phoniatr. Logop. 1995, 47, 252–261. [Google Scholar] [CrossRef]
  31. Airo, E.; Olkinuora, P.; Sala, E. A method to measure speaking time and speech sound pressure level. Folia Phoniatr. Logop. 2000, 52, 275–288. [Google Scholar] [CrossRef]
  32. Szabo, A.; Hammarberg, B.; Håkansson, A.; Södersten, M. A voice accumulator device: Evaluation based on studio and field recordings. Logoped. Phoniatr. Vocology 2001, 26, 102–117. [Google Scholar] [CrossRef] [PubMed]
  33. Popolo, P.S.; Švec, J.G.; Titze, I.R. Adaptation of a Pocket PC for use as a wearable voice dosimeter. J. Speech Lang. Hear. Res. 2005, 48, 780–791. [Google Scholar] [CrossRef] [PubMed]
  34. Virebrand, M. Real-Time Monitoring of Voice Characteristics Usingaccelerometer and Microphone Measurements. 2011. Available online: https://www.diva-portal.org/smash/record.jsf?pid=diva2%3A432959&dswid=-3972 (accessed on 8 April 2024).
  35. Lindstrom, F.; Waye, K.P.; Södersten, M.; McAllister, A.; Ternström, S. Observations of the relationship between noise exposure and preschool teacher voice usage in day-care center environments. J. Voice 2011, 25, 166–172. [Google Scholar] [CrossRef] [PubMed]
  36. Mehta, D.D.; Zañartu, M.; Feng, S.W.; Cheyne, H.A.I.; Hillman, R.E. Mobile voice health monitoring using a wearable accelerometer sensor and a smartphone platform. IEEE Trans. Biomed. Eng. 2012, 59, 3090–3096. [Google Scholar] [CrossRef] [PubMed]
  37. Carullo, A.; Vallan, A.; Astolfi, A. Design issues for a portable vocal analyzer. IEEE Trans. Instrum. Meas. 2013, 62, 1084–1093. [Google Scholar] [CrossRef]
  38. Carullo, A.; Vallan, A.; Astolfi, A. A low-cost platform for voice monitoring. In Proceedings of the 2013 IEEE International Instrumentation and Measurement Technology Conference (I2MTC), Minneapolis, MN, USA, 6–9 May 2013; pp. 67–72. [Google Scholar] [CrossRef]
  39. Hillman, R.E.; Mehta, D.D. Ambulatory Monitoring of Daily Voice Use. Perspect. Voice Voice Disord. 2011, 21, 56–61. [Google Scholar] [CrossRef]
  40. Hunter, E.J.; Hunter, E.J. Vocal Dose Measures: General Rationale, Traditional Methods and Recent Advances. 2016. Available online: https://www.researchgate.net/publication/311192575 (accessed on 17 June 2024).
  41. Bottalico, P.; Ipsaro Passione, I.; Astolfi, A.; Carullo, A.; Hunter, E.J. Accuracy of the quantities measured by four vocal dosimeters and its uncertainty. J. Acoust. Soc. Am. 2018, 143, 1591–1602. [Google Scholar] [CrossRef]
  42. VocaLog2 Help File. Available online: http://www.vocalog.com/VL2_Help/VocaLog2_Help.html (accessed on 10 April 2024).
  43. Mehta, D.D.; Chwalek, P.C.; Quatieri, T.F.; Brattain, L.J. Wireless Neck-Surface Accelerometer and Microphone on Flex Circuit with Application to Noise-Robust Monitoring of Lombard Speech. In Proceedings of the 18th Annual Conference of the International Speech Communication Association, Interspeech 2017, Stockholm, Sweden, 20–24 August 2017; pp. 684–688. [Google Scholar] [CrossRef]
  44. Chwalek, P.C.; Mehta, D.D.; Welsh, B.; Wooten, C.; Byrd, K.; Froehlich, E.; Maurer, D.; Lacirignola, J.; Quatieri, T.F.; Brattain, L.J. Lightweight, on-body, wireless system for ambulatory voice and ambient noise monitoring. In Proceedings of the 2018 IEEE 15th International Conference on Wearable and Implantable Body Sensor Networks (BSN), Las Vegas, NV, USA, 4–7 March 2018; Volume 2018, pp. 205–209. [Google Scholar] [CrossRef]
  45. Hunter, E.J.; Titze, I.R. Variations in intensity, fundamental frequency, and voicing for teachers in occupational versus nonoccupational settings. J. Speech Lang. Hear. Res. 2010, 53, 862–875. [Google Scholar] [CrossRef]
  46. Gama, A.C.C.; Santos, J.N.; Pedra, E.d.F.P.; Rabelo, A.T.V.; Magalhães, M.d.C.; Casas, E.B.d.L. Vocal dose in teachers: Correlation with dysphonia. CoDAS 2016, 28, 190–192. [Google Scholar] [CrossRef] [PubMed]
  47. Morrow, S.L.; Connor, N.P. Voice amplification as a means of reducing vocal load for elementary music teachers. J. Voice 2011, 25, 441–446. [Google Scholar] [CrossRef]
  48. Gaskill, C.S.; O’Brien, S.G.; Tinter, S.R. The effect of voice amplification on occupational vocal dose in elementary school teachers. J. Voice 2012, 26, 667.e19–667.e27. [Google Scholar] [CrossRef] [PubMed]
  49. Astolfi, A.; Puglisi, G.E.; Cantor Cutiva, L.C.; Pavese, L.; Carullo, A.; Burdorf, A. Associations between Objectively-measured Acoustic Parameters and Occupational Voice Use among Primary School Teachers. Energy Procedia 2015, 78, 3422–3427. [Google Scholar] [CrossRef]
  50. Echternach, M.; Nusseck, M.; Dippold, S.; Spahn, C.; Richter, B. Fundamental frequency, sound pressure level and vocal dose of a vocal loading test in comparison to a real teaching situation. Eur. Arch. Otorhinolaryngol. 2014, 271, 3263–3268. [Google Scholar] [CrossRef] [PubMed]
  51. Franca, M.C.; Wagner, J.F. Effects of vocal demands on voice performance of student singers. J. Voice 2015, 29, 324–332. [Google Scholar] [CrossRef] [PubMed]
  52. Van Stan, J.H.; Mehta, D.D.; Hillman, R.E. The Effect of Voice Ambulatory Biofeedback on the Daily Performance and Retention of a Modified Vocal Motor Behavior in Participants With Normal Voices. J. Speech Lang. Hear. Res. 2015, 58, 713–721. [Google Scholar] [CrossRef] [PubMed]
  53. Titze, I.R.; Hunter, E.J.; Švec, J.G. Voicing and silence periods in daily and weekly vocalizations of teachers. J. Acoust. Soc. Am. 2007, 121, 469–478. [Google Scholar] [CrossRef] [PubMed]
  54. Astolfi, A.; Carullo, A.; Pavese, L.; Puglisi, G.E. Duration of voicing and silence periods of continuous speech in different acoustic environments. J. Acoust. Soc. Am. 2015, 137, 565–579. [Google Scholar] [CrossRef] [PubMed]
  55. Yoshiyuki, H.; Fuller, B.F. Selected acoustic characteristics of voices before intubation and after extubation. J. Speech Hear. Res. 1990, 33, 505–510. [Google Scholar] [CrossRef]
  56. Misono, S.; Banks, K.; Gaillard, P.; Goding, G.S.; Yueh, B. The clinical utility of vocal dosimetry for assessing voice rest. Laryngoscope 2015, 125, 171–176. [Google Scholar] [CrossRef]
  57. Stevens, K.N.; Kalikow, D.N.; Willemain, T.R. A miniature accelerometer for detecting glottal waveforms and nasalization. J. Speech Hear. Res. 1975, 18, 594–599. [Google Scholar] [CrossRef]
  58. Castellana, A.; Carullo, A.; Casassa, F.; Astolfi, A. Performance Comparison of Different Contact Microphones Used for Voice Monitoring. 2015. Available online: https://iris.polito.it/handle/11583/2649989 (accessed on 17 June 2024).
  59. Hunter, E.J. Teacher response to ambulatory monitoring of voice. Logoped. Phoniatr. Vocology 2012, 37, 133–135. [Google Scholar] [CrossRef] [PubMed]
  60. Klatt, D.H. Linguistic uses of segmental duration in English: Acoustic and perceptual evidence. J. Acoust. Soc. Am. 1976, 59, 1208–1221. [Google Scholar] [CrossRef] [PubMed]
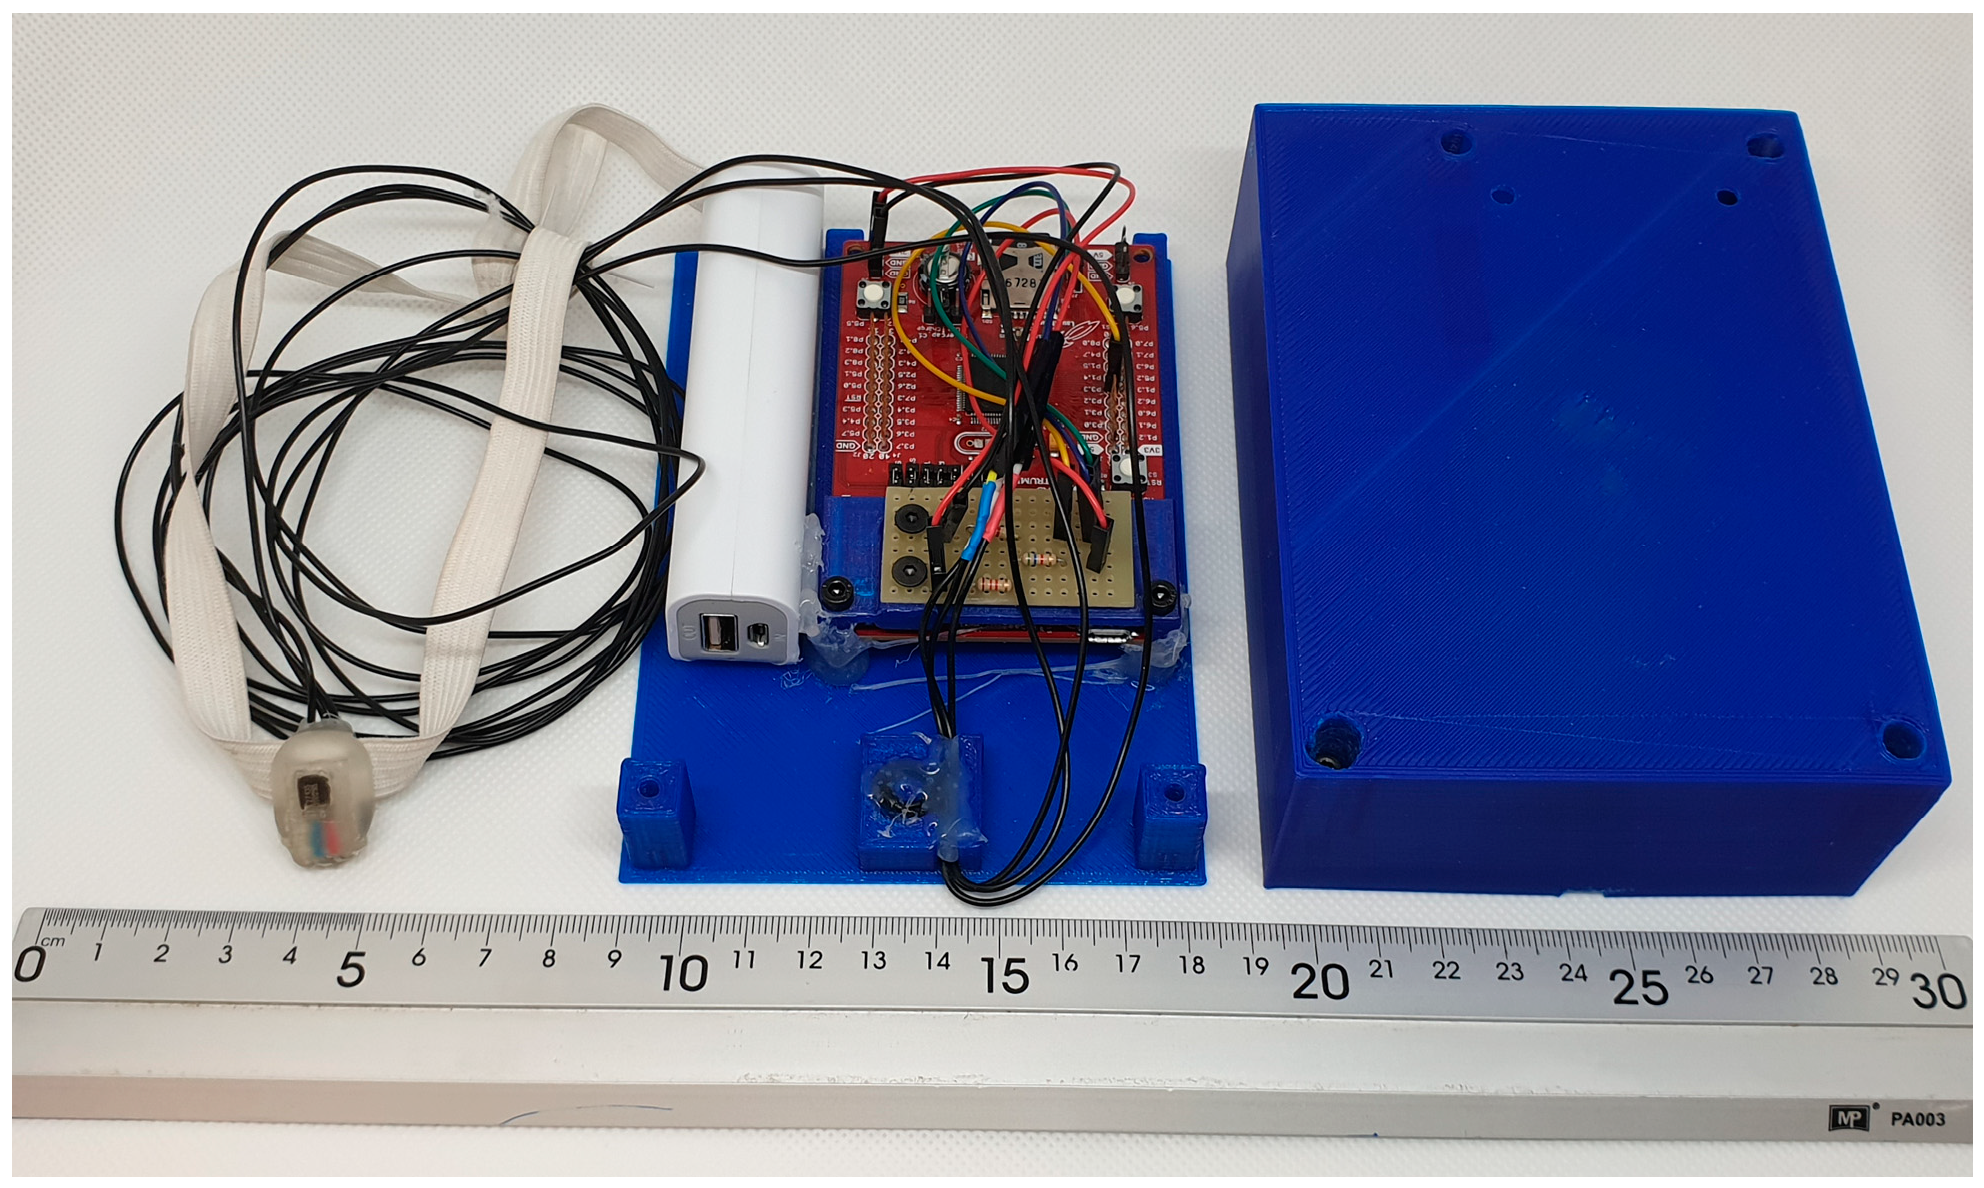
Figure 1. The prototype of the wearable voice dosimetry system. From left: the accelerometer with the support for use as a pendant, the development board including battery, and the case.
Applsci 14 05806 g001
Figure 2. Signal processing flow. Signal F0 = 90 Hz, three harmonics (1, 1, 1).
Applsci 14 05806 g002
Figure 3. (a) Support to position the accelerometer on the suprasternal region, and (b) Mock of the final prototype.
Applsci 14 05806 g003
Figure 4. Example of accelerometer signal processing: (a) signal waveform, (b) FFT magnitude with the voiced activity detection threshold, and (c) FFT magnitude low-pass filtered.
Applsci 14 05806 g004
Figure 5. Magnitude spectra, their filtered versions and the autocorrelation functions of their filtered magnitude spectra for the test signals used to verify algorithm implementation. All harmonics signals are sines. The test signals are as follows: (a) F0 = 120 Hz, three harmonics (1, 1, 1); (b) F0 = 200 Hz, three harmonics (0.5, 0.7, 1); (c) F0 = 400 Hz, two harmonics (0.5, 1); (d) F0 = 600 Hz, one harmonic.
Applsci 14 05806 g005
Figure 6. Microcontroller activity. The ME line is yellow if the processor is in low power mode and red if it is running. The LEA line is grey when the LEA is inactive and green or red when it is active. (a) No phonation was detected, and LEA activates twice: for FFT and magnitude computation. (b) Phonation detected, LEA activates four times for FFT, magnitude, filtering, and autocorrelation.
Applsci 14 05806 g006aApplsci 14 05806 g006b
Figure 7. F0 measurements produced by the device (blue), their mean for each tonal step (yellow), and the SoundScope readings (orange).
Applsci 14 05806 g007
Figure 8. Scatterplot correlating the values of the fundamental frequency recorded by the SoundScope and the mean fundamental frequency per F0 step calculated by the device.
Applsci 14 05806 g008
Figure 9. Absolute error of the mean F0 per tonal step estimated by the device with respect to the SoundScope measurements.
Applsci 14 05806 g009
Figure 10. Scatter diagram of the logarithm of the relative intensity values obtained by the device (RMS) and the intensity recorded by the sound level meter. (a) Subject 1, R = 0.86; (b) Subject 2, R = 0.96.
Applsci 14 05806 g010
Figure 11. Validation of intensity measurement for vowel-only recording: acoustic signal (red) and intensity measurement by the device (blue).
Applsci 14 05806 g011
Figure 12. Placement of the sensor on the larynx using the 3D printed accelerometer support made of resin.
Applsci 14 05806 g012
Figure 13. Evolution of the F0 throughout the recording of day 7 of subject 1.
Applsci 14 05806 g013
Figure 14. Evolution of the percent phonation time in 5 min segments throughout the recording of day 7 of subject 1.
Applsci 14 05806 g014
Table 1. Comparison of the principal characteristics of voice dosimetry devices. The following abbreviations have been used: M—Monitoring, F—Feedback.
AuthorYearDevice NameMonitor FeedbackSensor TypeParameters MeasuredRec. TimeSampling Rate (Hz)Analysis Interval (Subinterval)Dimensions (cm)Weight (g)Price
Holbrook et al. [24]1974VICFContact MicA, tphon 12 × 6 × 4
Zicker et al. [25]1980 FMicA 2000.5 s15 × 10 × 81000
Ryu et al. [26]1983M Contact MicA, tphon12 h 60 s [17]9 × 6 × 3150
Ohlsson et al. [27]1989RALOF01MContact Piezoel. MicF0, tphon12 h1200–18006 s (200 ms)19 × 11 × 5475
Masuda et al. [14]1993 MContact MicA, tphon12 h 0.1 s13 × 9 × 3400
McGillivray
et al. [28]
1994 FMicA
Rantala et al. [29]1994 MMicF0, A1.5 h500070–250 ms (2.5–10 ms)
Buekers et al. [30]1995 MMicA, tphon12 h11 s15 × 9 × 4600
Airo et al. [31]2000 M2 MicsA, tphon8 h1002 s (10 ms) 120
Szabo et al. [32]2001VACLF1MContact MicF0, tphonAprox. 12 h 1–10 s (50, 100, 200, 500 ms)14 × 7 × 3250
Cheyne et al. [17]2003PVA or APMM, FAccF0, A, tphon12 h11,025125 ms (25 ms)12 × 8.5 × 2200$5000
Popolo et al. [33]2005NCBSMAccF0, A, tphon2–3 h 30 ms13 × 8 × 1.6
Virebrand [34]2011VoxLogM, FAcc. MicF0, A, tphon2–14
(h) 1
5–60 s (100–1000 ms) 112 × 2.5 × 2.5 [29]
Lindstrom et al. [35]2011 MAcc, MicF0, A, tphon 48,00030 ms
Mehta et al. [36]2012VHMM, F [32]AccF0, A, tphon18 h11,02550 ms (25 ms) 175 1
Carullo et al. [37,38]2013Voice-CareMContact MicF0, A, tphon5 h 2, 11 h19,230 (M) 38,460 (calbi.)30 ms15 × 10 × 5 400 € 900 € 3
1800 € 4
Griffin Laboratories,
Temecula, USA
(Van Stan et al. [20];
Hilman, Mehta [39];
Hunter [40];
Bottalico et al. [41];
Vocalog [42])
2014VocalogM, FContact MicA, tphon3 weeks 5 1 s7 × 5.5 × 1.5 $999
2016Vocalog2M, FContact MicA, tphon3 days [39]1 s$394
Mehta et al. [43];
Chwalek et al. [44]
2017 MAcc MicF0, A, tphon24 h44,10050 ms68 × 14 × 5 514 6
1 Dimensions: those of Nexus S, weight: 139 g (Nexus S) − 9 g (Nexus S original battery) + 45 g (Mugen 3900 mAh XL extended battery). 2 Memory storage capacity. Battery life not mentioned. 3 Vocal Report Holter Med—Prototype 1.1.1, provided by PR.O.VOICE S.r.l., Italy. (VAT not included). 4 Vocal Report Holter Med—Prototype 2.0.0, provided by PR.O.VOICE S.r.l., Italy. (VAT not included). 5 Dimensions of the emitter placed on the skin. The receiver size is 59 × 25 × 10 mm. 6 Weight of the emitter placed on the skin. The receiver weighs 47.5 g excluding the battery. Battery life not mentioned.
Table 2. Comparison of commercial devices [20,38].
Voice ParameterAPMVoxLogVocalLogVoice-Care
Intensity (dBspl)XXXX
Intensity warningXXX
Fundamental frequency (Hz)XX X
Frequency warningXX
Phonation time (hh:mm:ss)XXXX
Ambient noise (dBSPL) X
Number of CyclesX
Distance travelled by the vocal folds (meters)X
Intensity calibrationDailyNot necessaryOnceOnce
Table 3. Components of the wearable voice dosimetry system.
ComponentDimensions (mm)Weight (g)Price (€)
Microcontroller MSP430FR599416 × 16 × 1.50.4627.18
Accelerometer BU-27135-0007.92 × 5.59 × 2.280.2841.25
Molex 504077-1891 micro SD slot11.32 × 15.4 × 2.30.1881.77
Motherboard + SMD components20 × 16 × 2<1<2.00
400 mAh battery37 × 25 × 5.2134.44
Circuit for battery charging37 × 10 × 2.5<5<10.00
Total55 × 36 × 6.5<20<67
Table 4. Comparison of the calculation or measurement of phonation times with different systems: Audacity and the proposed device.
RecordingAudacity (s)Device (s)Ratio (%)
Subject 1813543
Subject 2746081
Subject 3756992
Vocals7.77.9103
Table 5. Long-term recordings of subject 1.
DayRecording Time (h)% Phonation
15.500.18
25.850.10
36.370.15
46.190.13
54.520.11
65.270.10
76.480.16
87.170.11
96.190.12
104.750.20
115.670.06
125.620.08
135.790.11
142.270.05
Disclaimer/Publisher’s Note: The statements, opinions and data contained in all publications are solely those of the individual author(s) and contributor(s) and not of MDPI and/or the editor(s). MDPI and/or the editor(s) disclaim responsibility for any injury to people or property resulting from any ideas, methods, instructions or products referred to in the content.