Article

Effect of Lateral Confining Pressure on Shale’s Mechanical Properties and Its Implications for Fracture Conductivity

1
College of Transportation Engineering, Dalian Maritime University, Dalian 116026, China
2
State Key Laboratory of Geomechanics and Geotechnical Engineering, Institute of Rock and Soil Mechanics, Chinese Academy of Sciences, Wuhan 430071, China
*
Authors to whom correspondence should be addressed.
Appl. Sci. 2024, 14(13), 5825; https://doi.org/10.3390/app14135825
Submission received: 20 June 2024 / Revised: 1 July 2024 / Accepted: 2 July 2024 / Published: 3 July 2024
(This article belongs to the Special Issue Advances in Unconventional Natural Gas: Exploration and Development)

Abstract

:
The field stress of the shale affects the proppant embedment, fracture conductivity, well production rate, and ultimately the recovery of hydrocarbons from reservoir formations. This paper presents, for the first time, an experimental study investigating the mechanical characteristics of a shale under confining pressures that simulate the in situ stress state in deep reservoirs. Bidirectional but equal confining pressures were applied to the shale sample to replicate its field stress state. Microindentation tests were conducted to assess the alterations of mechanical properties resulting from the application of confining pressures. The results demonstrate a significant increase in Young’s modulus, hardness, and fracture toughness for the samples subjected to confining pressure. Considering the effect of confining pressure, the decrease in proppant embedment is proportional to Young’s modulus of the shale. For larger-sized proppants (e.g., D = 2.50 mm), the influence of confining pressure on fracture conductivity is relatively minor. However, when smaller-sized proppants (e.g., D = 1.00 mm) are used, particularly in scenarios involving shale debris swelling due to prolonged interaction with fracturing fluid, there is a noticeable improvement in fracture conductivity. Importantly, previous computational models have tended to overestimate proppant embedment depth while underestimating fracture conductivity. The findings from this study contribute to advancing the understanding of shale’s mechanical characteristics under in situ reservoir conditions and support the optimization of proppant embedment and fracture conductivity calculation models for the efficient extraction of shale gas.

1. Introduction

In order to address the challenges and limitations associated with conventional oil and natural gas resources, it is essential to actively promote the exploration and extraction of shale gas and enhance the availability of unconventional natural gas reserves. These initiatives play a critical role in optimizing the overall energy landscape and driving reforms in energy production and consumption [1]. Shale gas, being an unconventional form of natural gas primarily found in shale reservoirs, has garnered significant attention in recent years [2]. Hydraulic fracturing has emerged as a successful technique for improving reservoir permeability and enhancing the recovery of shale gas, making it a pivotal technology for shale gas development [3]. During the hydraulic fracturing process, proppants are introduced into the fractures and become embedded within the shale formation due to their interaction with the fracture surfaces under closure pressures; this embedding mechanism results in a reduction in fracture aperture and conductivity (Figure 1) [4]. As a result, the vital role played by proppant embedment in facilitating the stimulation effect of hydraulic fracturing becomes evident. Therefore, it is crucial to thoroughly investigate the influencing factors that affect both proppant embedment and fracture conductivity through a combination of experimental research and theoretical calculations.
The main factors influencing proppant embedment depth and fracture conductivity include closure pressure, the size, arrangement, Young’s modulus, and Poisson’s ratio of the proppant, as well as Young’s modulus and Poisson’s ratio of the shale [5,6,7,8,9]. Among these factors, as production time increases, the fluid pressure within the fracture gradually decreases, and the closure pressure tends to stabilize. Proppants such as quartz and ceramsite, due to their stable physical and chemical properties, typically do not react with hydraulic fracturing fluid; hence, the mechanical parameters related to proppants can be considered essentially unchanged over time, so the changes in fracture aperture caused by the proppant itself primarily result from deformation under closure pressure. However, shale is an intricate, porous material with multiple phases and scales, comprised of diverse inorganic solid minerals and organic components. When it comes into contact with hydraulic fracturing fluid, it undergoes changes in microstructural properties and degradation in mechanical characteristics such as elasticity, hardness, and strength. This process ultimately softens the shale, leading to reduced fracture conductivity and diminished shale gas production [10,11]. Several previous studies have investigated the shale softening behaviors induced by fracturing fluid. Yuan et al. (2014) established a linear correlation between swelling strain and water content by examining the shale’s wettability and water adsorption capacity [12]. Zhang et al. (2016) linked the decrease in fracture conductivity to the presence of clay content [13]. Liao et al. (2020) examined the fracture mechanical properties of Longmaxi shale samples under different environmental conditions, concluding that clay mineral hydration and expansion were the primary factors contributing to fluid weakening effects. Moreover, the impact of interactions between solid minerals and fracturing fluids on shale microstructure (such as pores) and permeability has been discussed [14]. Sanaei et al. (2018) noted expansion in the electrical double layer (EDL) content and composition, emphasizing that clay swelling within the hydraulic fracture network is a significant factor contributing to production decline [15]. Wu and Sharma (2017) suggested that acid fracturing fluids underwent chemical reactions with carbonate-rich shale, resulting in alterations to the micropore structure within the shale [16]. It can be observed that the scholarly focus primarily revolves around studying the physical and chemical mechanisms underlying the interaction between hydraulic fracturing fluid and shale, which leads to the deterioration of shale strength and subsequently increased proppant embedment. However, the impact of reservoir confining pressures on the mechanical properties of shale and their influence on proppant embedment are often disregarded in both experimental research and theoretical models.
In current research, instrumented indentation testing offers an alternative and nondestructive technique for investigating the mechanical properties of monolithic and multiphase materials at various scales, providing distinct advantages over conventional uniaxial compression tests [17,18,19,20,21]. Nanoindentation, in particular, is widely employed for investigating the mechanical properties of specific phases within complex materials like shale and concrete [22,23,24]. Several studies have explored the mechanical responses of both individual phases and bulk rock of shale using novel nanoindentation techniques. For instance, Lu et al. (2020) proposed a statistical nanoindentation method to assess the softening effects caused by water–shale interactions [25]. Similarly, Luo et al. (2020) created a statistical nanoindentation technique incorporating data analytics to analyze the mechanical characteristics of shale at various length scales [26]. Their results indicate that, with adequate indentation depth, the mechanical properties derived from instrumented indentation tests can accurately reflect the overall mechanical behavior of the bulk rock. In comparison, microindentation offers advantages such as larger applied loads and indentation depths, allowing for the direct capture of the macroscopic mechanical parameters of shale. Song et al. (2021) effectively performed a sequence of microindentation experiments to assess the extent and pace of mechanical property deterioration in shale following exposure to thermo-hydro-mechanical–chemical (THMC) treatments mimicking rock–fluid interactions in deep reservoirs before and after hydraulic fracturing [27]. Additionally, Song et al. (2022) utilized microindentation tests to analyze the creep behavior of THMC-treated specimens and proposed an optimization model for proppant embedment depth and fracture conductivity based on these results [28]. Therefore, microindentation is a reliable and efficient technique used to evaluate the macroscopic mechanical behavior of shale; nevertheless, the studies mentioned above have predominantly examined shale specimens without the presence of confining pressure, leaving a notable research gap concerning the investigation of mechanical response characteristics in shale under bidirectional confining pressures.
This paper presents a comprehensive study on the fundamental relationship between microindentation test results and the stress state of the Longmaxi shale. To achieve this, shale samples were subjected to bidirectional confining pressures to replicate the underground stress conditions encountered in deep reservoirs. The microindentation testing employed a spherical indenter to simulate the interaction between proppant and shale. Experimental data were collected and analyzed to investigate the effects of the confining pressure on load–displacement behavior, Young’s modulus, Brinell hardness, fracture toughness, proppant embedment, and fracture conductivity. The findings from this study contribute to generating a deeper understanding of the mechanical characteristics of shale under in situ reservoir conditions and facilitate the optimization of proppant embedment and fracture conductivity calculation models for shale gas extraction.

2. Materials and Methods

2.1. Samples and Sample Preparation

The shale samples analyzed in this study were obtained from the Longmaxi Formation, situated in the Sichuan Basin in the southwestern region of China. Specifically, the samples were retrieved from a depth range of 2300–2500 m. To facilitate unconfined compression tests, three cylindrical specimens with dimensions of 25 mm in diameter and 50 mm in height were trimmed from a single, intact core. Furthermore, from the same core, an additional cubic specimen measuring 20 mm on each side was obtained specifically for the microindentation measurements. To maintain consistency in measurements, the maximum nonuniformity error for the two end faces of cylindrical specimens and the six surfaces of the cube was limited to 0.02 mm. Additionally, the error in sample length and diameter was controlled within a tolerance of 0.02 mm. All the shale specimens displayed no apparent defects upon visual inspection. Upon completion of a meticulous mixing and homogenization procedure, the cuttings and residuals were assembled for the compositional analysis, and the mineralogical composition of the shale samples is presented in Table 1 [28].

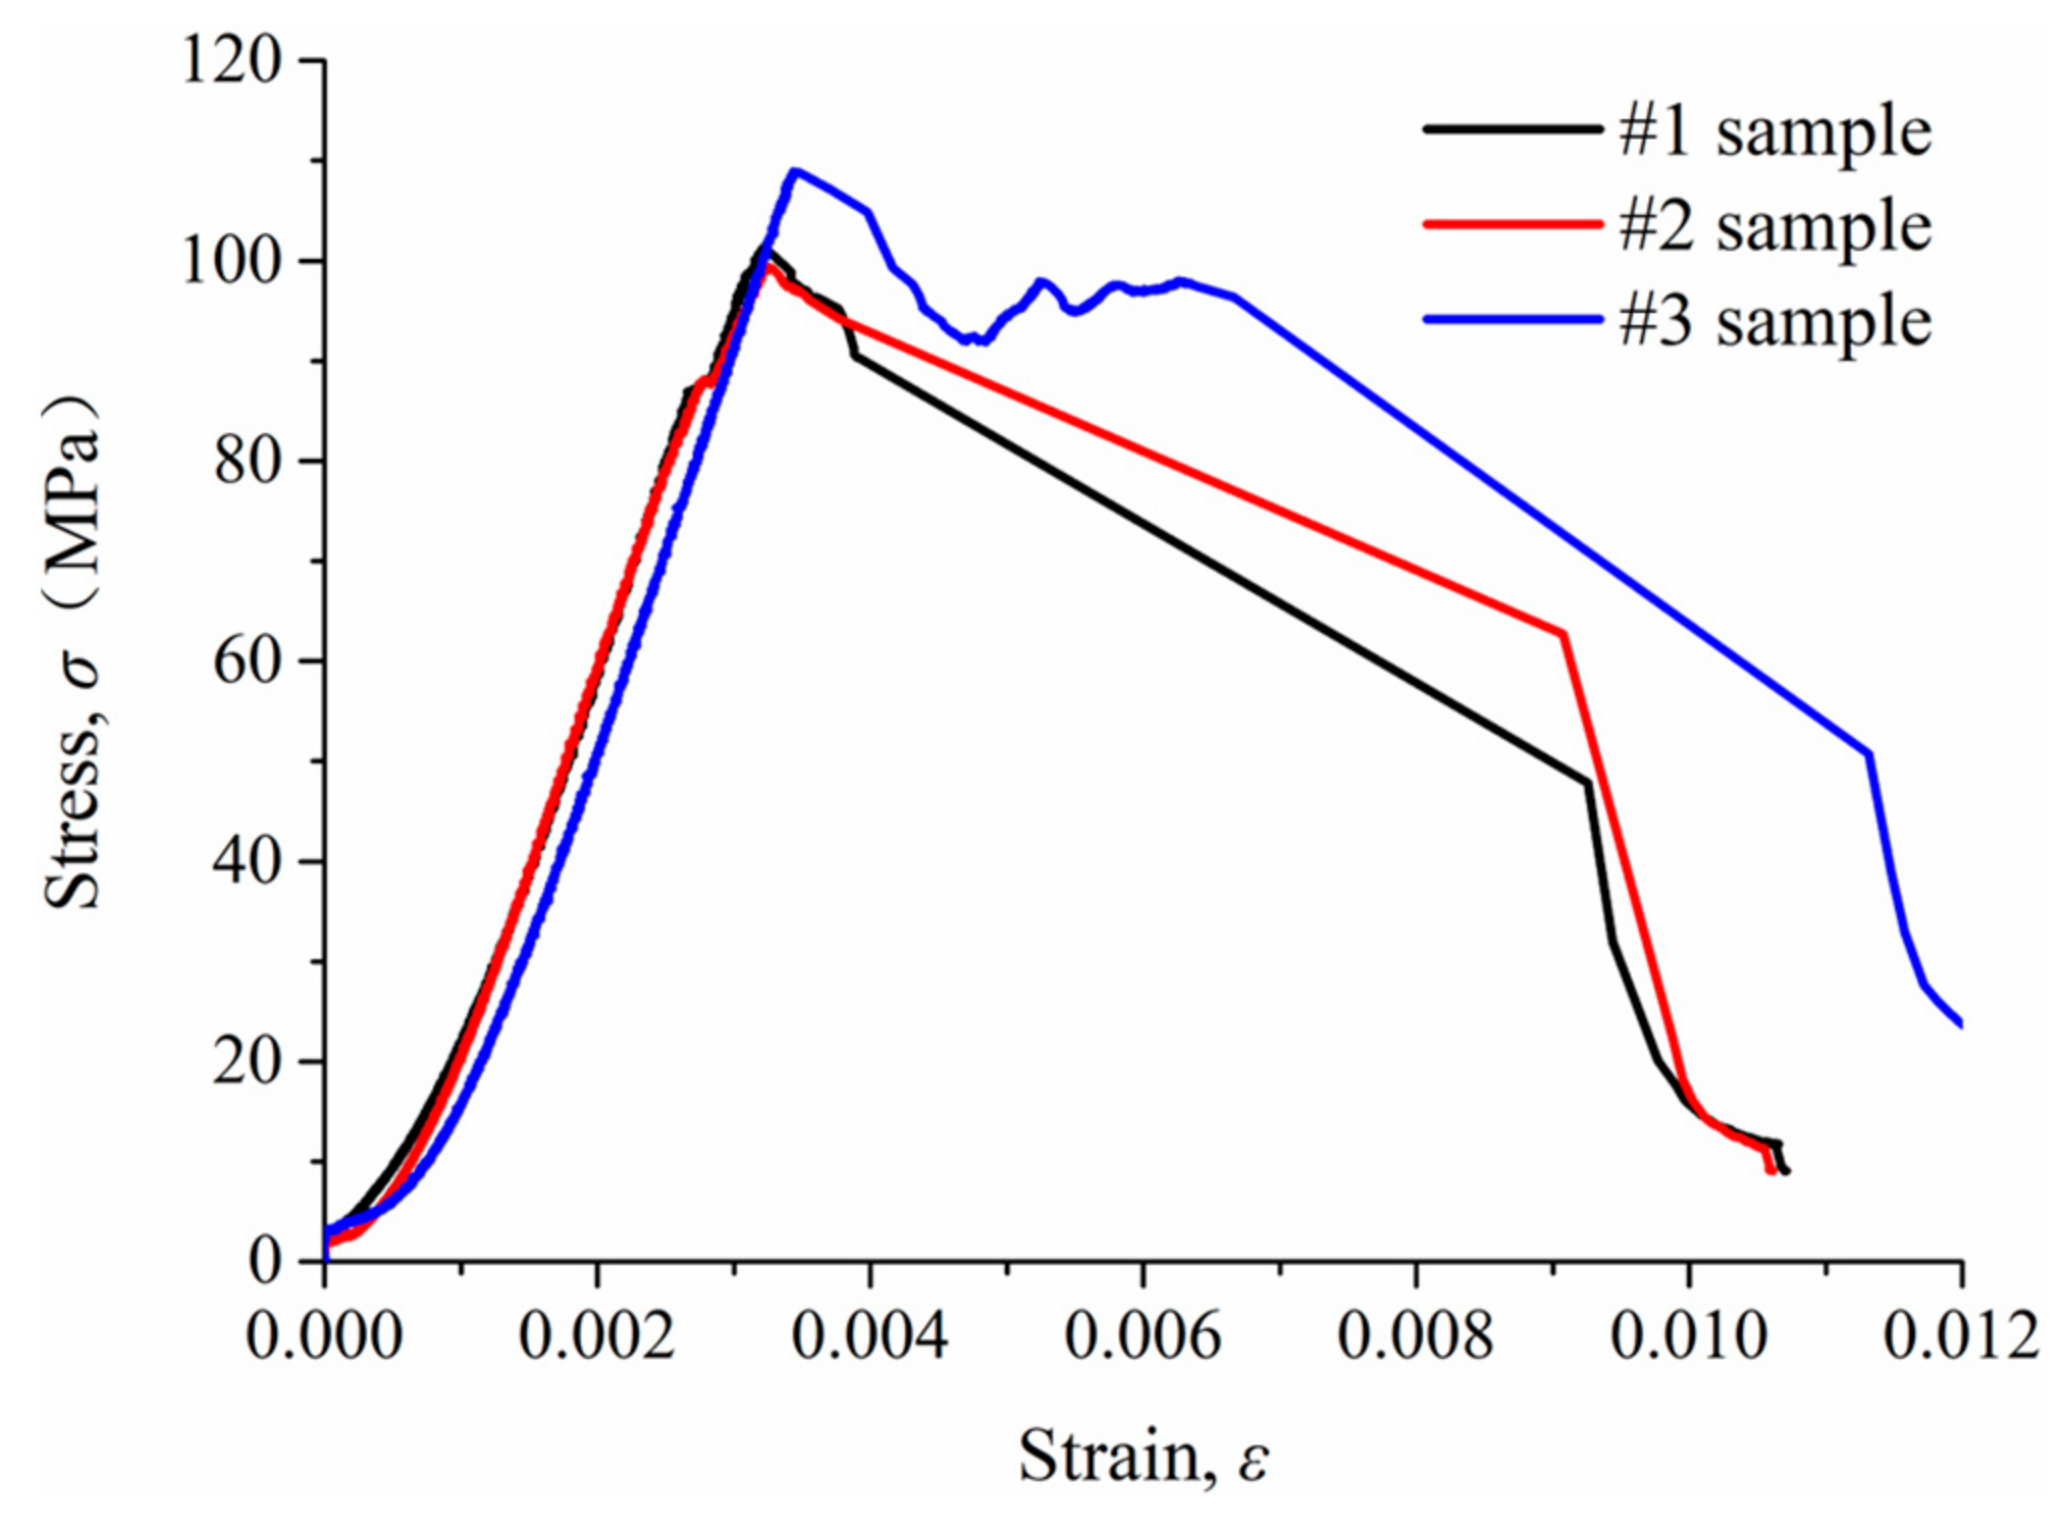
2.2. Unconfined Compression Testing

Prior to testing, the prepared shale samples were subjected to a drying process by being placed in an oven at a temperature of 70 °C for a duration of 24 h. Following the completion of the drying period, the samples were transferred to a desiccator and allowed to cool down to room temperature. The unconfined compression test was conducted using the RMT-150C servo test system (Institute of Rock and Soil Mechanics, Chinese Academy of Sciences in Wuhan, China) (Figure 2), comprising the main engine, hydraulic system, servo control system, and a digital controller equipped with system software. The RMT-150C servo test system had a maximum vertical load capacity of 1500 kN, and the load control rates spanned from 0.01 to 90 kN/s, while the deformation control rates ranged between 0.0001 and 1.00 mm/s. The applied load was incrementally raised at a consistent loading rate of 0.10 mm/min until the specimen reached failure, resulting from the occurrence of cracking and fracturing. Throughout the testing process, data regarding the axial load, radial displacement, and strain were meticulously recorded. The objective of this test was to determine Young’s modulus (E), which serves as a means to validate the findings of subsequent microindentation experiments. Moreover, it is possible to obtain uniaxial compressive strength (UCS), Poisson’s ratio (ν), and other related parameters. The average values of UCS, E, and ν were considered as the fundamental mechanical parameters for the shale under study.

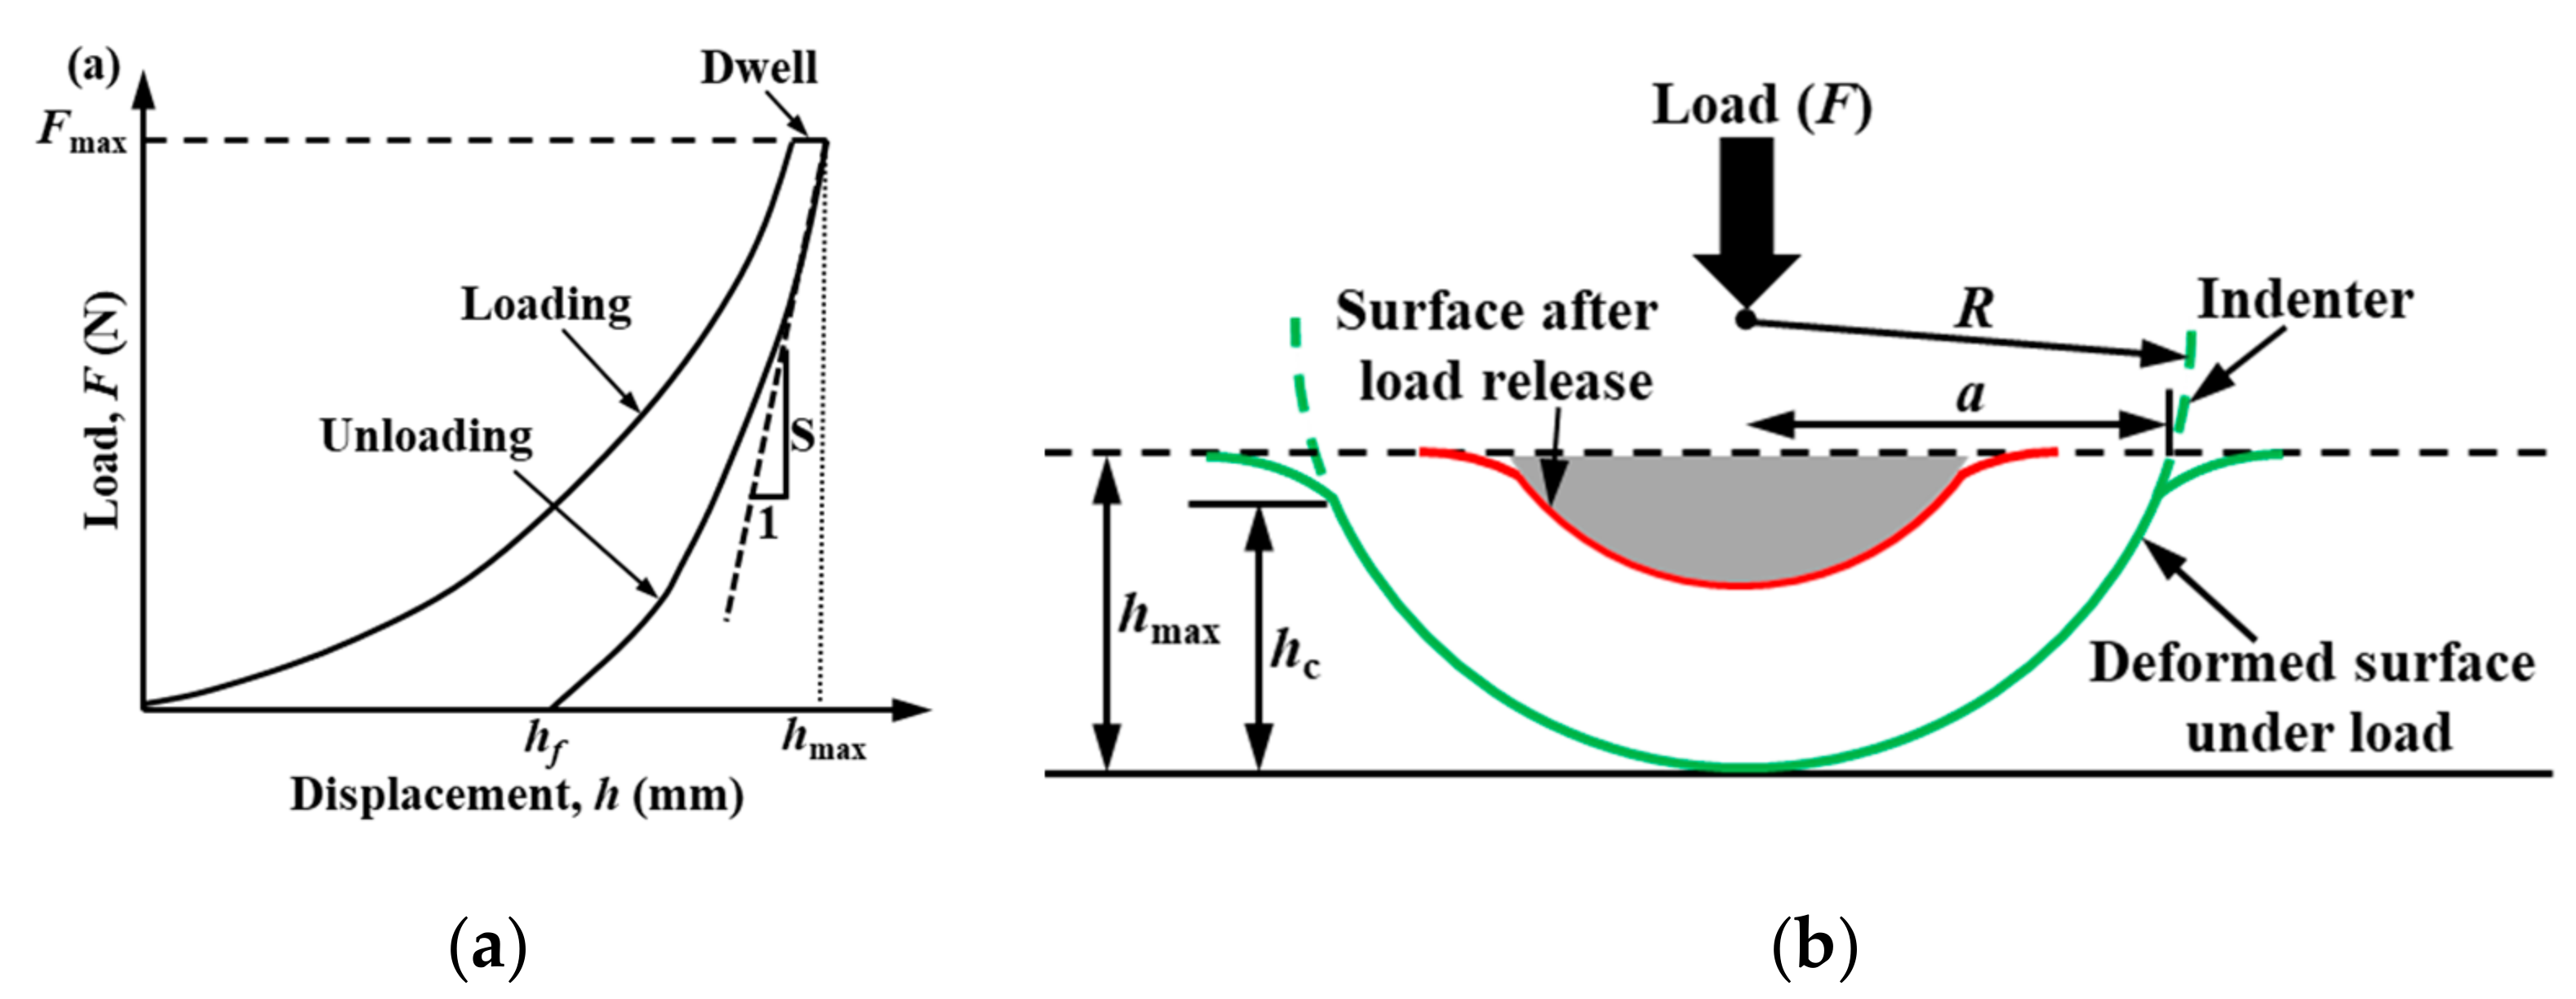
2.3. Microindentation Testing

The microindentation technique enables the characterization of mechanical properties for diverse materials. In this study, a single microindentation test involves the controlled loading and unloading of a highly rigid tip into the surface of the shale specimen, and to simulate the interaction between proppants and shale, a spherical tip was chosen as the indenter. Figure 3 depicts a representative loading–unloading cycle of a single microindentation. The mechanical characteristics of the shale samples were evaluated using the Oliver–Pharr method, with a specific focus on analyzing the F-h curve [29]. For fitting the upper segment of the unloading curve, a power law equation can be employed, as shown below:
F = η h h f m
where F represents the applied load, h denotes the indentation depth, η and m refer to the fitting parameters, and hf represents the final indentation depth.
The contact depth, designated as hc, is expressed as follows [30]:
ε m = 0.08158 m 0.94 0.061679 m 0.94 0.02 + 1.26386 m 0.94 0.001
h c = h max ε m × F max S
where ε(m) is a factor that accounts for the interplay between the indenter’s geometry and the plastic characteristics of the material being tested; hmax represents the maximum indentation depth; Fmax denotes the maximum applied load; and S stands for contact stiffness.
The contact stiffness, labeled as S, is determined by the slope of the upper segment of the unloading curve:
S = d F d h h = h max
The projected area of the contact surfaces, Ac, can be determined by calculating the area of the contact circle with radius, a, given by the following:
A c = π × a 2
The radius of the circle of contact, a, is computed as follows [31]:
a = 2 h c R h c 2
where R is the radius of the spherical indenter.
The Brinell hardness, HB, is performed by the following [32]:
H B = F max 9.80665 A c
The reduced modulus, Er, is subsequently computed using the following equation:
E r = π 2 A c S
To calculate Young’s modulus of the sample, the following equation is employed [33]:
1 E r = 1 ν 2 E + 1 ν i 2 E i
where E and Ei represent Young’s modulus of the tested sample and the indenter, respectively, whereas ν and νi denote Poisson’s ratio of the tested sample and indenter, with defined values of Ei = 700 GPa and νi = 0.3. Furthermore, Poisson’s ratio for shale samples can be derived from the results obtained through unconfined compression testing.
The microindentation testing system comprised two principal components: a bidirectional loading apparatus and a spherical penetration apparatus (Figure 4). The spherical penetration apparatus utilized in this study comprised a specialized spherical microindenter (Wance Technology Ltd., Shenzhen, China). It was designed with a customized spherical tungsten carbide tip measuring 2.5 mm in diameter and 1.25 mm in effective depth to facilitate accurate measurements. Additionally, the apparatus incorporated an electromagnetic load sensor capable of handling loads up to 5000 N. The bidirectional loading apparatus was constructed as a hollow square-shaped chamber designed to enable the precise application of two independent perpendicular loads. These loads were exerted onto the rock specimens using two servo-controlled hydraulic jacks incorporated within the apparatus. Considering the burial depth of the shale reservoir in this study (2300–2500 m), the maximum lateral confining loads exerted on the shale sample were limited to 20 MPa, and the lateral confining loads applied to the shale specimen were assumed to be identical. Therefore, a series of lateral confining pressures (i.e., 0, 2, 5, 10, and 20 MPa) were selected to replicate the field stress conditions experienced by the shale in this study. Subsequently, microindentation (i.e., spherical penetration) testing was performed following the application of the desired lateral confining pressures on the shale sample.
In preparation for the microindentation testing, it was essential to establish the maximum applied load (Fmax). Previous studies involved nano- to microindentation tests on comparable shales sourced from the Longmaxi Formation, validating that when the indentation depth surpassed a defined critical threshold (i.e., hmax ≥ 10 μm), the derived mechanical characteristics could accurately represent the bulk rock properties of the shale [25,26]. In this study, the Fmax of 100 N was determined, and the selection of such a substantial load was driven by three key reasons: (1) to mitigate the potential adverse effects of surface roughness and micropores on the measurements; (2) to consider the critical threshold of indentation depth; and (3) to enable the simulation of higher closure pressure (p) of approximately 20 MPa, akin to the reservoir pressure. In order to comprehensively evaluate the mechanical properties of shale under varying lateral confining loads, cyclic indentation tests were conducted on the specimen. Figure 5 shows the representative load–displacement curves of cyclic loading–unloading indentation tests. Upon reaching the predetermined maximum load under a loading rate of 100 N/min, the load was subsequently held constant for a duration of 60 s. Subsequently, monotonic unloading commenced at a consistent rate equivalent to that at Fmax. Unloading was halted once the load decreased to 5% of Fmax, followed by reloading back to Fmax to complete a total of five loading and unloading cycles. To assess the reproducibility of the conducted tests, cyclic indentation tests were performed at five different locations on the surface of the sample for each lateral confining load condition, and the spacing between adjacent indentation points was maintained at a minimum of 20 times the anticipated maximum indentation depth (Figure 5). This approach yielded 25 distinct mechanical parameters (e.g., E, HB, etc.) for the shale sample under each lateral confining load. The reported results in this study are presented as the average values derived from these 25 measurements.
The sample surface, which was aligned parallel to the depositional bedding plane, underwent indentation loading. To prepare the surface for indentation measurements, a step-by-step polishing method was carried out using a polisher with sandpapers ranging from #400 to #4000 in grit size. The final polishing stage involved the use of an ultrafine alumina suspension containing 0.3 μm aluminum powder. Throughout the entirety of the polishing process, meticulous precautions were taken to prevent shale hydration, ensuring that direct contact with water was avoided. Instead, the surface was diligently cleansed using ethanol. This rigorous procedure culminated in the creation of an exceptionally smooth and flat surface, ideal for subsequent microindentation testing.

3. Results

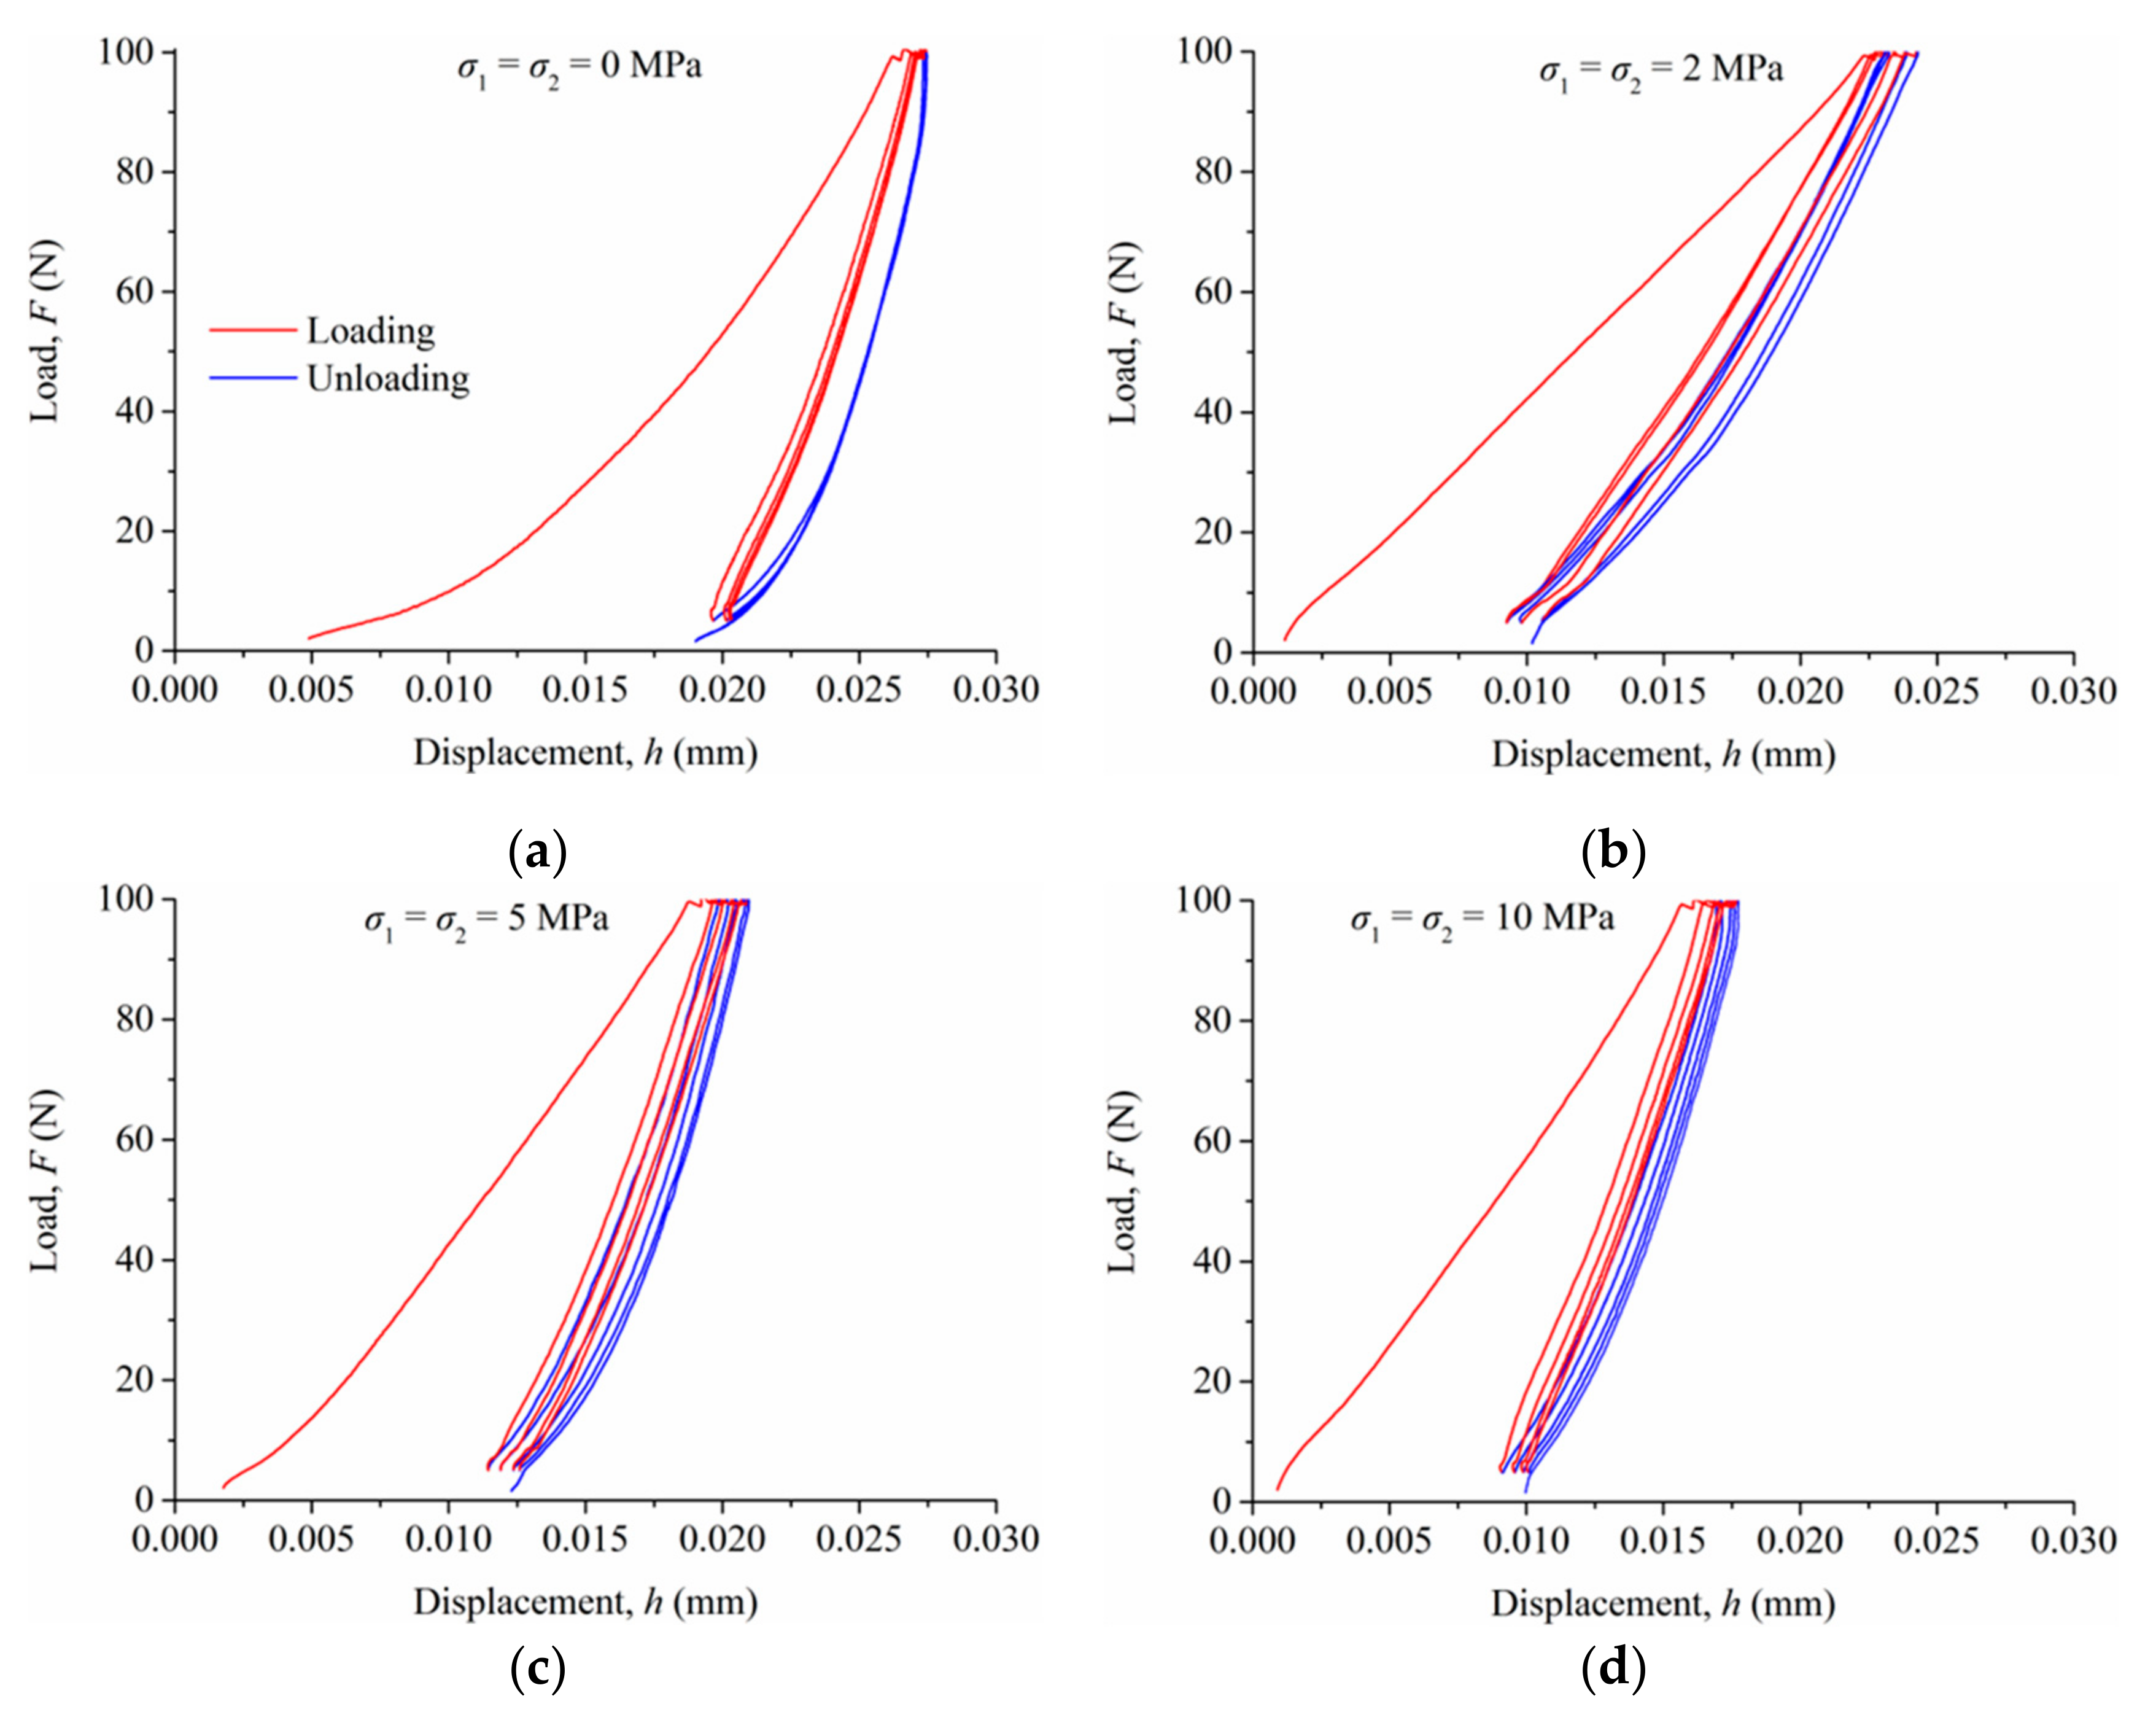
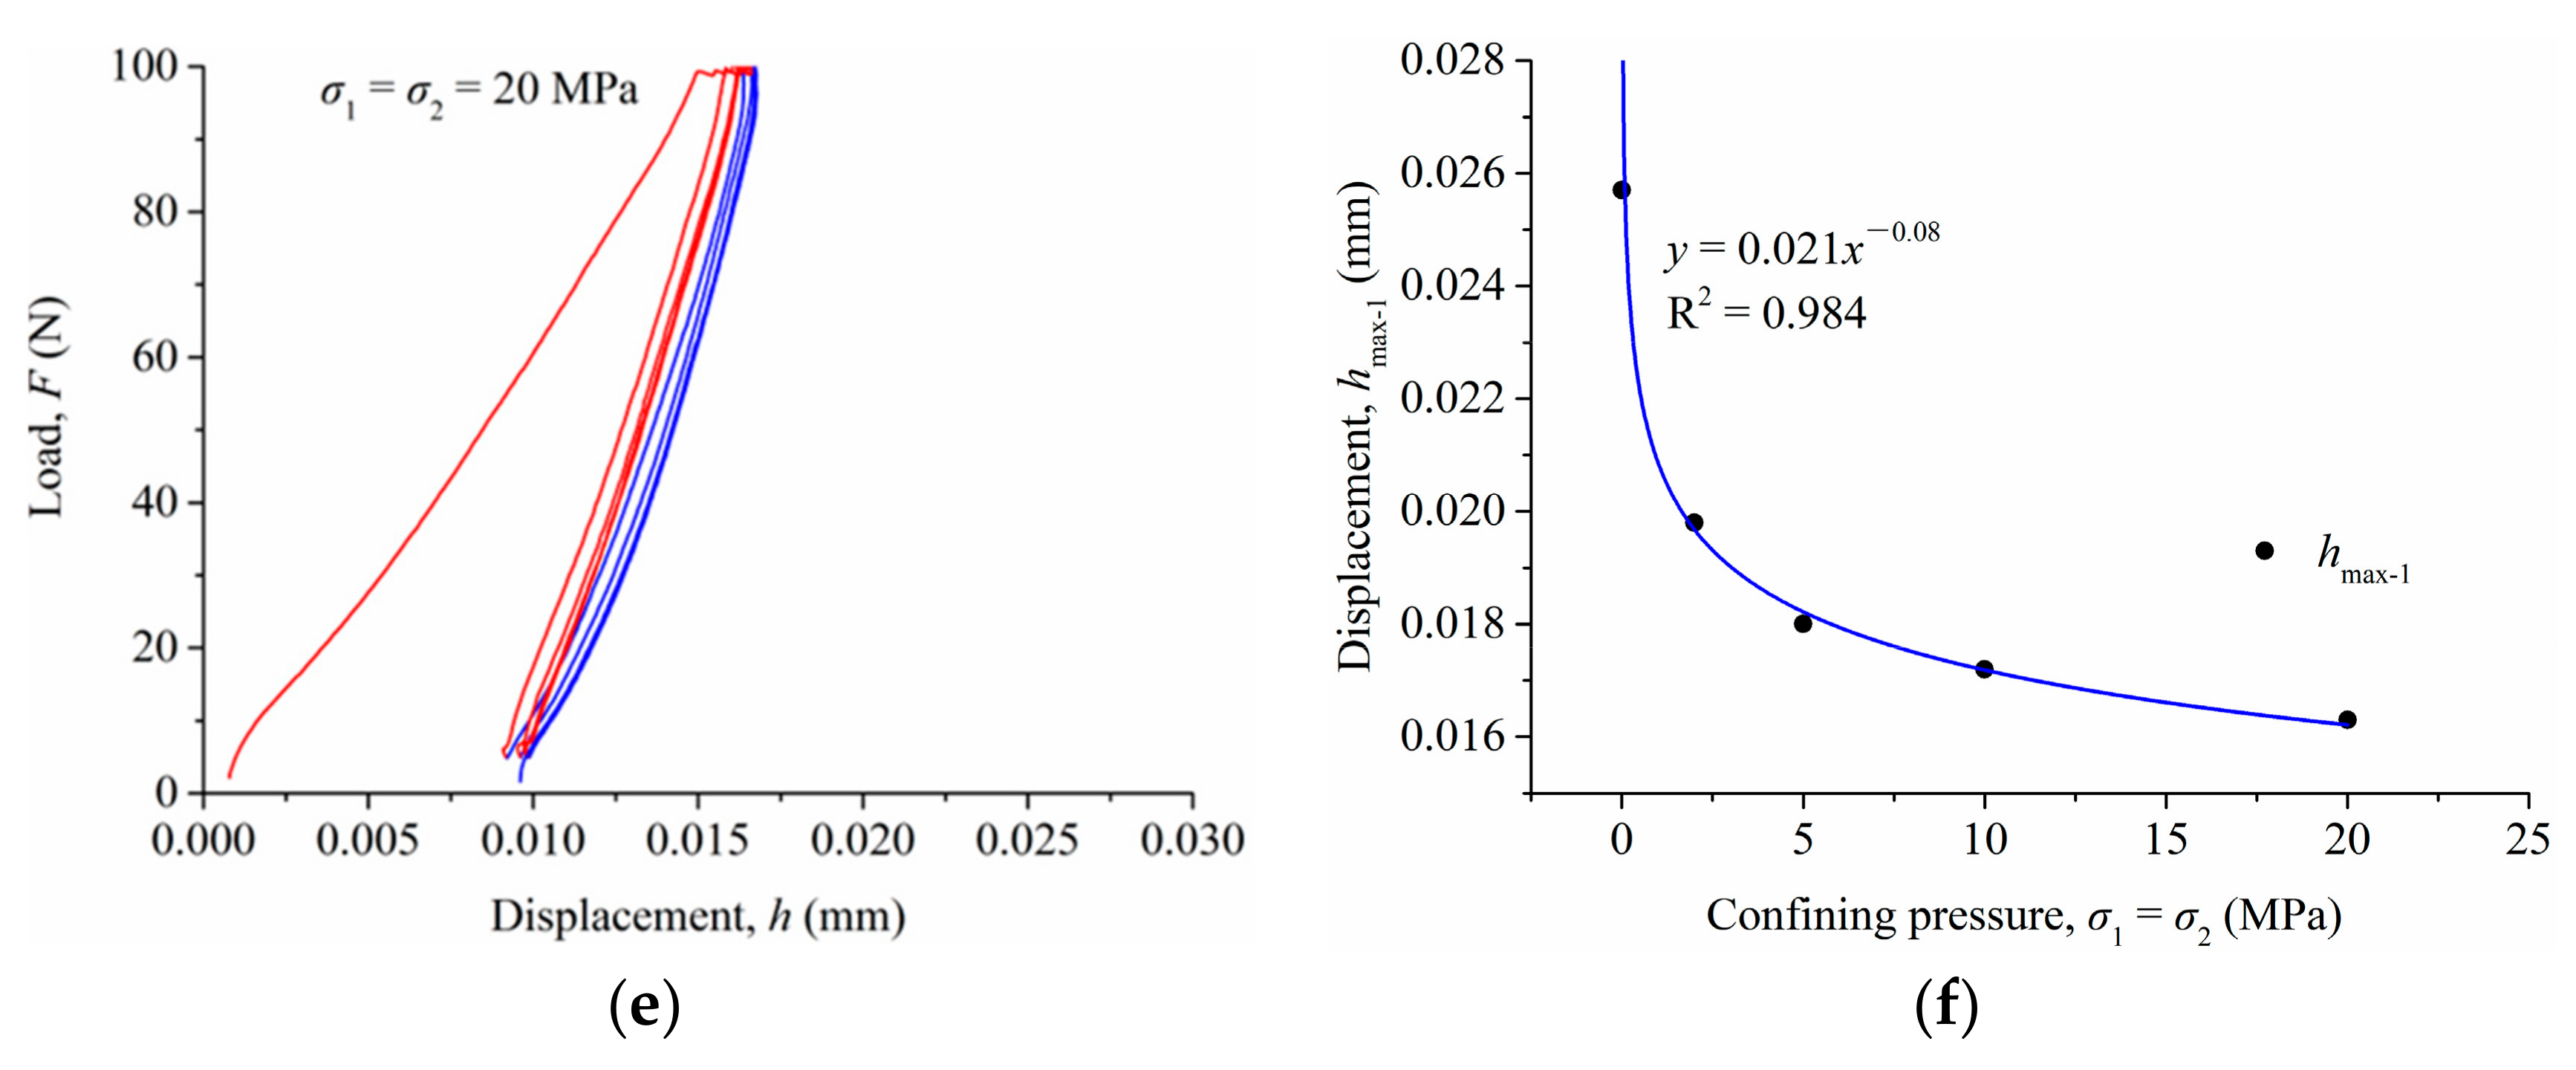
3.1. Indentation Load–Displacement Curves

Figure 6 illustrates representative load–displacement curves obtained from cyclic loading–unloading microindentation tests performed under both unconstrained conditions and bidirectional confining pressures. For ease of analysis, the maximum indentation depth (hmax-1) obtained during the first cycle of loading–unloading was selected for comparison. From Figure 6, it is evident that the value of hmax-1 exceeds the critical threshold (i.e., hmax ≥ 10 μm) at the maximum load of 100 N when considering both bidirectional confining pressure and no confining pressure; this indicates that the mechanical parameters obtained through subsequent analysis of the load–displacement curves can effectively represent the macroscopic mechanical characteristic of the shale.
As depicted in Figure 6a, no confining pressure results in an indentation depth of hmax-1 as 0.0257 mm (i.e., 25.7 μm), and Figure 6b–e show that as the confining pressure gradually increases to 20 MPa, the corresponding hmax-1 value decreases progressively from 0.0257 mm without any confining pressure to 0.0163 mm under the condition of 20 MPa, resulting in a reduction of 36.80%. This observation indicates that the shale sample becomes stronger and more resistant to indentation under bidirectional confining pressure, leading to increased difficulty for the indenter to penetrate. These findings highlight that in actual in situ reservoir environments, when considering the influence of confining pressure on enhancing the mechanical properties of shale, the embedment depth of proppant will be considerably smaller compared to scenarios where confining pressure is not taken into account. This effect will be particularly notable in deep reservoirs characterized by high confining pressures. Figure 6f presents a comprehensive overview of the variation in hmax-1 as a function of confining pressure. Notably, hmax-1 demonstrates an exponential decrease as the confining pressure increases. Moreover, as the confining pressure rises, the curve demonstrates a gradual flattening behavior, indicating that the diminishing effect on indentation depth becomes less significant with higher levels of confining pressure.

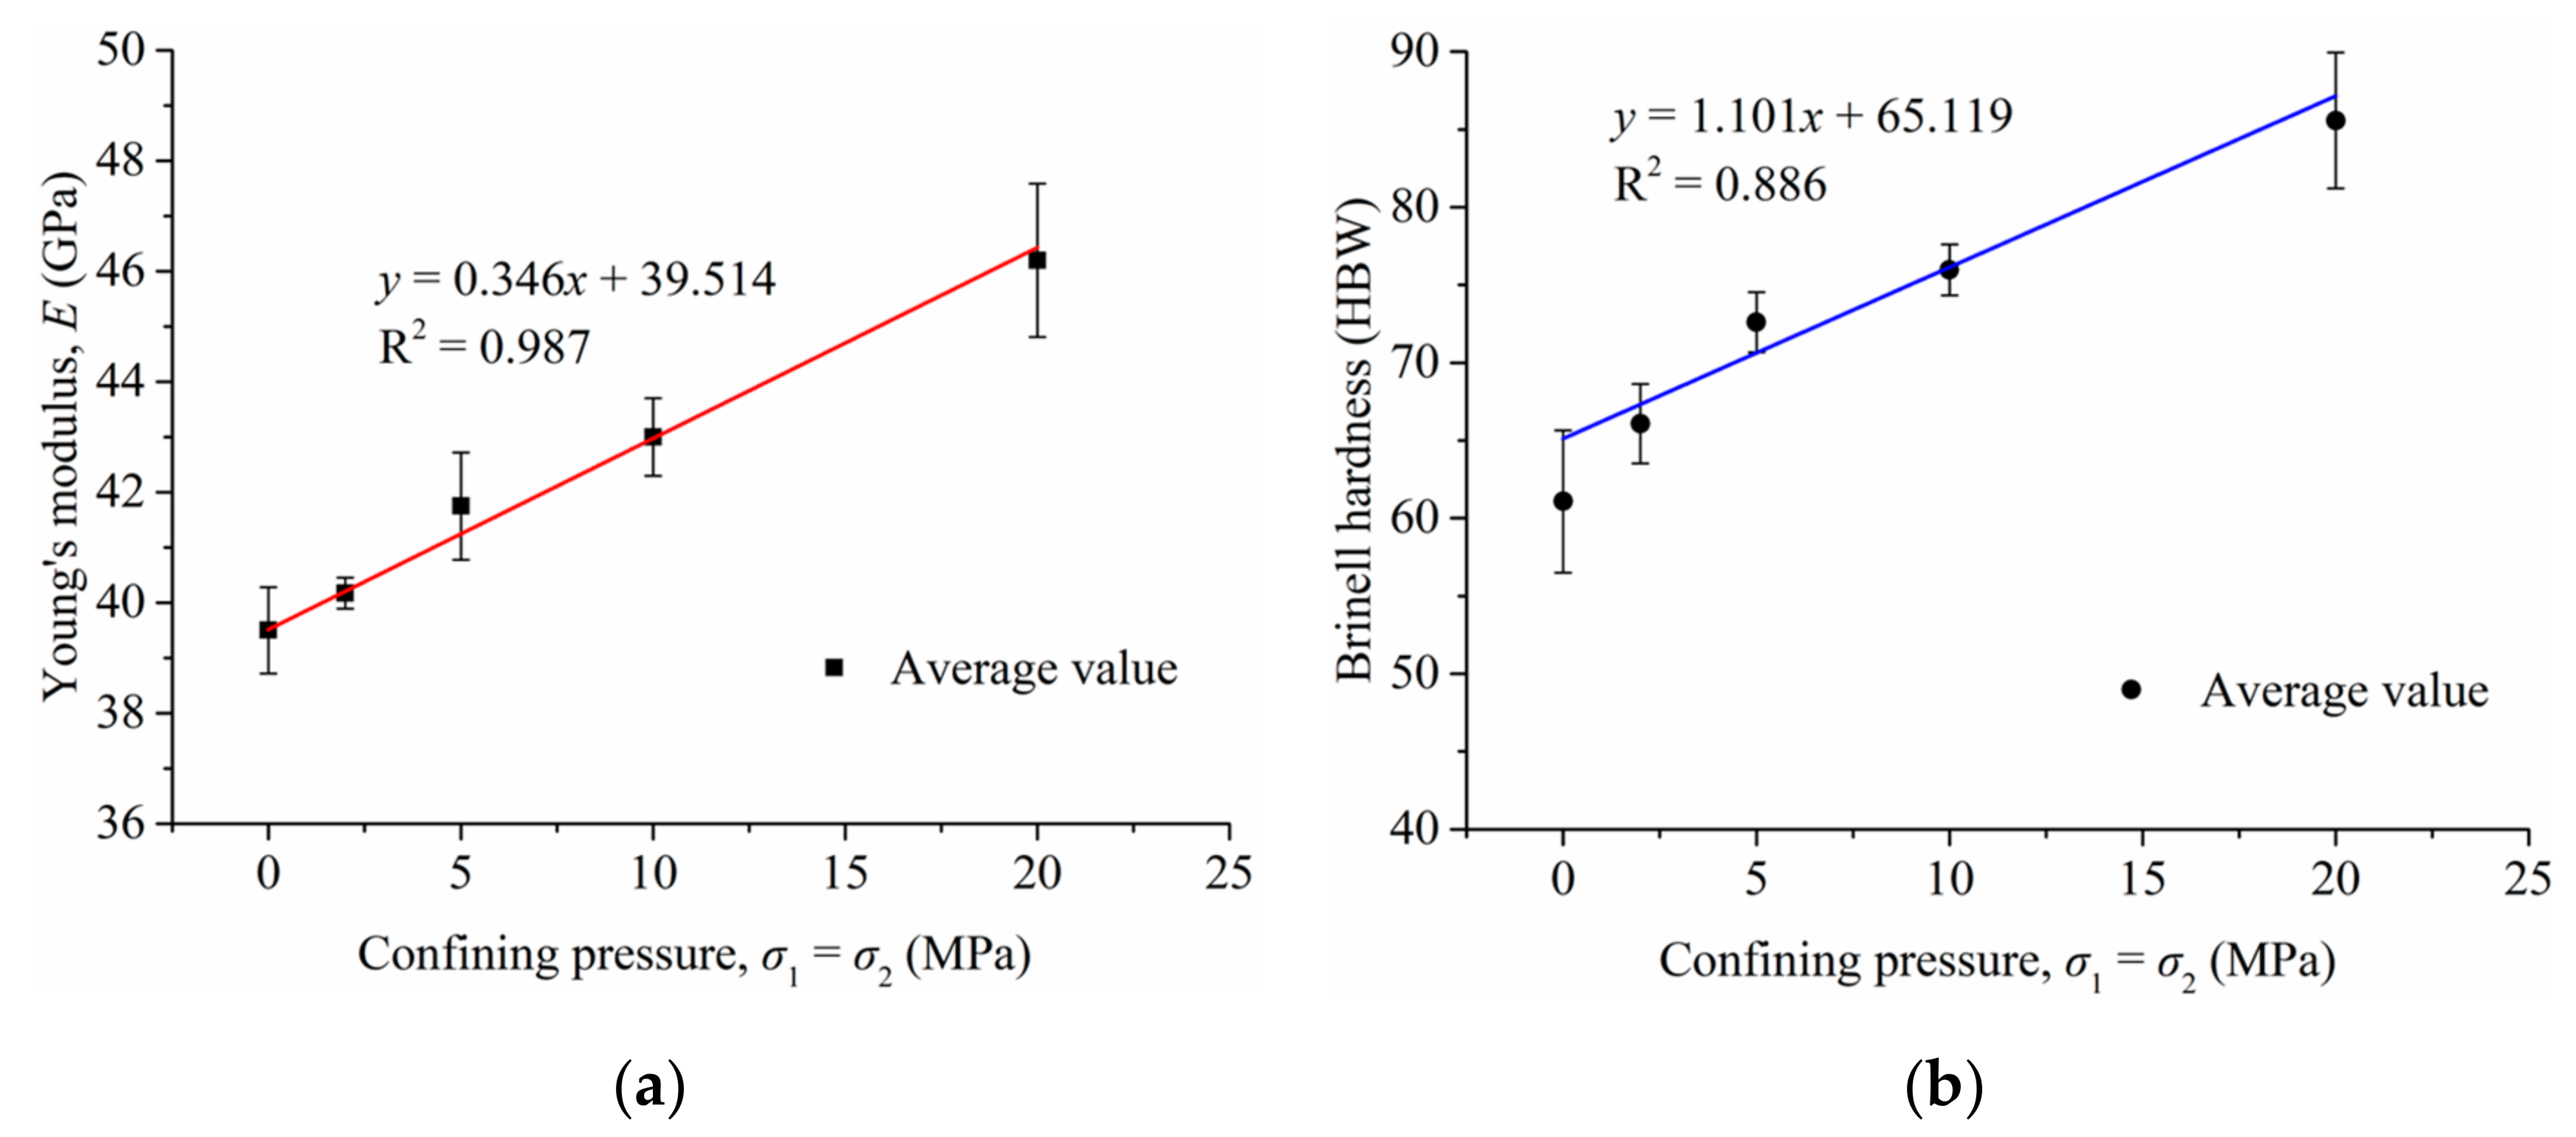
3.2. Young’s Modulus and Brinell Hardness

Figure 7 presents the stress–strain curves of all the unconfined compression tests performed on the cylindrical samples; it can be observed that the initial loading curves all consist of a curved segment, which is mainly due to the microdefects (e.g., microfractures and micropores) in the shale gradually becoming closer under the action of loading, thus making the sample denser [34]. In the subsequent calculation of mechanical parameters, this part is not taken into account, and only the linear segment afterwards is considered. Based on the obtained results in Table 2, it can be inferred that the three samples exhibit a high degree of homogeneity. The average Young’s modulus (E) for the samples is determined to be 40.04 GPa, while the average unconfined compressive strength (UCS) measures at 101.79 MPa. Additionally, Poisson’s ratio (ν) is calculated to be 0.25.
The relationship between Young’s modulus and confining pressure is demonstrated in Figure 8a. Without any confining pressure, the average Young’s modulus for the shale sample was calculated as 39.50 GPa using the Oliver–Pharr method. Comparing this value with the macroscopic Young’s modulus obtained from unconfined compression tests (i.e., 40.04 GPa), a minimal difference of merely 1.35% is observed. These findings suggest that the mechanical parameters derived from microindentation testing, conducted at a maximum load of 100 N, aptly represent the overall macroscopic mechanical characteristics of shale. With the escalation of confining pressure, the measured Young’s modulus demonstrates an upward trend and exhibits a positive correlation. When subjected to a confining pressure of 20 MPa, the measured Young’s modulus reaches 46.20 GPa, showing a notable increase of 16.96% compared to the modulus under no confining pressure. These findings highlight the substantial impact of confining pressure on altering the mechanical properties within shale reservoirs, particularly in deeper formations characterized by higher confining pressures. Thus, it can be inferred that the amplification of rock’s Young’s modulus due to confining pressure will be more pronounced in these deeper reservoirs.
The relationship between Brinell hardness and confining pressure is presented in Figure 8b. It becomes evident that the behavior of Brinell hardness follows a similar trend to that of Young’s modulus, with an increase observed as the confining pressure rises. Without any confining pressure, the Brinell hardness measures at 56.08, while under a confining pressure of 20 MPa, it elevates to 81.58, signifying a growth of 45.47%. Overall, based on the experimental results, it can be inferred that in the actual in situ reservoir environment, the application of confining pressure enhances the strength and hardness of shale, resulting in a reduced depth for proppant embedding. This phenomenon proves beneficial for shale gas production and long-term stability.

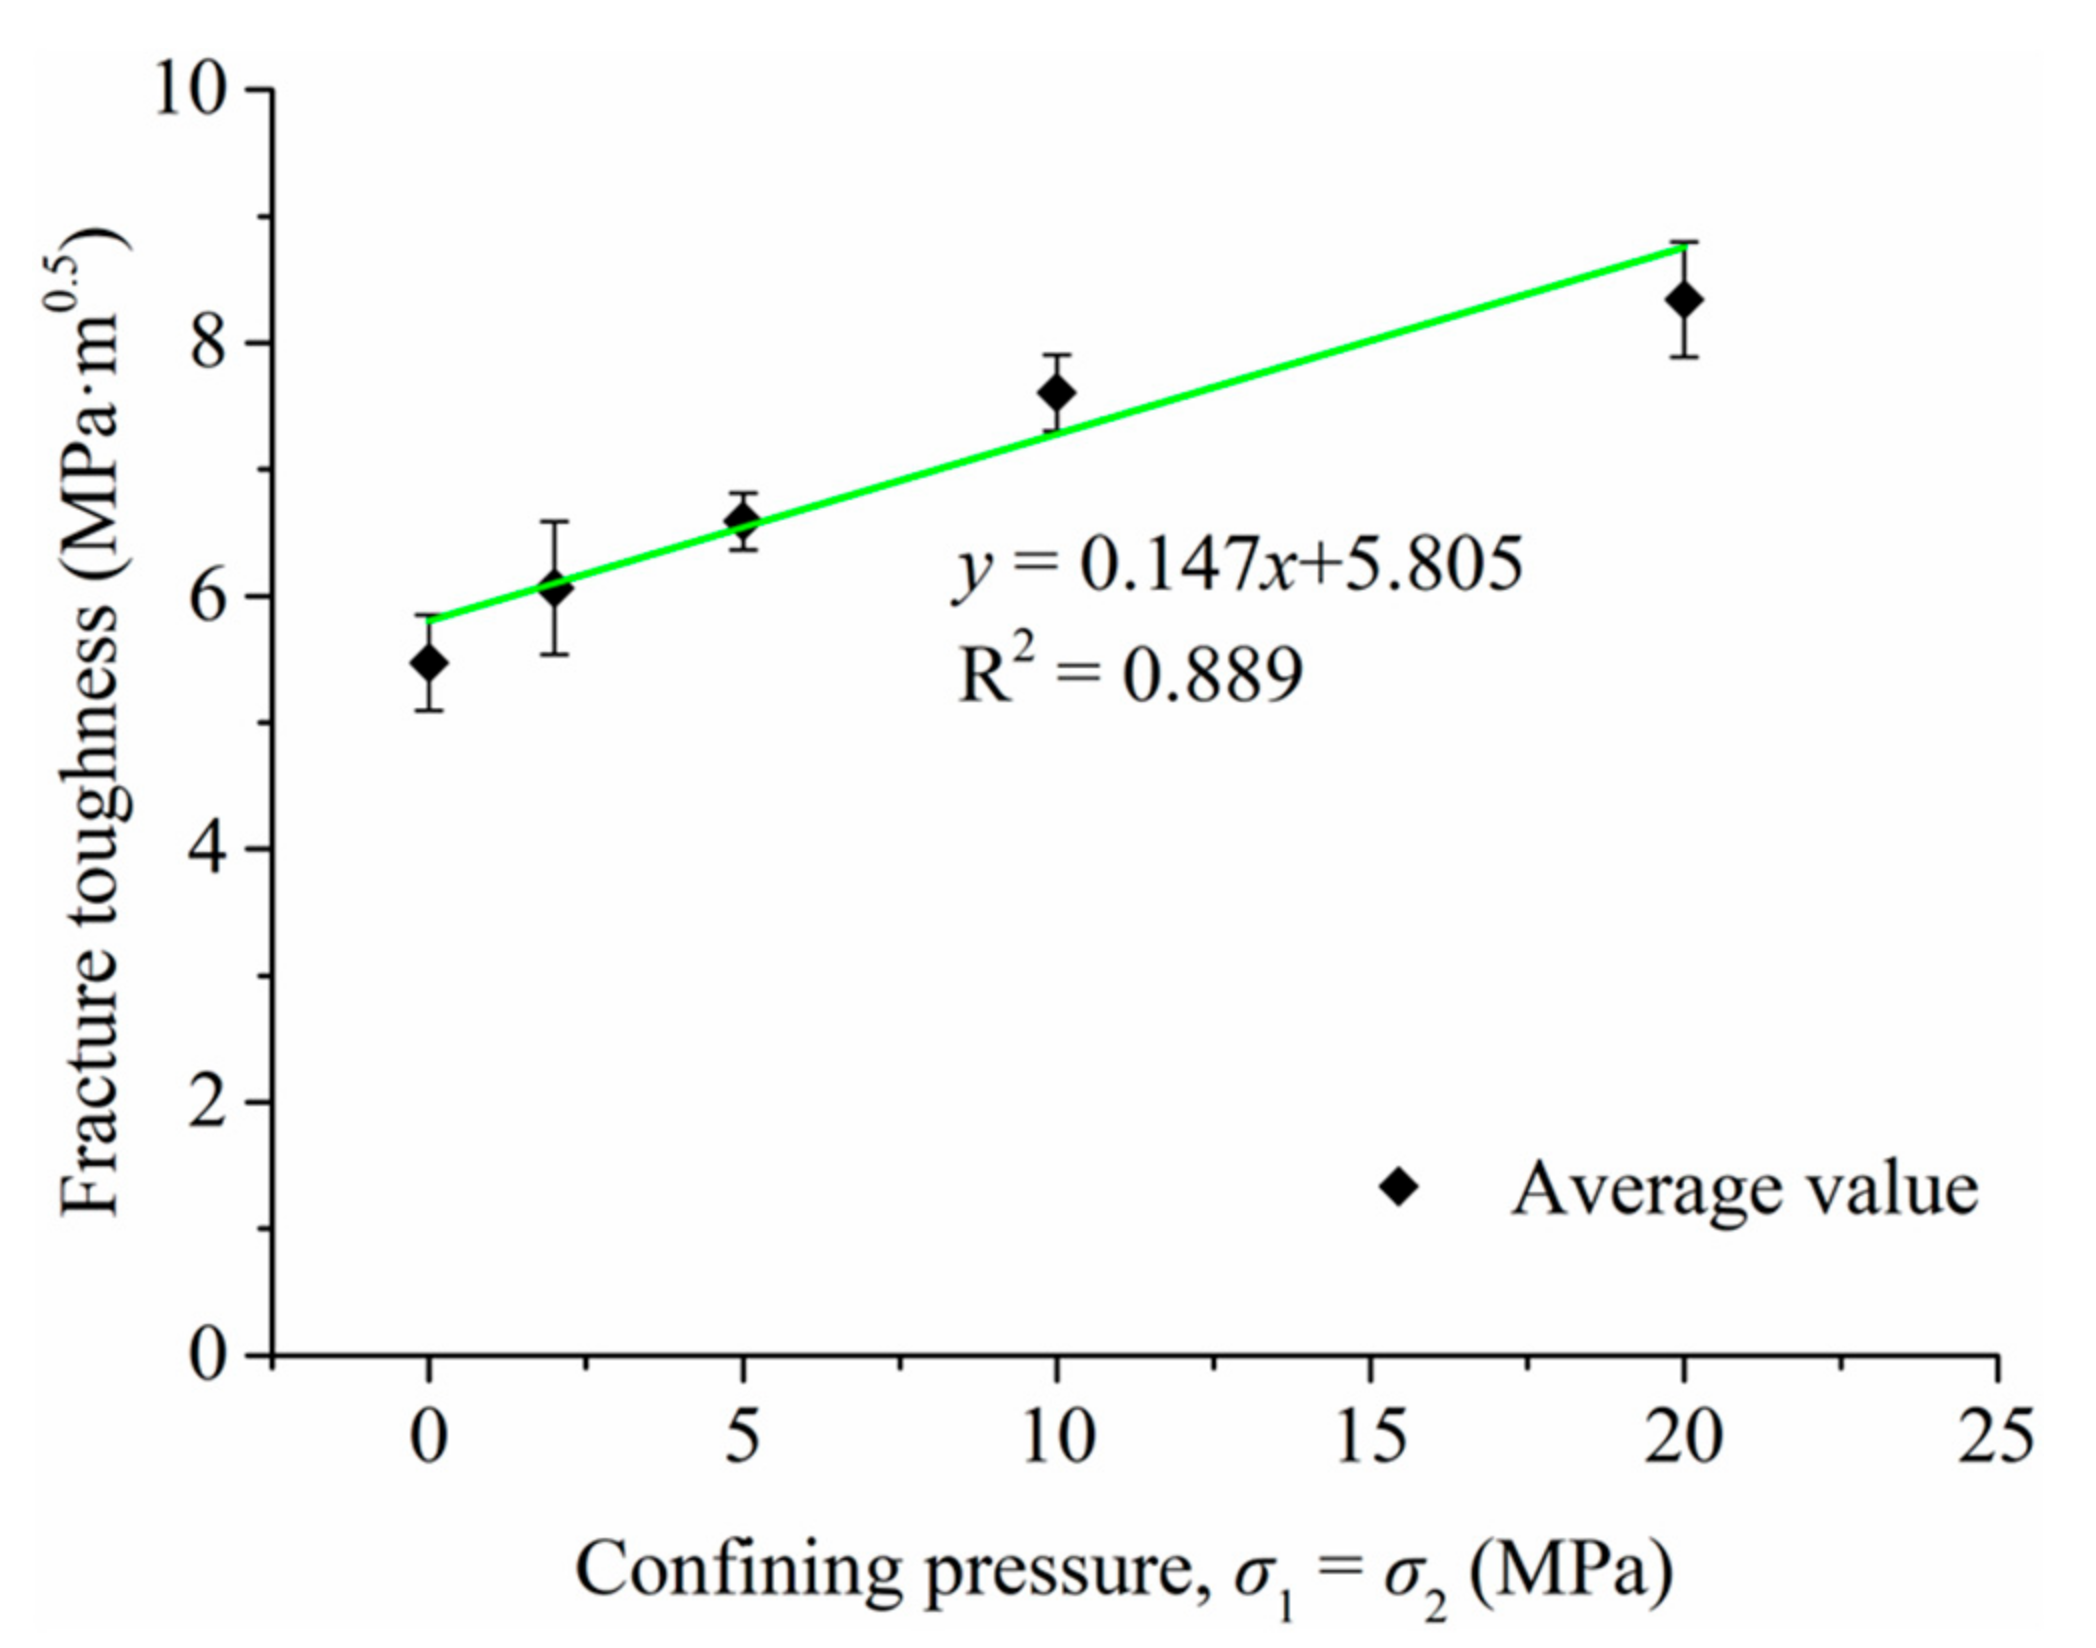
3.3. Fracture Toughness

Fracture toughness is a critical parameter in the design of hydraulic fracturing operations. This study utilizes an energy-based approach to determine the fracture toughness of shale. The total energy (Ut) during the indentation process combines elastic (Ue), plastic (Upp), and fracture (Ucrack) energies. Analyzing the areas under the loading and unloading curves enables the quantification of total (Ut) and elastic (Ue) energies, respectively. Additionally, the fitting of the F-h curve is accomplished using power law functions, while Equation (1) is employed for fitting the unloading curve, and fitting the loading curve can be achieved by the following [35,36,37]:
F = k h n ( loading )
Consequently, it is possible to calculate Ue and Ut using the following equations:
U e = h f h max η h h f m d h
U t = U loading + U unloading = 0 h h k h n d h + P max h max - h h
where hh represents the displacement at the onset of the holding stage; η, k, m, n are the parameters derived through data fitting.
Within this approach, the irreversible energy (Uir) is defined as the combined total of plastic (Upp) and fracture (Ucrack) energies [38]. Subsequently, the fracture energy (Ucrack) can be ascertained through the following equation:
U crack = U ir U pp
The pure plastic energy (Upp) is evaluated through the utilization of the following equation:
U pp U t = 1 U e U t
The determination of the critical energy release rate, denoted as Gc, is achieved by the following:
G c = U crack A = U crack A max
where Amax is the maximum crack area. In the case of a spherical indenter, this area can be described by the following:
A max = π × 2 h max R h max 2
Ultimately, the fracture stress intensity, represented by Kc, is determined by the following:
K c = G c E r
Fracture toughness quantifies a rock’s resistance to brittle fractures when cracks are present. Figure 9 depicts the relationship between confining pressure and fracture toughness based on microindentation curves obtained from the tested sample. The findings indicate that fracture toughness generally exhibits a linear increase with increasing confining pressure. Prior studies have indicated that Young’s modulus directly correlates with fracture strength, with a higher Young’s modulus indicating increased fracture resistance and, therefore, higher fracture toughness [27,35]. In this study, both Young’s modulus and fracture toughness exhibit a positive linear association with confining pressure, thus revealing a positive correlation between Young’s modulus and fracture toughness, and these observations are consistent with previous studies. Overall, the shale subjected to confining pressure displays elevated Young’s moduli and fracture toughness. As a result, embedding proppants in the shale becomes more challenging, and crack nucleation and propagation occur at a slower pace.

4. Discussion

4.1. Enhancement Mechanisms of Shale’s Mechanical Characteristics under Confining Pressure

In microindentation experiments, the application of confining pressure enhances the mechanical performance of the shale primarily due to the following reasons:
(1)
Compression of micropores and fractures: The application of confining pressure on shale leads to the compression of micropores and fractures, resulting in a reduction in their size and volume. This compression effect increases the density of the rock and decreases the number and size of micropores, thereby enhancing the shale’s strength and stiffness [39,40]. Therefore, this compression improves the fracture toughness of the shale while reducing its deformability.
(2)
Uniform stress distribution: The application of confining pressure in shale samples ensures a more homogeneous distribution of applied stress [41]. Without confining pressure, external loading can result in stress concentration. However, by applying confining pressure, the stress is more evenly distributed across the sample, reducing stress concentration and enhancing overall strength.
(3)
Particle contact: Through the application of confining pressure, the particles within the shale come into closer contact and undergo compaction [42]. This densification process leads to increased interparticle interaction, resulting in the enhanced strength and hardness of the shale. Furthermore, the denser particle arrangement reduces microscale particle displacement, effectively reducing the deformability of the shale. The promotion of particle contact under confining pressure contributes to improved mechanical properties and reduced deformation in the shale.
In summary, the application of confining pressure in microindentation experiments effectively improves the mechanical properties of the shale. This enhancement encompasses increased strength, hardness, and stiffness and decreased deformability of the specimens.

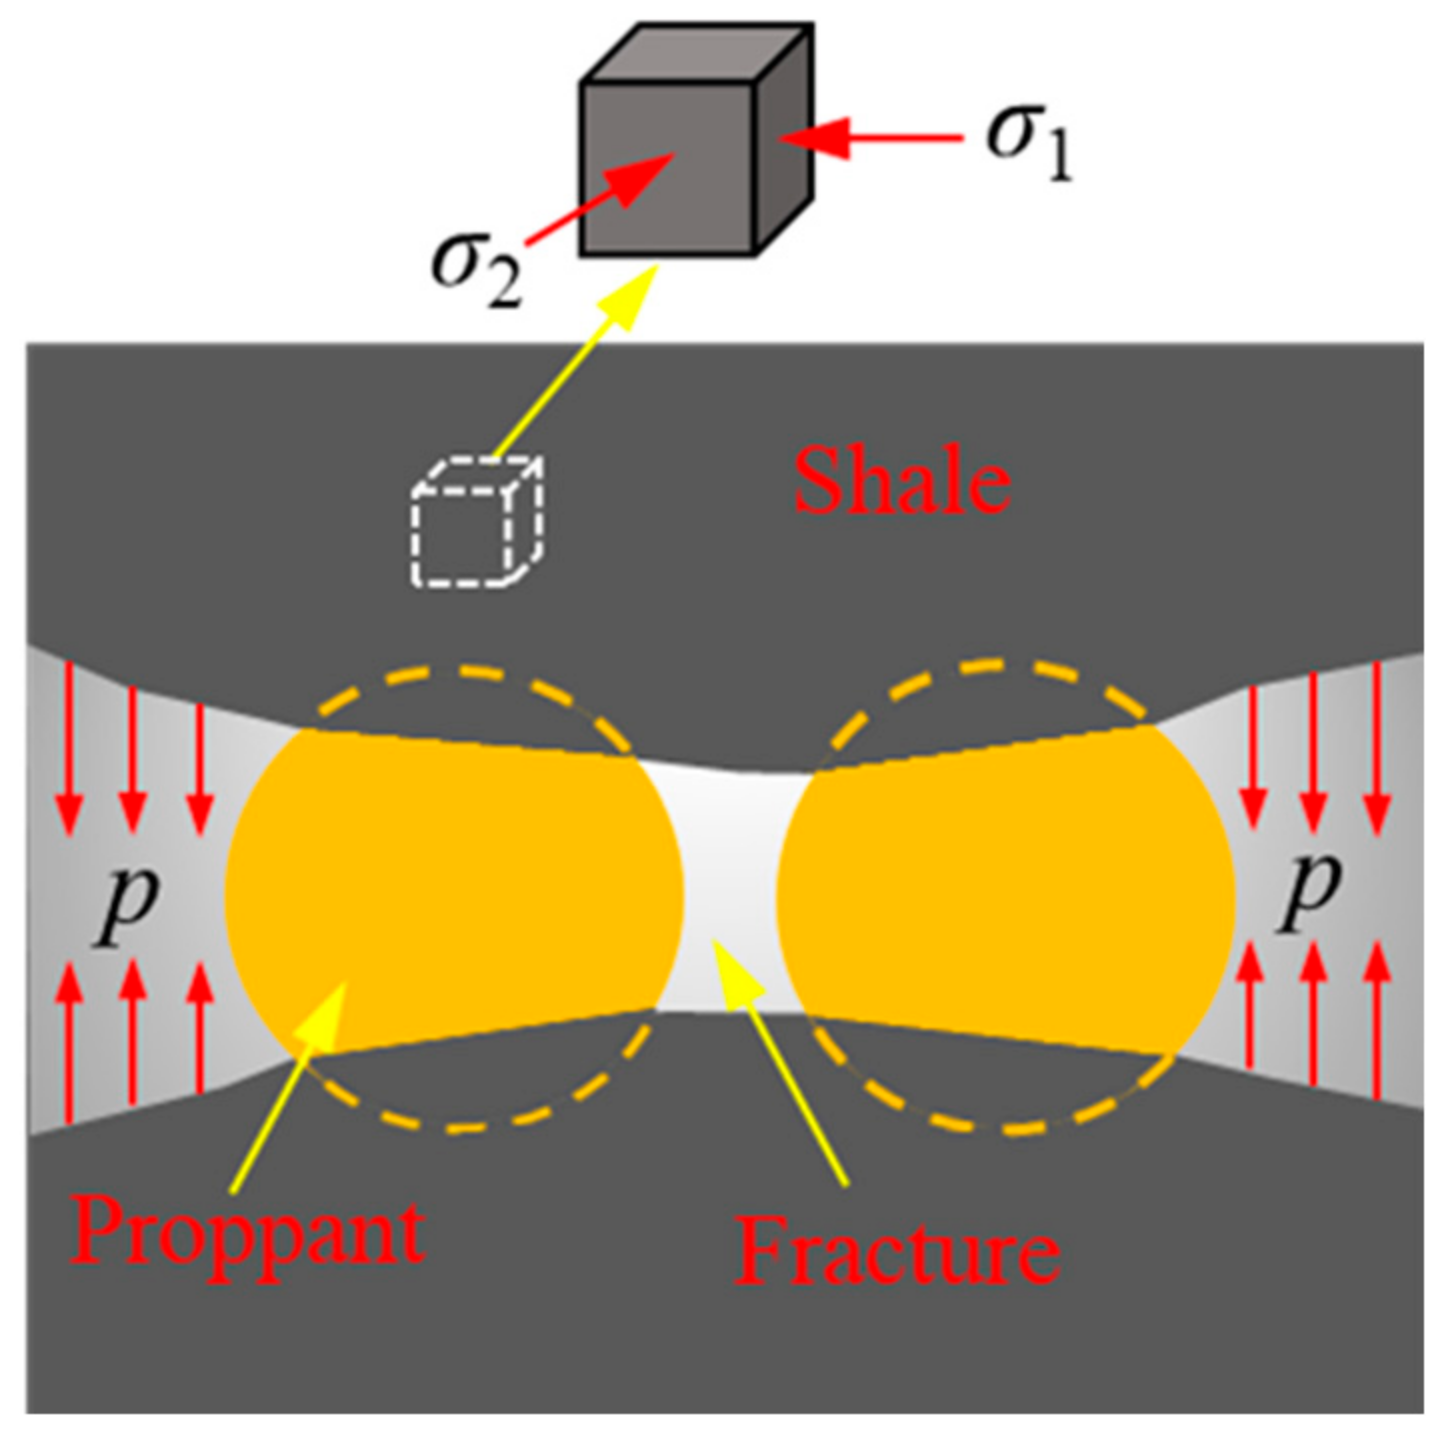
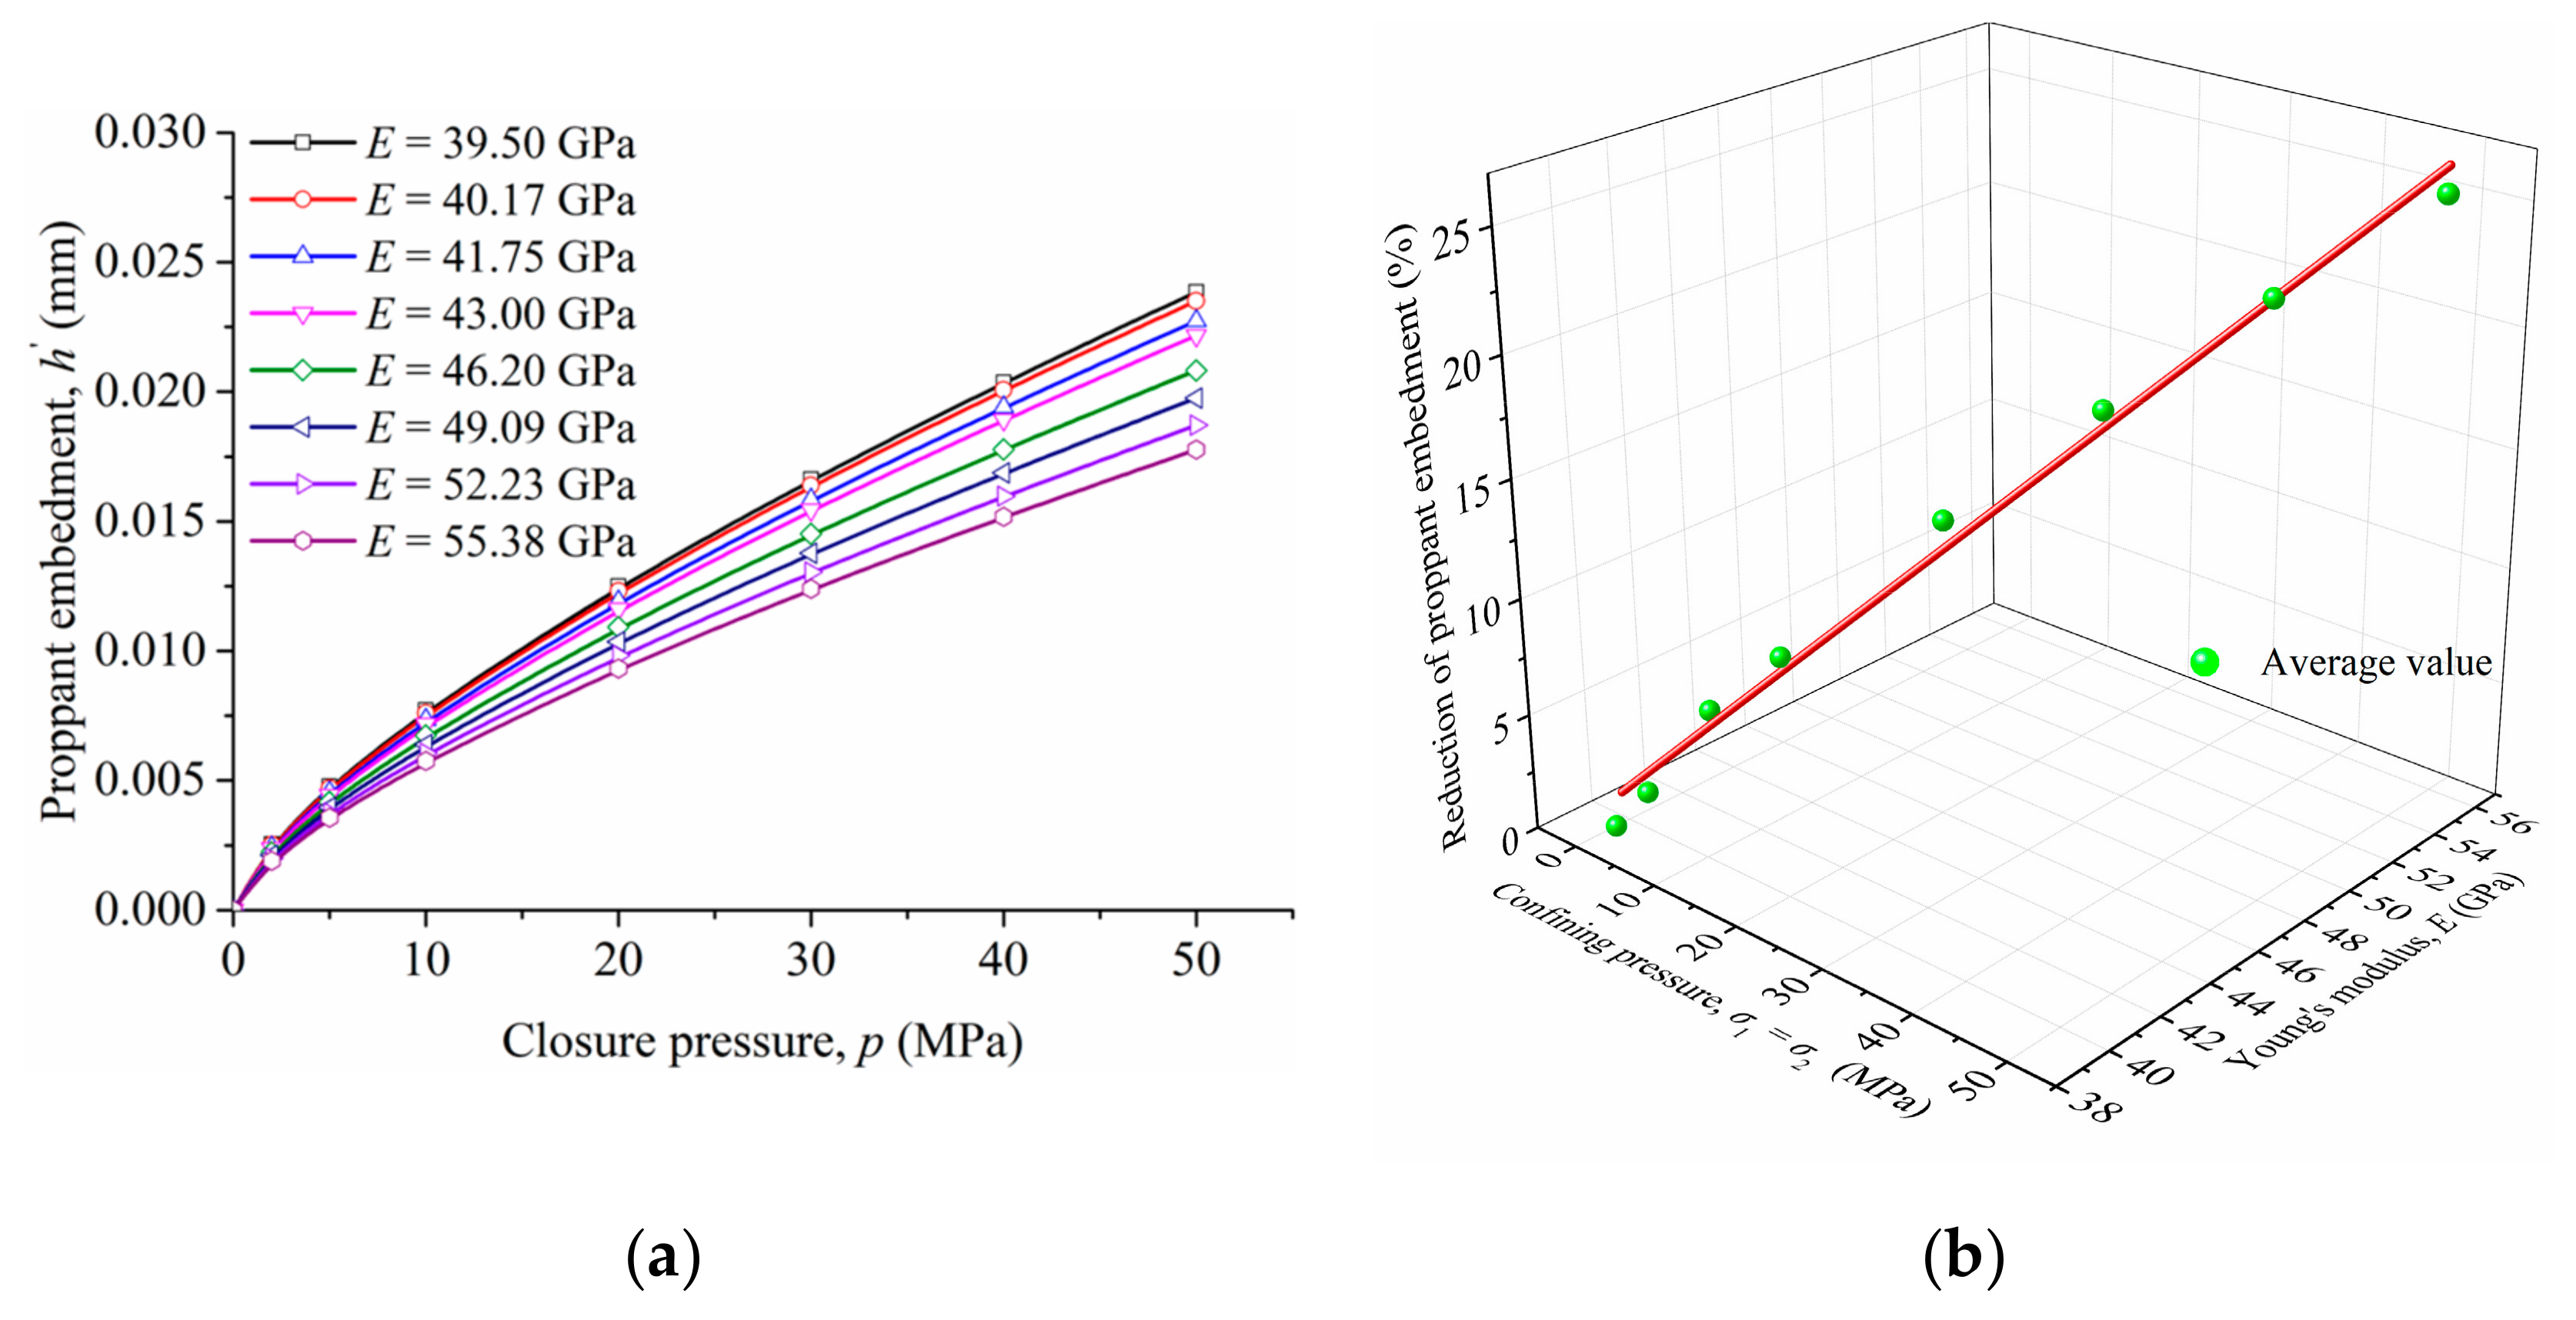
4.2. Effect of Lateral Confining Pressure on Proppant Embedment

Li et al. (2015) introduced a novel mathematical model based on elastic contact theory to compute proppant embedment [43]. The model assumes that the proppant embedding process entails the solely elastic deformation of the rock, with no rock fracture occurring and disregarding any fractures in the proppant itself. Additionally, it is assumed that the upper and lower layers in contact with the proppant deform according to Hooke’s law under closure pressure. As the thickness of the rock layer greatly exceeds the size of the proppant particles, the impact of changes in fracture width resulting from rock layer deformation is limited solely to the fracture surface, aligning with the scale of the proppant. Then, the value of proppant embedment can be estimated as follows:
h = 1.04 D K 2 p 2 3 1 ν 1 2 E 1 + 1 ν 2 E 2 3 1 ν 1 2 E 1 2 3 + D p E
where h’ is the value of proppant embedment, in mm; p is the closure pressure, in MPa; K is the distance coefficient; E1 and E are Young’s modulus of the proppant and shale, respectively, in MPa; ν1 and ν are Poisson’s ratio of the proppant and shale, respectively; and D is the diameter of the proppant, in mm.
From the above equation, it can be observed that factors influencing the elastic embedment depth of proppants include proppant particle size, proppant distance coefficient, closure pressure, and Young’s modulus of both the proppant and shale. This section focuses on examining the effect of lateral confining pressure on proppant embedment depth. To accomplish this, a simplified arrangement of proppants is employed, assuming that they are uniformly distributed in a single layer within the reservoir. Furthermore, the weight of the proppants is disregarded. The diameter of the proppant (D) is chosen as 2.5 mm, which matches the diameter of the microindentation probe. The proppant spacing factor (K) is set to 1, indicating that the proppants are tightly packed with no gaps in between. The closure pressure (p) ranges from 0 to 50 MPa. Young’s modulus (E) of the shale is determined based on microindentation experiments under different confining pressures, following a linear relationship between confining pressure and elastic modulus. The values of Young’s modulus are selected within the range of 39.50–55.38 GPa, corresponding to confining pressures from 0 to 50 MPa. Furthermore, due to the negligible impact of variations in shale’s Poisson’s ratio on proppant embedment depth, it can be disregarded. Therefore, it is hypothesized that Poisson’s ratio (ν) of the shale remains consistent across varying confining pressures, maintaining a constant value of 0.25. Young’s modulus (E1) and Poisson’s ratio (ν1) of the proppant are established as 100 GPa and 0.2, respectively.
Figure 10a illustrates the relationship between closure pressure and proppant embedment depth, considering changes in Young’s modulus of the shale under different confining pressures. The results indicate a nonlinear increase in embedment depth as closure pressure rises. Notably, the maximum embedment depth occurs when disregarding the influence of confining pressure (E = 39.50 GPa), while the minimum embedment depth is observed at a confining pressure of 50 MPa (E = 55.38 GPa). Specifically, at a closure pressure of 20 MPa, the embedment depths without considering confining pressure and with a confining pressure of 50 MPa (i.e., E = 39.50 and 55.38 GPa) are measured as 0.0125 mm and 0.00933 mm, respectively, resulting in a reduction of 25.36%. It should be noted that during microindentation testing, the simulated proppant embedment depths (hmax-1) account for the combined effects of various confining pressures, including a closure pressure of 20 MPa (i.e., Fmax = 100 N). The observed hmax-1 values in the microindentation results exceed the calculated values from Equation (18). This discrepancy is primarily due to the assumptions made in Equation (18) regarding elasticity and the significantly higher elastic modulus of the indenter used (which is seven times greater than Young’s modulus of the proppant in this study).
Furthermore, Figure 10b shows that under each closure pressure condition, the decrease in proppant embedment is proportional to Young’s modulus of the shale. Hence, considering the variation in shale’s Young’s modulus caused by confining pressure, the actual embedment depth of the proppants in the reservoir is smaller than the predicted depth. These findings have favorable implications for the production and long-term stability of shale gas.

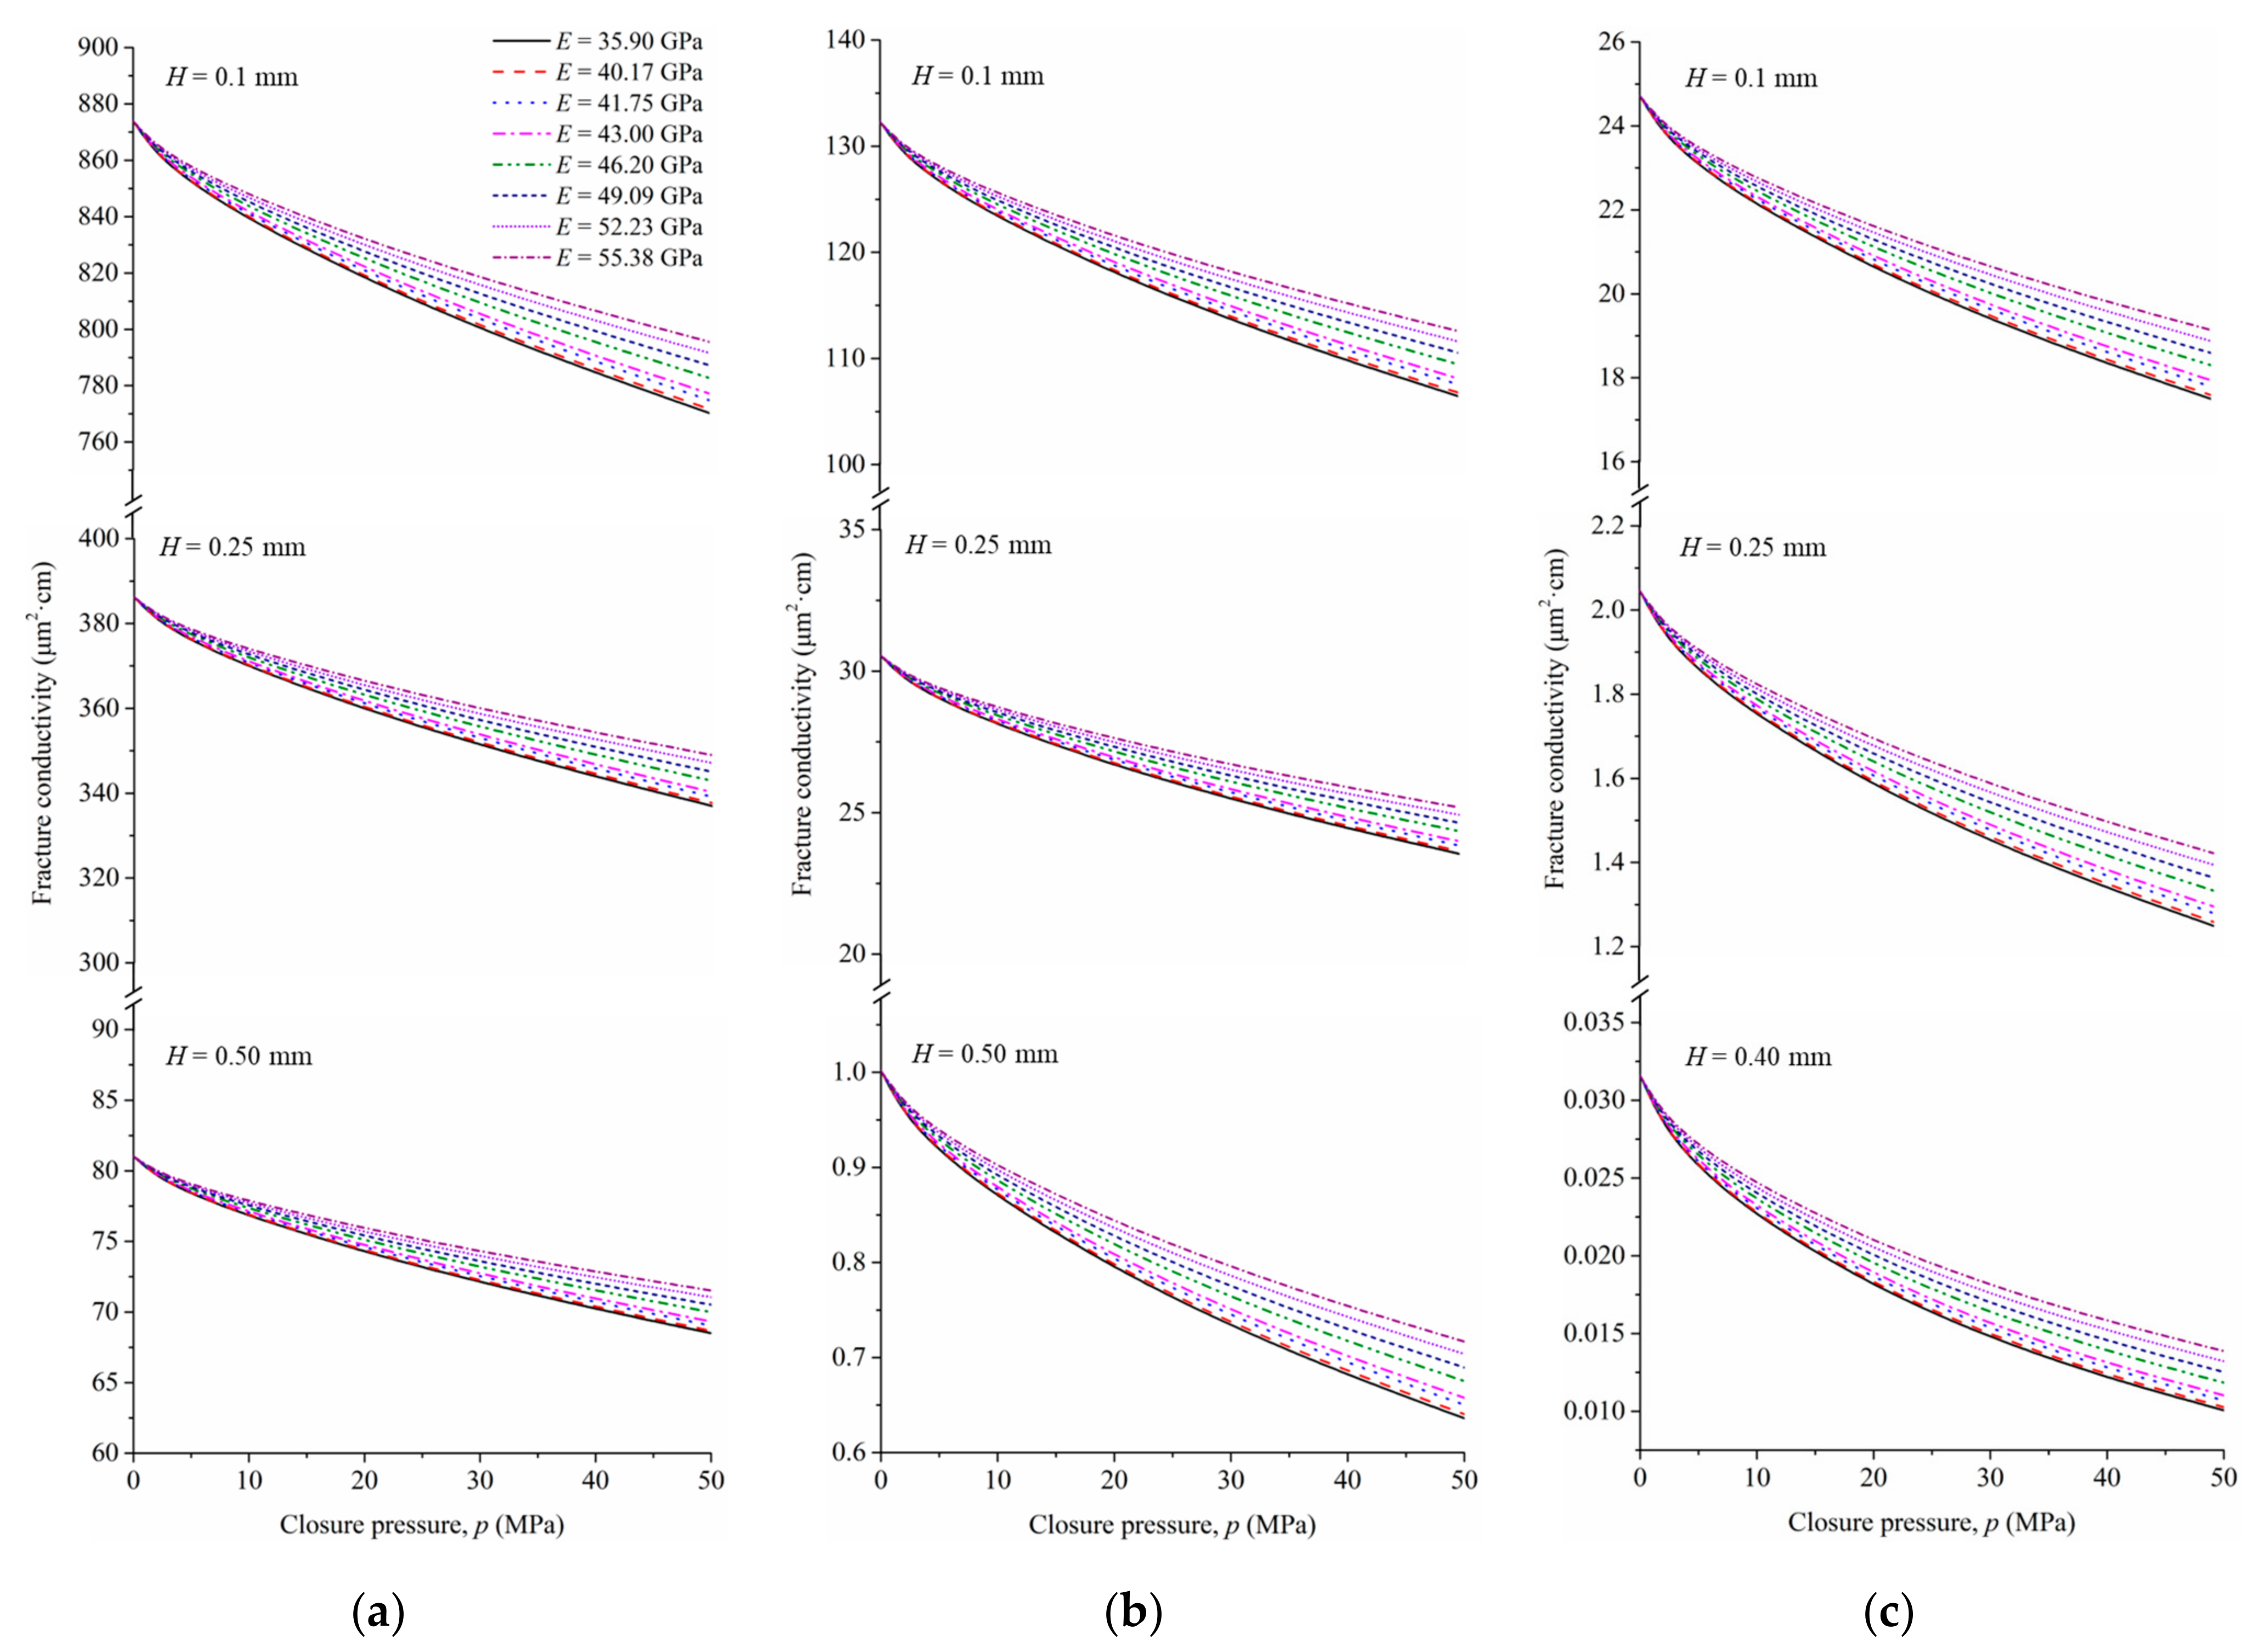
4.3. Effect of Lateral Confining Pressure on Fracture Conductivity

The efficiency of hydraulic fracturing in shale gas extraction is critically assessed based on the fracture conductivity of the formation. To determine this influential factor, the Carman–Kozeny equation is commonly employed as a dependable method for calculating fracture conductivity. The equation is represented as follows [44]:
F RCD = k W
k = φ r 2 8 τ
where FRCD represents the fracture conductivity, k denotes permeability, W signifies the fracture aperture when subjected to closure pressure, φ refers to porosity, r indicates the equivalent pore throat radius, and τ represents pore tortuosity.
The porosity, pore throat, and tortuosity of the fracture are influenced by different closure pressures (p). Taking the arrangement of proppants in a single layer as an example and disregarding the variations in interlayer porosity, when p = 0 and K = 1, the values for fracture porosity, equivalent pore throat radius, and tortuosity can be obtained:
φ 0 = 4 3 R 1 3 4 3 π R 1 3 4 3 R 1 3 = 1 π 3 3
r 0 K = 1 = 2 K π 1 2 R 1 = 0.37 R 1
τ 0 = 4 3
where φ0, r0, and τ0 represent the fracture porosity, equivalent pore throat radius, and tortuosity when the closure pressure is zero. R1 corresponds to the radius of the proppant.
During hydraulic fracturing, the application of closure pressure induces proppant embedment and fracture face damage, leading to the generation of debris particles. These particles exhibit different behaviors: some adhere to the fracture or proppant surfaces, while others disperse and migrate with the fluid flow. In the studied shale, which contains water-sensitive clay minerals (specifically illite and chlorite), these debris particles undergo volumetric expansion upon contact with fracturing fluid. This expansion subsequently reduces the fracture porosity. Moreover, under closure pressure, the transported debris particles accumulate and undergo diagenesis, resulting in reconsolidation and uneven distribution of proppant filling pore throat sizes. As a consequence, certain locations experience a significant decrease in pore throat sizes, leading to a substantial decline in fracture permeability.
To assess the extent of expansion caused by swelling debris on fracture surfaces, this research introduces the shale swelling coefficient (s) as a parameter. This coefficient quantifies the ratio between the volume of swelling and the embedded volume, assuming that the swelling layer is impermeable. Higher values of s indicate more pronounced swelling. With an increased clay content in the shale, there is an enhancement in its hydration swelling capacity, ultimately resulting in a larger swelling coefficient. Consequently, this augmentation has a greater impact on the porosity and pore throat radius of the fillings. Regarding the composition of the shale sample investigated in this study, it consists of 10.6 wt% illite and 2.6 wt% chlorite. Notably, this specific sample does not contain expandable layers such as smectite or vermiculite, thus rendering interlayer swelling absent. However, osmotic swelling still occurs, causing the partial separation of clay particles when subjected to external forces [45,46]. Therefore, the determined value of s for this sample is 1.
In addition, the migration coefficient (m) is used to quantify the level of the dispersed transport of fragmented debris in the presence of fluid. This transport leads to a reduction in pore throat size within the fracture filling layer and consequently lowers permeability. A value of m greater than 1 indicates more significant debris transport. Notably, shale formations with elevated clay content, particularly montmorillonite or illite, tend to exhibit higher migration coefficients. In this study, considering that the clay mineral content is not very high, we set the value of m to 1. Moreover, owing to their inherent physical and chemical stability, proppants exhibit minimal reactivity when in contact with fracturing fluid. Consequently, the mechanical properties and deformation characteristics of these proppants can be regarded as autonomous variables unaffected by the presence of fracturing fluids.
Figure 11 shows the proppant embedment considering the swelling and migration effects, assuming that the embedment depth of the proppant at this moment is denoted as h’. Additionally, the swelling thickness generated by debris is represented by H, which progressively increases over time during the interaction between hydraulic fracturing fluid and shale. It should be noted that the mechanical parameters of this specific portion of shale are considered negligible or non-existent in this study. The embedded volume of the proppant is V1, and the swelling volume is V3, and then the fracture conductivity can be inferred:
V 1 = π h 2 R 1 h 3
V 3 = s V 1
V 1 + V 2 = π H + h 2 R 1 H + h 3
S 0 = 2 3 R 1 2
α = R 1 H h
V 2 + V 3 = S 0 h
r = 2 R 1 α π R 1 2 2 + R 1 2 arccos α R 1 α R 1 2 α 2 π
φ = 1 2 π R 1 3 π R 1 α 2 2 R 1 + α 6 3 R 1 2 α
τ = τ 0
F RCD = k W = 2 k α
By combining Equations (18), (20), and (24)–(33), we can obtain the following results:
6 3 R 1 2 R 1 h α = π R 1 α 2 2 R 1 + α
F RCD = 9 α 64 φ r 2 = 9 α 64 1 2 π R 1 3 π R 1 α 2 2 R 1 + α 6 3 R 1 2 α 2 R 1 α π R 1 2 2 + R 1 2 arccos α R 1 α R 1 2 α 2 π
where α is the half width of the fracture.
Figure 12 shows the relationships between closure pressure and fracture conductivity under different proppant sizes, Young’s moduli, and swelling thicknesses. The impact of closure pressure and swelling thickness on fracture conductivity varies nonlinearly under the same proppant size. Moreover, the effect of different confining pressures on shale’s Young’s modulus influences fracture conductivity differently. Firstly, considering that confining pressure enhances shale’s Young’s modulus, it results in a reduction in proppant embedment depth and subsequently improves fracture conductivity compared to cases that do not consider confining pressure. The maximum increase in fracture conductivity for various proppant sizes is observed at p = 50 MPa, corresponding to a confining pressure of 50 MPa. For a proppant radius of R1 = 1.25 mm, the maximum increases are 3.17%, 3.44%, and 4.23% at H = 0.1, 0.25, and 0.5 mm, respectively. Similarly, for R1 = 0.75 mm, the maximum increases are 5.43%, 6.51%, and 11.24% at H = 0.1, 0.25, and 0.5 mm, respectively. In the case of R1 = 0.5 mm, the maximum increases are 8.55%, 12.15%, and 27.33% at H = 0.1, 0.25, and 0.4 mm, respectively. These findings indicate that the impact of confining pressure on fracture conductivity is minimal for larger proppant sizes. However, for smaller proppant sizes, the variation in shale mechanical properties due to confining pressure significantly affects fracture conductivity calculations, especially when larger values of H are induced by a long-term interaction between hydraulic fracturing fluid and shale. Consequently, such calculations often underestimate fracture conductivity due to the selection of smaller shale elastic modulus values.

5. Conclusions

This paper presents a comprehensive investigation of the fundamental relationship between microindentation results and the stress state of the shale. To achieve this, a series of laboratory microindentation tests were conducted on a shale sample subjected to various confining pressures. Through an in-depth analysis and discussion of the obtained results, the following conclusions can be drawn:
  • The load–displacement curves obtained from the microindentation tests under various confining pressures demonstrate a decreasing trend in ultimate displacements with higher levels of confining stress. This observation indicates that the depth of the proppant embedment decreases when taking reservoir confining pressure into consideration;
  • Young’s moduli, Brinell hardness, and fracture toughness exhibit a direct linear correlation with increasing confining pressure, suggesting that applying confining pressure enhances the strength and hardness of the shale;
  • Considering the effects of confining pressure, the decrease in proppant embedment is proportional to Young’s modulus of the shale. Regarding fracture conductivity, for larger-sized proppants (e.g., D = 2.50 mm), the influence of confining pressure on fracture conductivity is relatively minor. However, when using smaller-sized proppants (e.g., D = 1.00 mm), especially in scenarios where prolonged shale–hydraulic fracturing fluid interaction results in significant shale debris swelling, there is a noticeable improvement in fracture conductivity when confining pressure is taken into account. Overall, previous computational models have tended to overestimate the depth of proppant embedment while underestimating the assessment of fracture conductivity.

Author Contributions

Conceptualization, J.S. and D.H.; methodology, J.S., Y.L. (Yuan Liu), and Y.L. (Yujie Luo); software, Y.L. (Yuan Liu), J.S., and Y.L. (Yujie Luo); investigation, Y.L. (Yuan Liu) and Y.L. (Yujie Luo); writing—original draft preparation J.S.; writing—review and editing, D.H.; validation, F.Y.; project administration, J.S. and D.H.; funding acquisition, J.S. and D.H. All authors have read and agreed to the published version of the manuscript.

Funding

This work was support by the National Key Research and Development Program of China with Grant (No. 2022YFE0137200) and OeAD-GmbH Scientific & Technological Cooperation (WTZ) Austria/China program with Grant (No. CN 04/2022); the National Natural Science Foundation of China (Nos. 52179141, 52179114); Basic Research Program of Liaoning Provincial Department of Education (No. LJKMZ20220381).

Institutional Review Board Statement

Not applicable.

Informed Consent Statement

Not applicable.

Data Availability Statement

The original contributions presented in this study are included in the article; further inquiries into any progress can be directed to the corresponding authors.

Conflicts of Interest

The authors declare no conflicts of interest.

References

  1. Wang, G.; Liu, G.; Zhao, Z.; Liu, Y.; Pu, H. A Robust Numerical Method for Modeling Multiple Wells in City-Scale Geothermal Field Based on Simplified One-Dimensional Well Model. Renew. Energy 2019, 139, 873–894. [Google Scholar] [CrossRef]
  2. Chen, L.; Jiang, Z.; Liu, K.; Wang, P.; Ji, W.; Gao, F.; Li, P.; Hu, T.; Zhang, B.; Huang, H. Effect of Lithofacies on Gas Storage Capacity of Marine and Continental Shales in the Sichuan Basin, China. J. Nat. Gas Sci. Eng. 2016, 36, 773–785. [Google Scholar] [CrossRef]
  3. Luo, S.; Wu, Y.; Li, Y.; Wang, D.; Kim, D.; Song, J.; Zhang, G. Nanoindentation-Enhanced Screening of Hydraulic Fracturing Fluid Additives. Int. J. Coal Geol. 2021, 240, 103744. [Google Scholar] [CrossRef]
  4. Du, J.; Hu, L.; Meegoda, J.N.; Zhang, G. Shale Softening: Observations, Phenomenological Behavior, and Mechanisms. Appl. Clay Sci. 2018, 161, 290–300. [Google Scholar] [CrossRef]
  5. Masłowski, M.; Labus, M. Preliminary Studies on the Proppant Embedment in Baltic Basin Shale Rock. Rock Mech. Rock Eng. 2021, 54, 2233–2248. [Google Scholar] [CrossRef]
  6. Sun, H.; He, B.; Xu, H.; Zhou, F.; Zhang, M.; Li, H.; Yin, G.; Chen, S.; Xu, X.; Li, B. Experimental Investigation on the Fracture Conductivity Behavior of Quartz Sand and Ceramic Mixed Proppants. ACS Omega 2022, 7, 10243–10254. [Google Scholar] [CrossRef] [PubMed]
  7. Li, J.H.; Li, B.B.; Cheng, Q.Y.; Gao, Z. Characterization of the Fracture Compressibility and Its Permeability for Shale under the Effects of Proppant Embedment and Compaction: A Preliminary Study. Pet Sci. 2022, 19, 1125–1138. [Google Scholar] [CrossRef]
  8. Zheng, W.; Silva, S.C.; Tannant, D.D. Crushing Characteristics of Four Different Proppants and Implications for Fracture Conductivity. J. Nat. Gas Sci. Eng. 2018, 53, 125–138. [Google Scholar] [CrossRef]
  9. Zhang, J.; Ouyang, L.; Zhu, D.; Hill, A.D. Experimental and Numerical Studies of Reduced Fracture Conductivity Due to Proppant Embedment in the Shale Reservoir. J. Pet. Sci. Eng. 2015, 130, 37–45. [Google Scholar] [CrossRef]
  10. Sun, Z.; Zhang, H.; Wei, Z.; Wang, Y.; Wu, B.; Zhuo, S.; Zhao, Z.; Li, J.; Hao, L.; Yang, H. Effects of Slick Water Fracturing Fluid on Pore Structure and Adsorption Characteristics of Shale Reservoir Rocks. J. Nat. Gas Sci. Eng. 2018, 51, 27–36. [Google Scholar] [CrossRef]
  11. Yang, Z.; Wang, L.; Zhang, G.; Ho, C. SPE-181833-MS Micromechanical Characterization of Fluid-Shale Interactions via Nanoindentation. In Proceedings of the SPE Asia Pacific Hydraulic Fracturing Conference, Beijing, China, 24–26 August 2016. [Google Scholar]
  12. Yuan, W.; Pan, Z.; Li, X.; Yang, Y.; Zhao, C.; Connell, L.D.; Li, S.; He, J. Experimental Study and Modelling of Methane Adsorption and Diffusion in Shale. Fuel 2014, 117, 509–519. [Google Scholar] [CrossRef]
  13. Zhang, J.; Zhu, D.; Hill, A.D. Water-Induced Damage to Propped-Fracture Conductivity in Shale Formations. SPE Prod. Oper. 2016, 31, 147–156. [Google Scholar] [CrossRef]
  14. Liao, Z.; Deng, S.; Chen, X.; Wu, M.; Kang, Y.; Zeng, L.; Zou, H. Fracture Behavior of Longmaxi Shale with Implications for Subsurface Applications. Interpretation 2020, 8, 205–213. [Google Scholar] [CrossRef]
  15. Sanaei, A.; Shakiba, M.; Varavei, A.; Sepehrnoori, K. Mechanistic Modeling of Clay Swelling in Hydraulic-Fractures Network. SPE Res. Eval. Eng. 2018, 21, 96–108. [Google Scholar] [CrossRef]
  16. Wu, W.; Sharma, M.M. Acid Fracturing in Shales: Effect of Dilute Acid on Properties and Pore Structure of Shale. In Proceedings of the SPE Production and Operations; Society of Petroleum Engineers (SPE), The Woodlands, TX, USA, 1 February 2017; Volume 32, pp. 51–63. [Google Scholar]
  17. Kasyap, S.S.; Senetakis, K. Characterization of Two Types of Shale Rocks from Guizhou China through Micro-Indentation, Statistical and Machine-Learning Tools. J. Pet. Sci. Eng. 2022, 208, 109304. [Google Scholar] [CrossRef]
  18. Yang, X.M.; Zhang, X.P.; Xie, W.Q.; Liu, Q.S.; Yang, X.W. Estimation of Rock Mechanical Properties by Macro Indentation Test with a Conical Indenter. Bull. Eng. Geol. Environ. 2023, 82, 234. [Google Scholar] [CrossRef]
  19. Bouali, A.; Grairia, S.; Nettour, D.; Chérait, Y.; Arabi, N.; Montagne, A.; Iost, A.; Chicot, D. Instrumented Indentation Based Methods to Assess Fracture Toughness (KIC) of Self-Compacting Concrete: Influence of Water to Binder (w/b) Ratio and Type of Concrete. Eng. Fract. Mech. 2022, 275, 108796. [Google Scholar] [CrossRef]
  20. Fadil, H.; Jelagin, D.; Partl, M.N. Spherical Indentation Test for Quasi-Non-Destructive Characterisation of Asphalt Concrete. Mater. Struct./Mater. Constr. 2022, 55, 102. [Google Scholar] [CrossRef]
  21. Liu, Y.; Li, Y.; Jin, C.; Li, H. Multi-Scale Creep Analysis of Cement Paste—Indentation Prediction and Time Correspondence of Mechanisms. Cem. Concr. Compos. 2022, 134, 104815. [Google Scholar] [CrossRef]
  22. Vandamme, M.; Ulm, F.J. Nanoindentation Investigation of Creep Properties of Calcium Silicate Hydrates. Cem. Concr. Res. 2013, 52, 38–52. [Google Scholar] [CrossRef]
  23. Bobko, C.; Ulm, F.J. The Nano-Mechanical Morphology of Shale. Mech. Mater. 2008, 40, 318–337. [Google Scholar] [CrossRef]
  24. Sorelli, L.; Constantinides, G.; Ulm, F.J.; Toutlemonde, F. The Nano-Mechanical Signature of Ultra High Performance Concrete by Statistical Nanoindentation Techniques. Cem. Concr. Res. 2008, 38, 1447–1456. [Google Scholar] [CrossRef]
  25. Lu, Y.; Li, Y.; Wu, Y.; Luo, S.; Jin, Y.; Zhang, G. Characterization of Shale Softening by Large Volume-Based Nanoindentation. Rock Mech. Rock Eng. 2020, 53, 1393–1409. [Google Scholar] [CrossRef]
  26. Luo, S.; Lu, Y.; Wu, Y.; Song, J.; DeGroot, D.J.; Jin, Y.; Zhang, G. Cross-Scale Characterization of the Elasticity of Shales: Statistical Nanoindentation and Data Analytics. J. Mech. Phys. Solids 2020, 140, 103945. [Google Scholar] [CrossRef]
  27. Song, J.; Xiang, D.; Zhao, S.; Hu, D.; Zhou, H.; Zhang, G. Shale Softening Degree and Rate Induced by Fracturing Fluid under THMC Coupling Condition. J. Nat. Gas Sci. Eng. 2021, 96, 104294. [Google Scholar] [CrossRef]
  28. Song, J.; Xiang, D.; Hu, D.; Zhou, H.; Guo, D.; Zhang, G. Creep Characteristics of a Fracturing Fluid-Softened Shale Investigated by Microindentation. Int. J. Rock Mech. Min. Sci. 2022, 152, 105067. [Google Scholar] [CrossRef]
  29. Oliver, W.C.; Pharr, G.M. An Improved Technique for Determining Hardness and Elastic Modulus Using Load and Displacement Sensing Indentation Experiments. J. Mater. Res. 1992, 7, 1564–1583. [Google Scholar] [CrossRef]
  30. Oliver, W.C.; Pharr, G.M. Measurement of Hardness and Elastic Modulus by Instrumented Indentation: Advances in Understanding and Refinements to Methodology. J. Mater. Res. 2004, 19, 3–20. [Google Scholar] [CrossRef]
  31. Kitamura, M.; Hirose, T. Strength Determination of Rocks by Using Indentation Tests with a Spherical Indenter. J. Struct. Geol. 2017, 98, 1–11. [Google Scholar] [CrossRef]
  32. Zheng, W.; Tannant, D.D.; Cui, X.; Xu, C.; Hu, X. Improved Discrete Element Modeling for Proppant Embedment into Rock Surfaces. Acta Geotech. 2020, 15, 347–364. [Google Scholar] [CrossRef]
  33. Doerner, M.F.; Nix, W.D. A Method for Interpreting the Data from Depth-Sensing Indentation Instruments. J. Mater. Res. 1986, 1, 601–609. [Google Scholar] [CrossRef]
  34. Suo, Y.; Chen, Z.; Rahman, S.S.; Chen, X. Experimental Study on Mechanical and Anisotropic Properties of Shale and Estimation of Uniaxial Compressive Strength. Energy Sources Part A Recovery Util. Environ. Eff. 2020. [Google Scholar] [CrossRef]
  35. Gupta, I.; Sondergeld, C.; Rai, C. Fracture Toughness in Shales Using Nano-Indentation. J. Pet. Sci. Eng. 2020, 191, 107222. [Google Scholar] [CrossRef]
  36. Liu, Y. Fracture Toughness Assessment of Shales by Nanoindentation. Master’s Thesis, University Massachusetts, Amherst, MA, USA, 2015. [Google Scholar] [CrossRef]
  37. Liu, K.; Ostadhassan, M.; Bubach, B. Applications of Nano-Indentation Methods to Estimate Nanoscale Mechanical Properties of Shale Reservoir Rocks. J. Nat. Gas Sci. Eng. 2016, 35, 1310–1319. [Google Scholar] [CrossRef]
  38. Cheng, Y.T.; Li, Z.; Cheng, C.M. Scaling Relationships for Indentation Measurements. Philos. Mag. A Phys. Condens. Matter Struct. Defects Mech. Prop. 2002, 82, 1821–1829. [Google Scholar] [CrossRef]
  39. Ma, C.; Zhu, C.; Zhou, J.; Ren, J.; Yu, Q. Dynamic Response and Failure Characteristics of Combined Rocks under Confining Pressure. Sci. Rep. 2022, 12, 12187. [Google Scholar] [CrossRef] [PubMed]
  40. Chen, X.; Tang, C.; Yu, J.; Zhou, J.; Cai, Y. Experimental Investigation on Deformation Characteristics and Permeability Evolution of Rock under Confining Pressure Unloading Conditions. J. Cent. South Univ. 2018, 25, 1987–2001. [Google Scholar] [CrossRef]
  41. Ma, W.; Luo, L.; Wang, J. Mechanical, Cracking and Failure Behavior of Oil Shale Under Various Confining Pressures. Geotech. Geol. Eng. 2023, 41, 2409–2425. [Google Scholar] [CrossRef]
  42. Yu, M.; Liu, B.; Chu, Z.; Sun, J.; Deng, T.; Wang, Q. Permeability, Deformation Characteristics, and Damage Constitutive Model of Shale under Triaxial Hydromechanical Coupling. Bull. Eng. Geol. Environ. 2022, 81, 85. [Google Scholar] [CrossRef]
  43. Li, K.; Gao, Y.; Lyu, Y.; Wang, M. New Mathematical Models for Calculating Proppant Embedment and Fracture Conductivity. SPE J. 2015, 20, 496–507. [Google Scholar] [CrossRef]
  44. Carman, P.G. Fluid Flow through Granular Beds. Chem. Eng. Res. Des. 1997, 75, 150–166. [Google Scholar] [CrossRef]
  45. Amorim, C.L.G.; Lopes, R.T.; Barroso, R.C.; Queiroz, J.C.; Alves, D.B.; Perez, C.A.; Schelin, H.R. Effect of Clay-Water Interactions on Clay Swelling by X-Ray Diffraction. Nucl. Instrum. Methods Phys. Res. A 2007, 580, 768–770. [Google Scholar] [CrossRef]
  46. Murphy, W.F.; Winkler, K.W.; Kleinberg, R.L. Acoustic Relaxation in Sedimentary Rocks: Dependence on Grain Contacts and Fluid Saturation. Geophysics 1986, 51, 757–766. [Google Scholar] [CrossRef]
Figure 1. Schematic of proppant embedment into the fractured surfaces under in situ stresses.
Applsci 14 05825 g001
Figure 2. Unconfined compression test by RMT–150C servo test system.
Applsci 14 05825 g002
Figure 3. Schematic of microindentation testing: (a) typical load–displacement curve of an individual indentation; (b) indent geometry by the spherical indenter.
Applsci 14 05825 g003
Figure 4. The microindentation with bidirectional loading apparatus: (a) testing system; (b) schematic diagram.
Applsci 14 05825 g004
Figure 5. Representative load–displacement curves of cyclic loading–unloading indentation tests.
Applsci 14 05825 g005
Figure 6. Comparison of selected indentation load–displacement curves under different confining pressures: (ae) σ1 = σ2 = 0–20 MPa, respectively; (f) relation between the confining pressure and displacement.
Applsci 14 05825 g006aApplsci 14 05825 g006b
Figure 7. Stress–strain curves of the unconfined compression tests.
Applsci 14 05825 g007
Figure 8. Typical microindentation results showing the variations in Young’s moduli and Brinell hardness over confining pressures: (a) Young’s moduli; (b) Brinell hardness.
Applsci 14 05825 g008
Figure 9. Correlations between fracture toughness and confining pressure derived from microindentation results.
Applsci 14 05825 g009
Figure 10. (a) Relations between the closure pressures and proppant embedment across various Young’s moduli; (b) relationship among confining pressures; Young’s moduli and reduction in proppant embedment under each closure pressure.
Applsci 14 05825 g010
Figure 11. Schematic of proppant embedment considering the swelling and migration effects.
Applsci 14 05825 g011
Figure 12. Relations between the closure pressure and fracture conductivity under different proppant sizes, Young’s moduli, and swelling thicknesses: (a) R1 = 1.25 mm; (b) R1 = 0.75 mm; (c) R1 = 0.5 mm.
Applsci 14 05825 g012
Table 1. Mineralogical composition of the studied sample.
SamplesMineral (wt%)
QuartzOrthoclaseAlbiteCalciteDolomitePyriteChloriteIllite
Shale12.90.22.415.555.50.42.610.6
Table 2. Mechanical parameters of the shale samples under unconfined compression tests.
Shale SamplesUCS (MPa)E (GPa)ν
1# sample101.3840.030.25
2# sample99.3839.980.25
3# sample104.6040.100.25
Average values101.7940.040.25
Disclaimer/Publisher’s Note: The statements, opinions and data contained in all publications are solely those of the individual author(s) and contributor(s) and not of MDPI and/or the editor(s). MDPI and/or the editor(s) disclaim responsibility for any injury to people or property resulting from any ideas, methods, instructions or products referred to in the content.

