Abstract
This study aims to investigate the effect of plastic fine content on the undrained monotonic behavior of sandy soils (mixtures of host sand and various plastic fine content from 0 to 25%), and in particular, their static liquefaction resistance (undrained shear strength). Illite Arvel is considered as a plastic fine to add to the host sand, the Fontainebleau sand. Binary mixture samples are reconstituted by using the moist tamping technique. A series of undrained triaxial tests were carried out to study the influence of different parameters, such as the fine content, the initial density index, the confining pressure, and the over-consolidation ratio (OCR) on the behavior of sandy soil mixture. Based on the results acquired from these tests, the liquefaction susceptibility of the sandy soil is discussed by using Chinese criteria.
1. Introduction
Soil liquefaction signifies a cohesionless saturated soil, ordinarily in the solid state, behaving as a liquid due to an important loss of shear strength and/or stiffness and the resulting pore pressure build-up when subjected to an applied load such as shaking during an earthquake or another sudden change in the stress/strain condition. Therefore, undrained shear strength is a key parameter to assess the liquefaction potential of sandy soil.
Field investigation of post-earthquake sites has shown that natural liquefied sands usually contain fine grains (silt, clay, etc.) [1,2,3,4,5,6,7]. In other words, liquefiable soils are generally composed of a coarse sand matrix but polluted by a small quantity of fine particles with maximum diameter usually lower than 100 μm. Fine particles fill, partially or totally, the inter-void between coarse sand grains. Tokimatsu and Yoshimi [6] examined 17 worldwide earthquakes and showed that more than one half of historic cases presented fine content lower than 5%. Okashi [8] and Seed et al. [9] also reported that sands including less than 10% of fine particles seem to have increased liquefaction potential. Therefore, it is significant that the effect of low fine content on the undrained liquefaction resistance of loose sand should be investigated.
Experimental studies in the literature have shown contradictory results regarding the effect of fine particles on the static liquefaction potential. Indeed, several studies [10,11,12,13,14,15,16,17,18] showed that the undrained shear strength increases versus an increase in fine content. In other words, added particles present a beneficial effect on the static liquefaction potential. Meanwhile, other works [17,19,20,21,22,23,24,25,26] found adverse effects of fine content on the undrained liquefaction resistance of sand–fines mixture. In addition, some scholars reported that an increase in fine content, to a threshold, leads to an increase in undrained shear strength, which is followed by a decrease in the static liquefaction susceptibility beyond this threshold of fine content (e.g., [16,27,28,29,30,31,32,33]).
These different tendencies may be attributed to the choice of the parameter to characterize the undrained shear resistance of silty sand (e.g., intergranular void ratio, global void ratio, initial relative density index, etc.), the fine content natural (plastic or non-plastic added materials), the reconstituted sample method, the gradation characteristic, the grain shape, and the plasticity index. For instance, the impact of added particles cannot be captured by the global void ratio [18]. Jradi [17] studied the effect of two fine materials, C500 (silty non-plastic fine) and Speswhite (clayey plastic fine), and reported that the increase in the non-plastic fine amount exhibits a beneficial effect on the static liquefaction resistance, while the plastic fine leads to an adverse impact. However, Jradi [17] used two reconstituted sample methods: the wet tamping method for the sand-C500 mixture and the dry tamping method for the mixture of sand and Speswhite. Gobbi et al. [18] and Zhu et al. [26] considered a similar mixture: clean Hostun-RF sand (HN31) and Sillica C500 fines. However, the sample was reconstituted by the moist tamping method in Gobbi et al. [18] and they reported an increase in static liquefaction resistance versus an increase in C500 amount. Meanwhile, Zhu et al. [26] adopted the dry tamping technique for the reconstitution of the sample and they showed an adverse effect of added particles on the undrained shear strength. Papadopoulou and Tika [34] showed that an increase in added material plasticity index up to a threshold value leads to, firstly, a decrease in undrained shear strength, and beyond this threshold, an increase in undrained resistance is observed. Yang and Wei [35] investigated the effect of added particle shape and showed that rounded silt yields a lower undrained shear strength of the silty sand mixture, in comparison with angular silt. Nevertheless, Monkul et al. [36] reported an opposite trend that angular silt makes the silt sand mixture sample more prone to liquefaction. These non-consensus conclusions in the literature emphasize that the effect of fine content on the liquefaction potential can be different from one sand to another and also depends on the laboratory test procedure. In other words, the conclusions drawn from studies focused on other sandy soils cannot be applied to the considered one.
This work investigates the undrained behavior of Fontainebleau clean sand and mixtures of this sand and fine plastic particles via static triaxial tests. Illite Arvel (Velay green clay) is used as added fine grains. The samples were reconstituted by using the moist tamping method. The influence of different parameters, such as the fine content, relative density, initial confining pressure, and over-consolidation ratio (OCR) is studied. These experimental results provide elements to discuss the reliability of the Chinse criterion for the liquefaction susceptibility of the considered sandy soil.
2. Material and Experimental Method
2.1. Materials
Fontainebleau sand (NE34) is used in this study as the host sand and is constituted of uniform sub-rounded grains. This sand is a fine silica sand (SiO2 > 98%) with light beige color. As a reminder, the grain shape plays an important role in the liquefaction potential of the sand [35,36]. The main characteristics of Fontainebleau sand are given in Table 1. Illite Arvel is used as an added fine material, which is highly fine and plastic. Table 2 gives the main properties of this added material.

Table 1.
Fontainebleau sand’s main characteristics (where dmax, dmin, d50 are max, min, and mean grain size; d60, d50 d30, d10 are sieve diameters 60%, 50%, 30%, and 10% sand grain passing through the sieve; Cu is coefficient of uniformity (); Cv is curvature coefficient (); and ρ is density of solid particle).
Table 2.
Physical properties of Illite Arvel (where WL the limit liquid; Ip is the plasticity index).
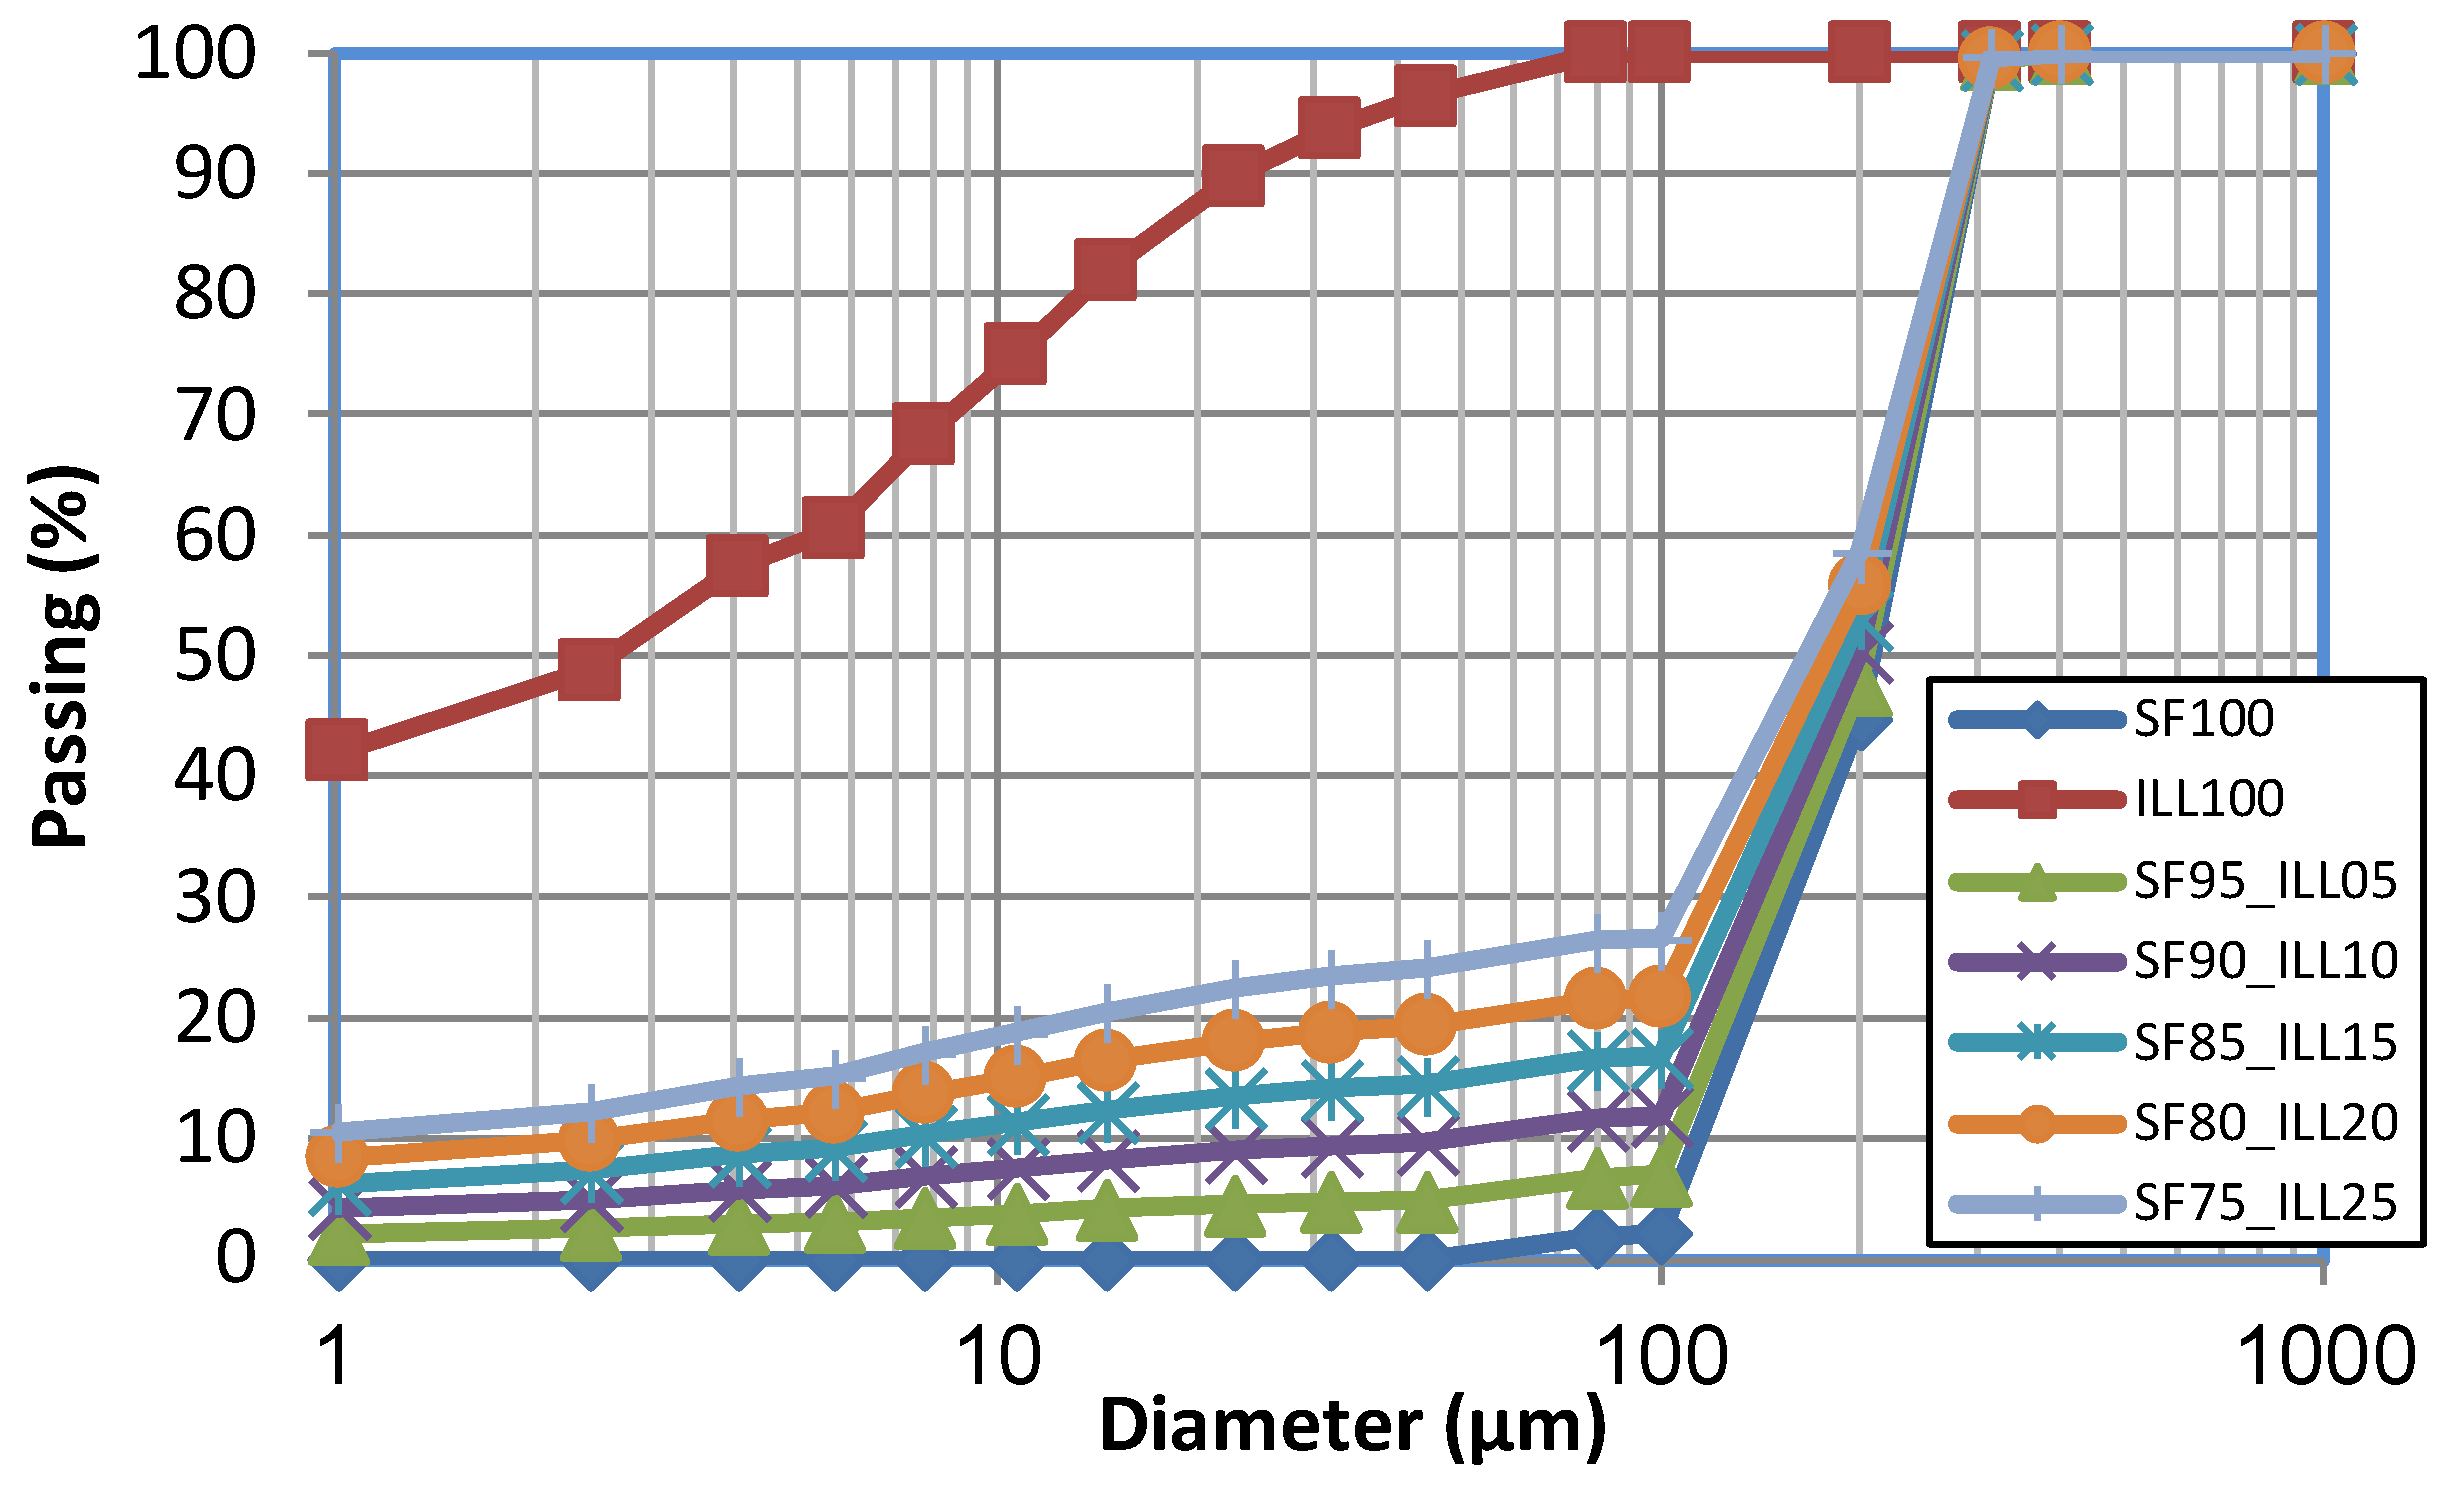
Sandy soil mixtures were prepared by mixing clean sand with different percentages of Illite Arvel. The granulometric characteristics (i.e., grain size distribution curves) of Fontainebleau clean sand, plastic fine, and different sandy soil mixtures are shown in Figure 1.

Figure 1.
Grain size distribution of Fontainebleau sand, Illite Arvel, and mixtures.
In France, the French standard NF P94-051 [37] has been usually used to determine the consistency limits in soils. However, it is difficult, even impossible, to perform with cohesionless soils with high sand content, which is the case for almost all mixtures considered in this study. Therefore, alternative methods have been considered to evaluate the plasticity index (Ip) from the liquid limit (WL) [38,39,40]. The Kodikara [40] method was adopted in this work to estimate the consistency limits of mixtures (see Table 3). It should be noted that these results cannot be completely reliable and there is a need for further research to verify, but this has proven to be the only method giving us results with acceptable consistency.
Table 3.
Atterberg limits of materials.
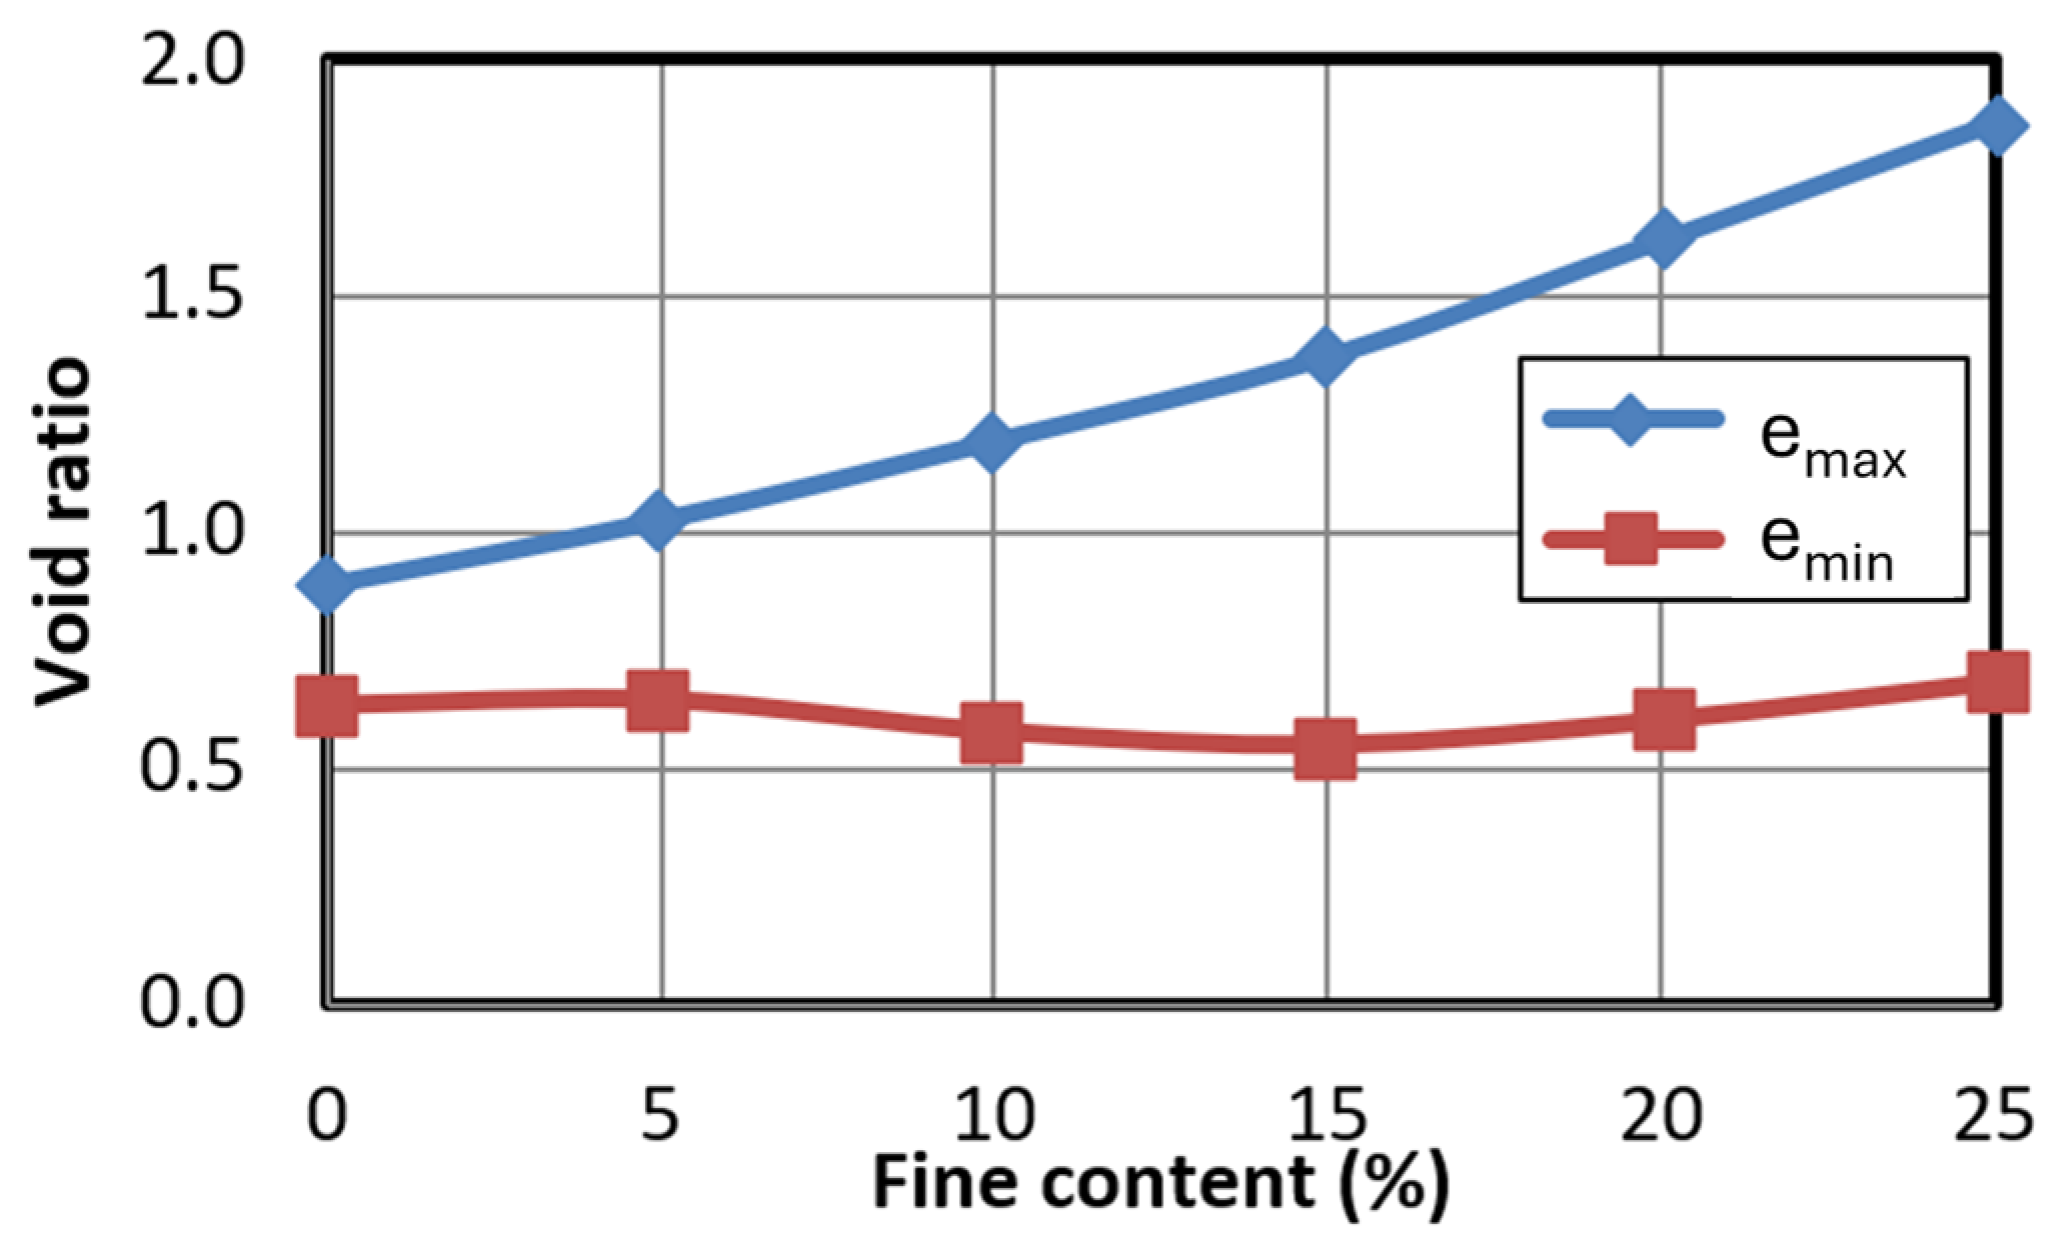
Maximum and minimum void ratios (emax and emin) were determined by using the French standard NF P 94-059 [41] for all the considered mixtures (see Figure 2). However, it should be noted that there is no standard to measure emax and emin for sandy soil including more than 12% fine content. It is observed that emax increases versus an increase in fine content, while a threshold of 15% fine content is found for emin at which emin changes the trend. As a reminder, this threshold is called the “transition fine content (TFC)” (or “limiting fine content” or “critical fine content” by different authors) [42]. This trend has been explained by several scholars (e.g., Karim and Adam [42], Lade et al. [43], etc.). Indeed, a low amount of the added material leads to a decrease in emin because fine particles primarily fill the global sand matrix. Beyond the TFC value, sand grains start to disperse in the global matrix constituted by fine particles and, thus, emin increases. Jradi [17] used Westman and Hugill [44] diagram and obtained TFC = 24%, which is different from the measured value obtained in this study.
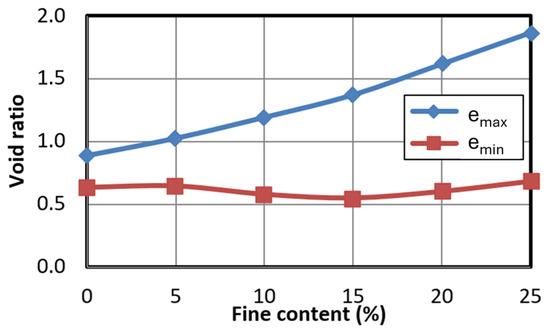
Figure 2.
Maximum and minimum void index of all the mixtures.
2.2. Experiment Devices
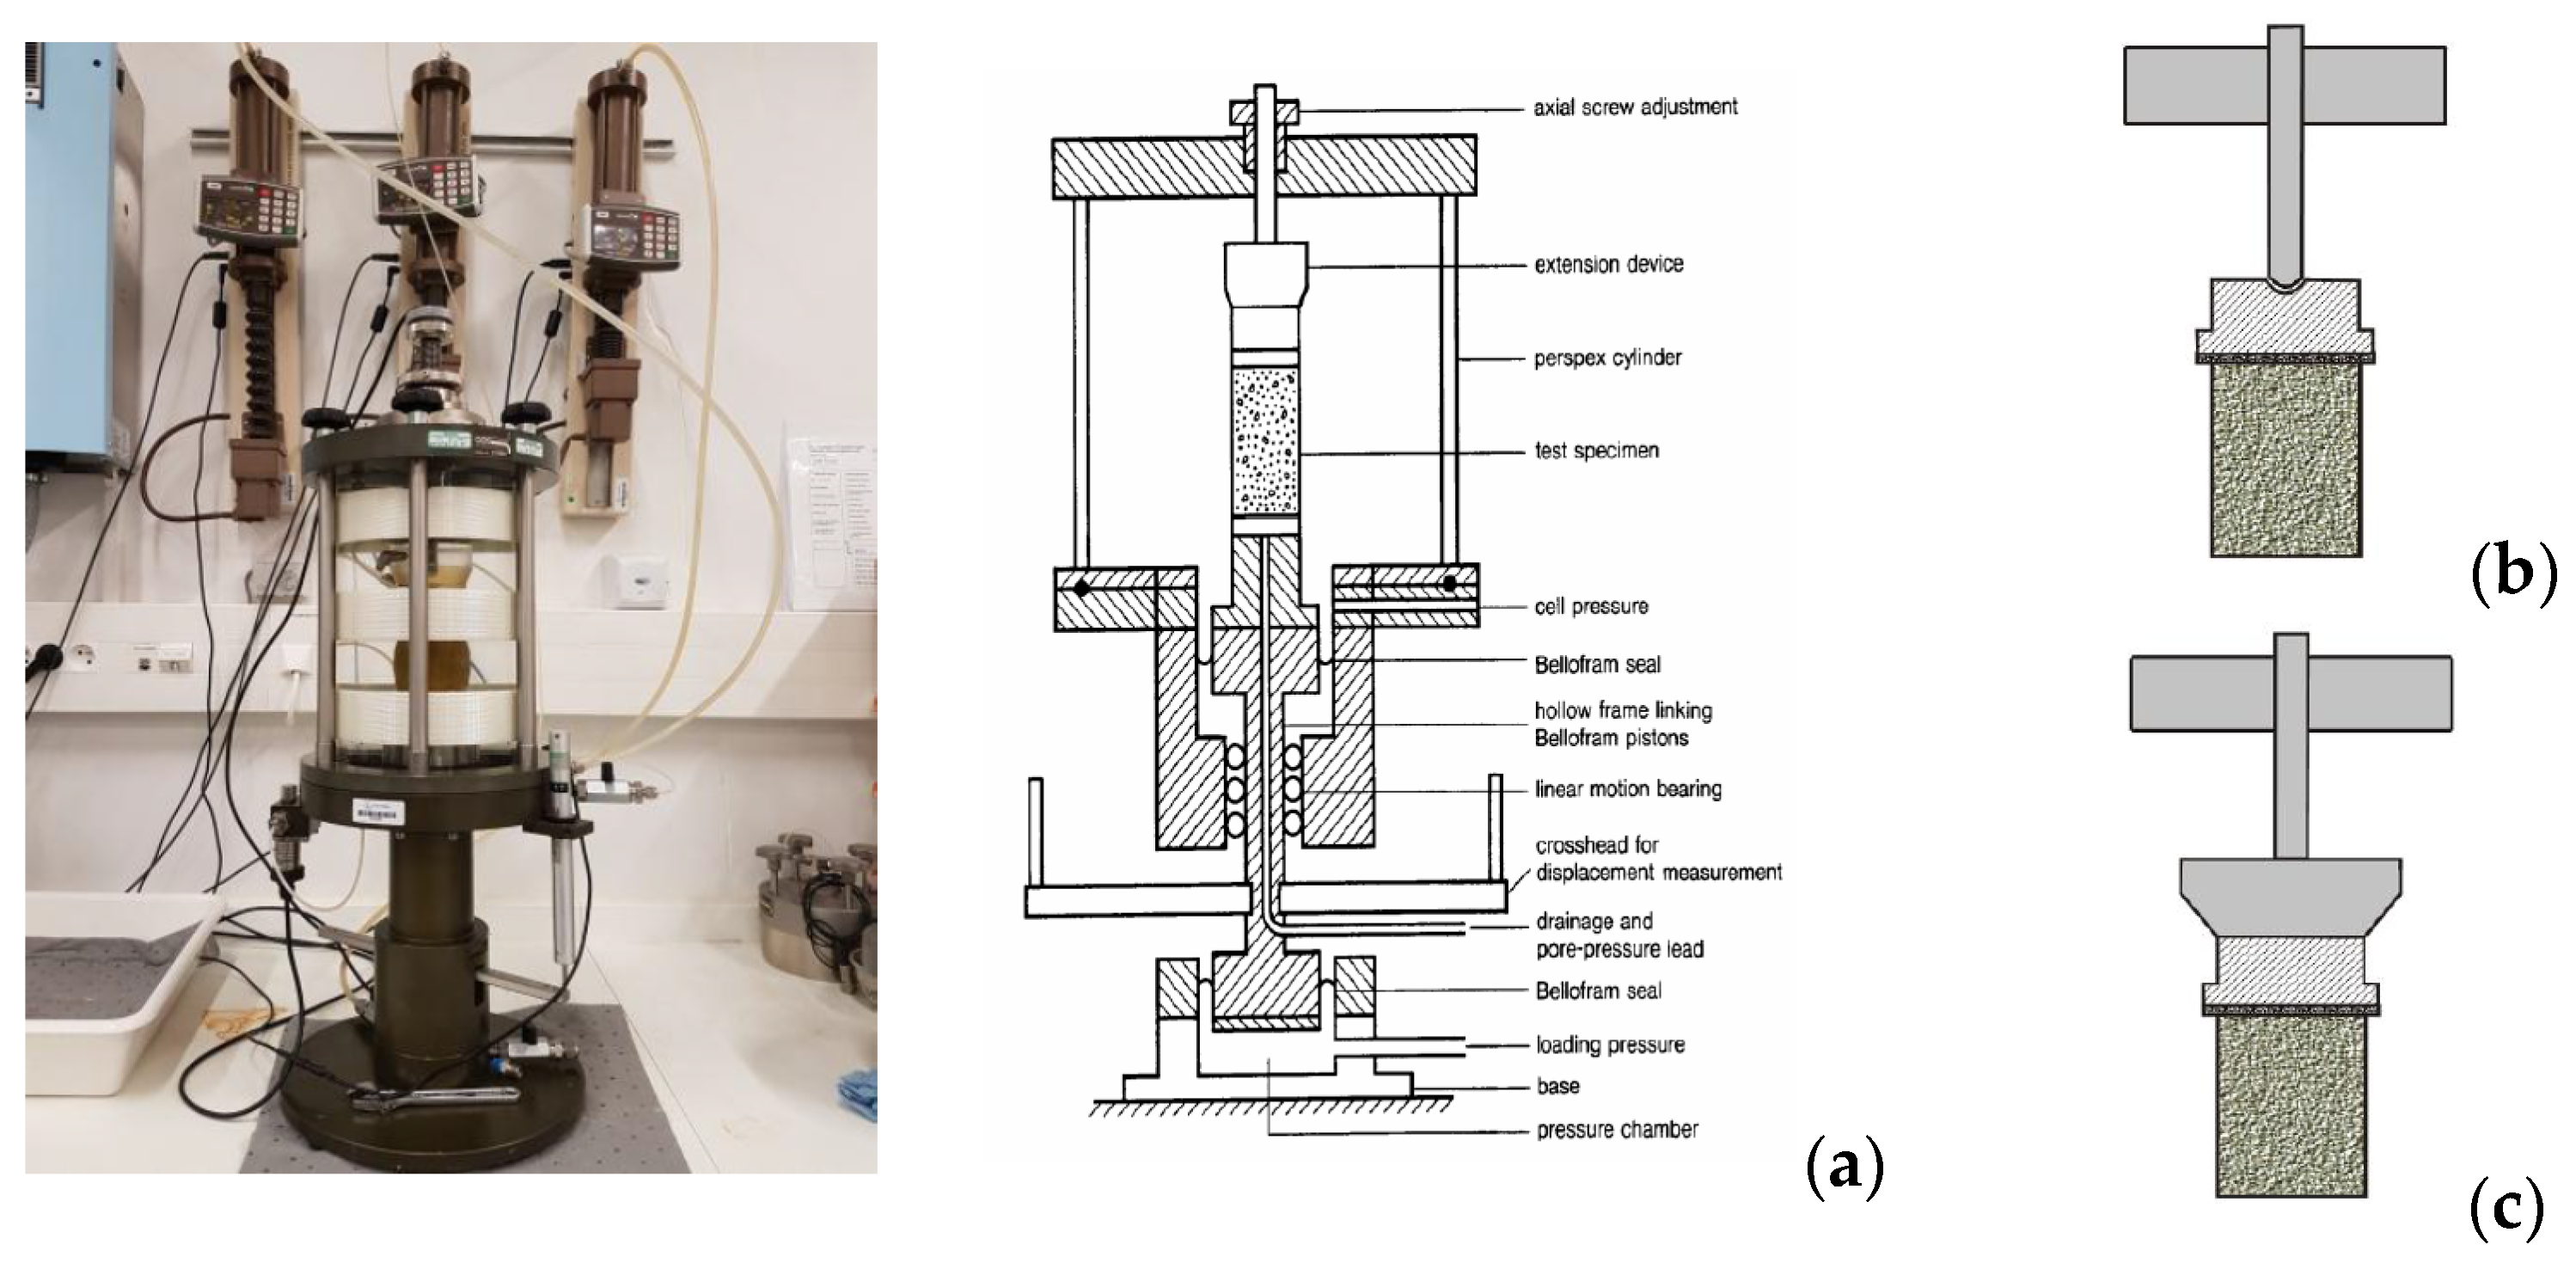
All the tests in this work were performed by using a Bishop and Wesley triaxial device with GDS pressure-volume controllers (see Figure 3a). It is constituted of a triaxial cell, three pressure volume controllers, and an 8-channel data acquisition unit. A pressure generator is designed to apply the pressure in the cell, one for the back pressure in the specimen and another for the piston at the bottom base which can move vertically. The 8-channel data acquisition device, known as the “serial data pad”, is used to transfer data from the displacement, the pore pressure, and the axial force transducers to the dedicated computer. The equipment is controlled by the GDSLAB Kernel software, which allows to automatically perform a wide variety of functions and tests, including cell and back pressure control for saturation, consolidation (isotropic and anisotropic), drained and undrained, monotonic and cyclic, triaxial tests.
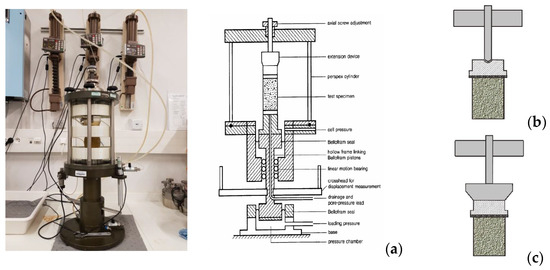
Figure 3.
Principle scheme of Bishop and Wesley triaxial device. (a) Loading piston; (b) with rounded heat; and (c) with flat base [45].
This Bishop and Wesley triaxial apparatus is dedicated to cylindrical samples with a height of 10 cm and a maximum diameter of 5 cm. The confining pressure (or cell pressure) capacity is 2 MPa and the maximum axial load is 8 kN. There is only one-way drainage from the bottom base to the top cap of the sample. The axial load is applied to the sample by increasing the pressure in the bottom pressure chamber. The loading system allows monotonic loading under strain-controlled conditions and cyclic loading, in a quasi-static configuration, under stress-controlled conditions. The maximum cyclic rate is 36 s per cycle (0.0278 Hz).
The rounded head piston on the top cap is appropriate for dense specimens, but the result is not corrected for loose samples. Therefore, the baseplate integrated into the piston is adopted to give better results (see Figure 3a,b). Moreover, a cyclic test can be performed by adding a connecting membrane to this baseplate.
2.3. Testing Procedure
The experimental procedure includes four steps: sample reconstitution; saturation; consolidation; and loading phase. This section only briefly describes the testing procedure. However, all the details about both monotonic and cyclic tests are reported in Dang [45] and Gobbi [46].
2.3.1. Sample Reconstitution
As a reminder, the sample reconstitution methods affect the soil behavior. There are three methods for reconstituting the sample: moist tamping, dry tamping, and sedimentation. Amini et al. [13] showed that the resistance to liquefaction of soil samples was not different when they were prepared by moist tamping and sedimentation methods. As shown by different scholars (e.g., Ladd [47], Mullilis et al. [48], Canou [49], Ishihara [50]), the moist tamping method allows reconstituting samples with extremely loose densities, even with negative relative densities, as measured by NF P94-059 standards [41], due to capillary cohesion between the sand grains. It also avoids segregation between sand and fine particles and provides an efficient control for the global density of the sample. Since this study focuses primarily on the liquefaction phenomenon, the moist tamping method was adopted for the sample preparation.
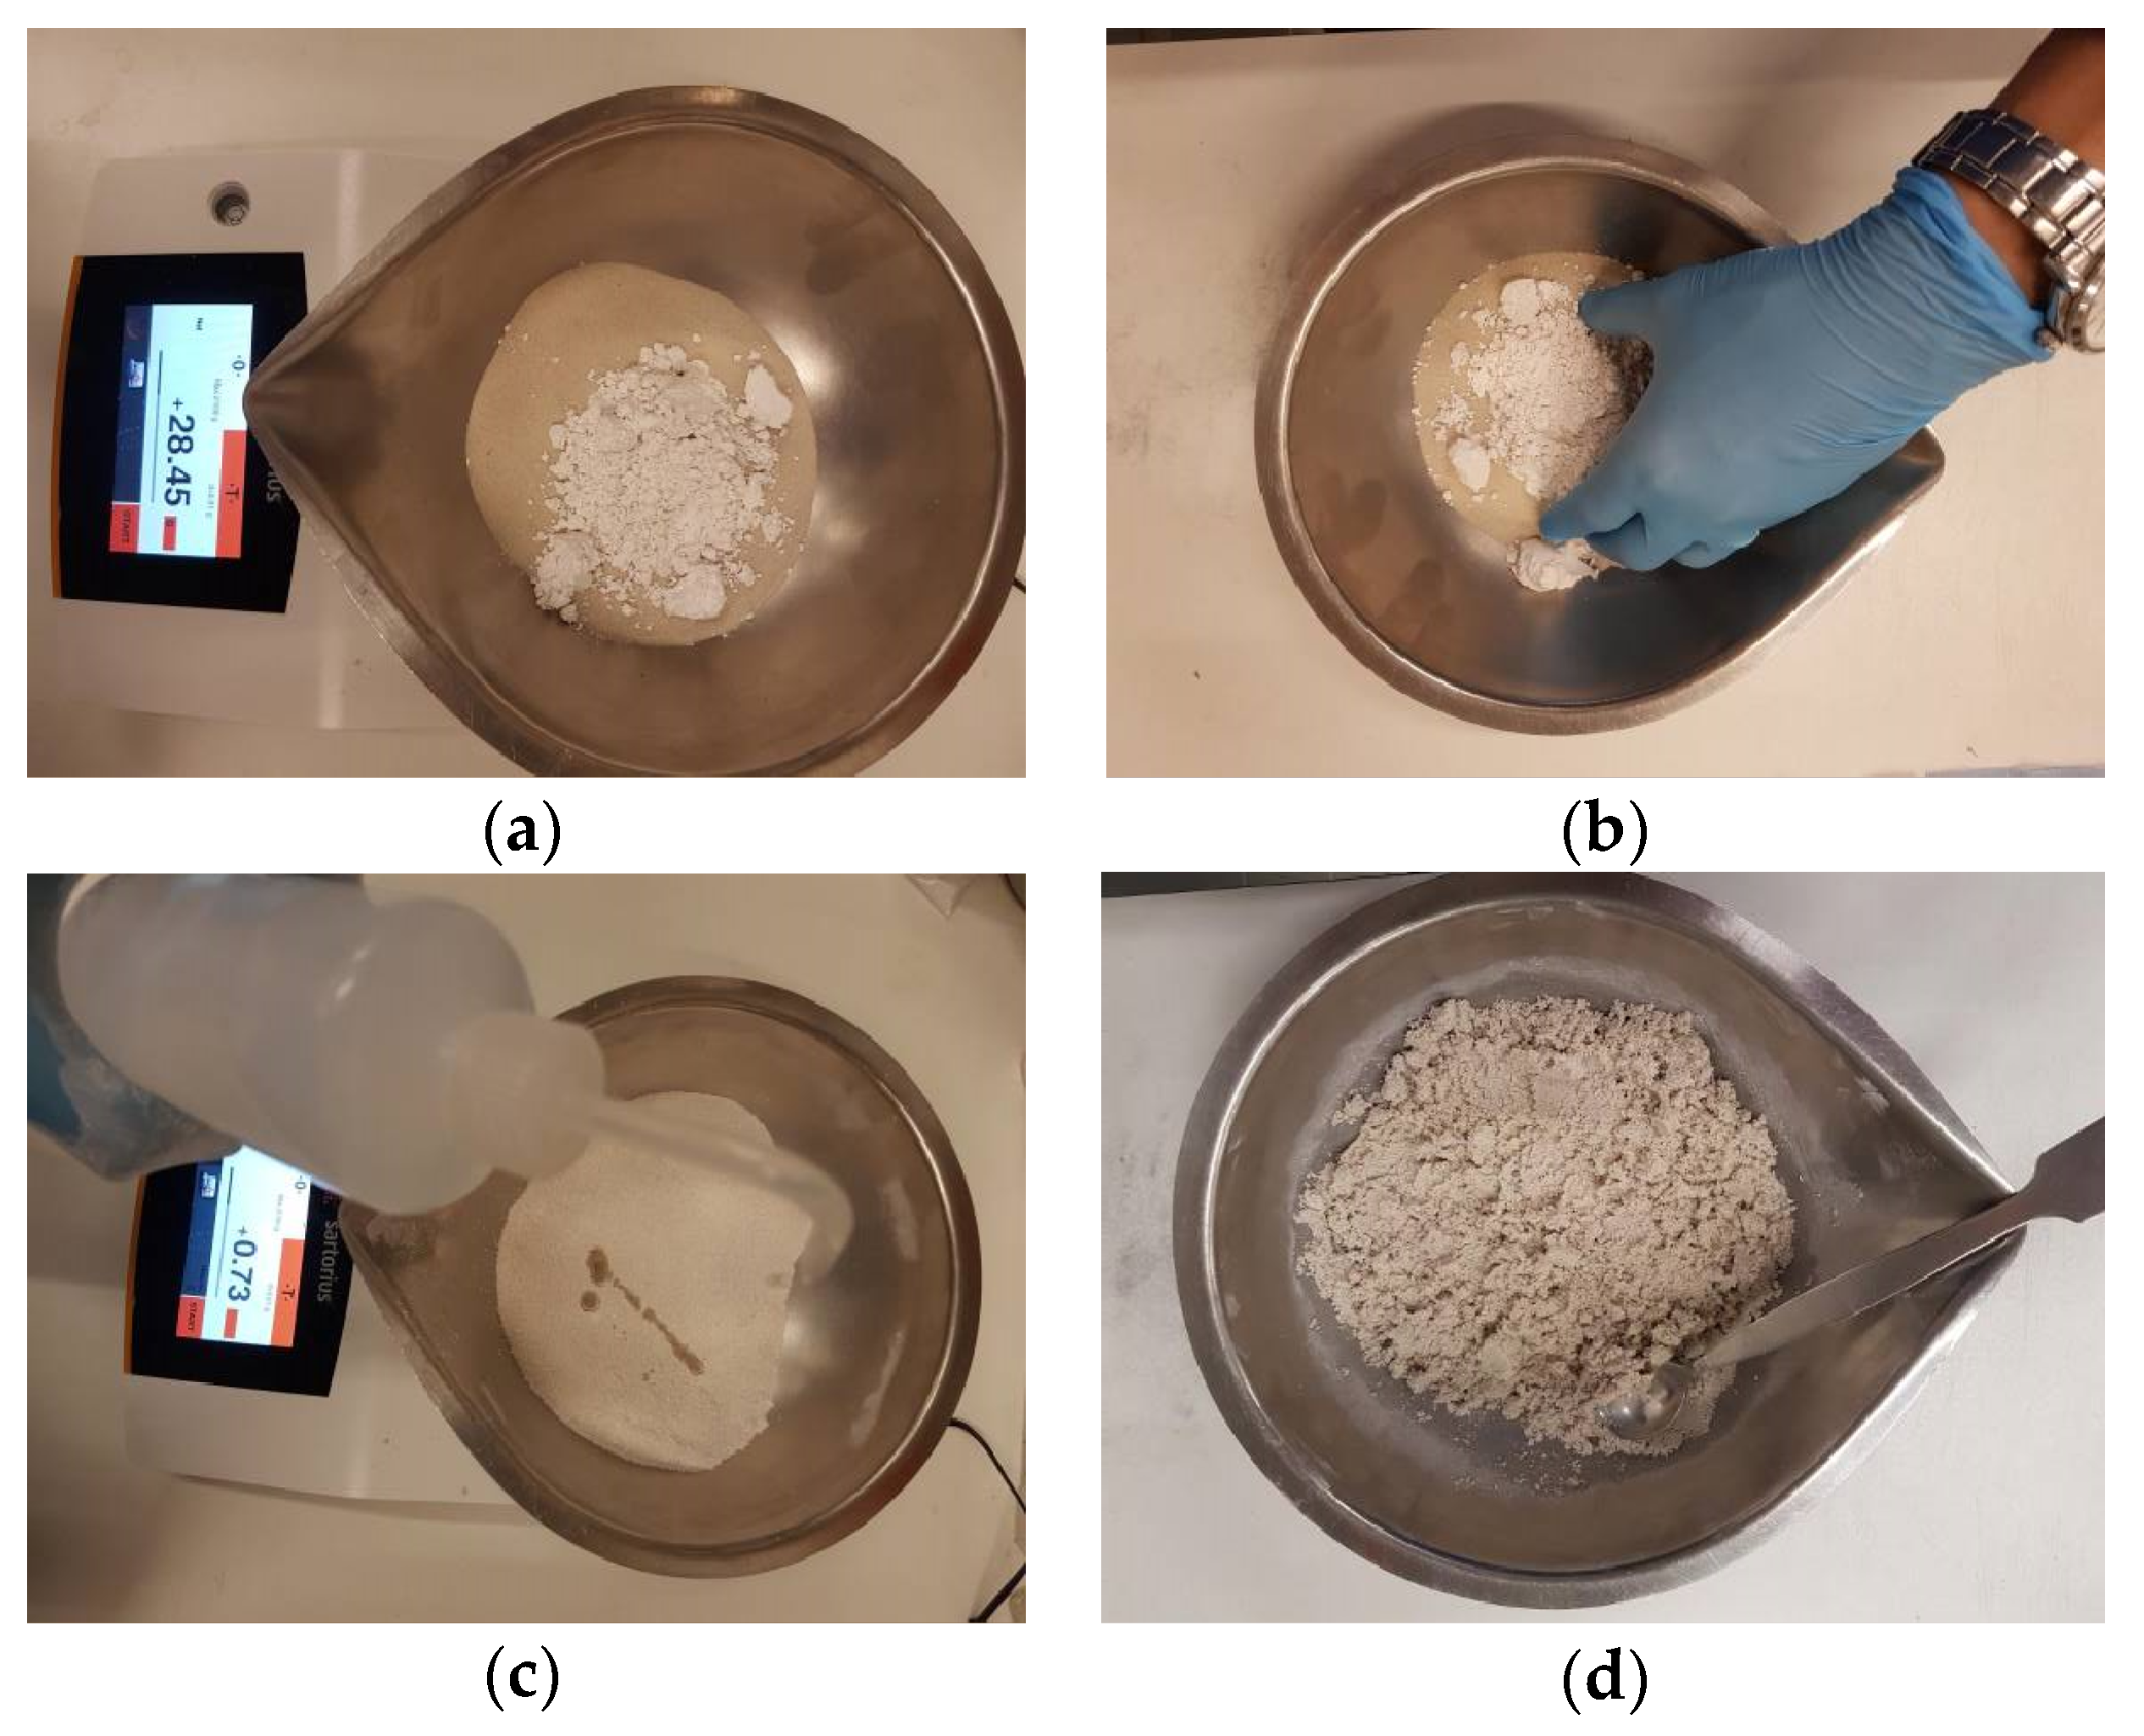
The soils were firstly prepared and stored (Figure 4). Then, the test set-up was prepared (Figure 5). Finally, the sample is reconstituted and the triaxial cell is assembled (Figure 6). Setting up the mold can be carried out before or at the same time as the soil preparation.

Figure 4.
Soil preparation: (a) dry material (mixture of sand and fines); (b) mixing dry material; (c) adding water; and (d) mixing moist material [45].

Figure 5.
Mold set-up: (a) placing the porous stone on the pedestal; (b) filter paper; (c) the membrane; and (d) the metal mold [45].
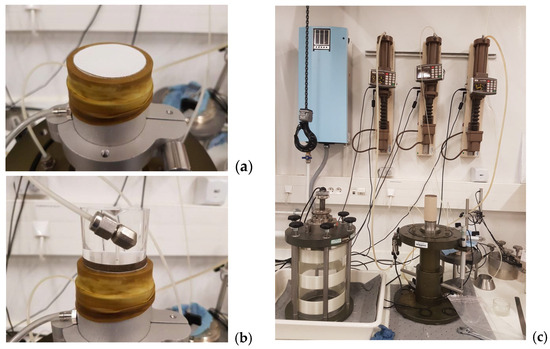
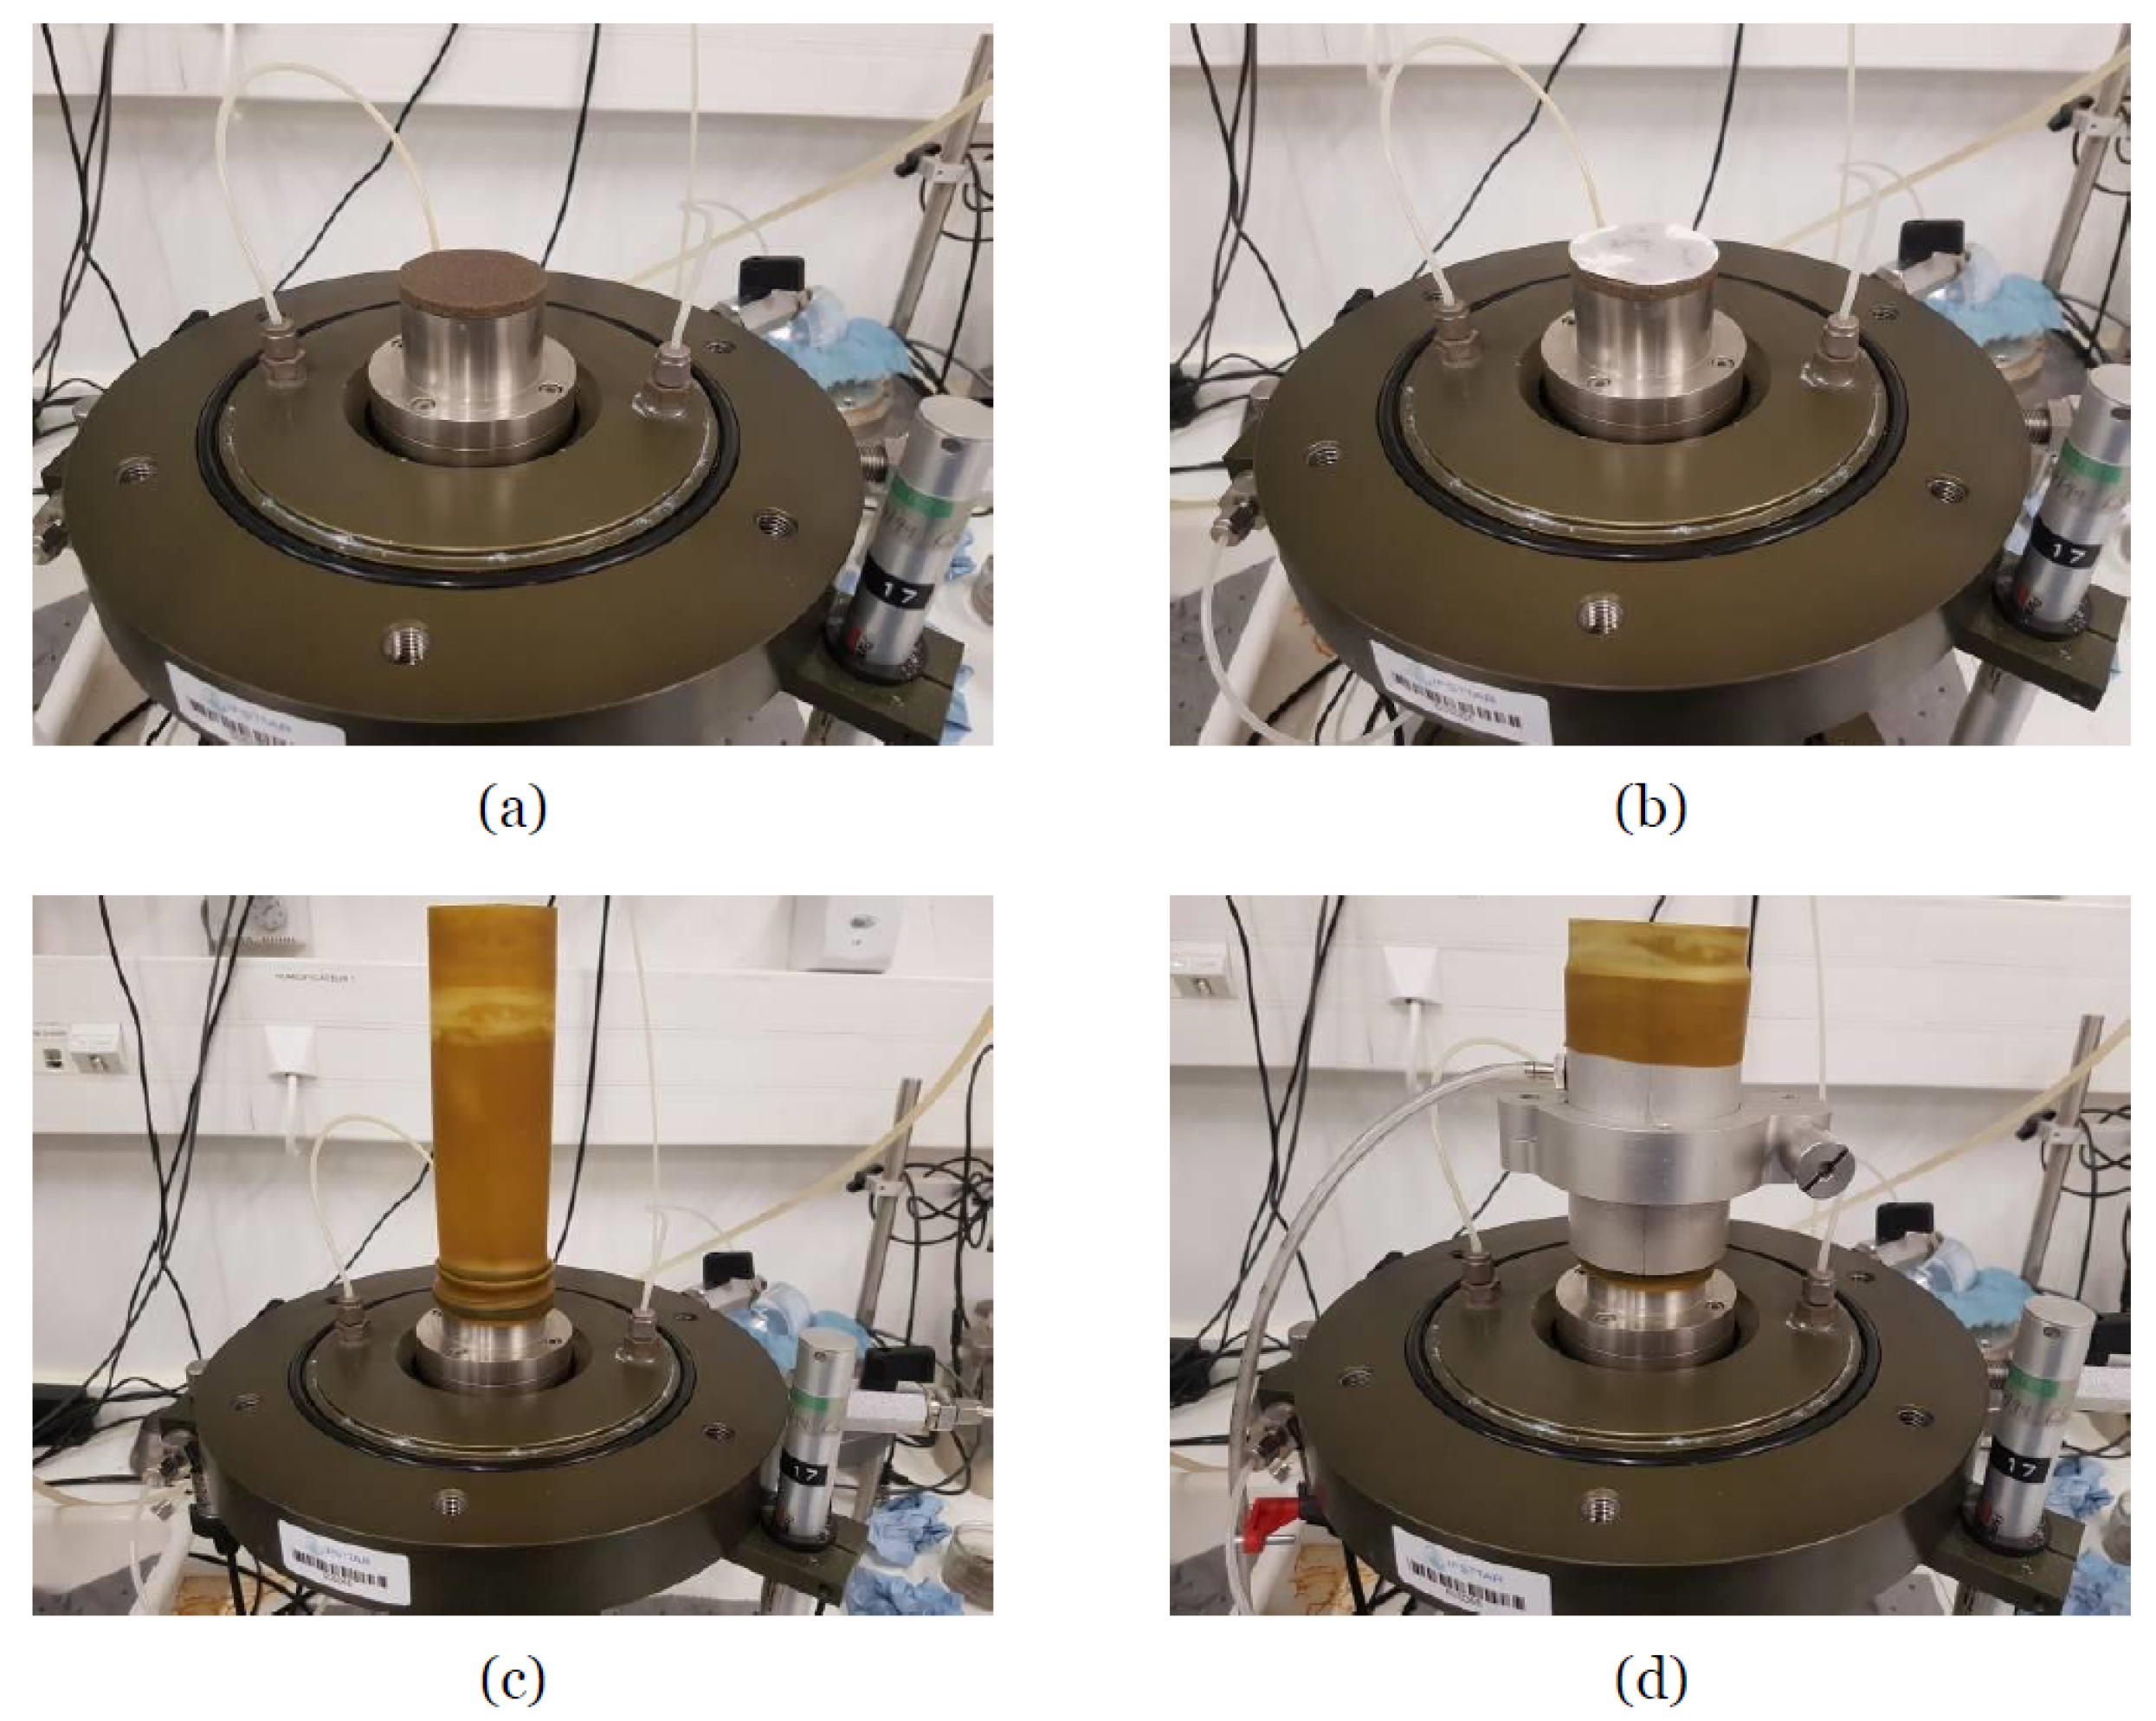
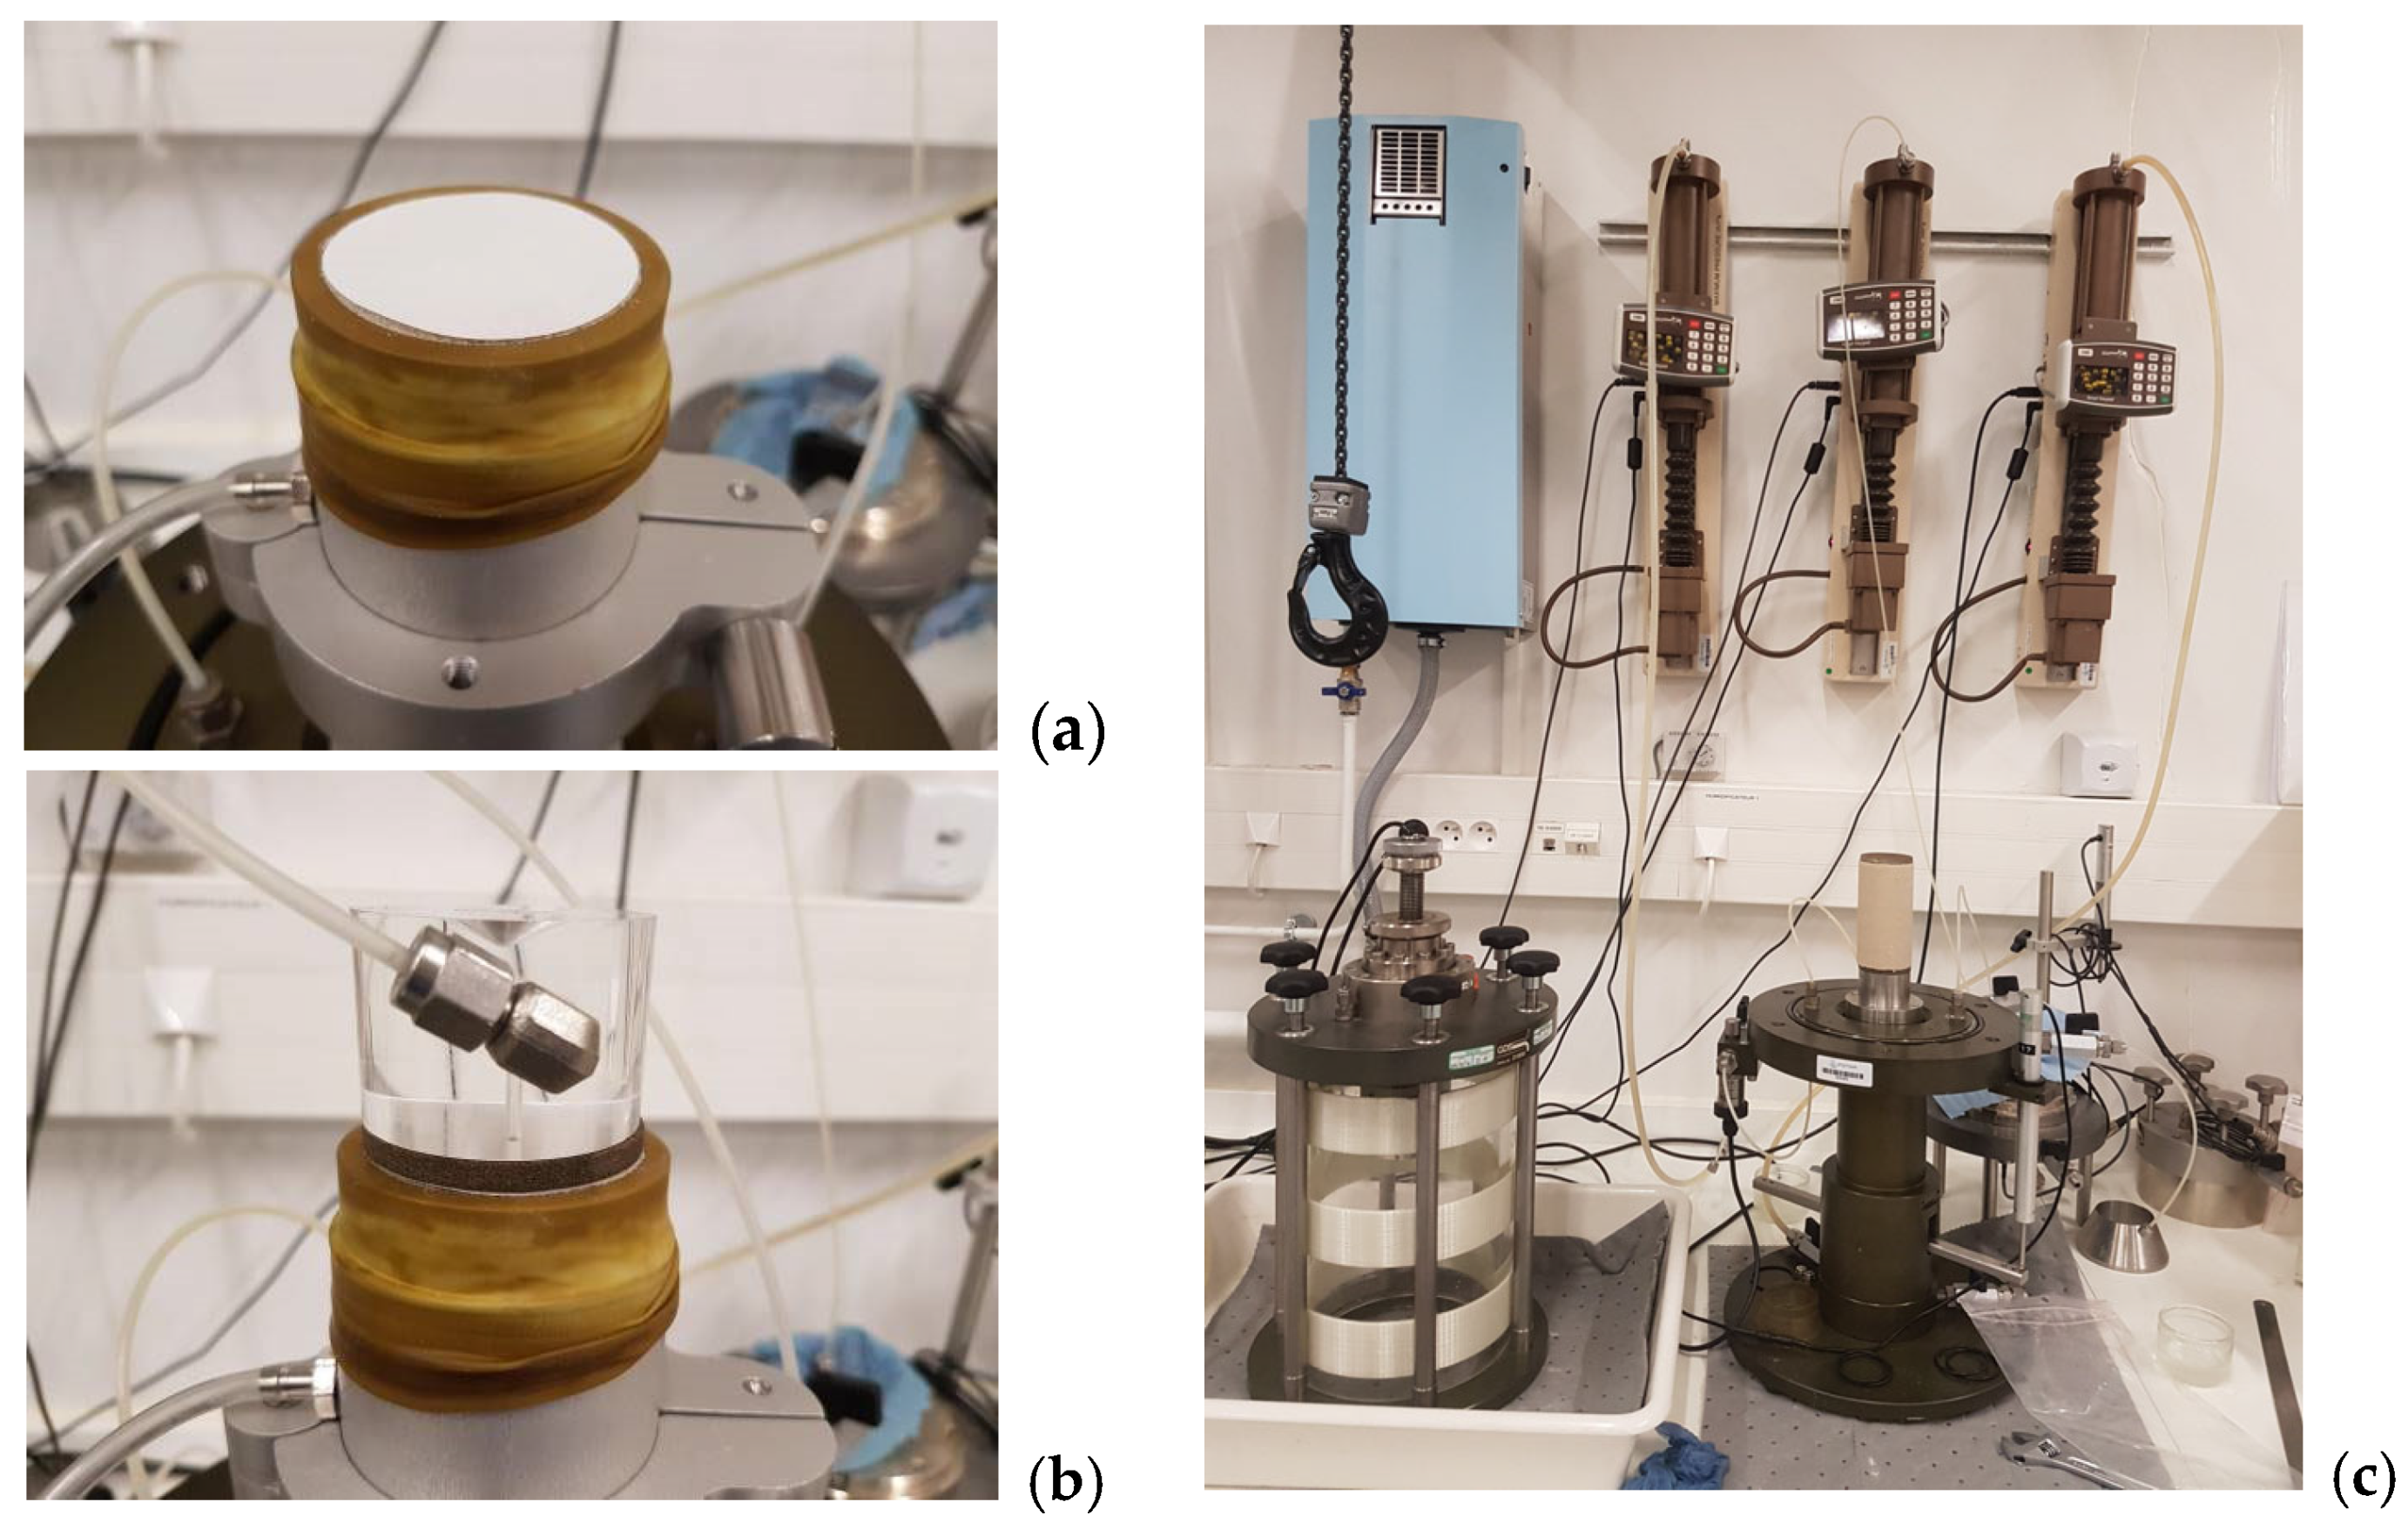
Figure 6.
Sample reconstitution and triaxial cell assembly: (a) sample preparation; (b) connecting the pressure source; and (c) assemblage and filling of the triaxial cell [45].
Dry materials (clean sand or sand–fines mixtures) were thoroughly mixed at room temperature before adding water. The amount of water added is 5% of the mass of the sand for pure sand. The added water amount can be slightly increased for a mixture of sand and fines, depending on the fine content, but should not exceed 10%. Then, we continue to mix the material after adding water until a good homogeneity is reached. The material is then stored in a well-sealed plastic bag to ensure that the water content does not change during the test setup.
To set up the mold, a porous stone and filter paper were first placed on the bottom base, which allows the water drainage but prevents the migration of fines. Secondly, a latex membrane with a thickness of 0.3 mm was attached around the outside of the pedestal by using two rubber O’rings. Thirdly, a metal split mold of diameter 50.5 mm was positioned around the base and secured in place with a metal split ring. Finally, a small vacuum is applied to the internal mold space through a valve, holding the membrane against the mold wall during the sample preparation.
One fifth of the material mass, calculated to reconstitute the sample (i.e., corresponding to a layer of 2 cm), is meticulously deposited by a small spoon at zero drop height into the mold. This layer is then compacted by a temper of 3.5 cm in diameter to reach the target density. The tamper is marked every 2 cm to control the desired height and avoid over-compaction. This procedure is repeated until the whole mold is filled with material. The second filter paper, the second porous stone, and the upper base are then placed in turn on the test sample. Then, the membrane is flipped and fixed with two rubber O’rings. Afterward, the securing membrane is placed on the upper baseplate. Before disassembling the mold, a slight vacuum, between −10 kPa and −20 kPa (lower than the consolidation stress), is applied in the specimen. Then, the dimensions of the specimen are checked by measuring the height at three diametrically opposite points and the circumference at three points. Finally, the triaxial cell is assembled and filled with water. The two pressure sources for cell pressure and back pressure are connected to the drainage lines (see Figure 6).
2.3.2. Saturation
The saturation process allows all the voids with the sample to be filled with water. Firstly, the load head is moved down to reach the upper baseplate. The axial strain is recorded. A confining pressure of 20 kPa is prescribed before removing the vacuum Carbon dioxide (CO2) is circulated through the sample for 10 to 30 min at a low pressure of 2 to 10 kPa, depending on the relative density of the specimen and the percentage of fines in the mixture. This ensures the total replacement of air bubbles by CO2, which is more soluble in water, and thus helps to promote the total saturation of the sample during the saturation process.
The de-aerated water is then pumped upwards through the sample. The water flowing through the sample must be equal to the volume of the sample voids. The final step is to connect the pressure generator to the drainage lines and then progressively apply back pressure inside the sample until 400 kPa to ensure the dissolution of the residual gas bubbles in the void liquid. The confining pressure is also simultaneously increased by the same or a slightly higher value, by ensuring that the difference between cell pressure and back pressure is minor than 2/3 of the confining pressure considered for the loading phase.
2.3.3. Consolidation
The consolidation phase allows the consolidation of the specimen at the effective stress state required before shearing, by increasing the cell pressure to the desired value. Consolidation is considered complete when a change in volume of less than 5 mm3 is observed over 15 min for the sand and 20 min for the mixtures, according to the French standard NF-P94-059 [41].
The sample void ratio after the consolidation phase is carefully determined by using two methods. The first one is proposed by Verdugo and Ishihara [51]. The second one is based on the volume change during the saturation and the consolidation phases determined by directly measuring the volume of water expelled or absorbed by the sample.
2.3.4. Loading
The contact between the loading piston and the sample top was made. The contact occurs when the axial force varies by 0.005 kN (corresponding to a deviator of 2.5 kPa). Afterwards, shearing was performed in displacement-controlled mode with an axial strain rate of 1 mm per minute for undrained tests. The tests ended when the axial strain reaches ~17%.
2.4. Testing Program
Triaxial tests was first carried out on Fontainebleau clean sand under three confining pressures (Pc = 50, 100, and 400 kPa). Clean sand samples were reconstituted at three initial indexes (Idi = −0.2, 0.1, and 0.4) corresponding to very loose, loose, and dense states. Then the tests under Pc = 100 kPa were performed on mixtures specimens with fine content of up to 25%, at loose state. To study the effect of initial density index, of confining pressure, and of OCR, only the mixture with 15% fine content was considered. Table 4 recapitulates all the triaxial tests carried out in this study along with their characteristics.
Table 4.
Undrained triaxial test programs.
All the results of these tests are shown below in terms of the loading path in plan deviatoric stress: including the—mean effective stress (q-p’); the variation of deviatoric stress versus the axial strain (q-εa); and the variation of over pore pressure versus the axial strain (Δu-εa).
3. Results and Discussions
3.1. Clean Sand Behavior
The undrained behavior of Fontainebleau clean sand was first investigated to compare to the behavior of the sand and plastic fine mixtures. Triaxial tests under three confining pressures (Pc = 50; 100 and 400 kPa) were performed on the clean sand samples at three initial states represented by their initial density index: very loose state Idi = −0.2; loose state 0.1; or dense state Idi = 0.4). As a reminder, the negative density index (Idi = −0.2) is due to the use of the moist tamping for the sample reconstitution. The negative relative density was also reported by Benahmed [52] and Nguyen [53].
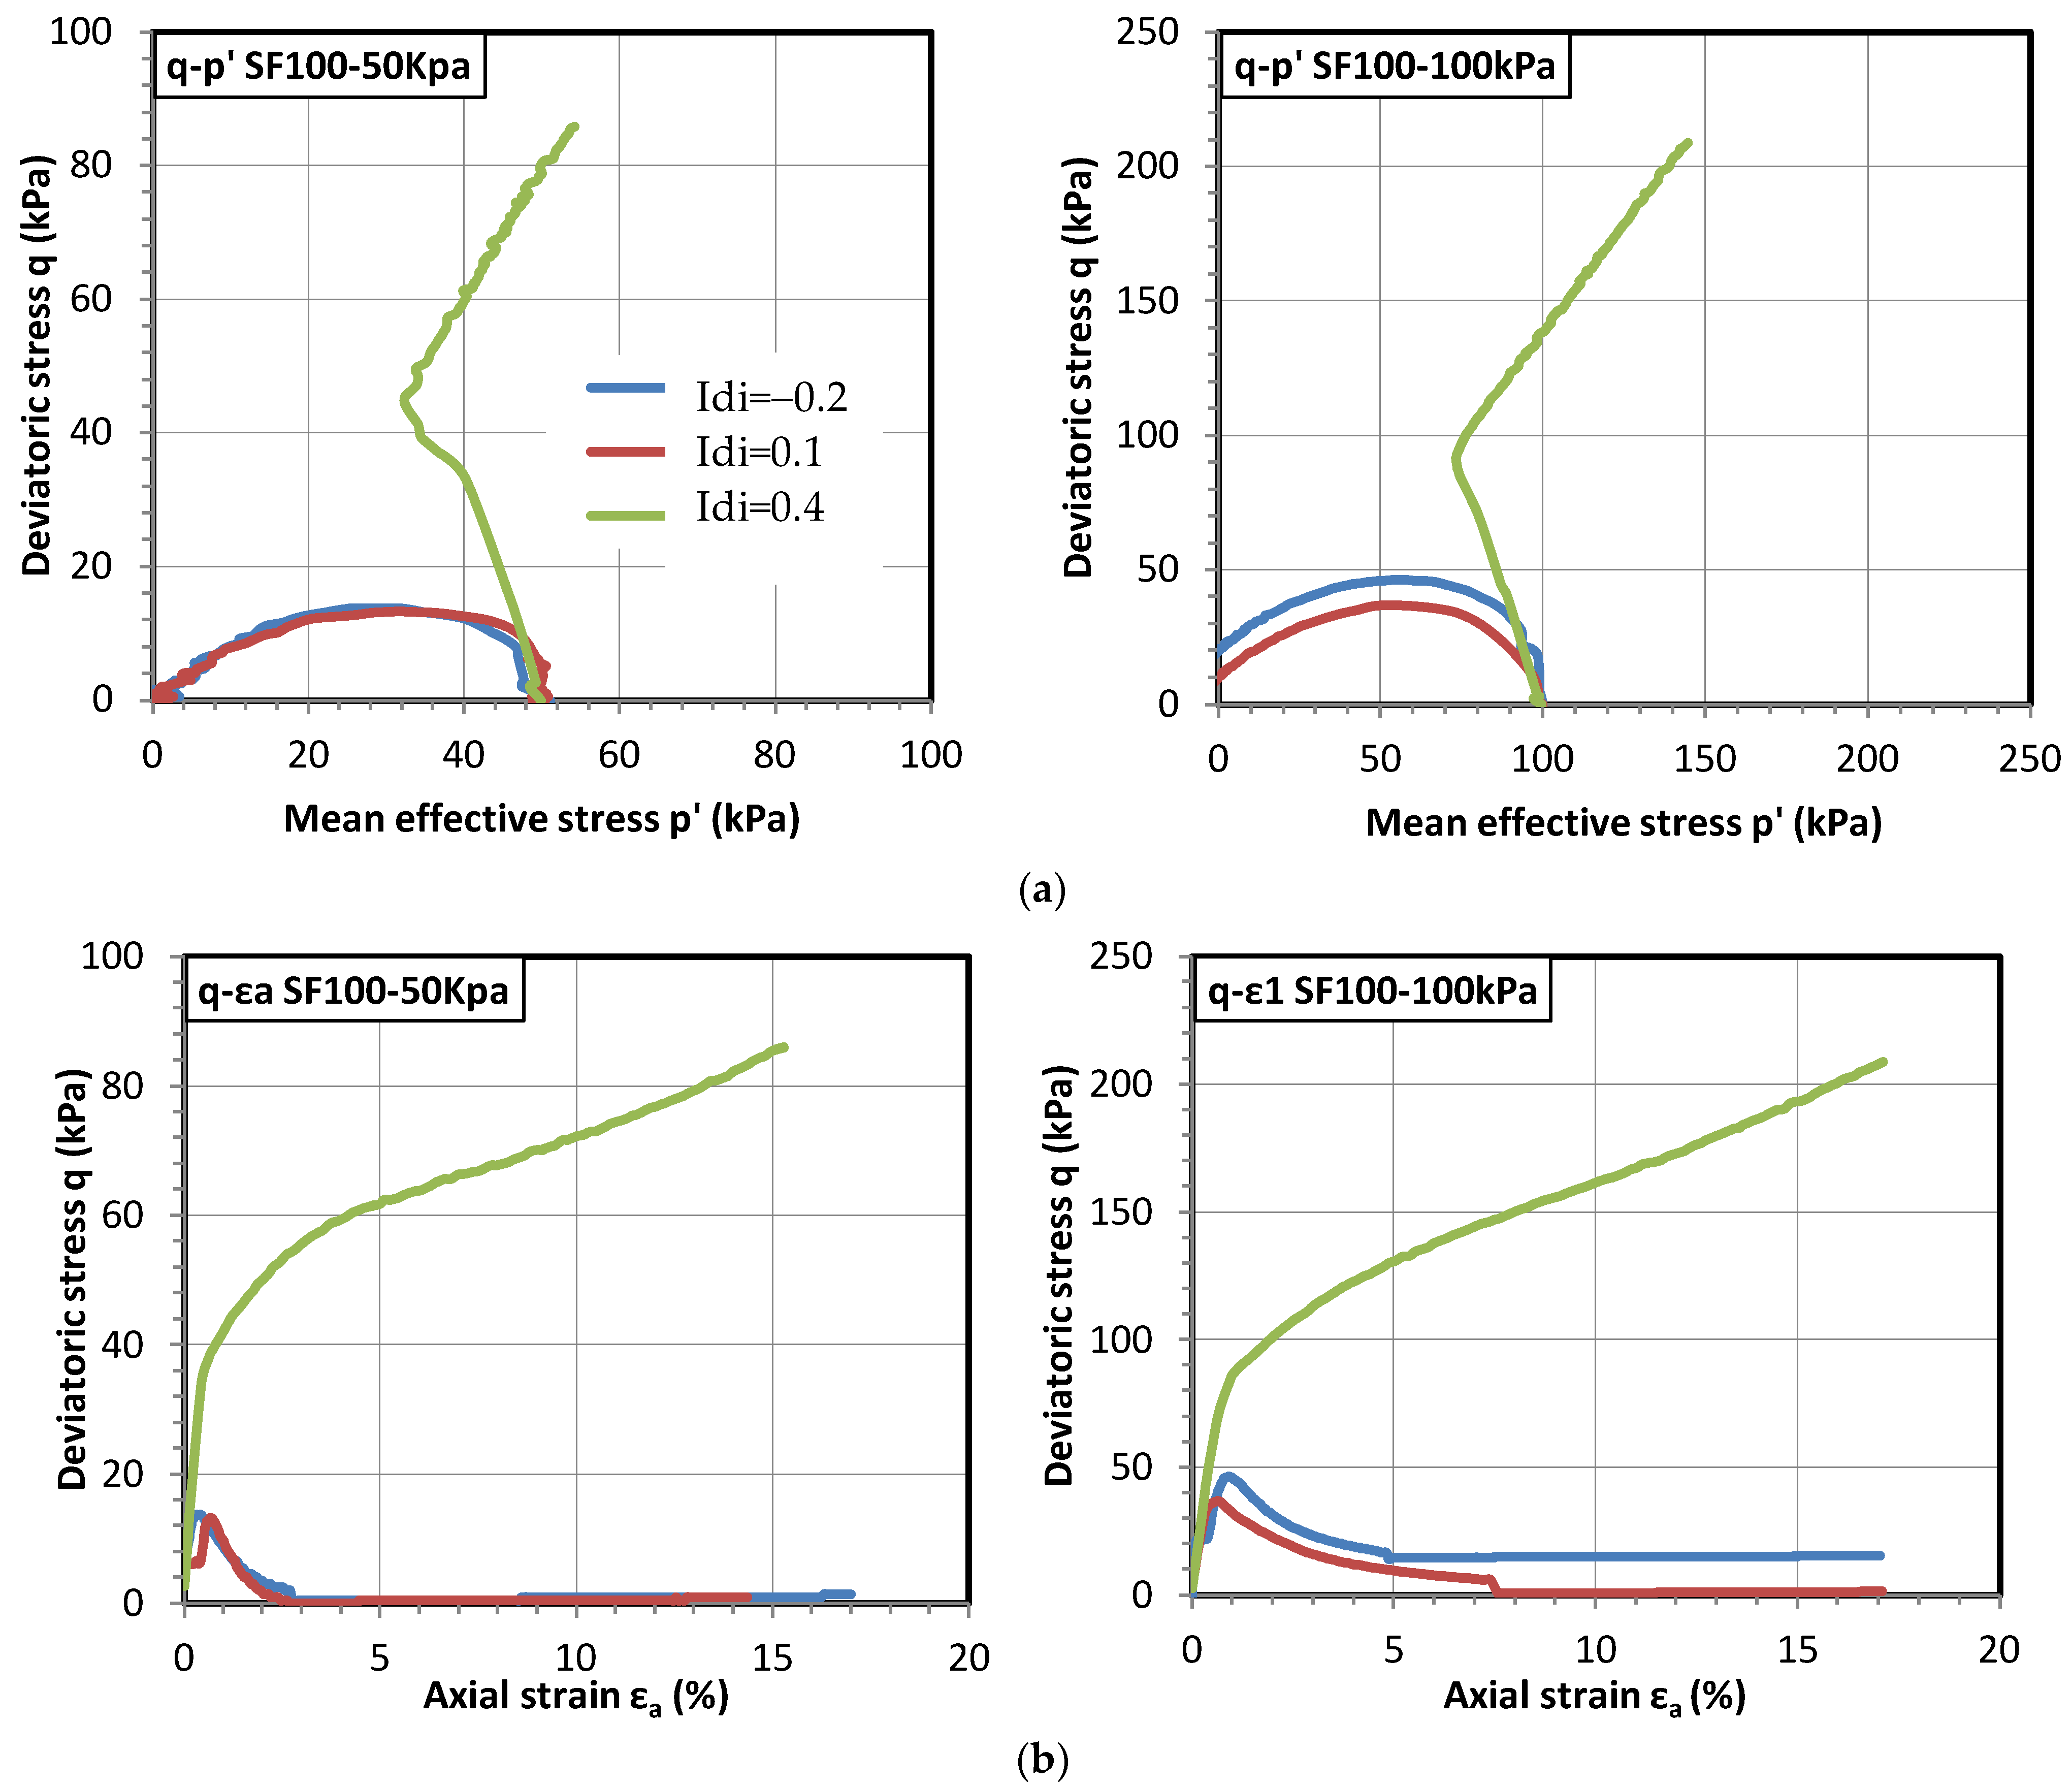
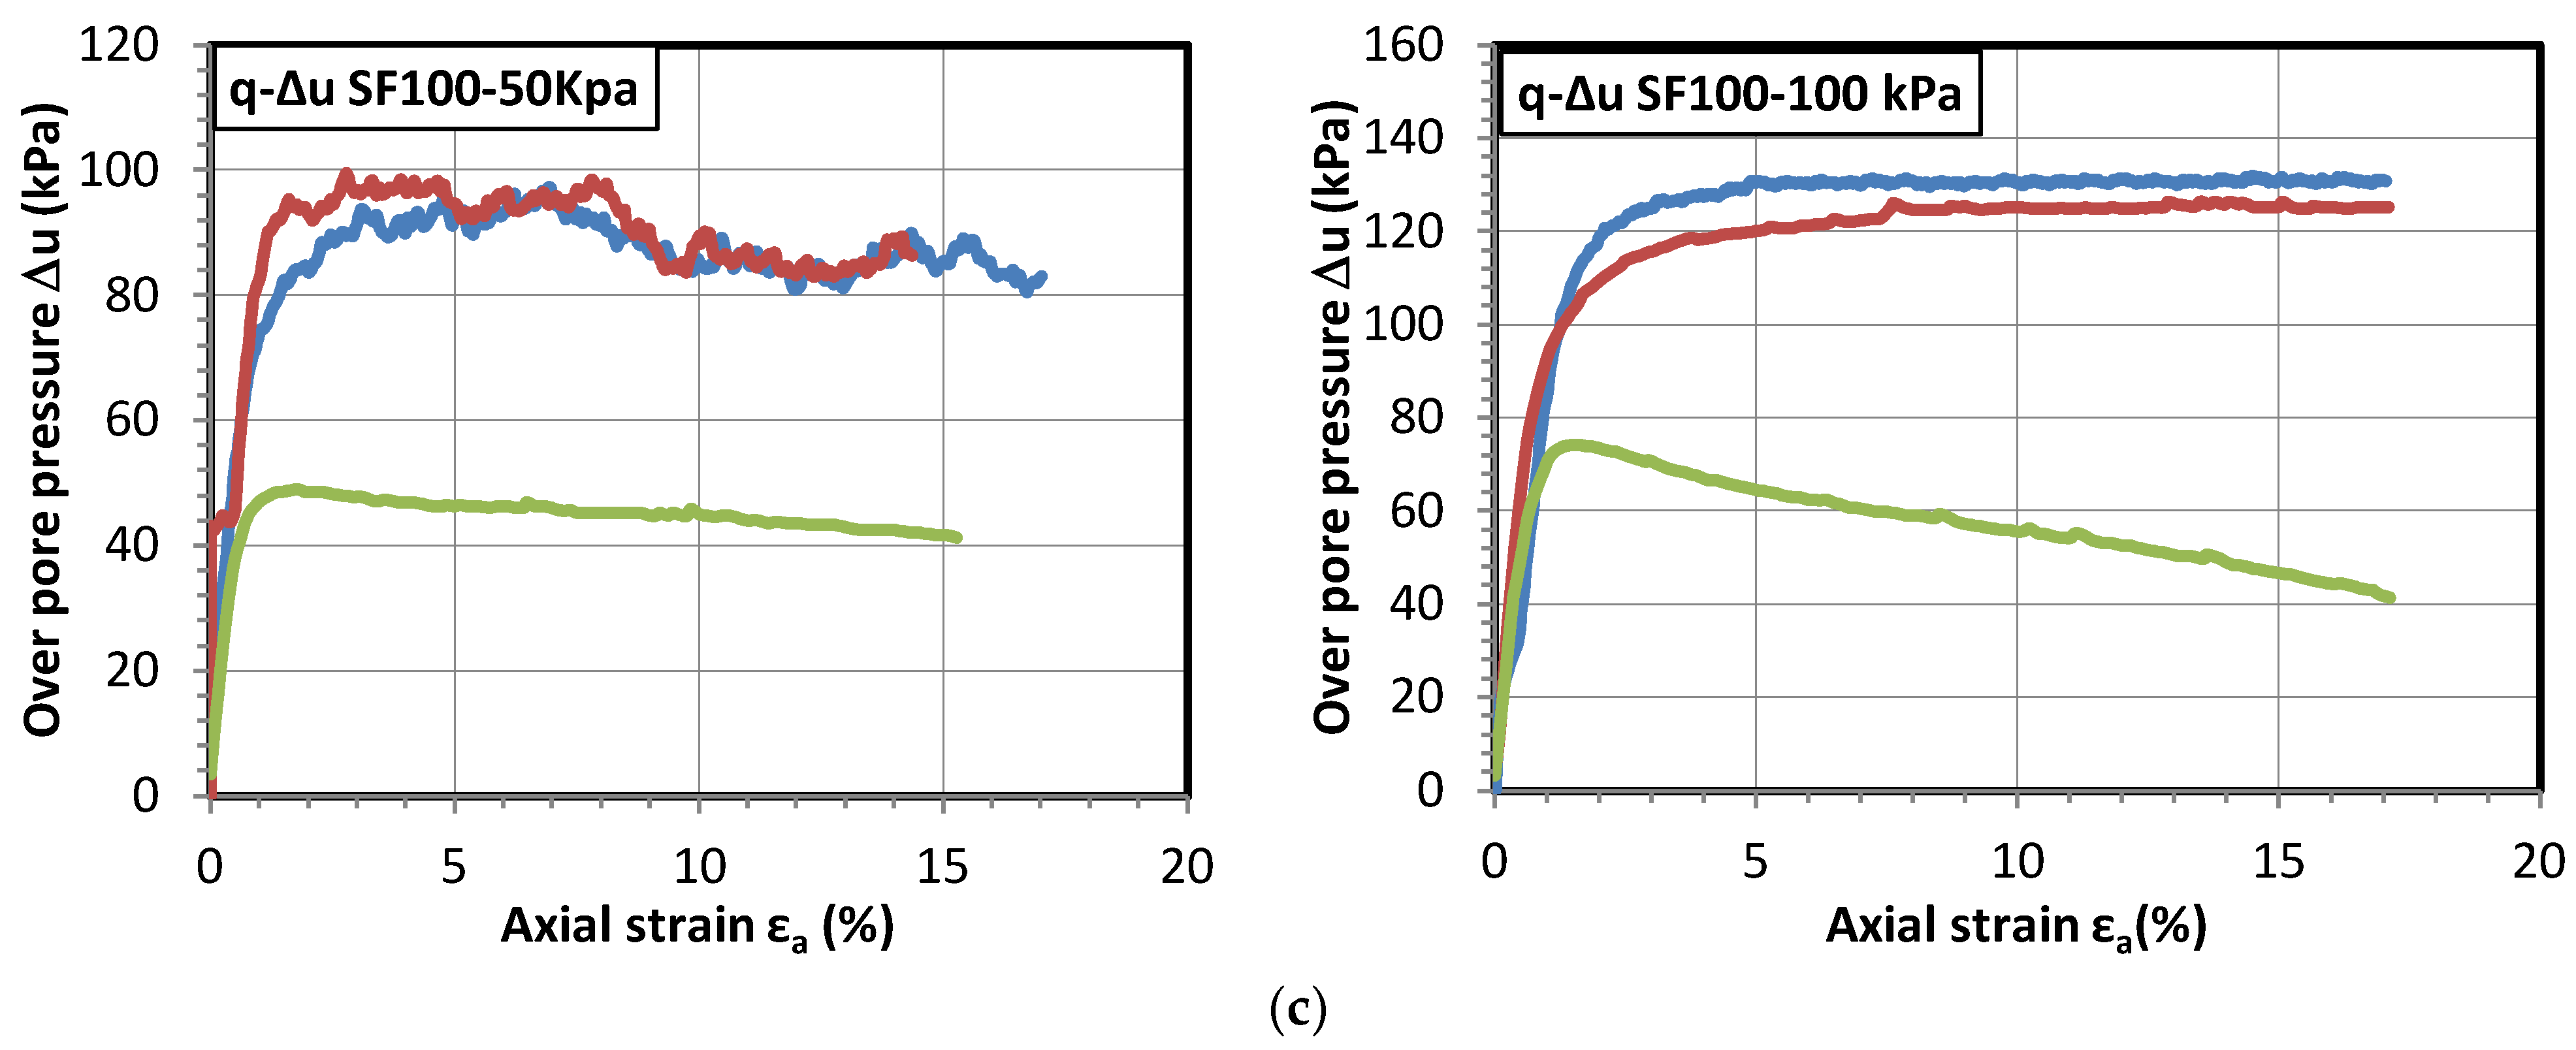
Figure 7 and Figure 8 present the results of nine triaxial tests. It is observed that two test groups corresponding to the confining pressure Pc = 50 and 100 kPa give similar behavior. For two initial states, very loose and loose, Fontainebleau sand exhibits the liquefaction responses, characterized on q-εa curve by a peak in strength at a low axial strain (<1%) and then followed by a rapid and abrupt decrease in strength to zero at the residual stage. For Pc = 50 kPa, two curves q-εa corresponding to Idi = −0.2 and 0.1 are almost coincident and they reach the total collapse (zero residual strength) from 3% of axial strain. For Pc = 100 kPa, the sample initially at a very loose state (Idi = −0.2) presents a total collapse from 7–8% of axial strain, while the sample with Idi = 0.1 does not reach total collapse and its residual strength is about 30% of peak strength. At the initial dense state (Idi = 0.4), the acquired result shows a typic dilatant behavior since the deviatoric stress continuously increases without any peak. The overpressure reaches the maximum value and then stabilizes for very loose and loose samples, while it reaches the peak value and then decreases for dense samples.
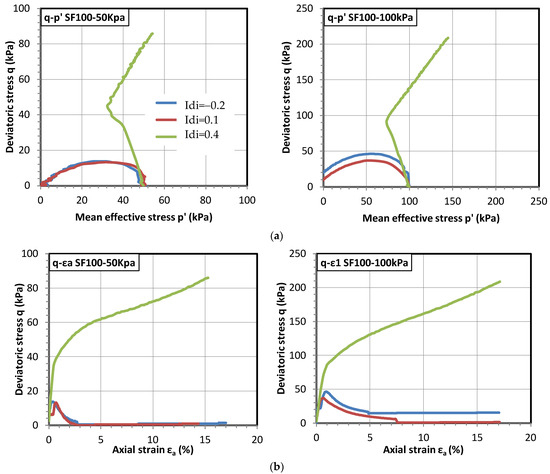
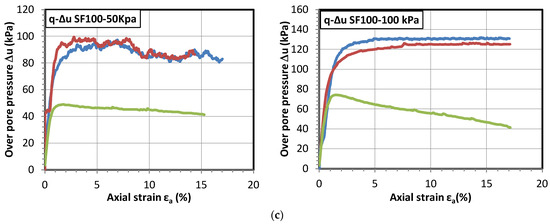
Figure 7.
Effect of initial density index Idi on the undrained behavior of Fontainebleau clean sand under two confining pressures (Pc = 50 and 100 kPa): (a) q-p’ curve; (b) q-εa curve; and (c) Δu-εa curve.
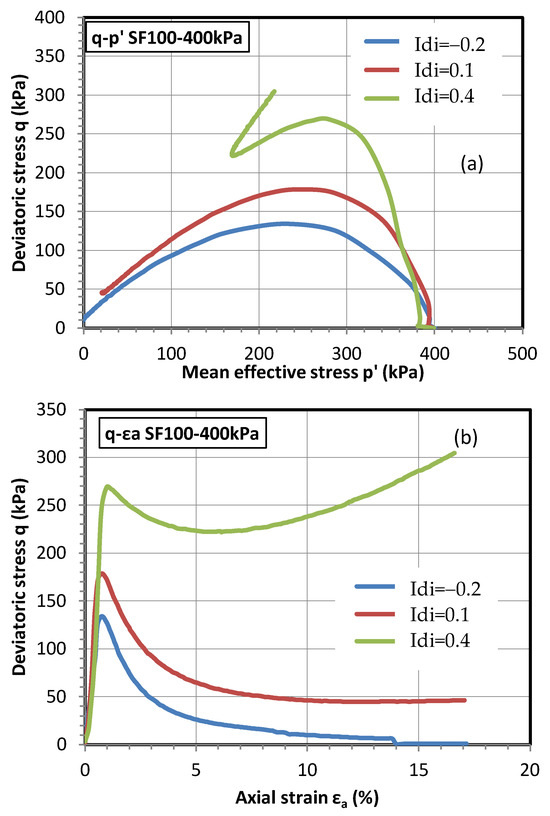
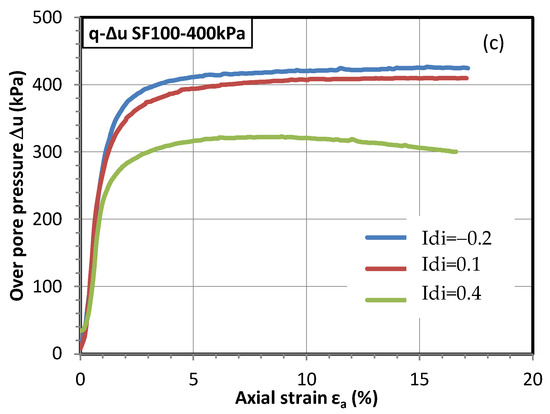
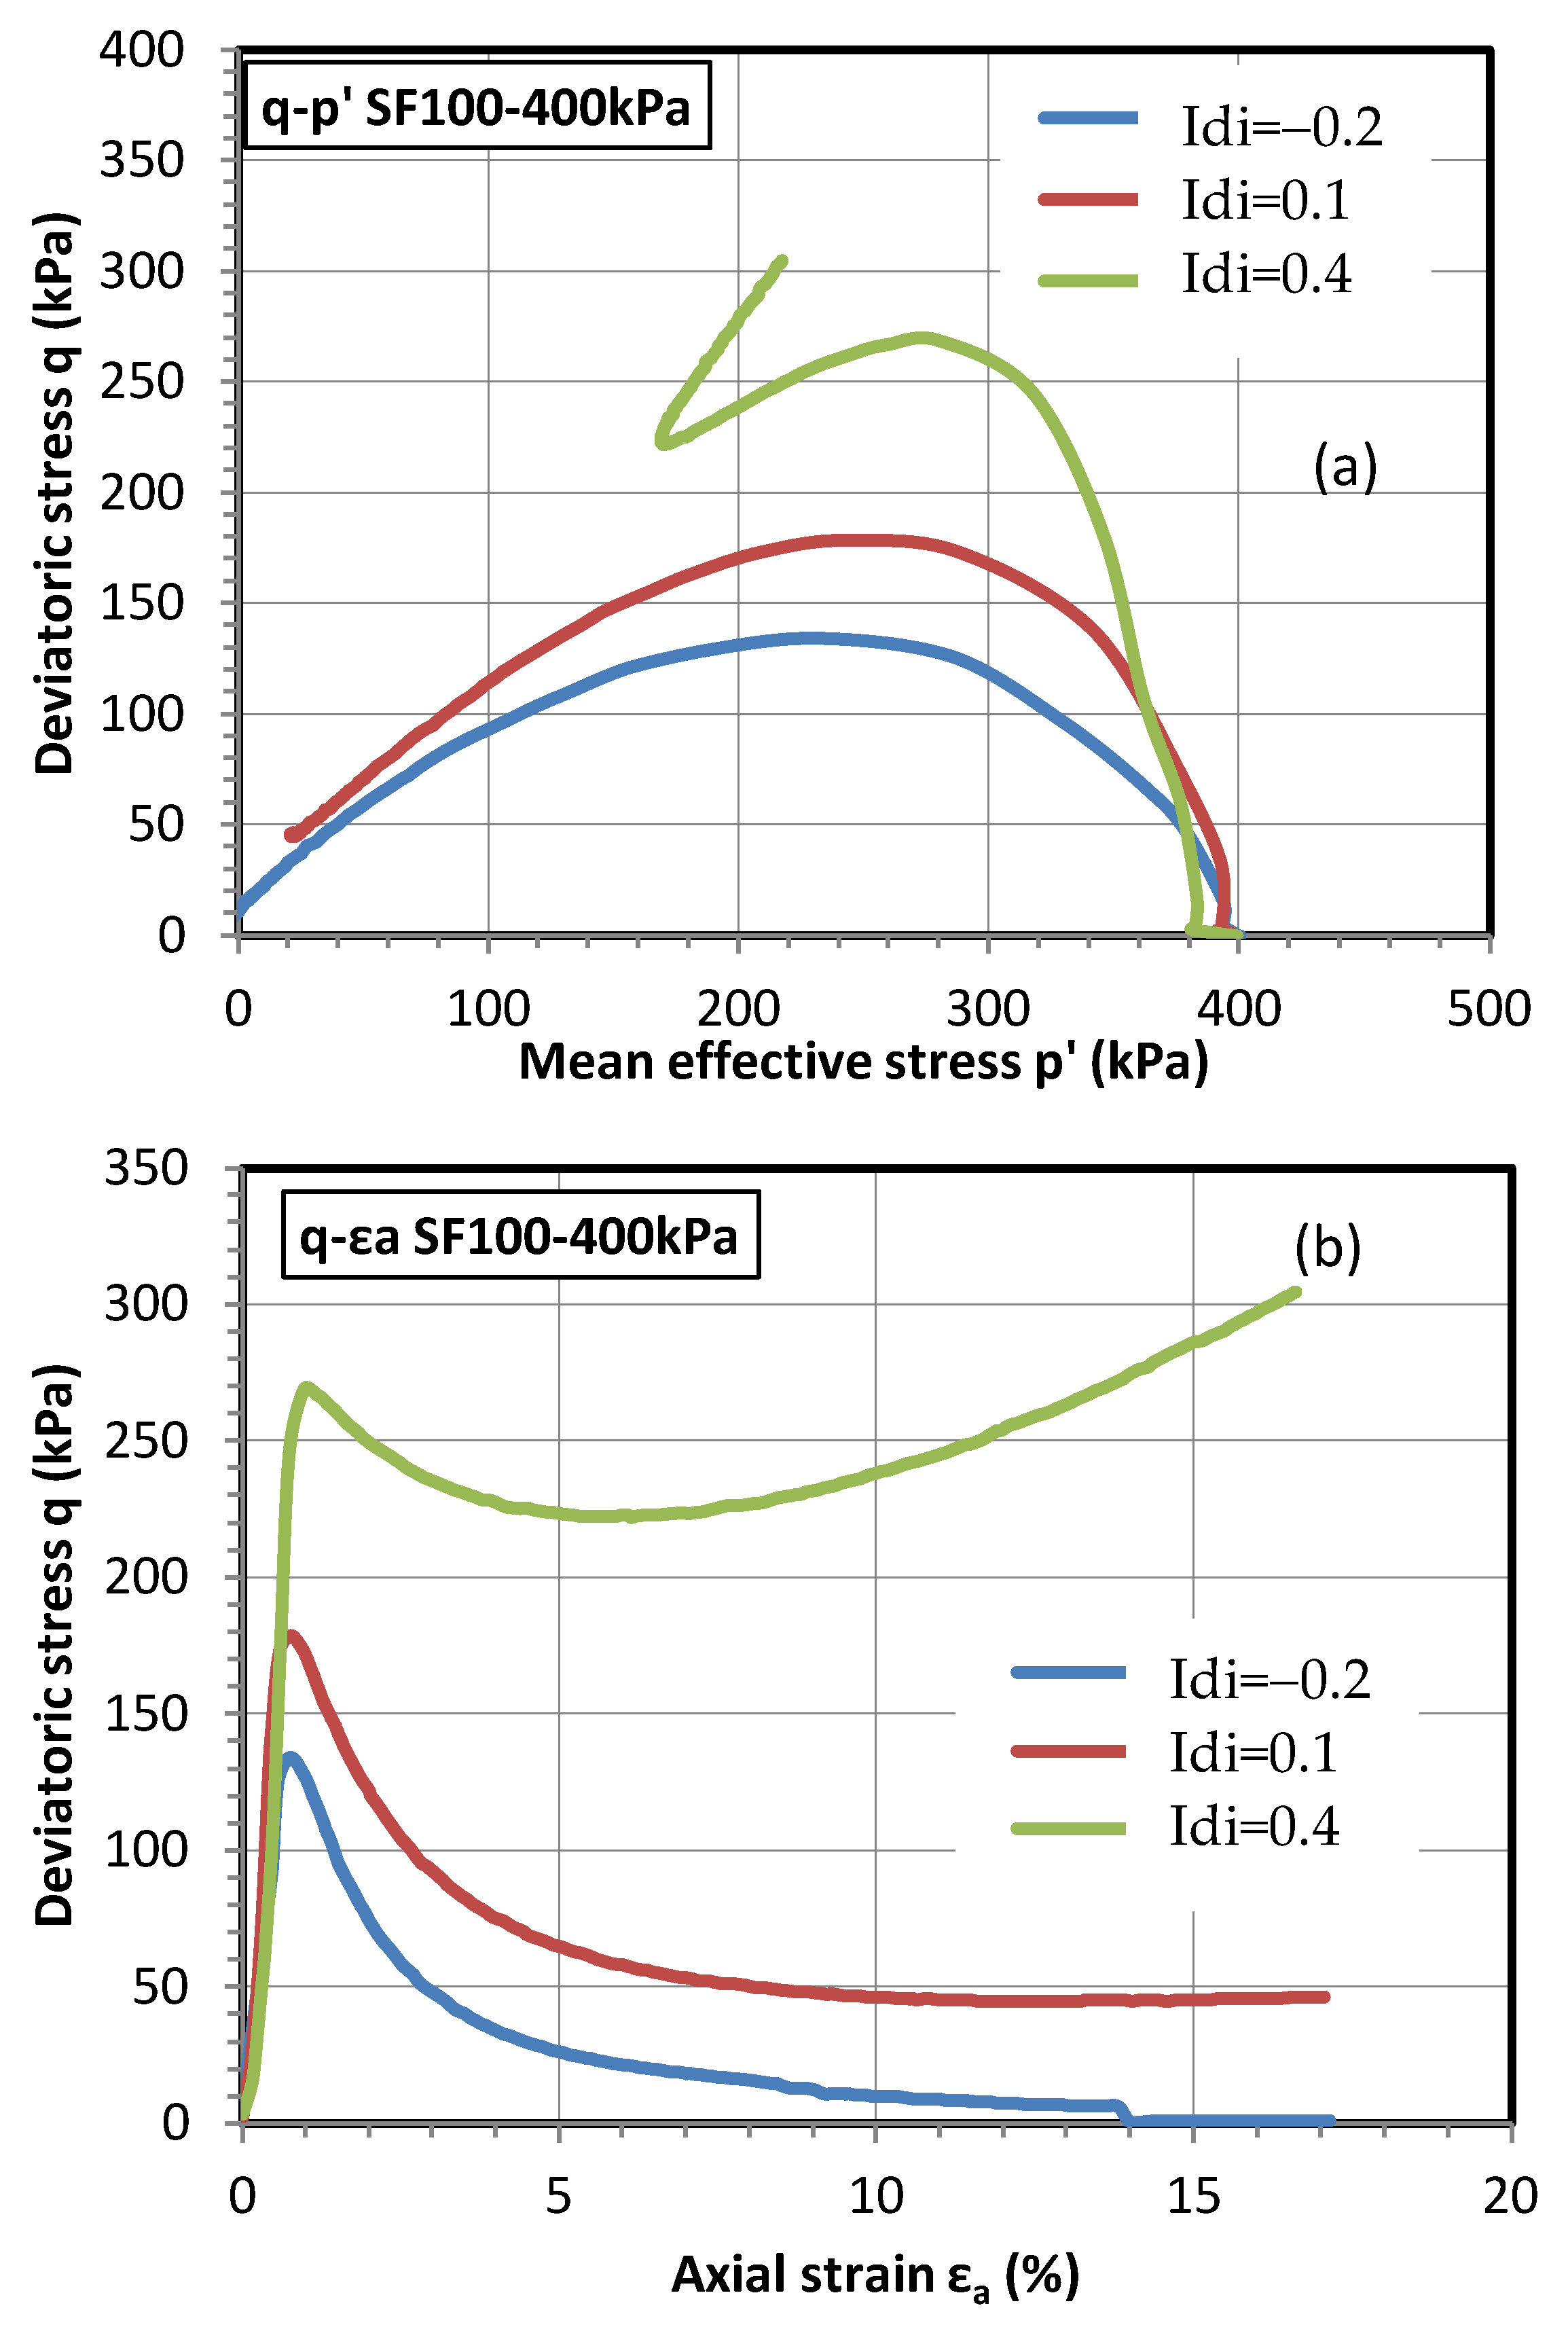
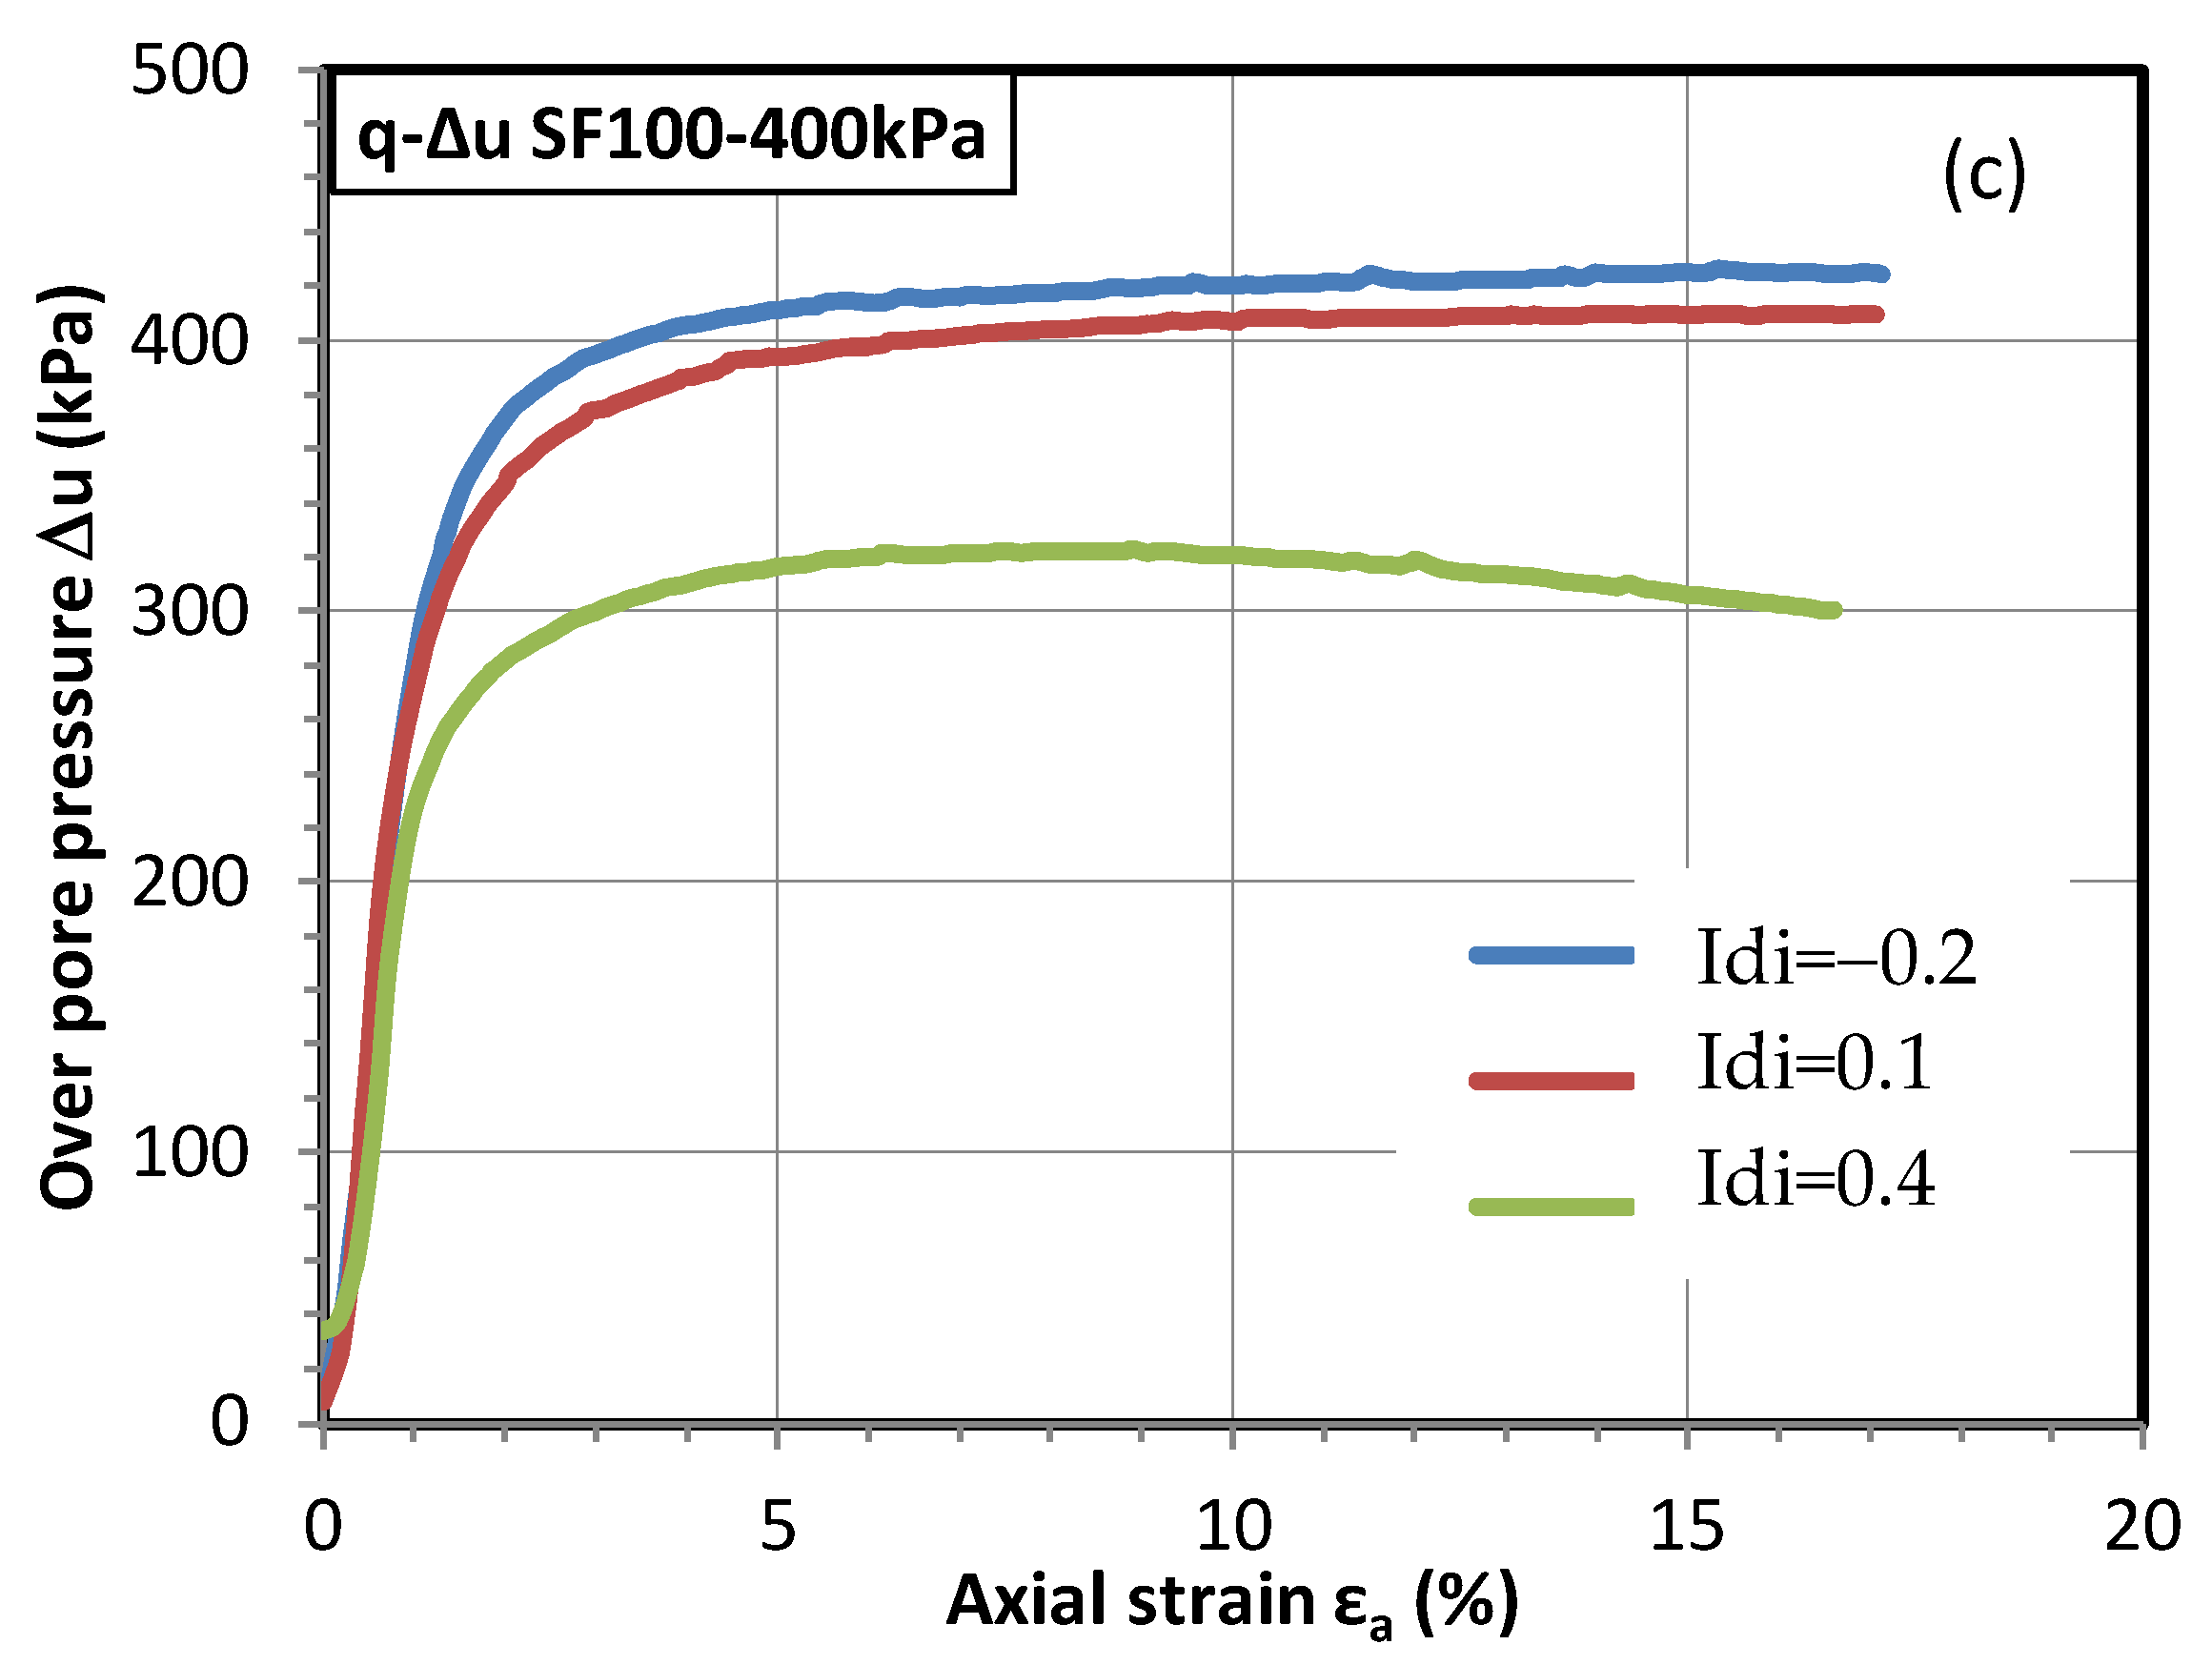
Figure 8.
Effect of initial density index Idi on the undrained behavior of Fontainebleau clean sand under two confining pressures (Pc = 100 and 400 kPa): (a) q-p’ curve; (b) q-εa curve; and (c) Δu-εa curve.
For the test group under Pc = 400 kPa, the effect of the initial density index on the liquefaction behavior of Fontainebleau sand is more pronounced than two other ones (Pc = 50 and 100 kPa). At the same axial strain, an increase in Idi leads to an increase in the deviatoric stress. This means that the sand is more resistant to liquefaction as the density index increases. Highly liquefiable responses are still observed for specimens initially at very loose (a zero residual strength at the end of the test) and loose state, whereas a limited liquefaction behavior is shown for the dense specimen. These results on Fontainebleau clean sand are coherent with those reported in the literature (e.g., [49,52,53,54]).
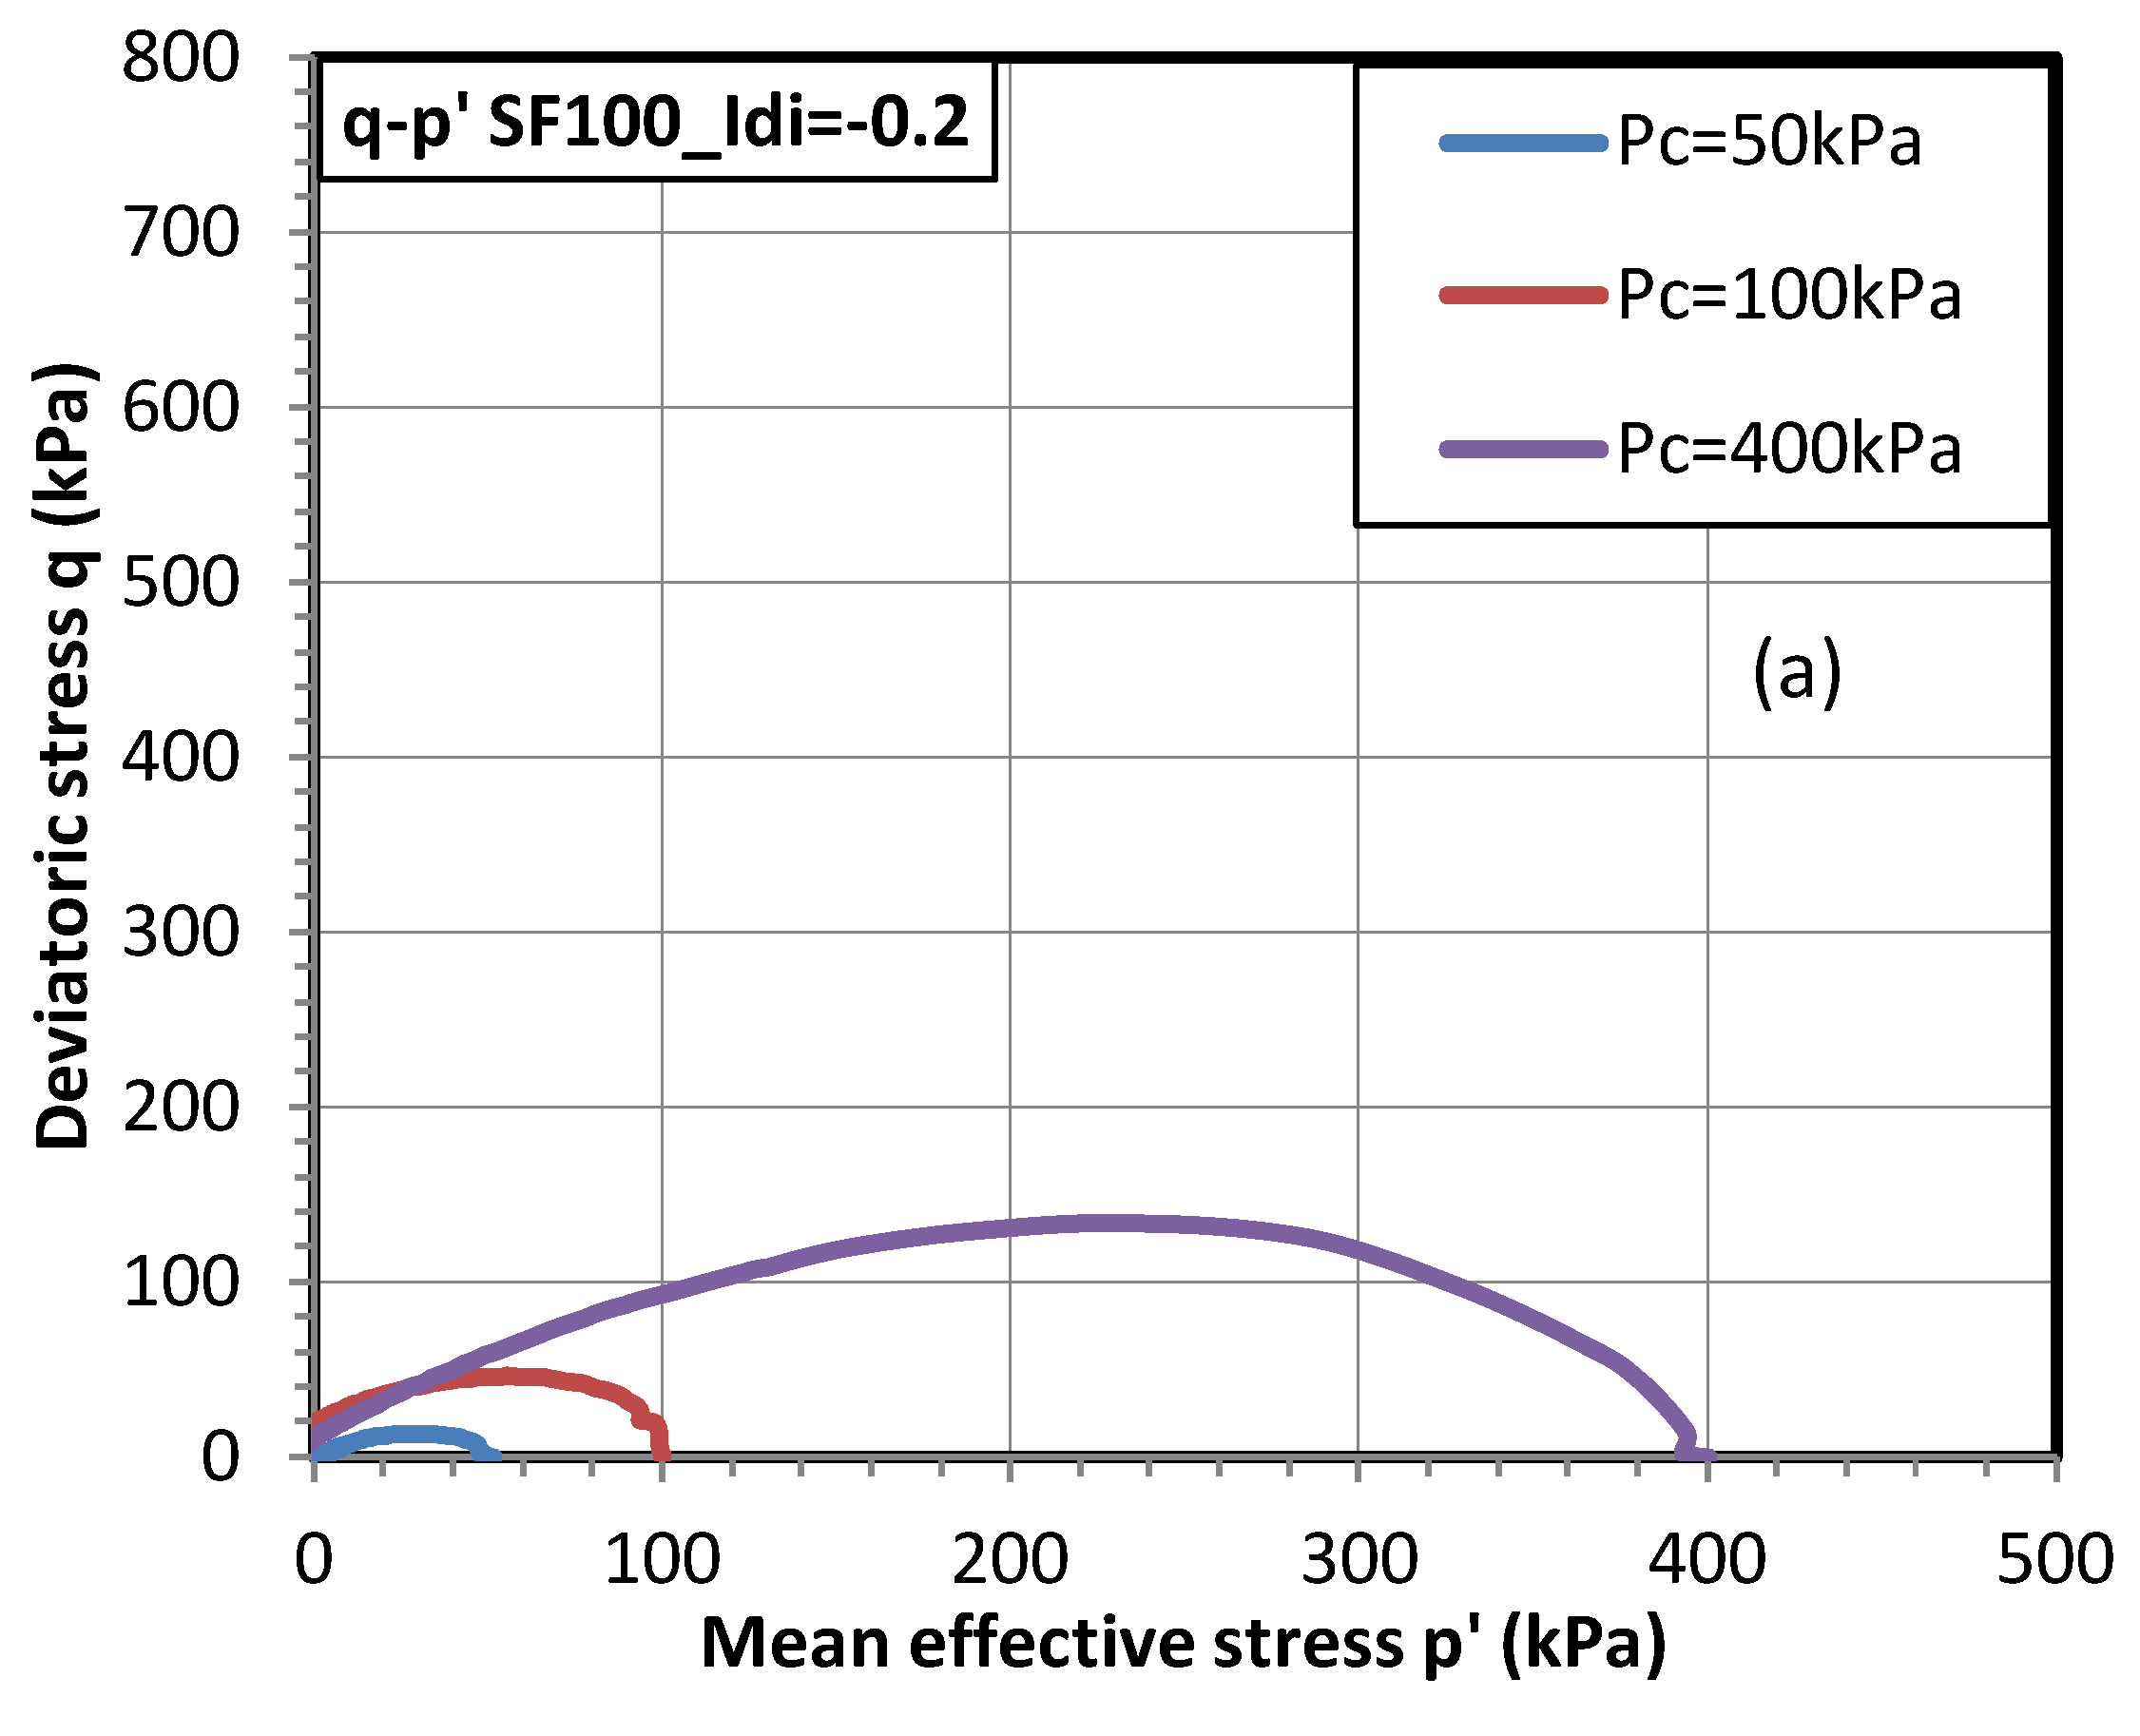
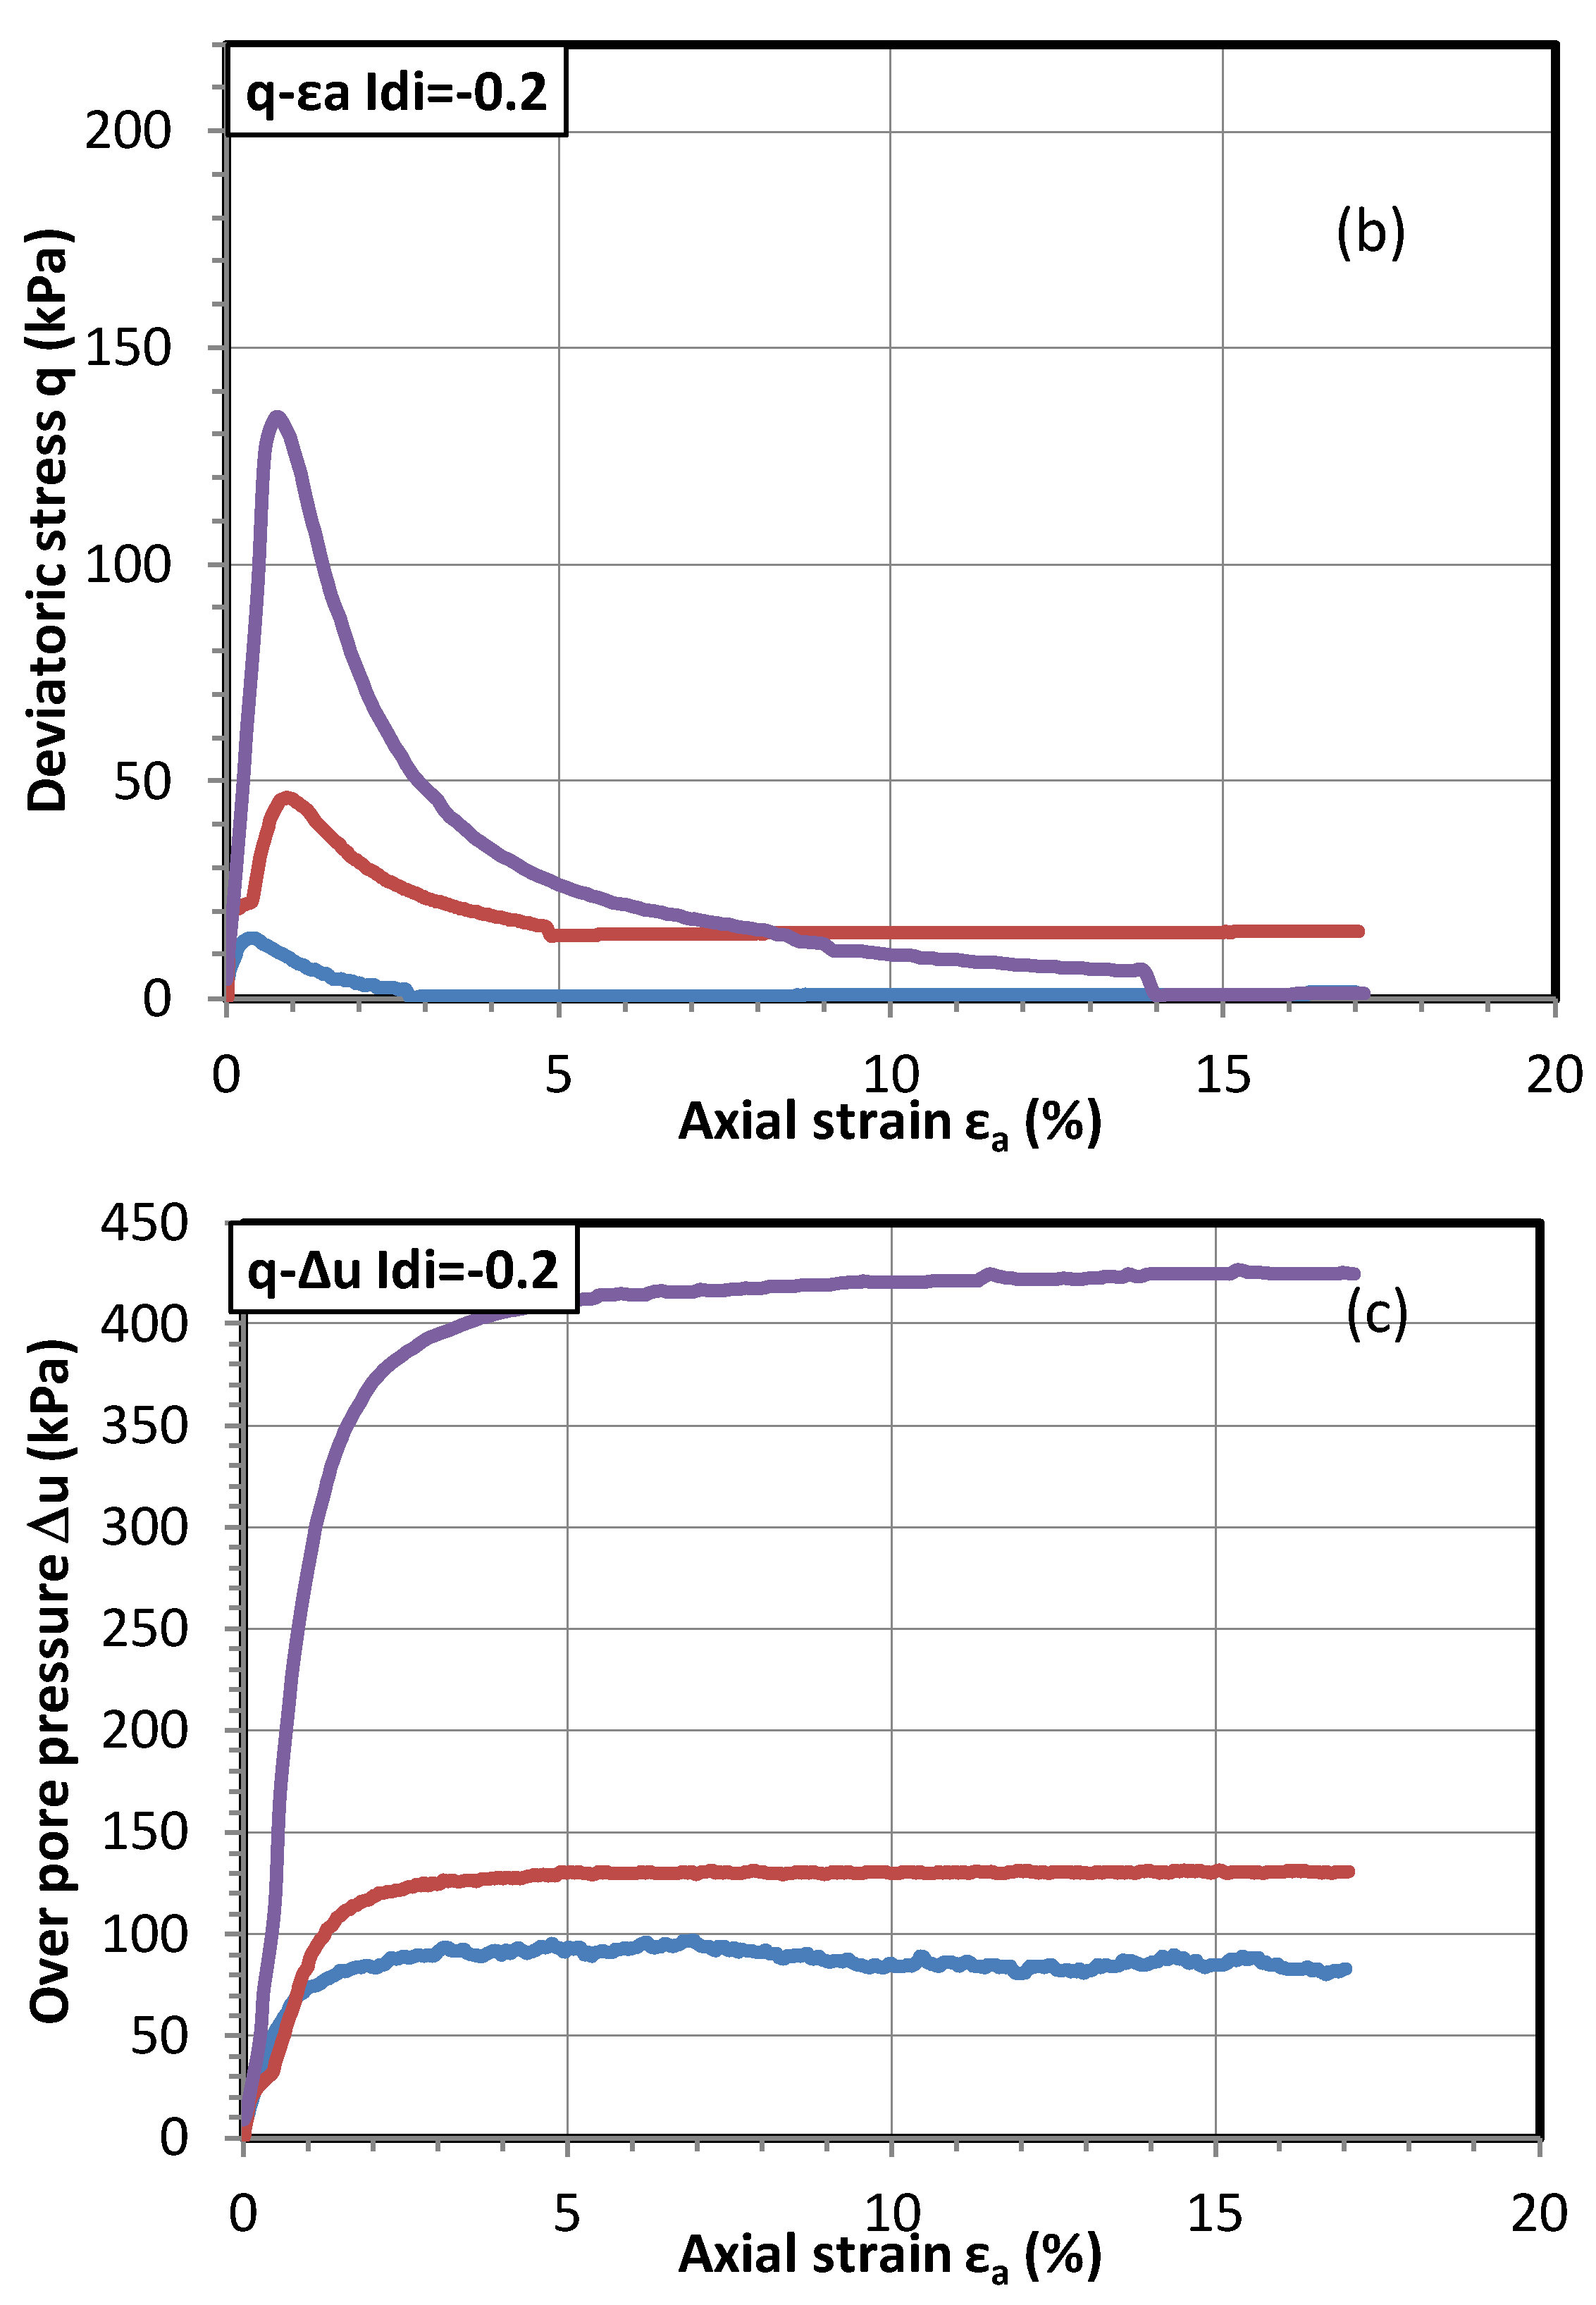
The results in Figure 7 and Figure 8 are re-organized by displaying, in each graph, three curves for triaxial tests on samples with an initial density index under three confining pressure (Pc = 50, 100, and 400 kPa) to show the effect of confining pressure (see Figure 9 and Figure 10). Once again, this representation shows that all the very loose (Idi = −0.2) and loose (Idi = 0.1) samples are liquefied. Contrariwise, the dense samples exhibit dilatant behavior for all considered confining pressure. It is worth noting that Fontainebleau clean sand passes from typical dilatant responses under low confining pressure (Pc = 50 and 100 kPa) to a limited liquefaction response for a higher confining pressure (Pc = 400 kPa). This result is in agreement with the experimental results shown by Benahmed [52].

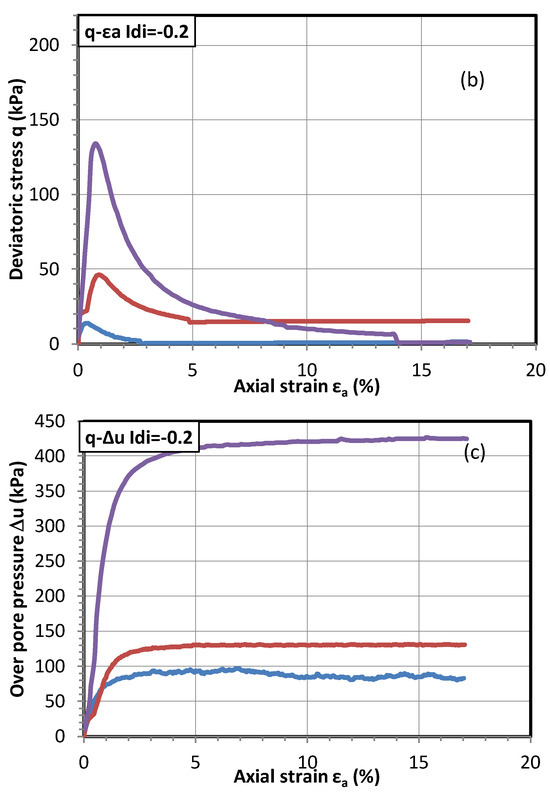
Figure 9.
Effect of confining pressure Pc on the undrained behavior of Fontainebleau clean sand with Idi = −0.2.
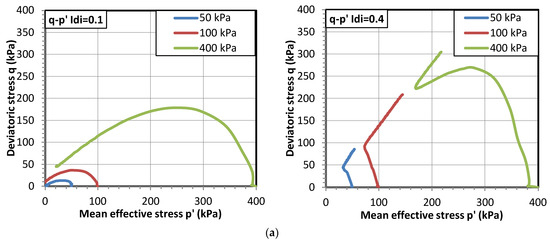
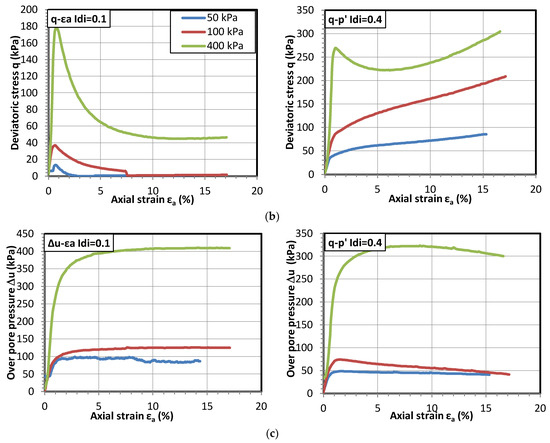
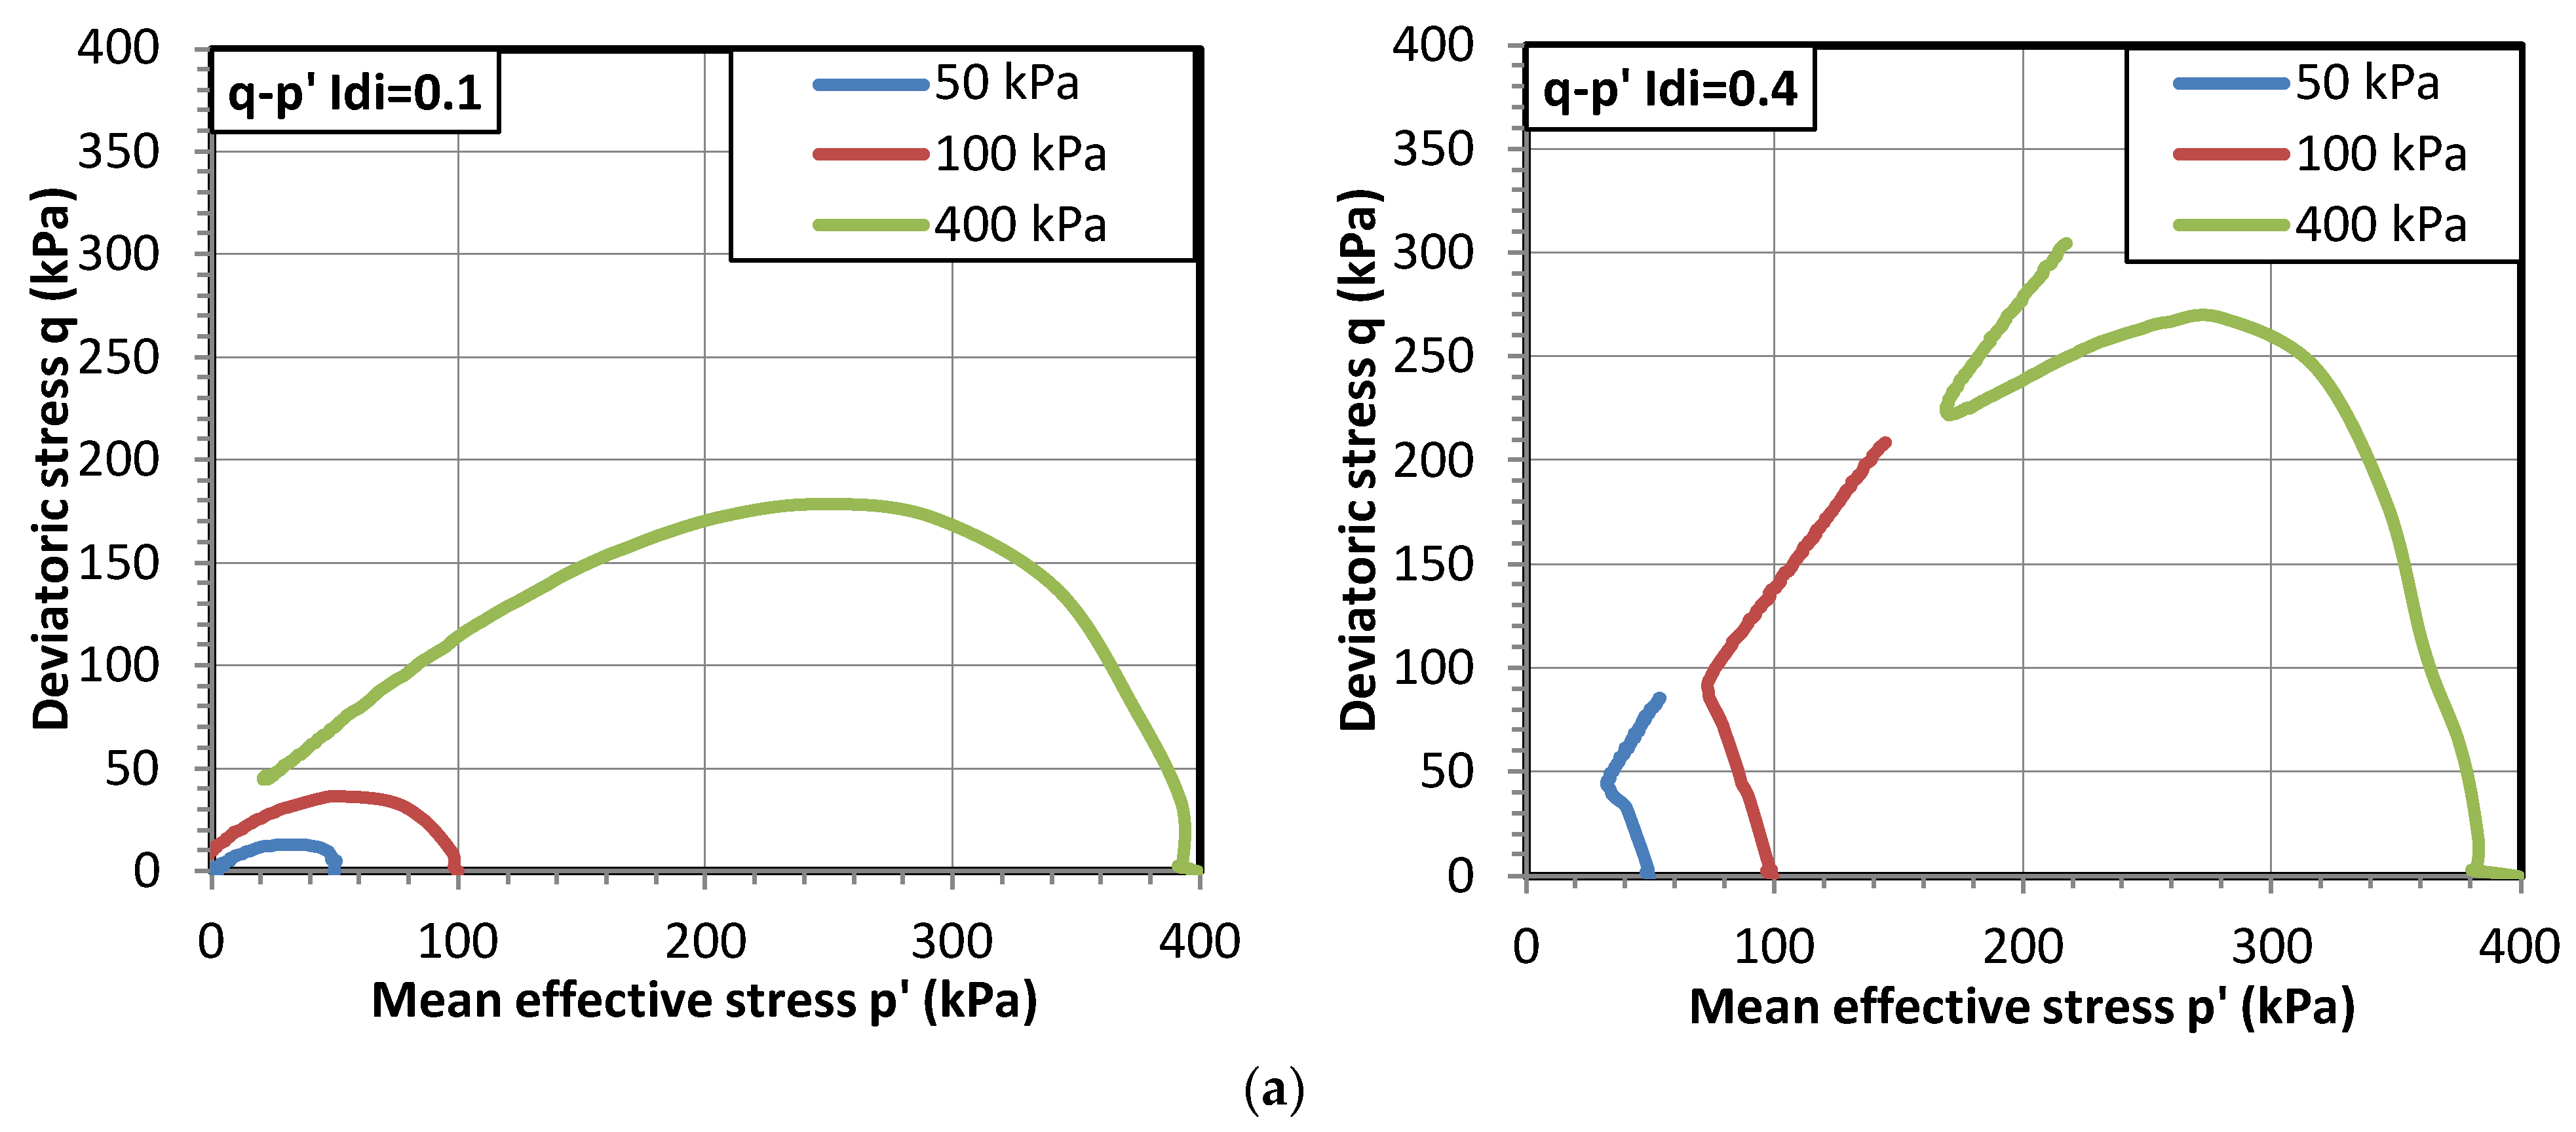
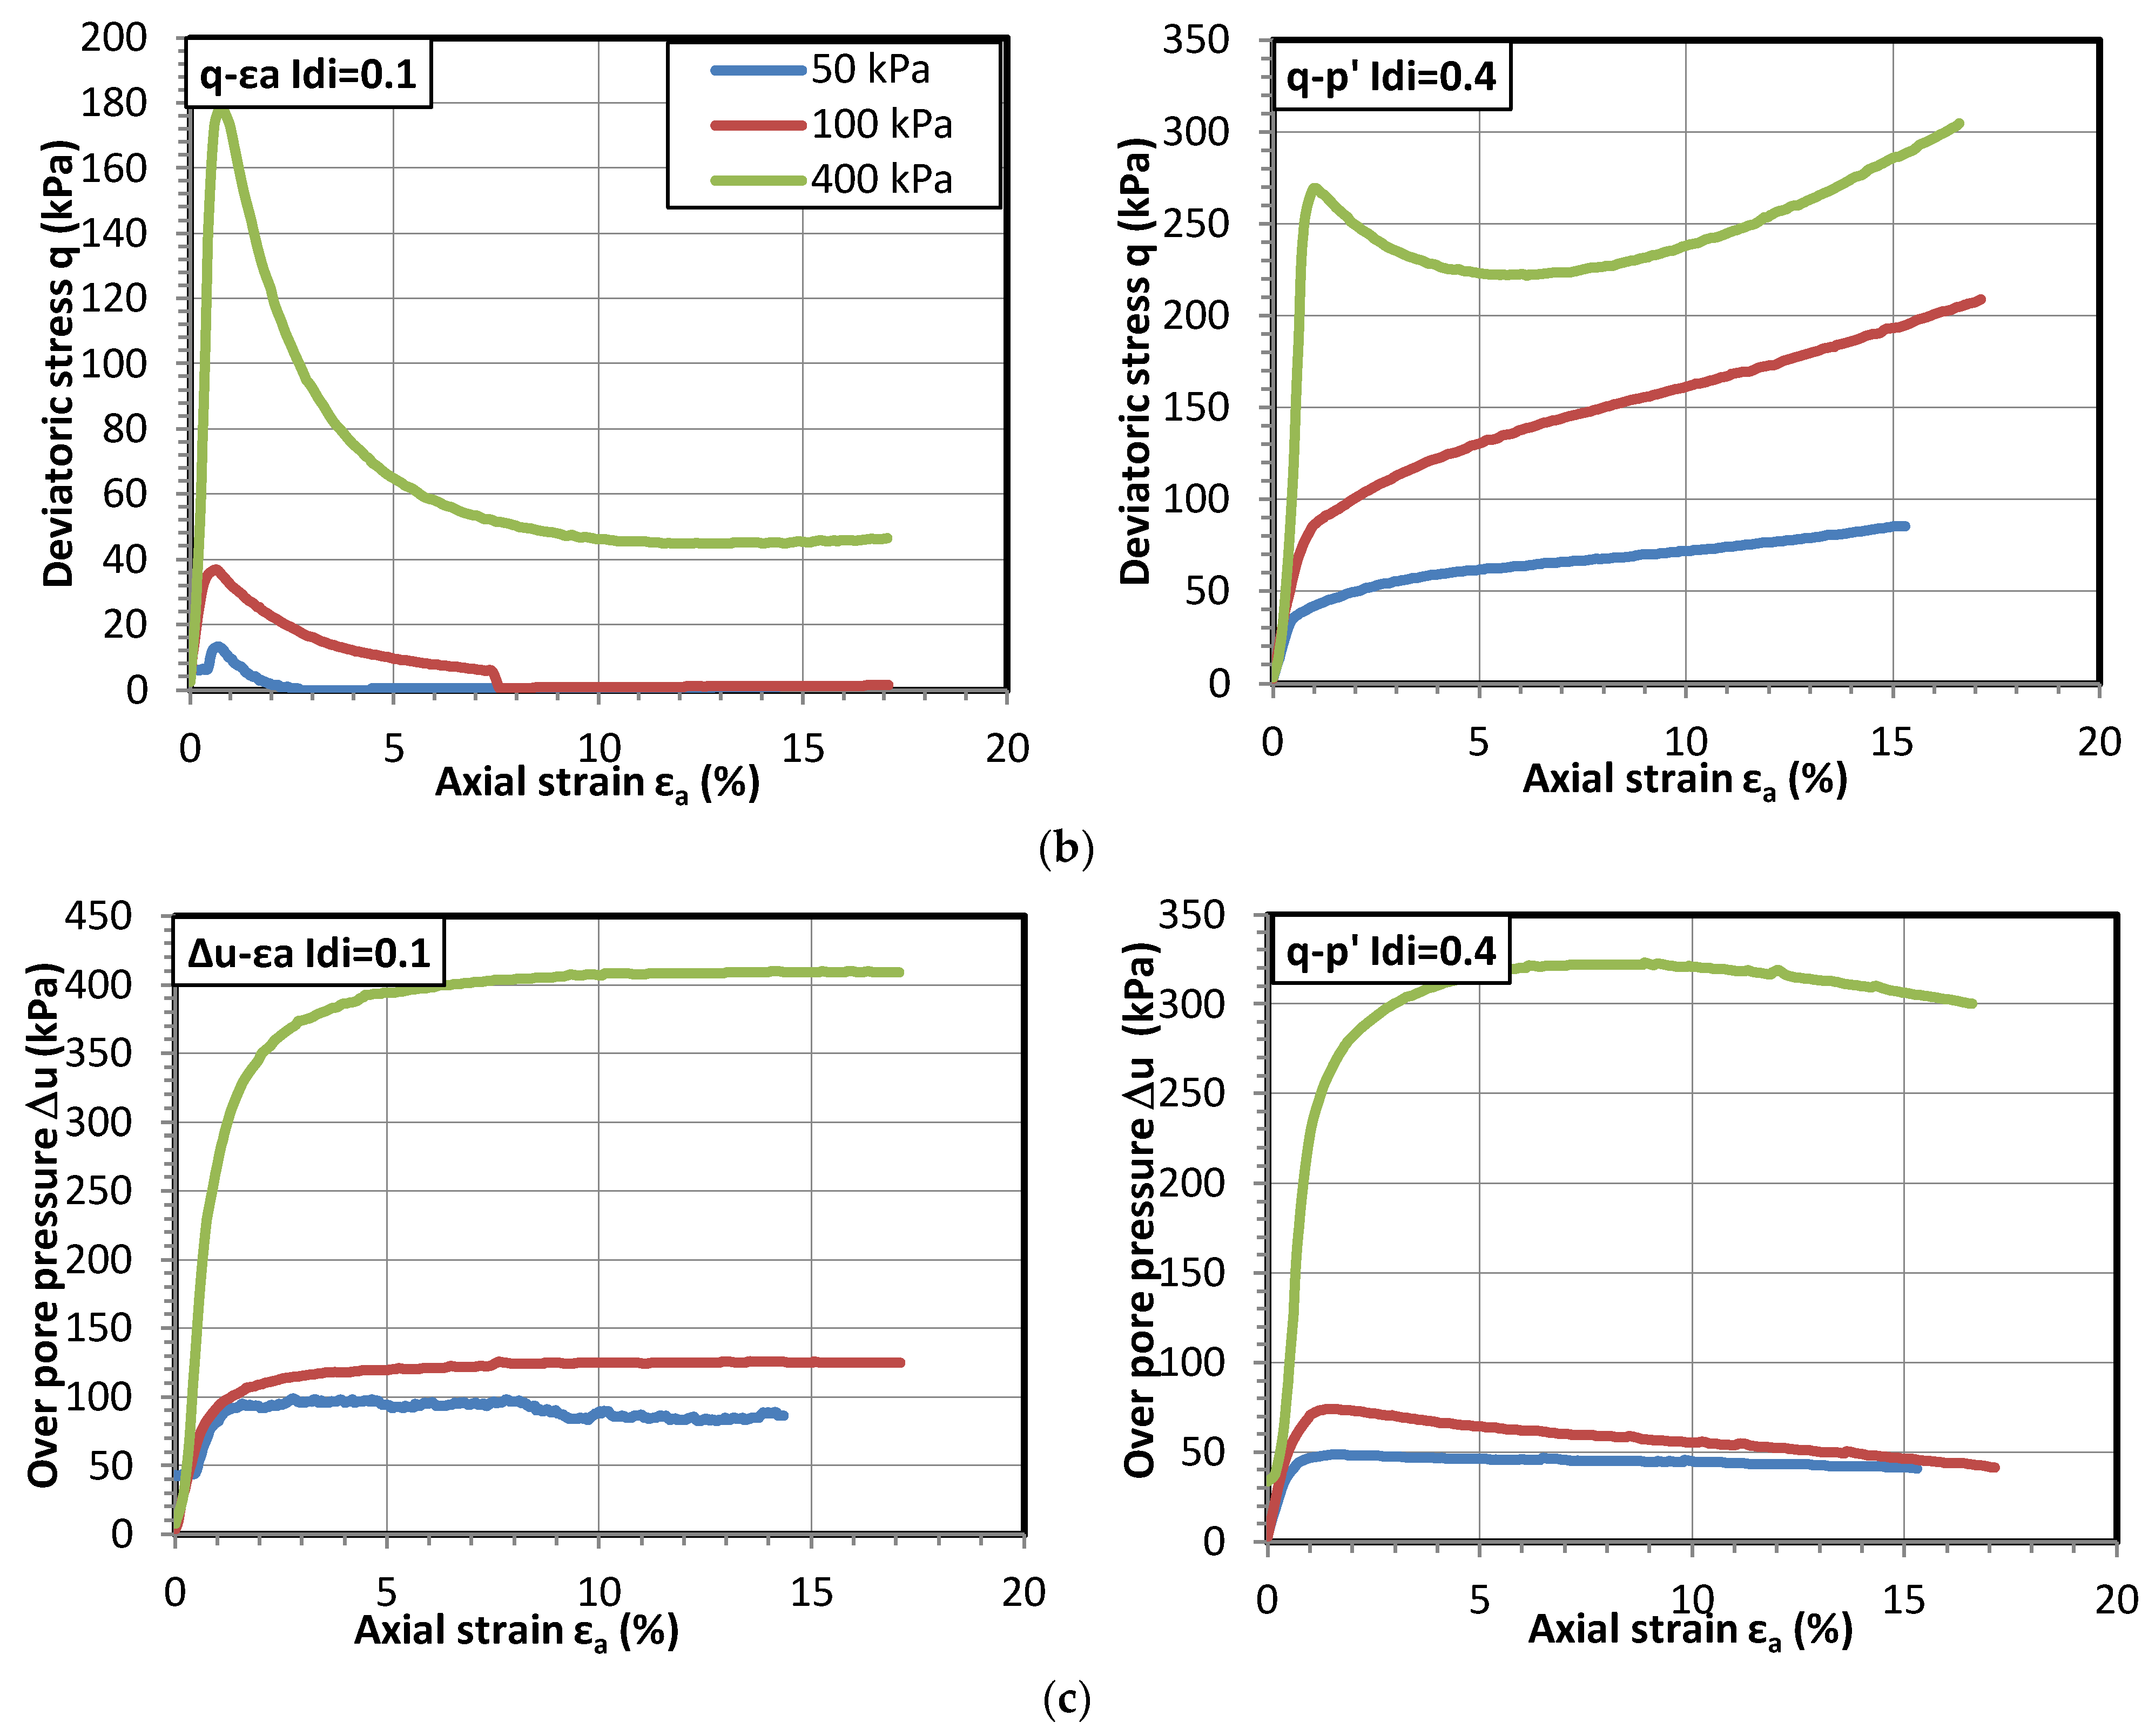
Figure 10.
Effect of confining pressure Pc on the undrained behavior of Fontainebleau clean sand with Idi = 0.1 and 0.4.
3.2. Effect of Fine Content on Static Liquefaction Responses for Mixtures with Very Loose State
As reported in the literature, soils containing more than 15% fine content seem not to be liquefiable. Therefore, mixtures with a fine content of up to 25% were considered in this study to cover this behavior change. The mixtures were prepared in the loosest possible state for each fine content since loose sand is more liquifiable. Samples at Idi = 0 can be prepared for mixtures with a fine content lower than 15%. However, the loosest state that can be reconstituted is equal to Idi = 0.2 for mixtures with a fine content above 20%. All the specimens were consolidated to Pc = 100 kPa before shearing.
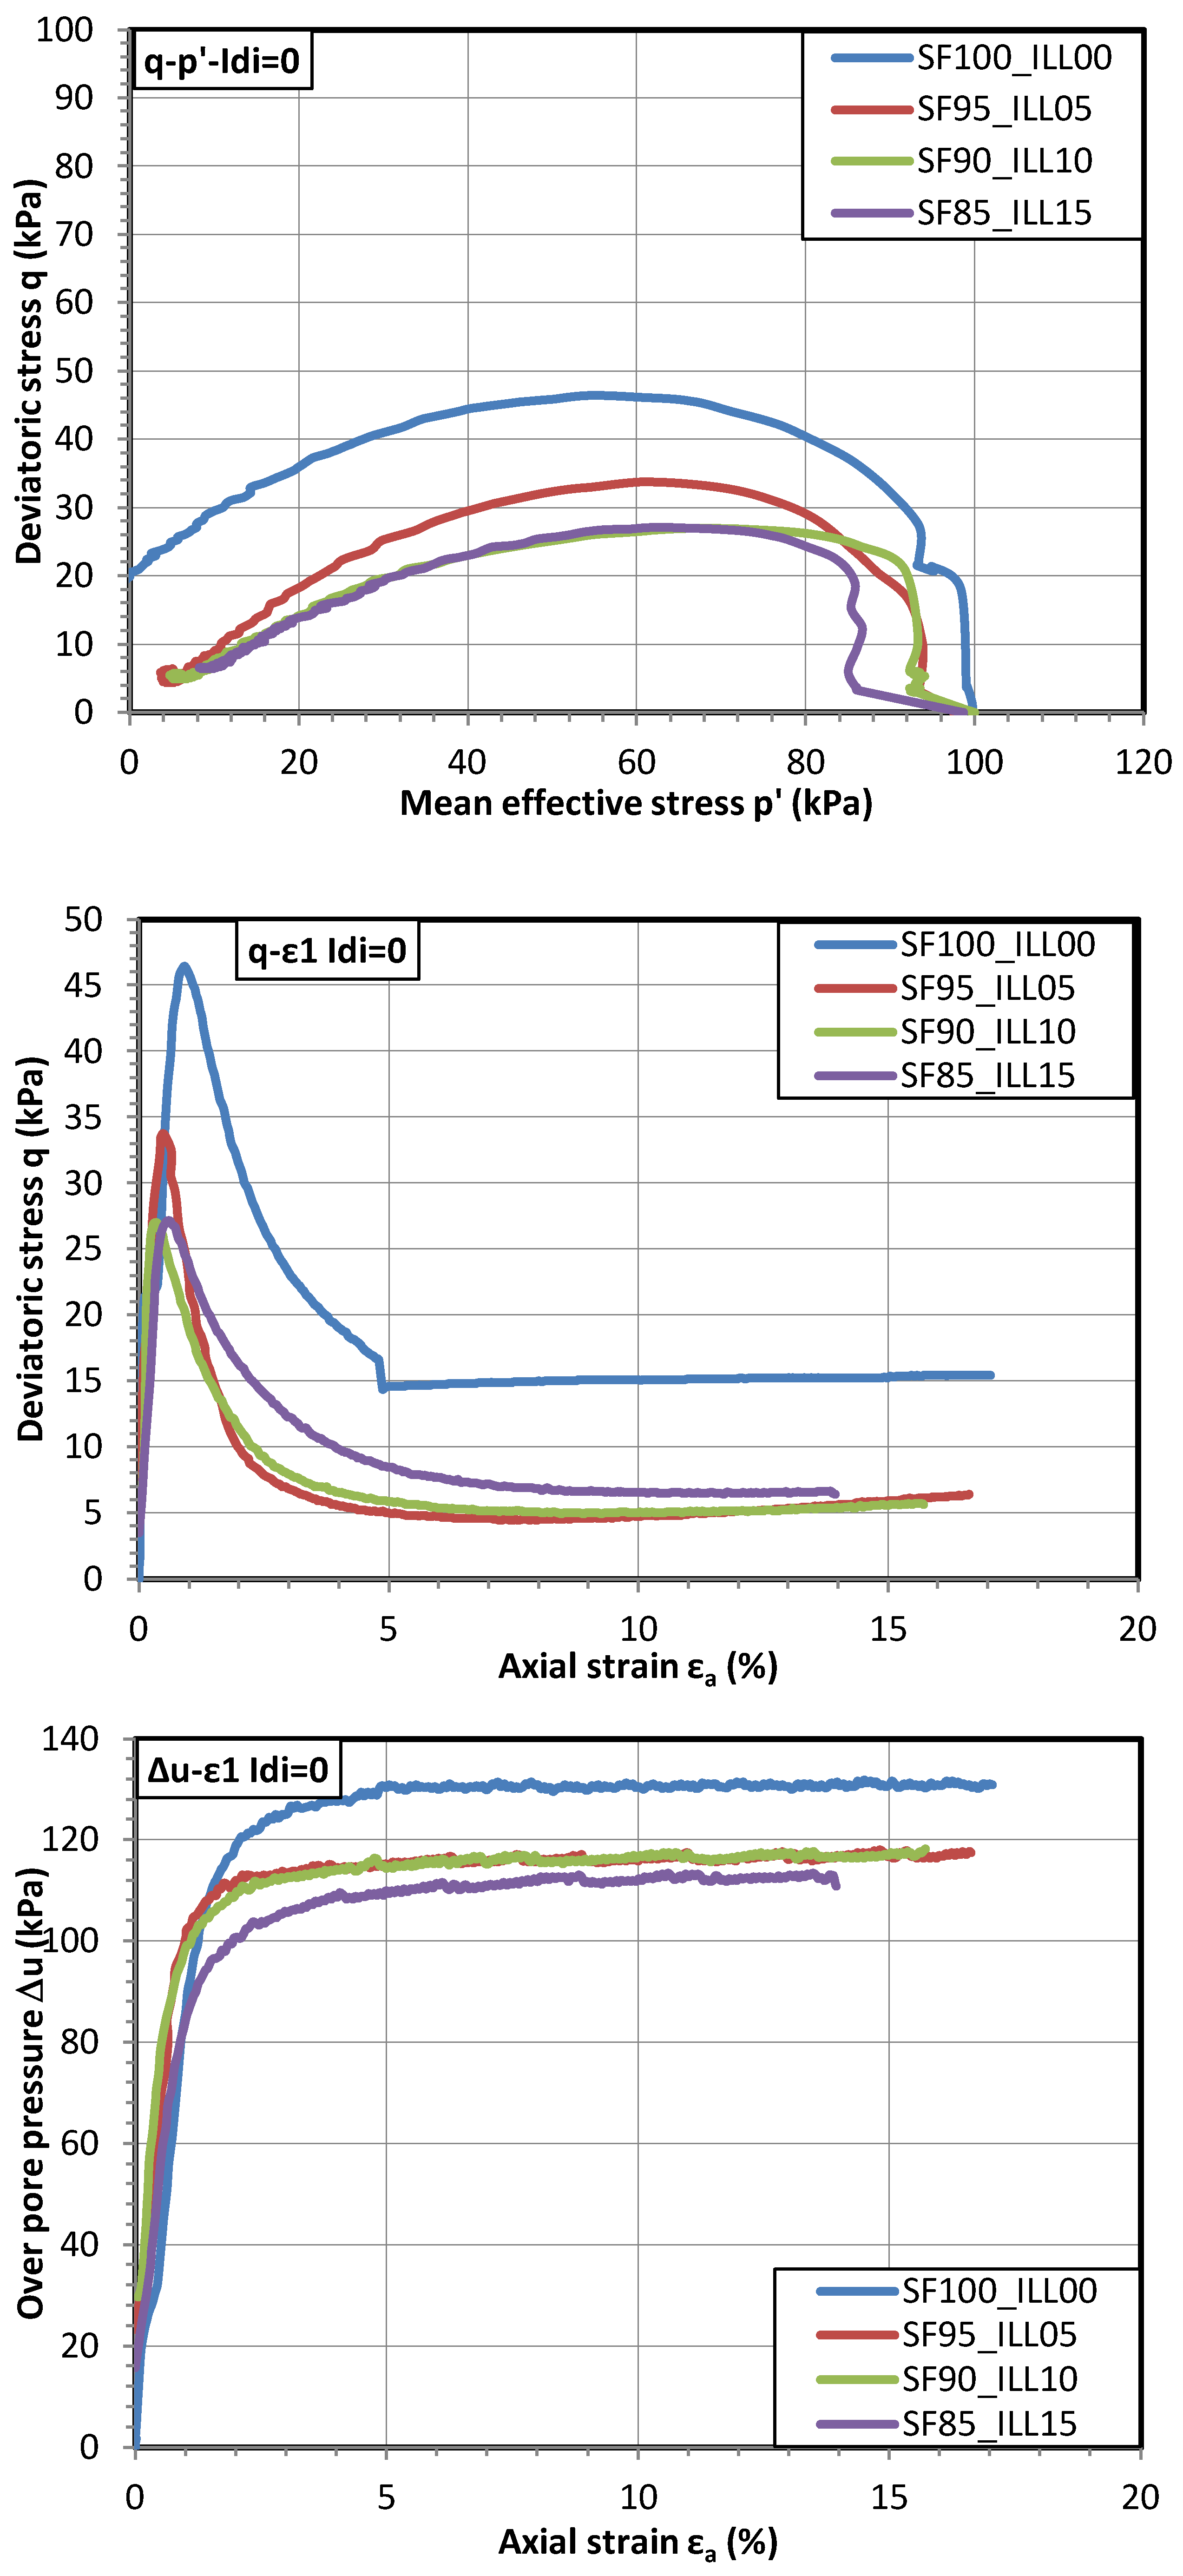
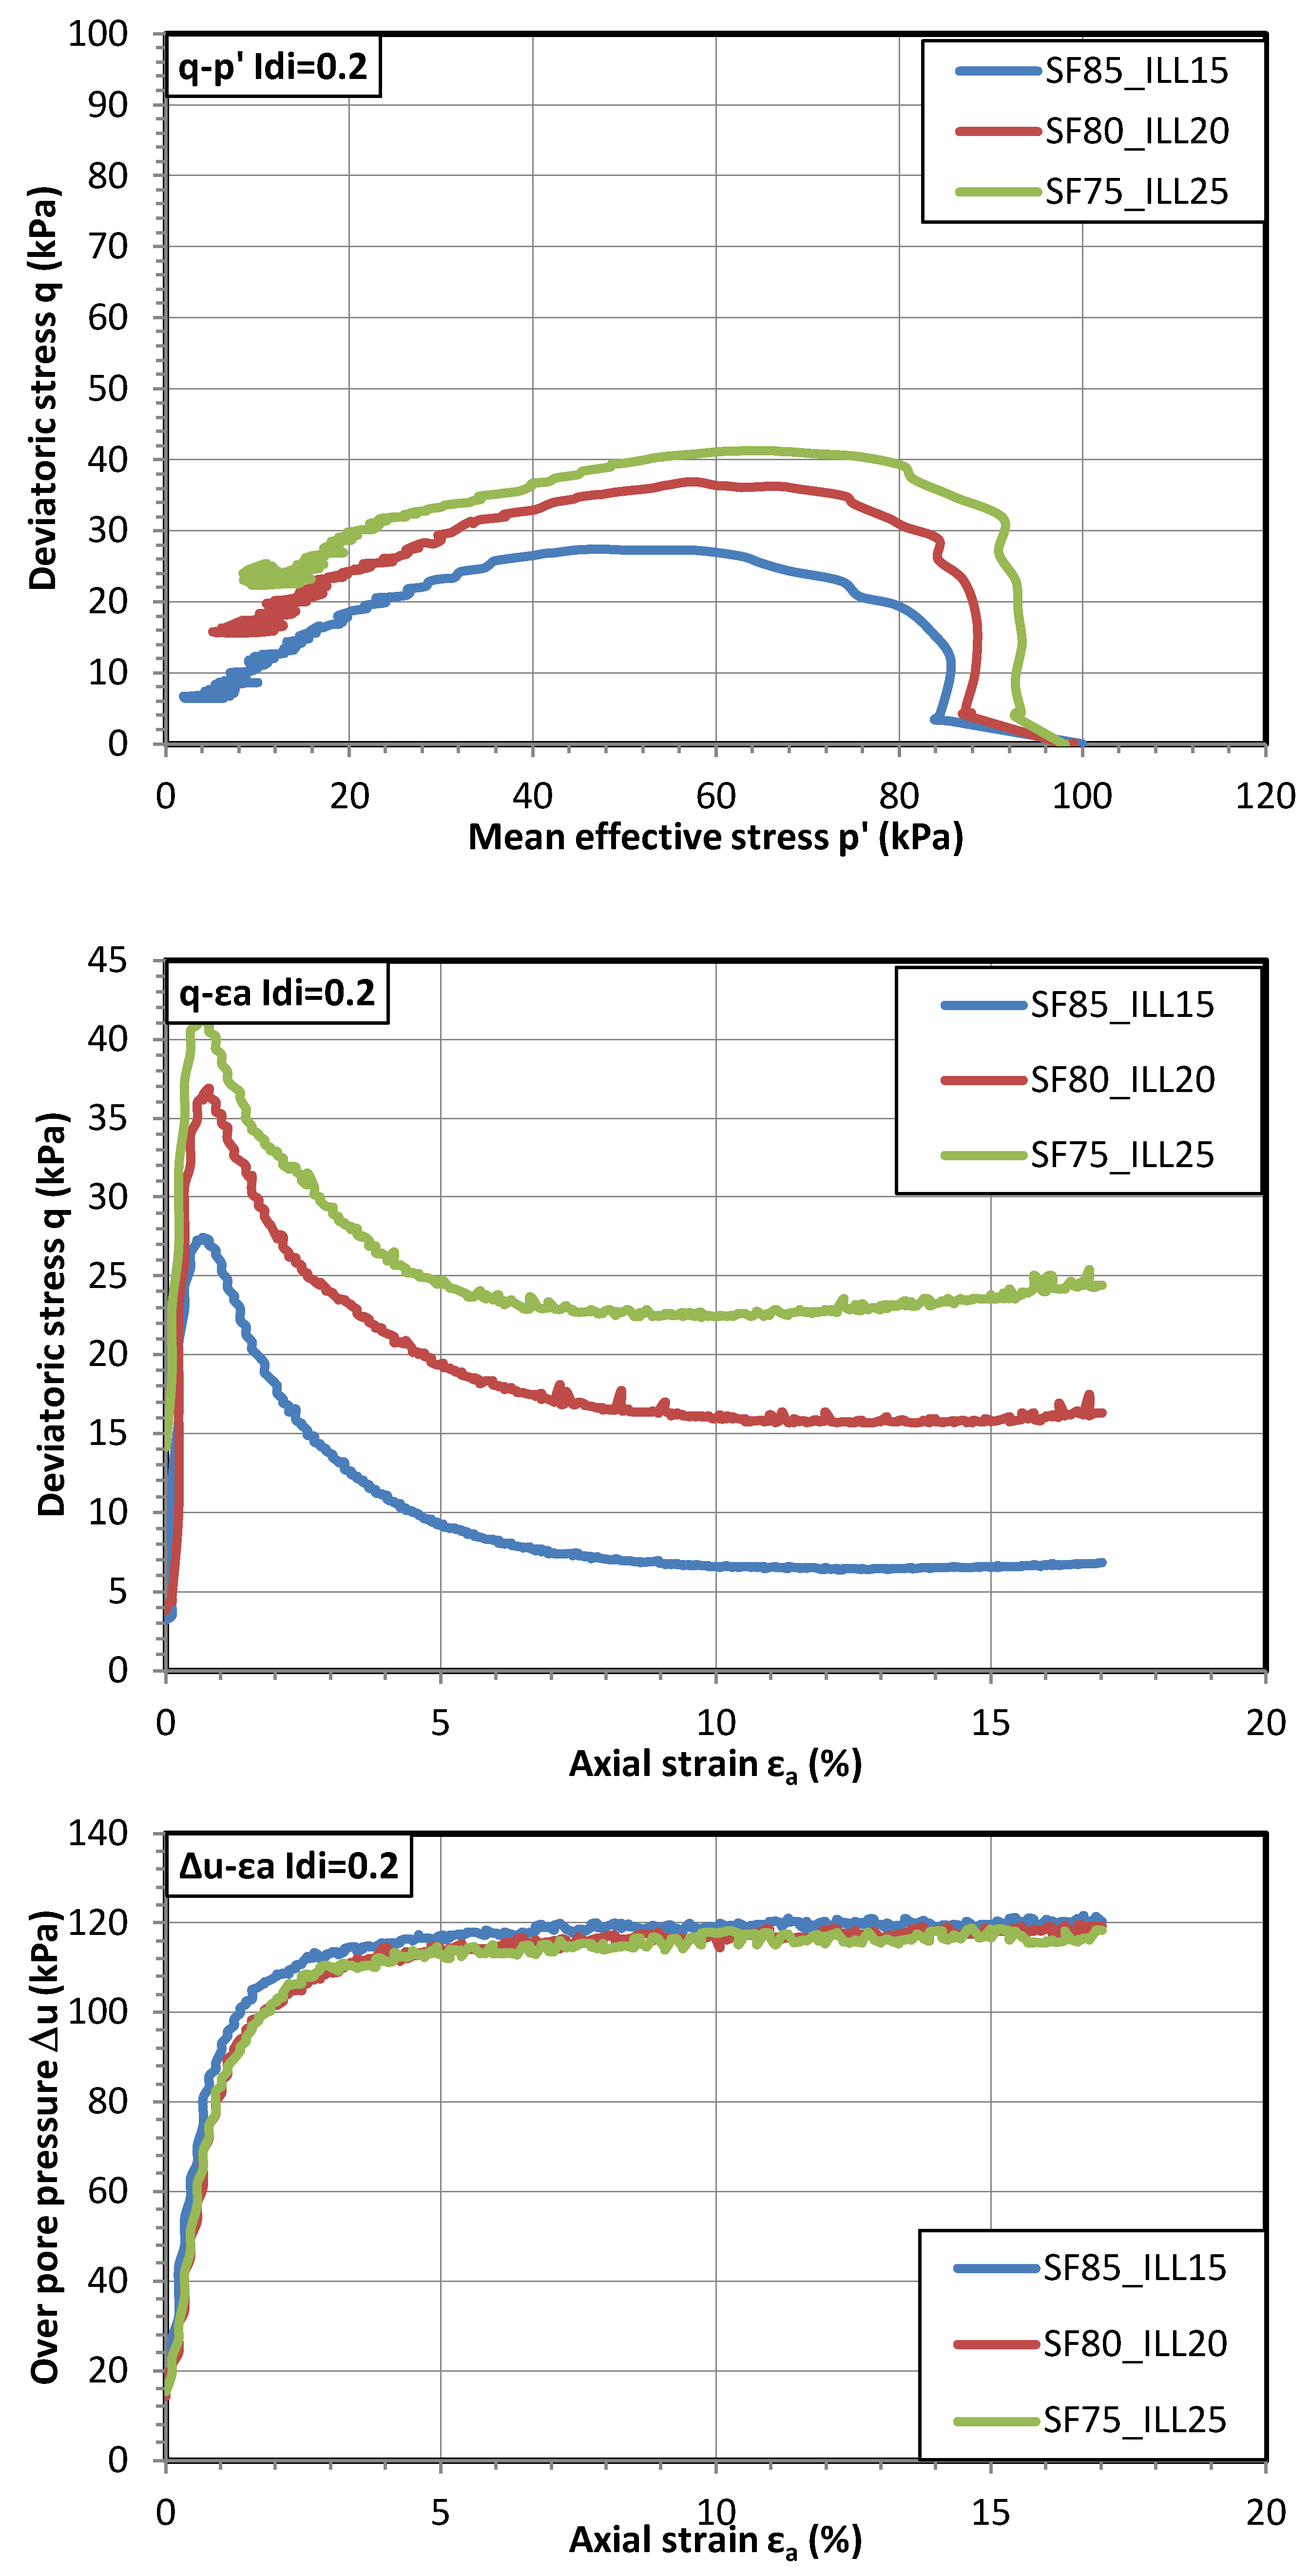
Figure 11 shows the undrained responses of samples with Idi = 0 and a fine content of up to 15%. It is observed that all specimens are liquefied. Indeed, all the curves q-εa exhibit a sharp peak followed by an abrupt and highly rapid drop in deviatoric stress. The fine content shows a significant impact on the liquefaction resistance. An increase in fine content from 0 to 10% leads to a decrease in peak deviatoric stress of the mixtures, while the loading path q-p’ and the curve q-e1 of two mixtures with 10% and 15% are almost coincident. Figure 12 plots results for samples with Idi = 0.2 and three fine contents (15%, 20%, and 25%). A reverse trend is observed in comparison with results shown in Figure 11. Indeed, an increase in fine content leads to an increase in peak and ultimate deviatoric stresses. However, all the sample are always liquefied. Further tests should be carried out on samples with Idi = 0.2 and fine content from 0 to 15% to confirm the tendency evidenced in this section, using the Fontainebleau clean sand and plastic Illite Arvel mixtures.
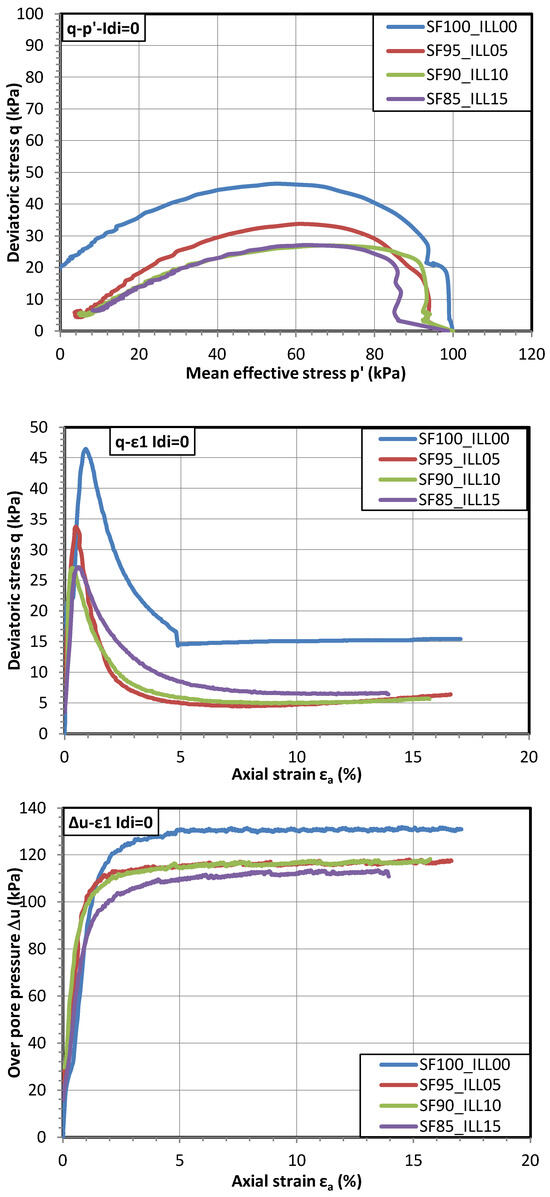
Figure 11.
Undrained responses of samples with Idi = 0 and fine content of up to 15%.
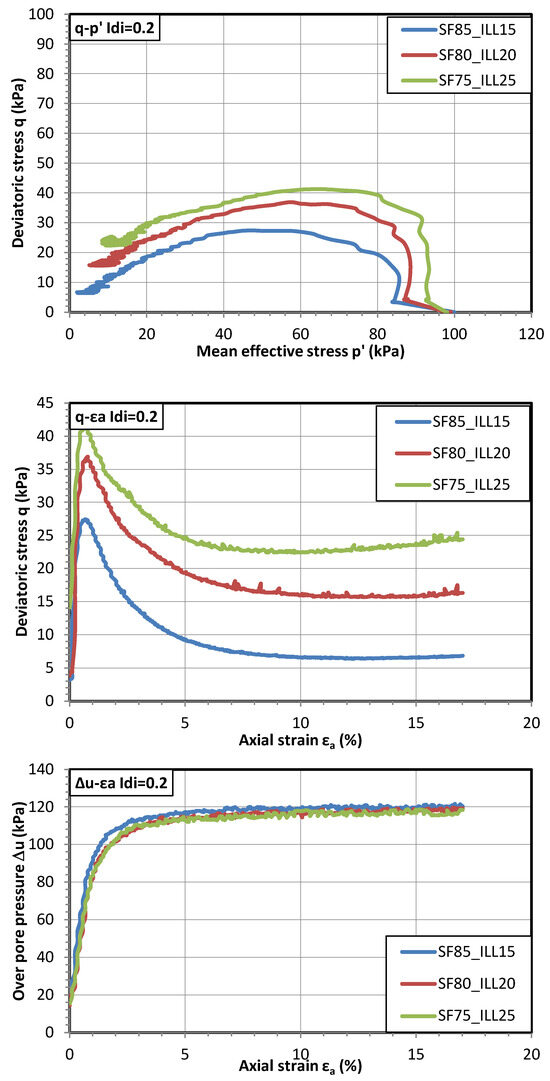
Figure 12.
Undrained responses of samples with Idi = 0.2 and fine content from 15% to 25%.
3.3. Effect of Initial Density Index (Idi)
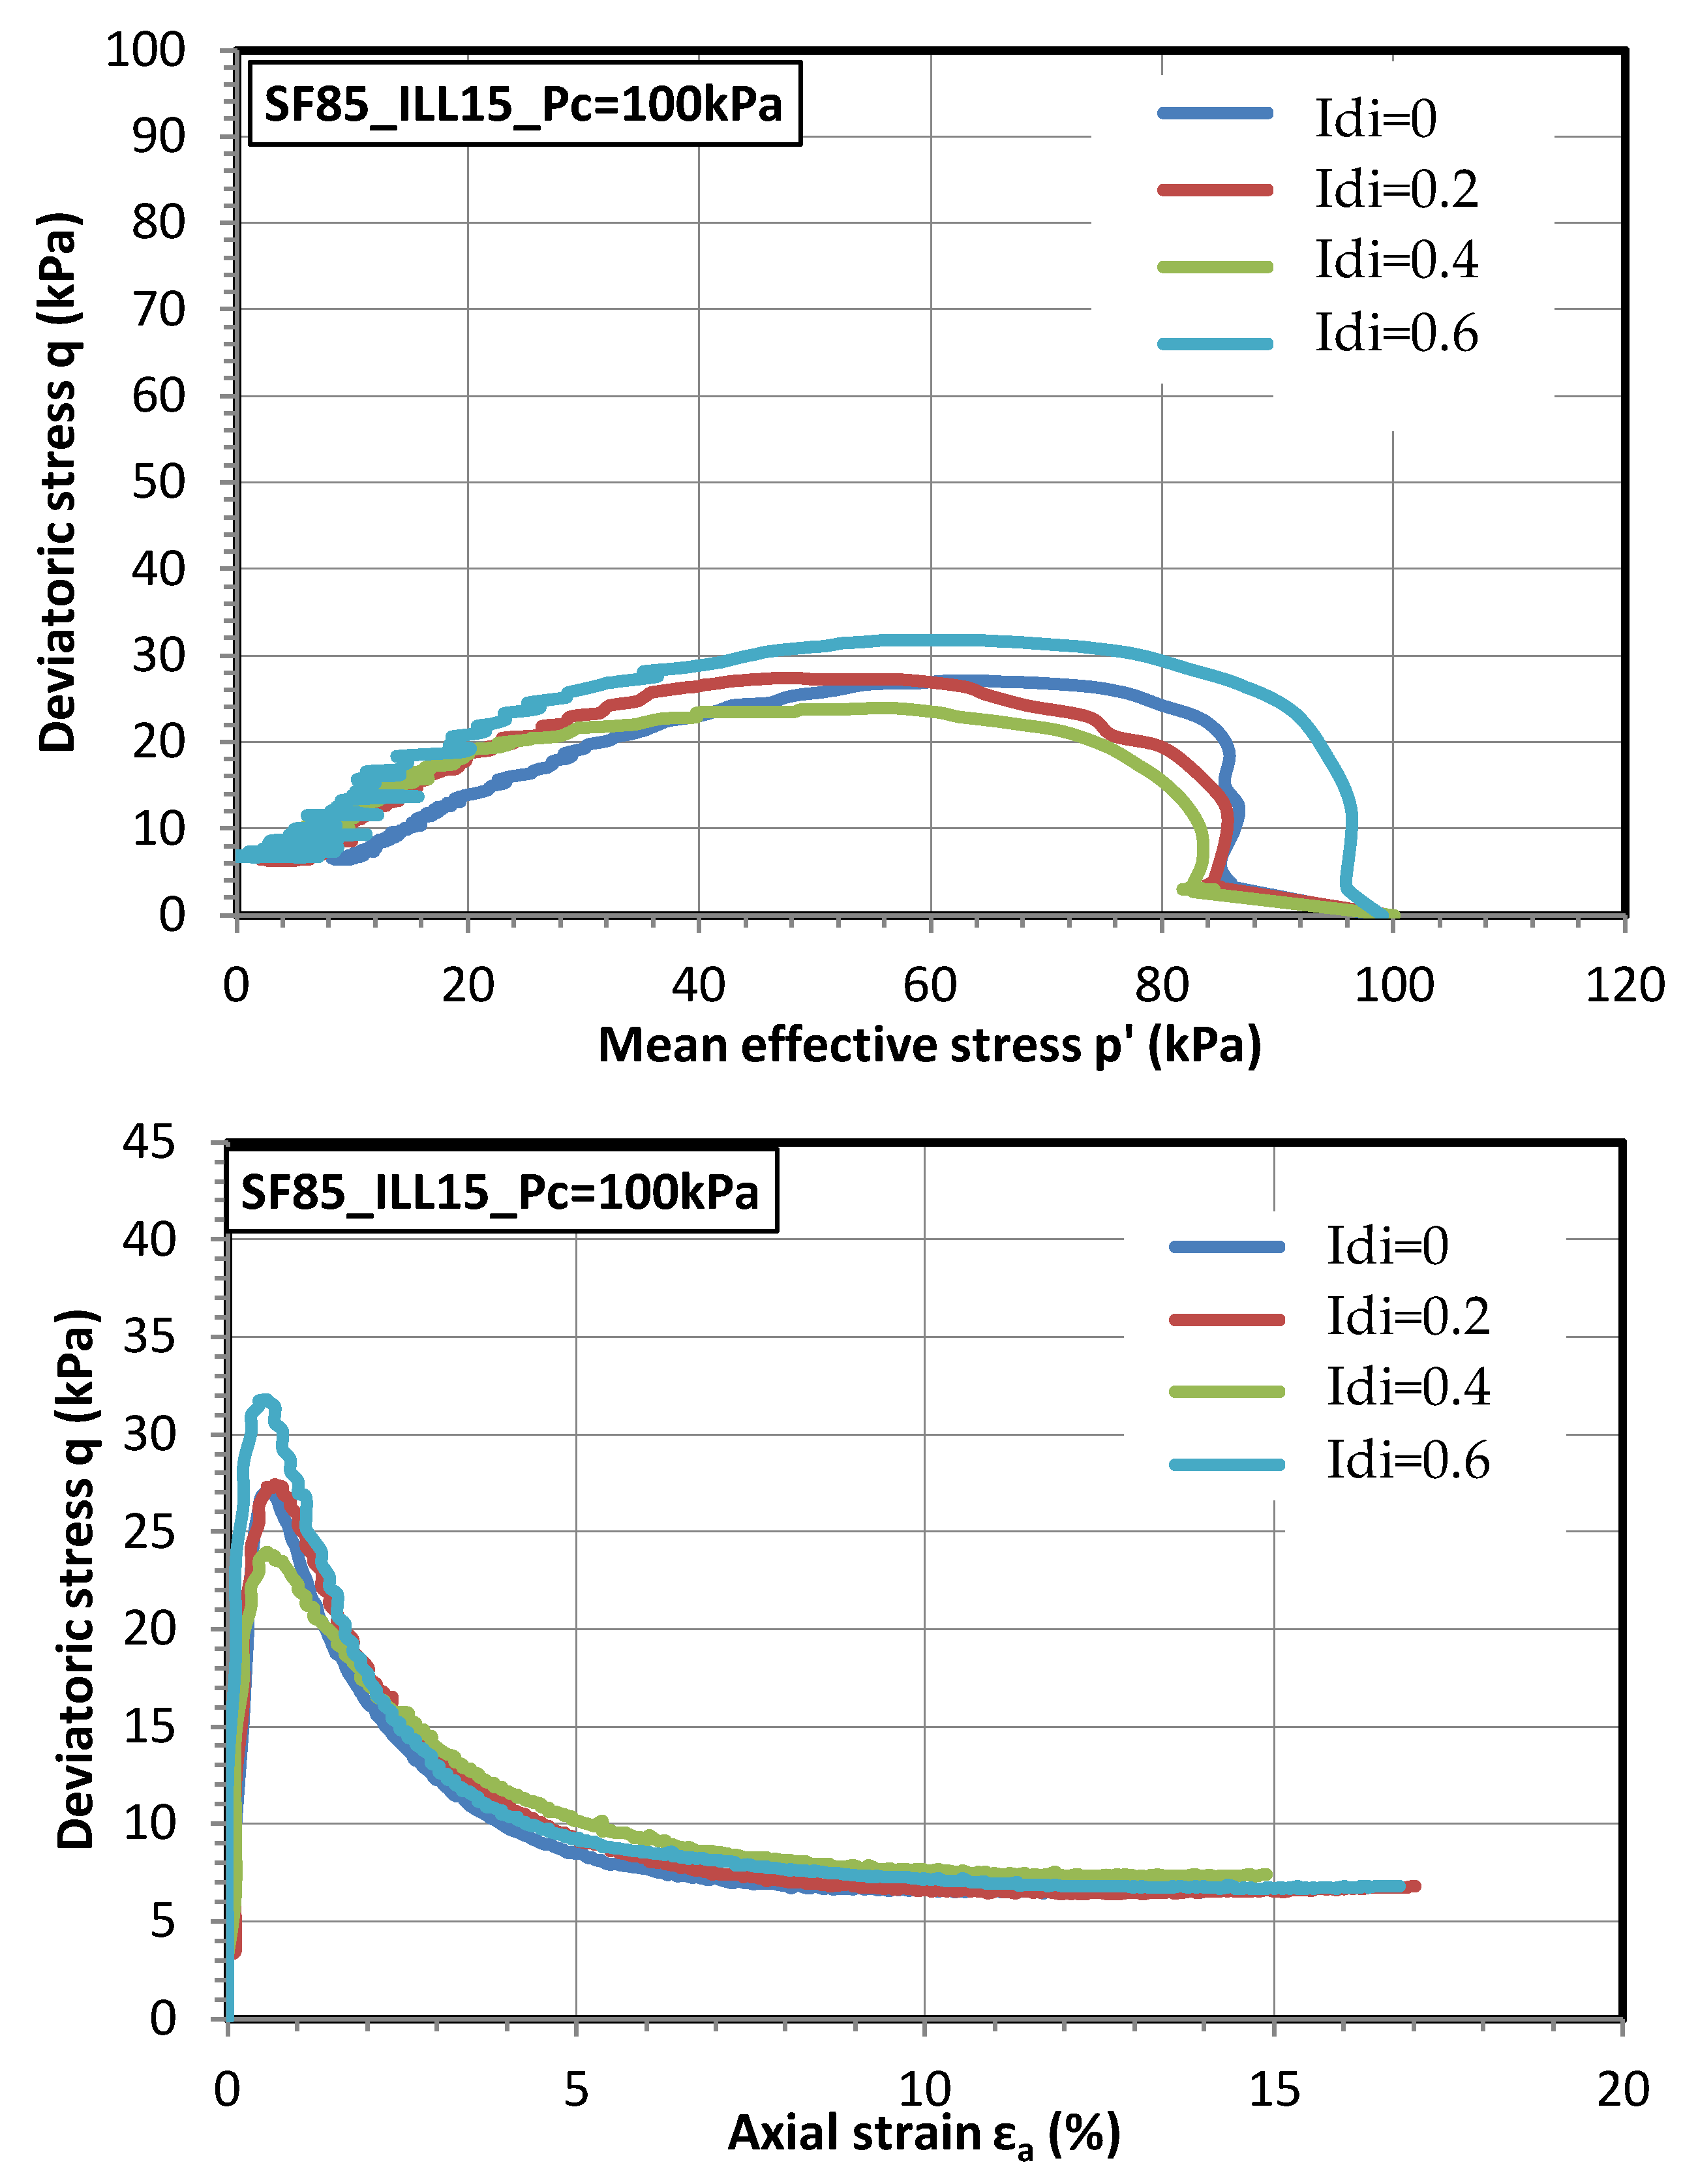
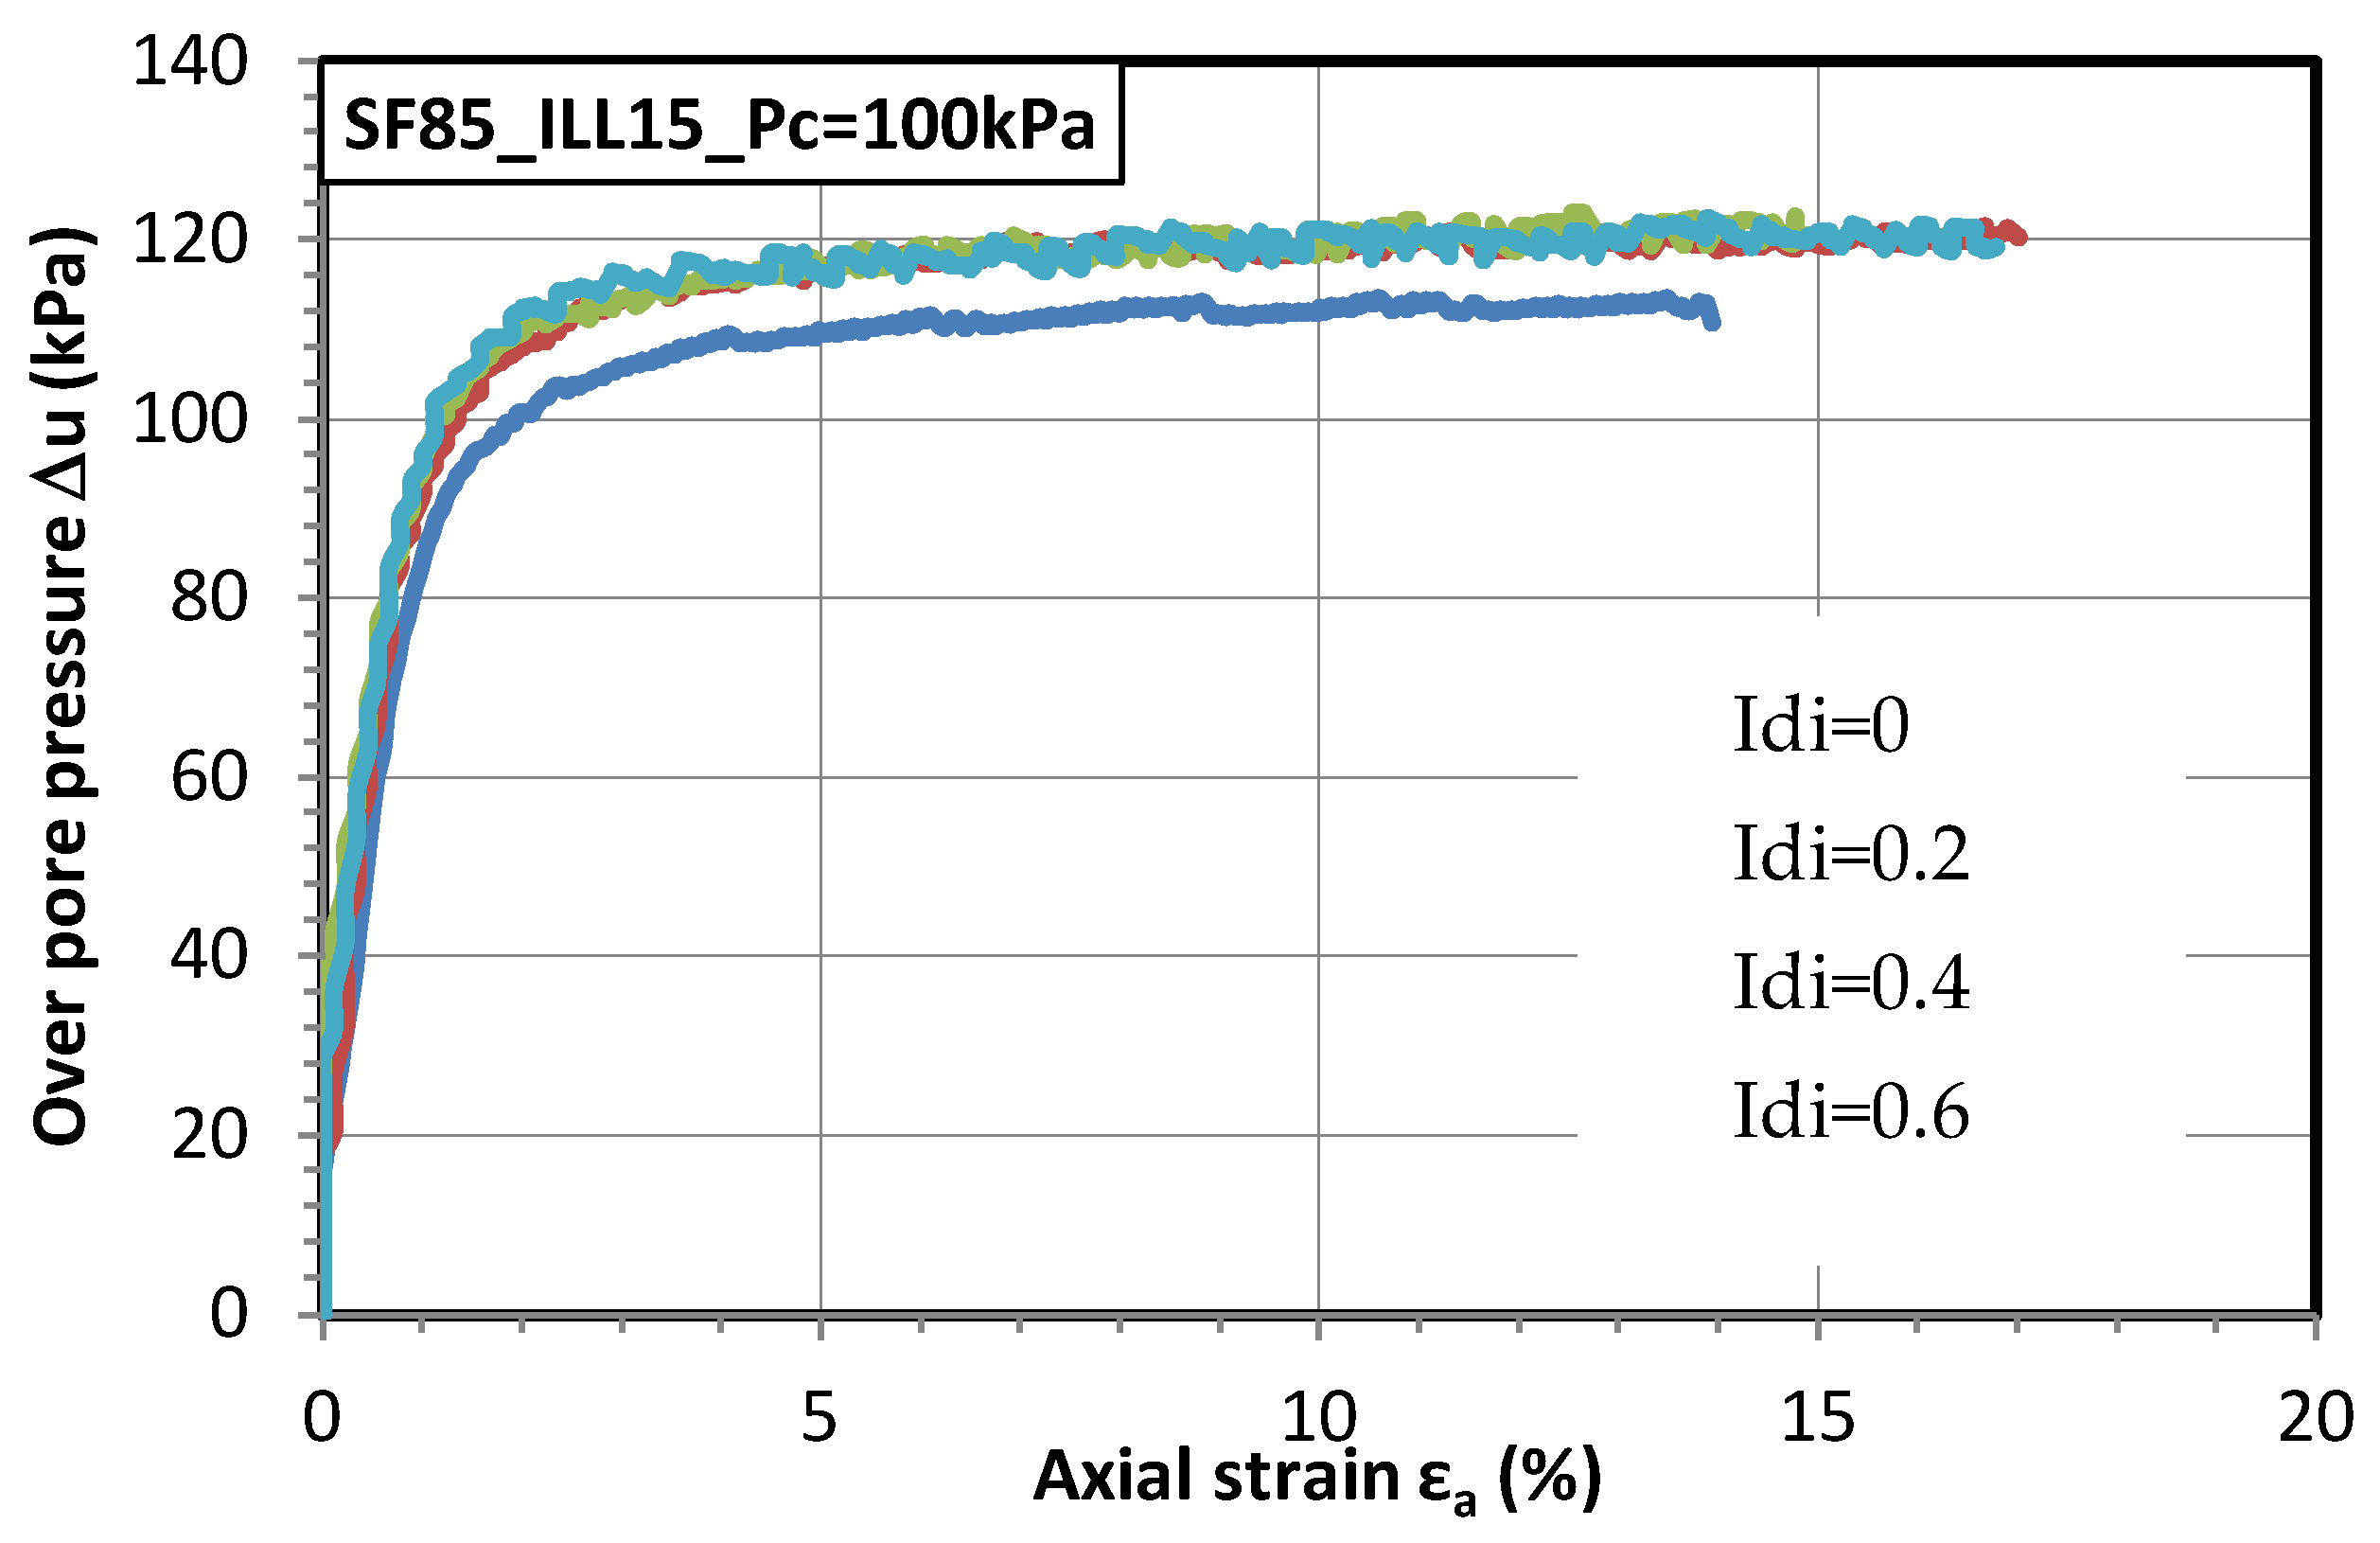
Samples reconstituted from 85% Fontainebleau sand and 15% fine content were used to study the effect of density index. Figure 13 shows the triaxial test results for samples of this mixture with four different initial density indexes (Idi = 0.0, 0.2; 0.4, and 0.6) under the confining pressure of 100 kPa. It is noticed that four specimens are liquefied, even the dense one (Idi = 0.6), which is not the case for the clean sand behavior as shown in Section 3.1. As a reminder, the clean sand sample with Idi = 0.4 and under Pc = 100 kPa presents a dilatant behavior (see Figure 10).

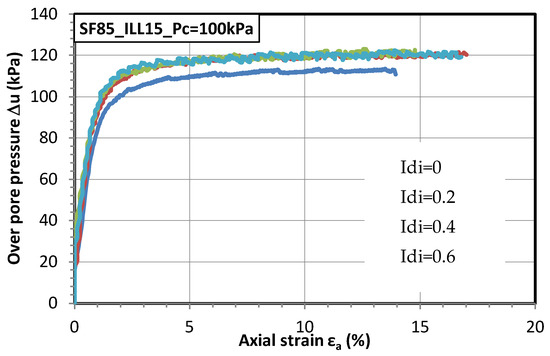
Figure 13.
Effect of initial density index on the undrained responses of samples with 15% fine content and under the confining pressure of 100 kPa.
The behavior of specimens with these four initial states is similar. Indeed, four curves q-εa are almost coincident, except for the strain interval from 0.05% to 3%, in which the deviatoric peak occurs. After reaching the peak, the deviatoric stress decreases quickly to reach the residual resistance. The residual resistances of these four samples are almost identical. The loading paths p’-q are also homothetic and close together. The overpressure increases quickly and reaches the confining pressure beyond 5% of axial strain. After this value of axial strain, the deviatoric stress and the over-pressure reach the asymptotic behavior.
3.4. Effect of Confining Pressure
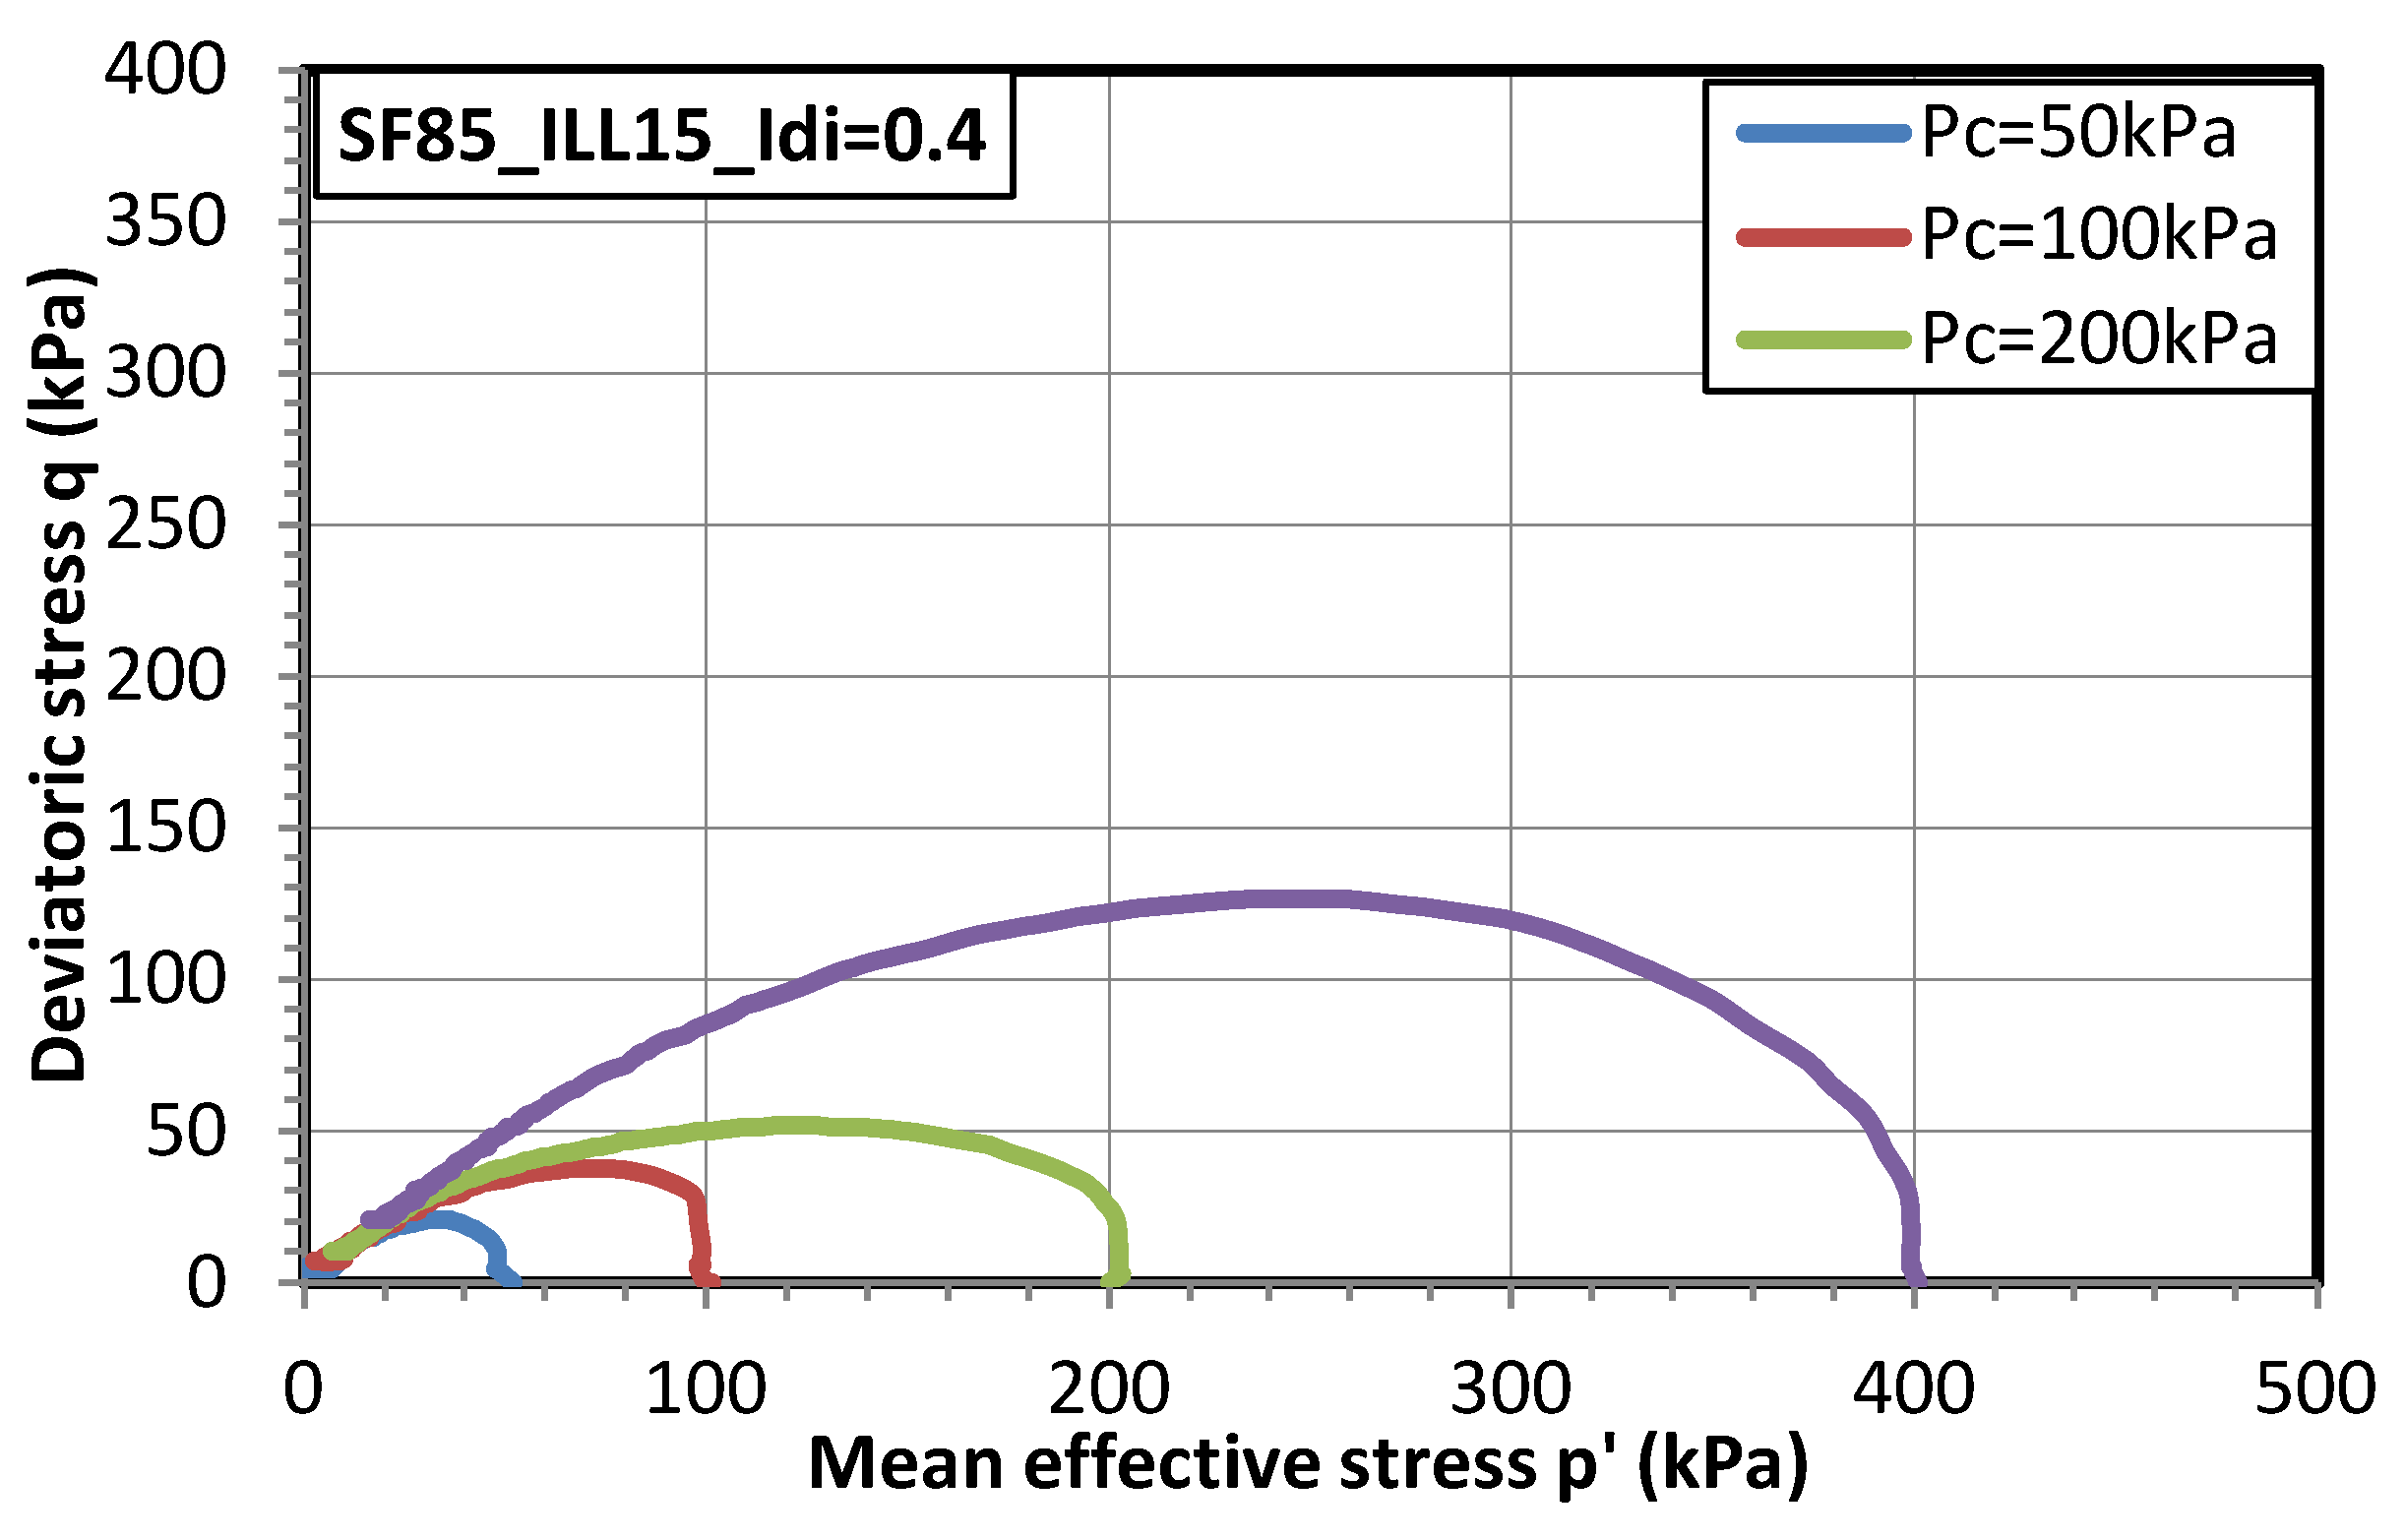
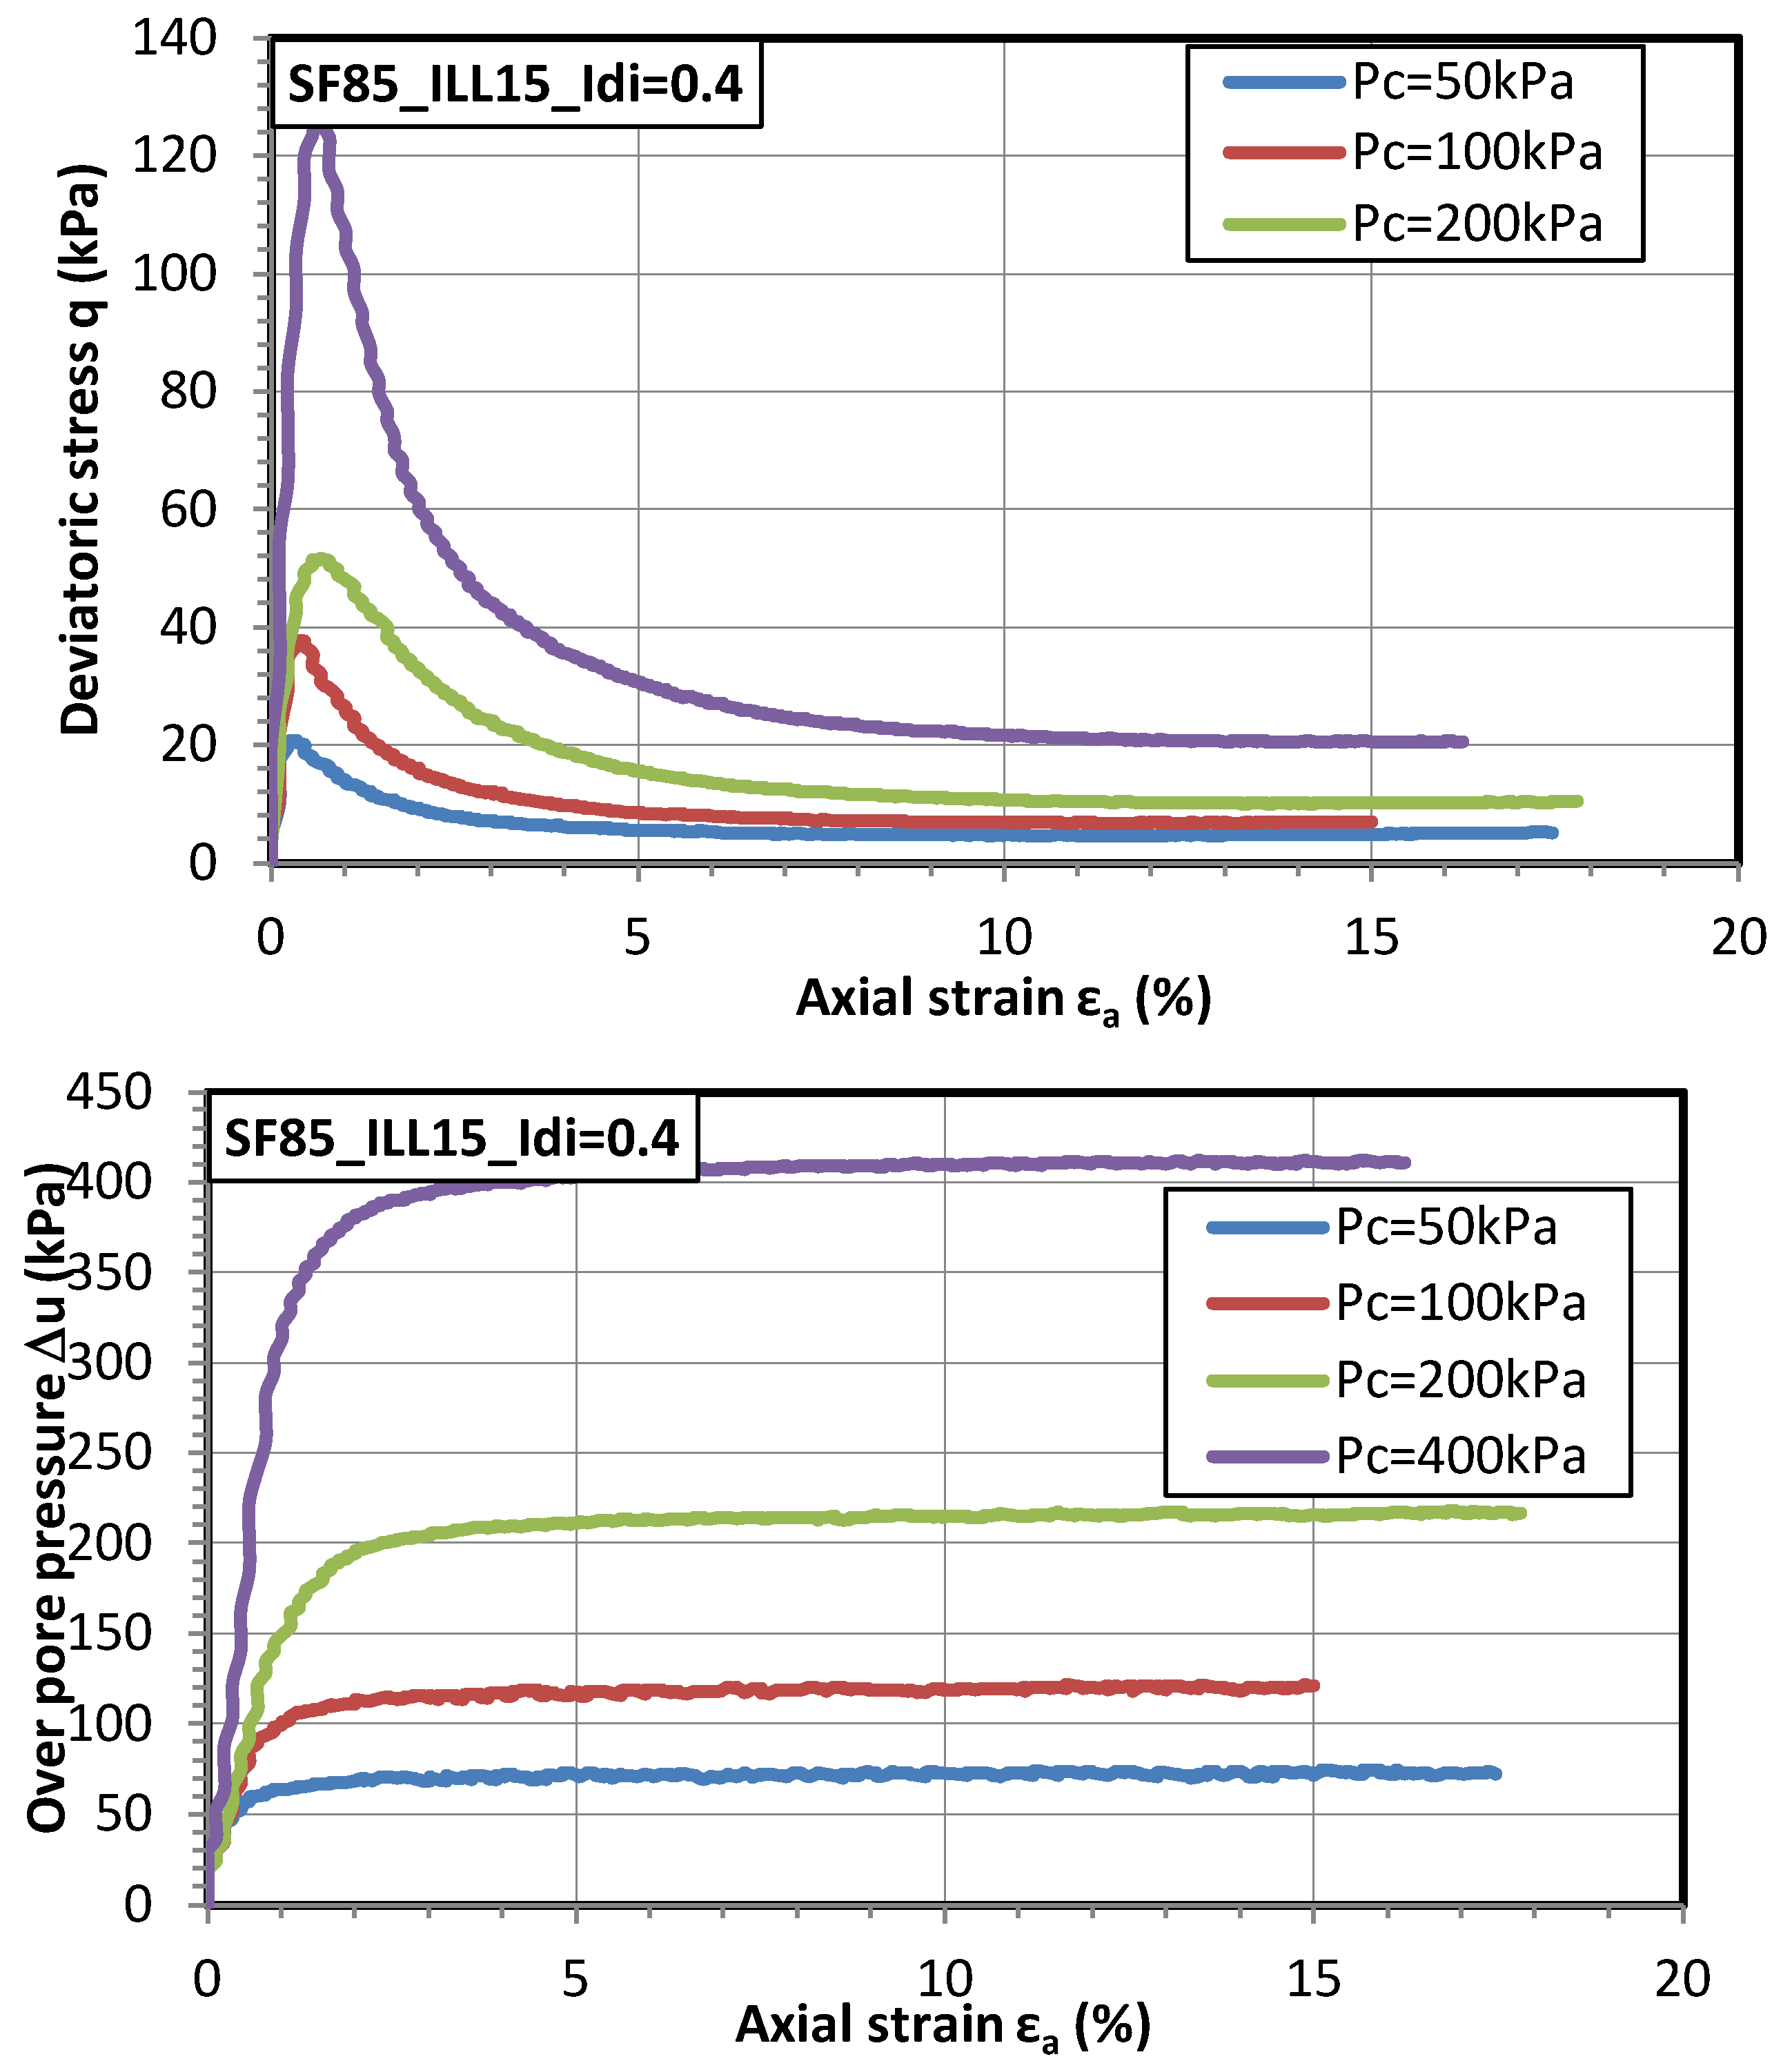
Triaxial tests were performed on samples with 15% of Illite Arvel and the density index Idi = 0.4 under four confining pressures (Pc = 50, 100, 200, and 400 kPa). Samples’ undrained responses are plotted in Figure 14. The results show that all samples are liquefied, which is not the case with clean sand samples, as shown in Section 3.1. Indeed, Figure 10 shows that all the samples of clean sand with Idi = 0.4, which are not liquefied except the sample under Pc = 400 kPa, exhibit a limited liquefaction behavior.
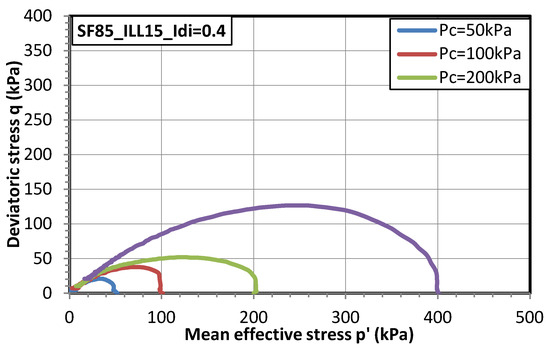
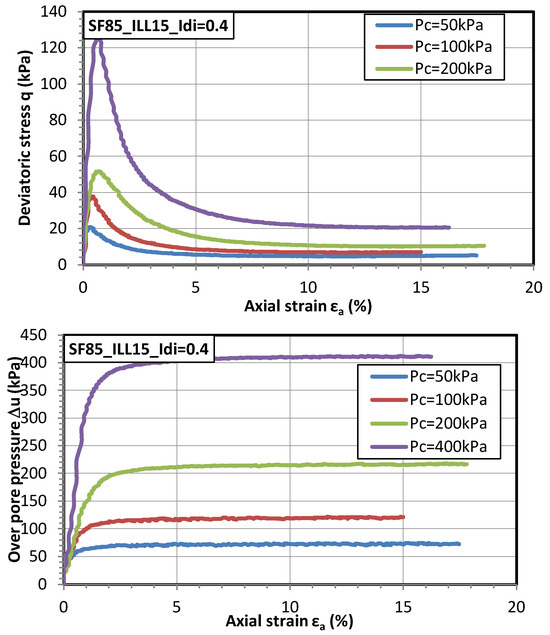
Figure 14.
Effect of confining pressure on the undrained responses of samples with 15% fine content and Idi = 0.4.
3.5. Effect of over Consolidation Ratio (OCR)
To study the influence of the over-consolidation ratio (OCR) on the liquefaction potential, the specimens were first consolidated at the confining pressure corresponding to the considered OCR. The specimens were then unloaded and reconsolidated at the final effective pressure of 100 kPa before shearing. Specimens made of a mixture of 85% clean sand and 15% fine content are considered. All the specimens are reconstituted to reach an initial density index Idi = 0.2 (i.e., a loose state). Figure 15 and Figure 16 show the effect of OCR on the undrained behavior clean sand and mixtures with 15% fine content.
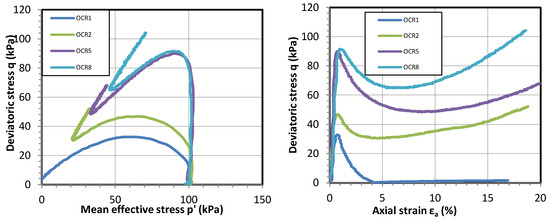
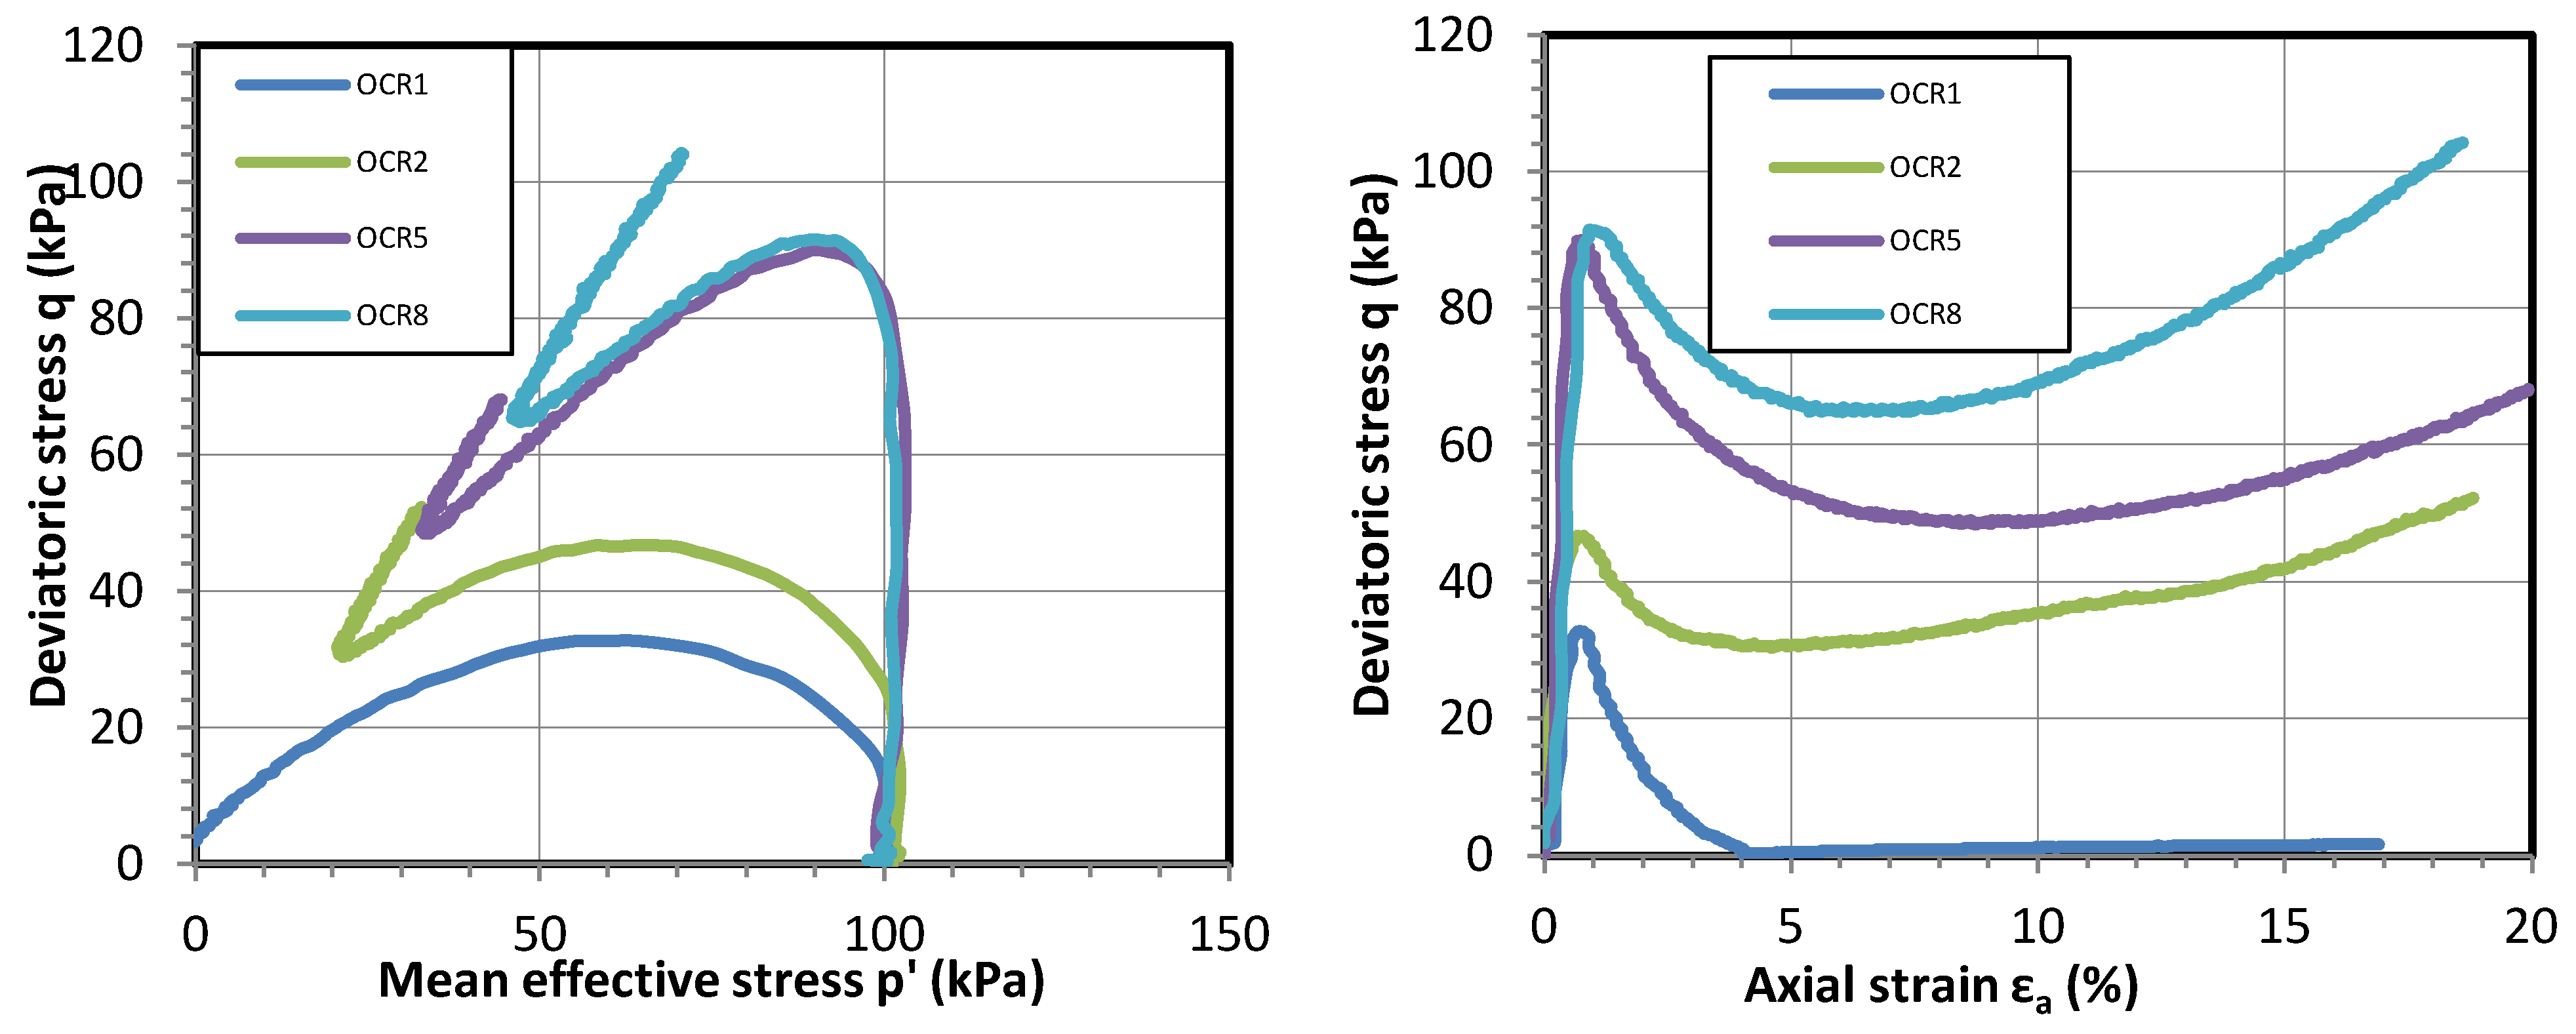
Figure 15.
Effect of OCR on the undrained responses of samples of clean sand with Idi = 0.2.
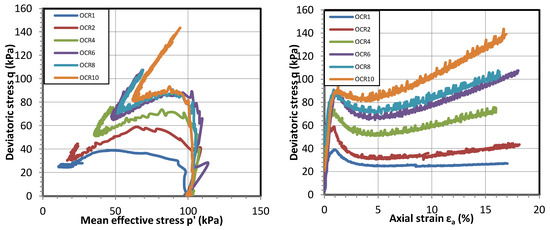
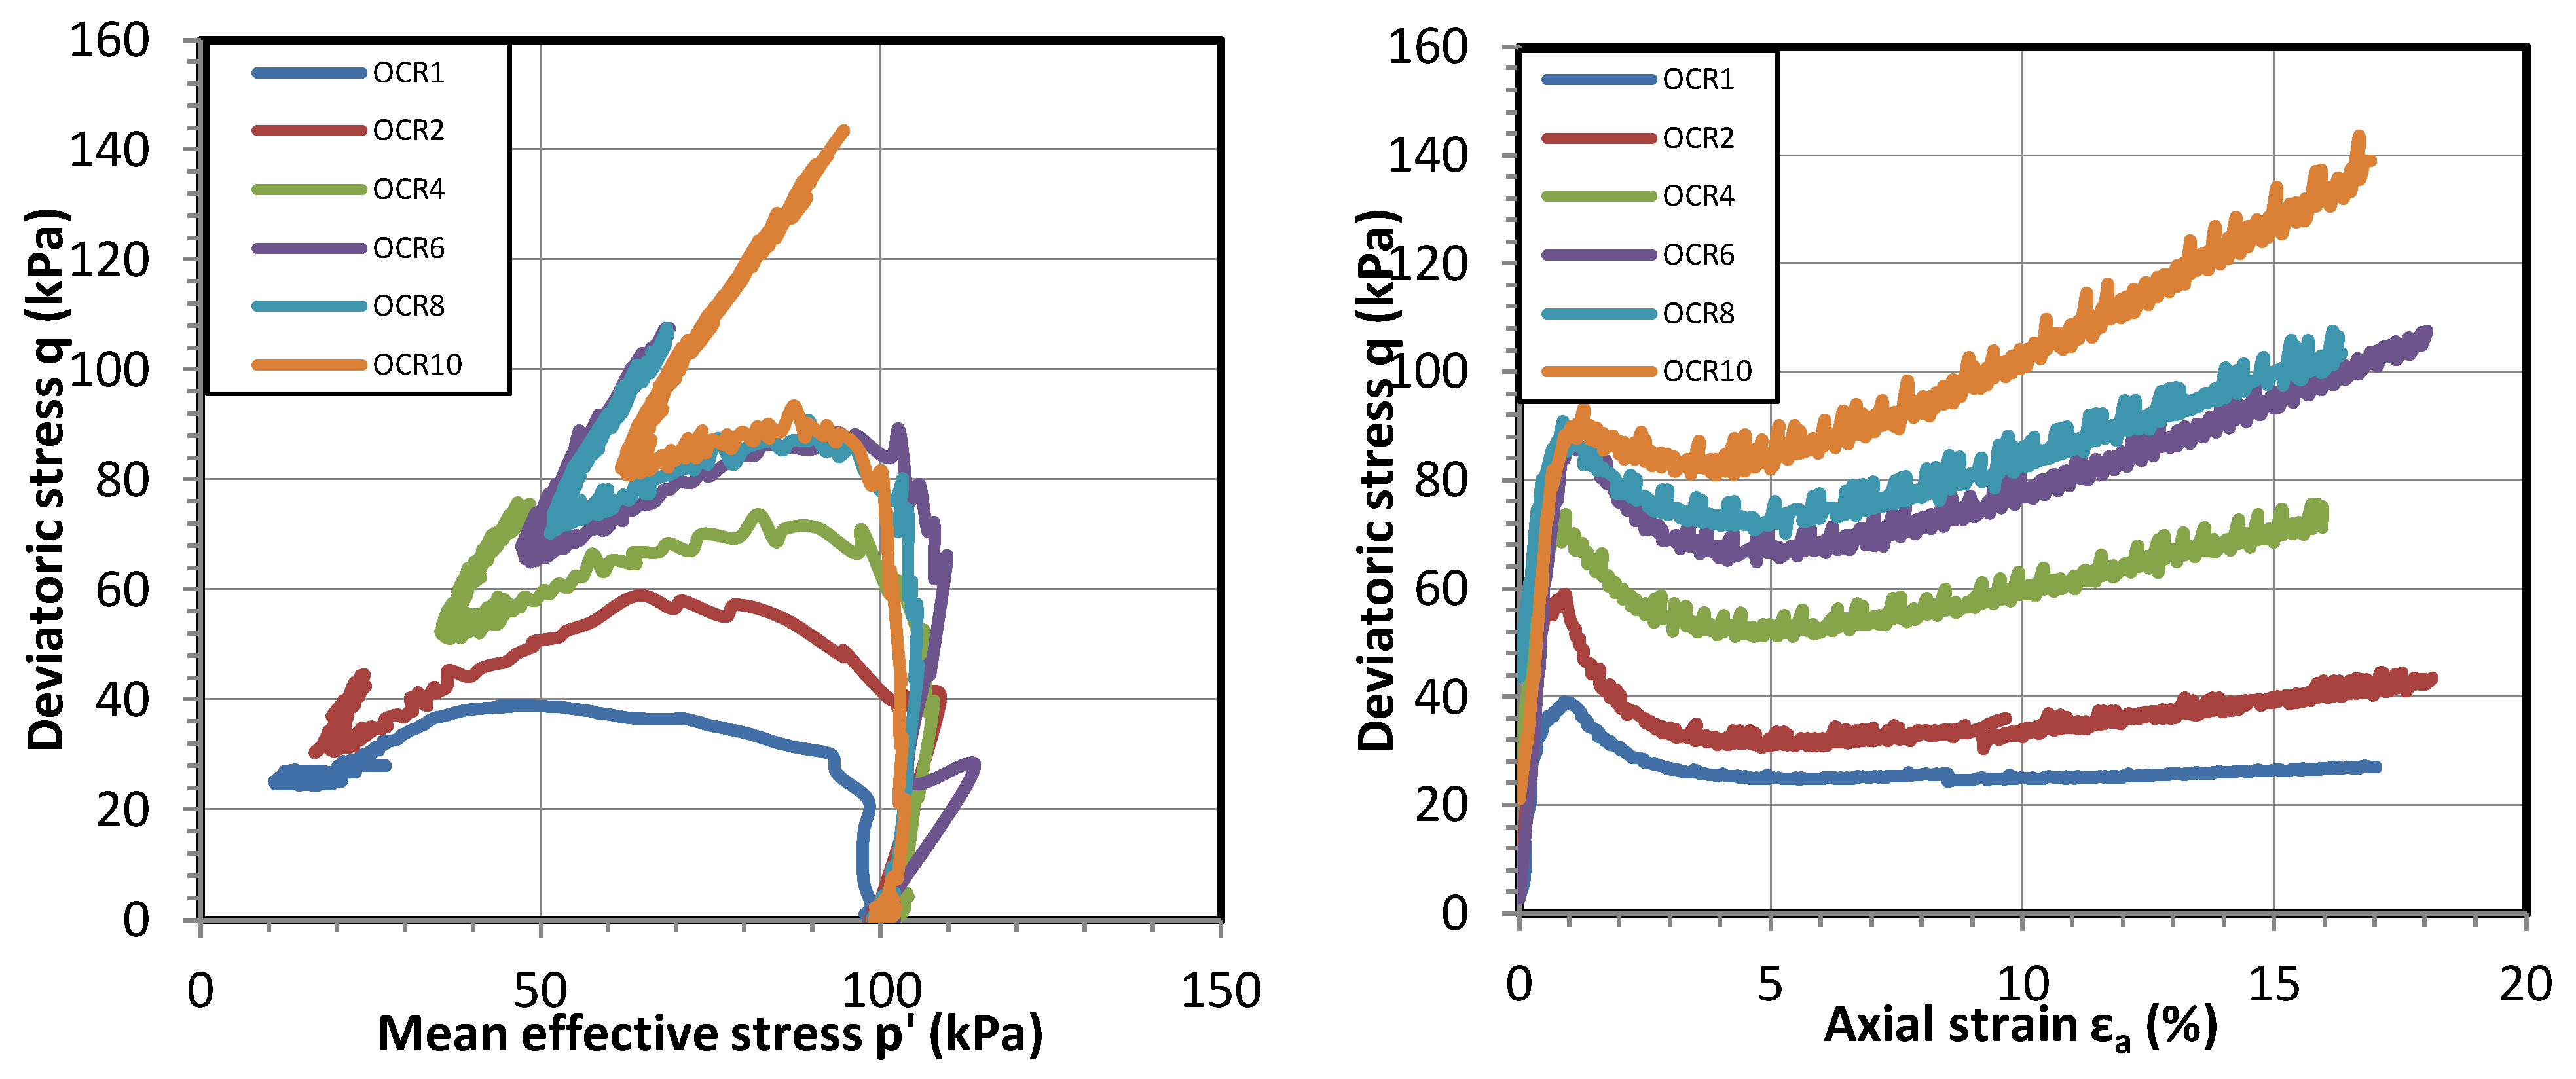
Figure 16.
Effect of OCR on the undrained responses of samples with 15% fine content and Idi = 0.2.
It is observed that an increase in OCR leads to an increase of the first deviatoric stress peak of curves q versus e1. Beyond the value OCR = 5 for clean sand and OCR = 6 for mixtures, this peak of deviatoric stress no longer changes. All over-consolidated samples (OCR > 1) exhibit a limited static liquefaction behavior. Meanwhile, normally consolidated clean sand sample presents a full liquefaction response, since the deviatoric stress reaches the zero value from 4% of axial strain. The normally consolidated mixture sample is also liquefied, but its residual strength is about 70% of its peak strength. In the over-consolidated state, the higher OCR results in a higher and faster increase in deviatoric stress at the ultimate state.
It is observed that all the total collapse and limited liquefied samples in this study reach the peak of deviatoric stress at an axial strain lower than 1%. The axial strain corresponding to the peak stress of liquefied sandy soil sample has usually been found to be lower than 2% in the literature (e.g., [15,16,17,18,26,52,53]).
3.6. Liquefaction Susceptibility
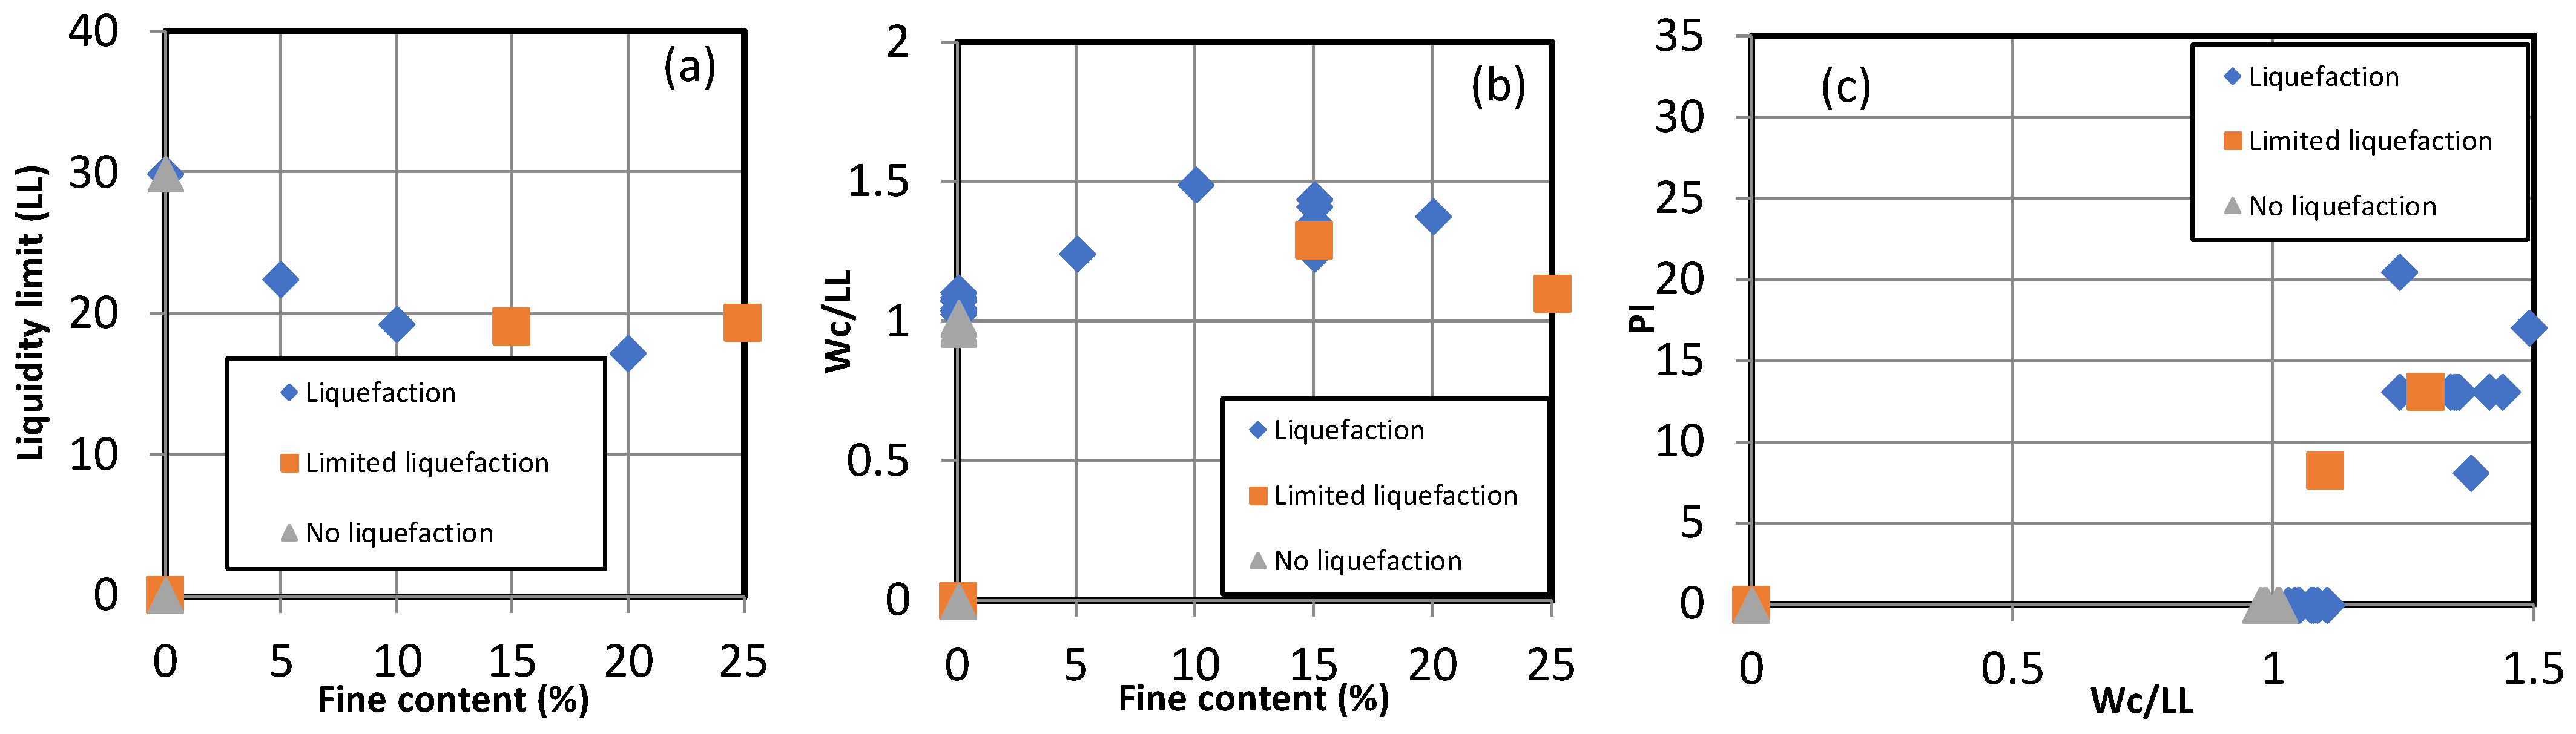
Based on earthquake data from China, Wang [55] proposed a criterion for assessing the soil liquefaction susceptibility. He observed that soil is likely to liquefy if it meets two conditions: a fine content (with fine particles’ diameter lower than 15 μm) below 15–20%, and a ratio of water content after consolidation to liquidity limit (Wc/LL) higher than 0.9. Seed and Idriss [56] completed this criterion, the so-called Chinese criterion. They indicated that soil can liquify if it satisfies three conditions: the fine content with a diameter lower than 5 mm is less than 15%; the liquidity limit (LL) is less than 35%, and the ratio of w/wL is greater than 0.9.
Figure 17 shows the liquidity limit, Wc/LL, as a function of the fine content and the plasticity index (PI) versus Wc/LL. It is noticed that most of the specimens meeting three conditions defined in the Chinese criterion are liquefied. However, two clean sand samples with a ratio W/wL close to 1 are not liquefied. Moreover, a mixture with 20% plastic fine content is liquefied and two other mixtures with 15% and 25% fine contents exhibit limited liquefaction behavior. Therefore, the Chinese criterion is not totally suitable for Fontainebleau’s clean sand and its mixture with Illite Arvel plastic fines. However, further tests should be performed to obtain sufficient triaxial tests to confirm this observation.
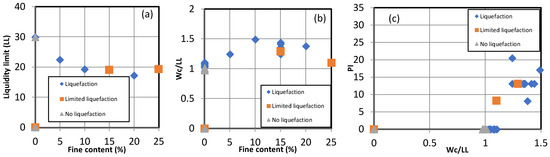
Figure 17.
Liquefaction susceptibility according to the Chinese criterion: (a) liquidity limit vs. fine content; (b) ratio water content/liquidity limit (Wc/LL) vs. fine content; and (c) plasticity index (PI) vs. Wc/LL.
4. Conclusions
This study investigated the static liquefaction behavior of the Fontainebleau clean sand and the mixtures of this sand and the plastic fine Illite Arvel via undrained monotonic triaxial tests. Samples with fine content of up to 25% were reconstituted by using the moist tamping technique. The effects of different parameters were studied, such as the fine content, the initial density index, the confining pressure, and the over-consolidation ratio (OCR). The test results were also compared to the Chinese criterion for liquefaction susceptibility to verify this criterion against the Fontainebleau sand. The following main conclusions can be made:
- Clean sand at a very loose state (Idi = −0.2) exhibits a total collapse behavior even if for a high cell pressure (Pc = 400 kPa).
- Clean sand at a loose state (Idei = 0.1) is liquefied for three confining pressures: Pc = 50 kPa (total collapse for this case), 100 kPa, and 500 kPa.
- Clean sand samples prepared at a dense state (Idi = 0.4) are not liquefied at low confining pressure (Pc = 50 and 100 kPa) but present a limited liquefaction at high confining pressure Pc = 400 kPa.
- Specimens with fine content of up to 25%, reconstituted at a loose state (Idi = 0.0 for 0, 5, 10, and 15% of fine content; and Idi = 0.2 for 15, 20, and 25% of fine content) are liquefied (for a confining pressure Pc = 100 kPa).
- The fine content seems to present a threshold of ~10–15%. Below this value, the liquefaction resistance increases with an increase in fine content. Beyond this value, an increase in fine content leads to a decrease in the unsaturated strength. This trend is different from test results reported in the literature. It emphasizes that the effect of fine content on different sands may be different.
- The specimens with 15% fine content reconstituted at different initial density indexes from the loose state (Idi = 0.0) to the dense state (Idi = 0.6) are liquefied (for Pc = 100kPa). This trend is quite different to that of the clean sand, where the samples are liquefied at a very loose or loose state but present a dilatant response at a dense state (Idi = 0.4).
- The mixtures with 15% fine content and reconstituted at a dense state (Idi = 0.4) are liquefied (but not totally collapsed) for a range of confining pressure from 50 kPa to 400 kPa. The clean sand with Idi = 0.4 presents a limited liquefaction response under the confining pressure of 400 kPa.
- An increase in OCR until a threshold leads to an increase in the liquefaction resistance. Clean sand and mixtures are liquefied at a normally consolidated state while presenting a limited liquefaction response at over the consolidated state (for samples with Idi = 0.2 and Pc = 100 kPa).
- All the liquefied samples (both total collapse and limited liquefaction) reach the peak of deviatoric stress at an axial strain lower than 1%.
- The Chinese criterion of liquefaction susceptibility is not totally suitable for Fontainebleau’s clean sand and its mixture with Illite Arvel plastic fines.
The present experimental work shows many interesting results. Especially, the effect of fine content tendency is different from the previous observations in the literature. Moreover, the result’s trend is also different between clean sand and its mixture with the plastic Illite Arvel fine content. However, to confirm the results described above, further tests should be completed, for instance, the effect of initial density index, initial global density index, and initial intergranular density index on mixtures with different fine contents (other than 15% fine content). Moreover, sand with similar characteristics to Fontainebleau sand should be also used to verify the tendency. The effect of non-plastic fine content on the Fontainebleau sand is also an interesting subject for further investigation. The SEM is planned to be included in the new test campaign, which will be useful for the explanation of the test results. Moreover, more future test results, as well as collecting the data reported in the literature may help to confirm the validation and limitation of the Chinese criterion for liquefaction susceptibility, then to eventually adjust this criterion, and even to propose a new criterion.
Author Contributions
Q.-H.D.: Conceptualization; methodology; validation; formal analysis; investigation; resources; data curation; visualization; project administration; funding acquisition. P.R.: Conceptualization; methodology; validation; formal analysis; investigation; resources; data curation; visualization; supervision. M.-N.V.: Conceptualization; methodology; validation; formal analysis; writing—original draft preparation, writing—review and editing. T.N.-S.: Conceptualization; formal analysis; investigation; writing—review and editing. V.-H.P.: Conceptualization, formal analysis; investigation; writing—review and editing. All authors have read and agreed to the published version of the manuscript.
Funding
This research was funded by the Ministry of Education and Training of Vietnam, Grant No. B2022-MDA-04.
Institutional Review Board Statement
Not applicable.
Informed Consent Statement
Not applicable.
Data Availability Statement
Data is contained within the article.
Acknowledgments
The authors gratefully acknowledge the financial support from the Ministry of Education and Training of Vietnam.
Conflicts of Interest
The authors declare no conflicts of interest.
References
- Ishihara, K.; Kawase, Y.; Nakajima, M. Liquefaction characteristics of sand deposits at an oil tank site during the 1978 Miyagiken-Oki earthquake. Soils Found. 1980, 20, 97–111. [Google Scholar] [CrossRef]
- Shengcong, F.; Tatsuoka, F. Soil Liquefaction During Haicheng and Tangshan Earthquake in China; A Review. Soils Found. 1984, 24, 22–29. [Google Scholar] [CrossRef]
- Kishida, H. Characteristics of liquefied sands during Mino-Owari, Tohnankai, and Fukui earthquakes. Soils Found. 1969, 9, 75–92. [Google Scholar] [CrossRef]
- Tohno, I.; Yasuda, S. Liquefaction of the ground during the 1978 Miyagiken-Oki earthquake. Soils Found. 1984, 21, 18–34. [Google Scholar] [CrossRef]
- Belkhatir, M.; Arab, A.; Della, N.; Schanz, T. Experimental Study of Undrained Shear Strength of Silty Sand: Effect of Fines and Gradation. Geotech. Geol. Eng. 2012, 30, 1103–1118. [Google Scholar] [CrossRef]
- Tokimatsu, K.; Yoshimi, Y. Empirical Correlation of Soil Liquefaction Based on SPT N-Value and Fines Content. Soils Found. 1983, 23, 56–74. [Google Scholar] [CrossRef]
- Cubrinovski, M.; Green, R.A.; Allen, J.; Ashford, S.; Bowman, E.; Bradley, B.; Cox, B.; Hutchinson, T.; Kavazanjian, E.; Orense, E.; et al. Geotechnical reconnaissance of the 2010 Darfield (Canterbury) earthquake. Bull. N. Z. Soc. Earthq. Eng. 2010, 43, 243–320. [Google Scholar] [CrossRef]
- Okashi, Y. Effects of Sand Compaction On Liquefaction During Tokachioki Earthquake. Soils Found. 1970, 10, 112–128. [Google Scholar]
- Seed, H.B.; Tokimatsu, K.; Harder, L.F.; Chung, R.M. The influence of SPT procedures in soil liquefaction resistance evaluations. J. Geotech. Eng. 1985, 111, 1425–1445. [Google Scholar] [CrossRef]
- Dezfulian, H. Liquefaction potential of silty sand site. Int. J. Rock. Mech. Min. Sci. Geomech. Abstr. 1986, 23, 90. [Google Scholar] [CrossRef]
- Kuerbis, R.; Negussey, D.; Vaid, Y.P. Effect of gradation and fines content on the undrained response of sand. In Proceedings of the Hydraulic Fill Structure, Geotechnic, Fort Collins, CO, USA, 15–18 August 1988; ASCE: Reston, VA, USA, 1988; pp. 330–345. [Google Scholar]
- Pitman, T.; Robertson, P.; Sego, D. Influence of fines on the collapse of loose sands. Can. Geotech. J. 1994, 31, 728–739. [Google Scholar] [CrossRef]
- Amini, F.; Qi, G. Liquefaction testing of stratified silty sands. J. Geotech. Geoenviron. Eng. 2000, 126, 208–217. [Google Scholar] [CrossRef]
- Ni, Q.; Tan, T.S.; Dasari, G.R.; Hight, D.W. Contribution of fines to the compressive strength of mixed soils. Geotechnique 2004, 54, 561–569. [Google Scholar] [CrossRef]
- Benahmed, N.; Nguyen, T.K.; Hicher, P.Y.; Nicolas, M. An experimental investigation into the effects of low plastic fines content on the behaviour of sand/silt mixtures. Eur. J. Environ. Civ. Eng. 2015, 19, 109–128. [Google Scholar] [CrossRef]
- Phan, T.A.P.V.; Hsiao, D.H.; Nguyen, T.L.P. Effects of Fines Contents on Engineering Properties of Sand-Fines Mixtures. Procedia Eng. 2016, 142, 213–220. [Google Scholar] [CrossRef]
- Jradi, L. Study of the Influence of Fine Particles on the Properties of Liquefaction of Sands. Ph.D. Thesis, University Paris-Est, Créteil, France, 2018. [Google Scholar]
- Gobbi, S.; Reiffsteck, P.; Lenti, L.; Santisi d’Avil, M.P.; Semblat, J.F. Liquefaction triggering in silty sands: Effects of non-plastic fines and mixture-packing conditions. Acta Geotech. 2022, 17, 391–410. [Google Scholar] [CrossRef]
- Polito, C. The Effects of Non-Plastic and Plastic Fines on the Liquefaction of Sandy Soils; Verginia Polytechnic Institute: Blacksburg, VA, USA, 1999. [Google Scholar]
- Naeini, S.A. The Influence of Silt Presence and Sample Preparation on Liquefaction Potential of Silty Sands. Ph.D. Thesis, Iran University of Science and Technology, Tehran, Iran, 2001. [Google Scholar]
- Bouferra, R.; Shahrour, I. Influence of fines on the resistance to liquefaction of a clayey sand. Ground Improv. 2004, 8, 1–5. [Google Scholar] [CrossRef]
- Ghahremani, M.; Ghalandarzadeh, A. Effect of plastic fines on cyclic resistance of sands. Soil. Rock. Behav. Model. 2006, 406–412. [Google Scholar]
- Murthy, T.G.; Loukidis, D.; Carraro, J.A.H.; Prezzi, M.; Salgado, R. Undrained monotonic response of clean and silty sands. Geotechnique 2008, 58, 536–538. [Google Scholar] [CrossRef]
- Stamatopoulos, C.A. An experimental study of the liquefaction strength of silty sands in terms of the state parameter. Soil Dyn. Earthq. Eng. 2010, 30, 662–678. [Google Scholar] [CrossRef]
- Belkhatir, M.; Arab, A.; Della, N.; Missoum, H.; Schanz, T. Liquefaction resistance of chlef river silty sand: Effect of low plastic fines and other parameters. Acta Polytech. Hung. 2010, 7, 119–137. [Google Scholar]
- Zhu, Z.H.; Zhang, F.; Dupla, J.C.; Canou, J.; Foerster, E. Investigation on the undrained shear strength of loose sand with added materials at various mean diameter ratios. Soil Dyn. Earthq. Eng. 2020, 137, 106276. [Google Scholar] [CrossRef]
- Koester, J.P. Influence of fines type and content on cyclic strength. In Ground Failures under Seismic Conditions; ASCE: Reston, VA, USA, 1994; pp. 17–33. [Google Scholar]
- Lade, P.; Yamamuro, J. Effects of nonplastic fines on static liquefaction of sands. Can. Geotech. J. 1997, 34, 918–928. [Google Scholar] [CrossRef]
- Thevanayagam, S.; Shenthan, T.; Mohan, S.; Liang, J. Undrained fragility of clean sands, silty sands, and sandy silts. J. Geotech. Geoenviron. Eng. 2002, 128, 849–859. [Google Scholar] [CrossRef]
- Xenaki, V.C.; Athanasopoulos, G.A. Liquefaction resistance of sand-silt mixtures: An experimental investigation of the effect of fines. Soil Dyn. Earthq. Eng. 2003, 23, 1–12. [Google Scholar] [CrossRef]
- Naeini, S.A.; Baziar, M.H. Effect of fines content on steady state strength of mixed and layered samples of a sand. Soil. Dyn. Earthq. Eng. 2004, 24, 181–187. [Google Scholar] [CrossRef]
- Yang, S.L.; Sandven, R.; Grande, L. Instability of sand-silt mixtures. Soil Dyn. Earthq. Eng. 2006, 26, 183–190. [Google Scholar] [CrossRef]
- Abedi, M.; Yasrobi, S.S. Effects of plastic fines on the instability of sand. Soil Dyn. Earthq. Eng. 2010, 30, 61–67. [Google Scholar] [CrossRef]
- Papadopoulou, A.I.; Tika, T.M. The effect of fines plasticity on monotonic undrained shear strength and liquefaction resistance of sands. Soil Dyn. Earthq. Eng. 2016, 88, 191–206. [Google Scholar] [CrossRef]
- Yang, J.; Wei, L.M. Collapse of loose sand with the addition of fines: The role of particle shape. Geotechnique 2012, 62, 1111–1125. [Google Scholar] [CrossRef]
- Monkul, M.M.; Etminan, E.; Senol, A. Coupled influence of content, gradation and shape characteristics of silts on static liquefaction of loose silty sands. Soil Dyn. Earthq. Eng. 2017, 101, 12–26. [Google Scholar] [CrossRef]
- NF P94-051; Sols: Reconnaissance et Essais—Détermination des Limites D’atterberg—Limite de Liquidité à la Coupelle—Limite de Plasticité au Rouleau. Afnor EDITIONS: Paris, France, 1993; p. 15.
- Wood, D.M. The use of the cone penetrometer to determine the plastic limit of soils. Ground Eng. 1978, 11, 3. [Google Scholar]
- Belviso, R.; Ciampoli, S.; Cotecchia, V.; Federico, A. Use of the cone penetrometer to determine consistency limits. Ground Eng. 1985, 18, 21–22. [Google Scholar]
- Kodikara, J.S. Evaluation of plastic limit and plasticity index by cone penetrometer. In Proceedings of the Asian Regional Symposium Geotechnical Problems and Practices in Foundation Engineering, Colombo, Sri Lanka, 25–27 February 1986; pp. 229–233. [Google Scholar]
- NF P94-059; Sols: Reconnaissance et Essais—Détermination des Masses Volumiques Minimale et Maximale des Sols non Cohérents. Afnor EDITIONS: Paris, France, 2000; p. 21.
- Karim, M.E.; Alam, M.J. Effect of non-plastic silt content on the liquefaction behavior of sand-silt mixture. Soil Dyn. Earthq. Eng. 2014, 65, 142–150. [Google Scholar] [CrossRef]
- Lade, P.V.; Liggio, C.D.; Yamamuro, J.A. Effects of non-plastic fines on minimum and maximum void ratios of sand. Geotech. Test. J. 1998, 21, 336–347. [Google Scholar] [CrossRef]
- Westman, A.E.; Hugill, H. The packing of particles. J. Am. Ceram. Soc. 1930, 13, 767–779. [Google Scholar] [CrossRef]
- Dang, Q.H. Comportement des Sols Sous Liquéfaction Artificielle, Amélioration des Sols à Risques Liquefiable. Ph.D. Thesis, Université Gustave Eiffel, Champs-sur-Marne, France, 2019; p. 238. [Google Scholar]
- Gobbi, S. Characterization of Liquefaction Parameters for Saturated Soil under Dynamic Loading Using Laboratory Tests and Calibration of Constitutive Laws by Numerical Modelling. Ph.D. Thesis, Université Gustave Eiffel, Champs-sur-Marne, France, 2020; p. 246. [Google Scholar]
- Ladd, R. Preparing test specimens using undercompaction. Geotech. Test. J. 1978, 1, 16–23. [Google Scholar] [CrossRef]
- Mullilis, J.P.; Townsend, F.C.; Horz, R.C. Triaxial testing techniques and sand liquefaction. In Dynamic Geotechnical Testing; ASTM International: West Conshohocken, PA, USA, 1978; pp. 265–279. [Google Scholar]
- Canou, J. Contribution a l’étude et a l’evaluation des Proprietes de Liquefaction d’un sable. Ph.D. Thesis, Ecole Nationale des Ponts et Chaussées, Paris, France, 1989. [Google Scholar]
- Ishihara, K. Liquefaction and flow failure during earthquakes. Géotechnique 1993, 43, 349–415. [Google Scholar] [CrossRef]
- Verdugo, R.; Ishihara, K. The steady state of sandy soils. Soils Found. 1996, 36, 81–91. [Google Scholar] [CrossRef]
- Benahmed, N. Comportment Mécanique d’un Sable Sous Cisaillement Monotone et Cyclique: Application au Phénomènes de Liquéfaction et Mobilité Cyclique. Ph.D. Thesis, Ëcole Nationale des Ponts et Chaussées, Champs-sur-Marne, France, 2001. [Google Scholar]
- Nguyen, K.T. Etude Expérimentale du Comportement Instable d’un Sable Silteux, Application aux Digues de Protection. Ph.D. Thesis, Université d’Aix-Marseille, Marseille, France, 2014. [Google Scholar]
- Castro, G. Liquefaction of Sands. Ph.D. Thesis, Harvard University, Cambridge, MA, USA, 1969. [Google Scholar]
- Wang, W. Some Findings in Soil Liquefaction; Water Conservancy and Hydroelectric Power Scientific Research Institute: Beijing, China, 1979. [Google Scholar]
- Seed, H.B.; Idriss, I.M. Ground Motions and Soil Liquefaction during Earthquakes; EERI Monograph: Berkeley, CA, USA, 1982. [Google Scholar]
Disclaimer/Publisher’s Note: The statements, opinions and data contained in all publications are solely those of the individual author(s) and contributor(s) and not of MDPI and/or the editor(s). MDPI and/or the editor(s) disclaim responsibility for any injury to people or property resulting from any ideas, methods, instructions or products referred to in the content. |
© 2024 by the authors. Licensee MDPI, Basel, Switzerland. This article is an open access article distributed under the terms and conditions of the Creative Commons Attribution (CC BY) license (https://creativecommons.org/licenses/by/4.0/).