
A Review of Advanced Air Lubrication Strategies for Resistance Reduction in the Naval Sector


Abstract
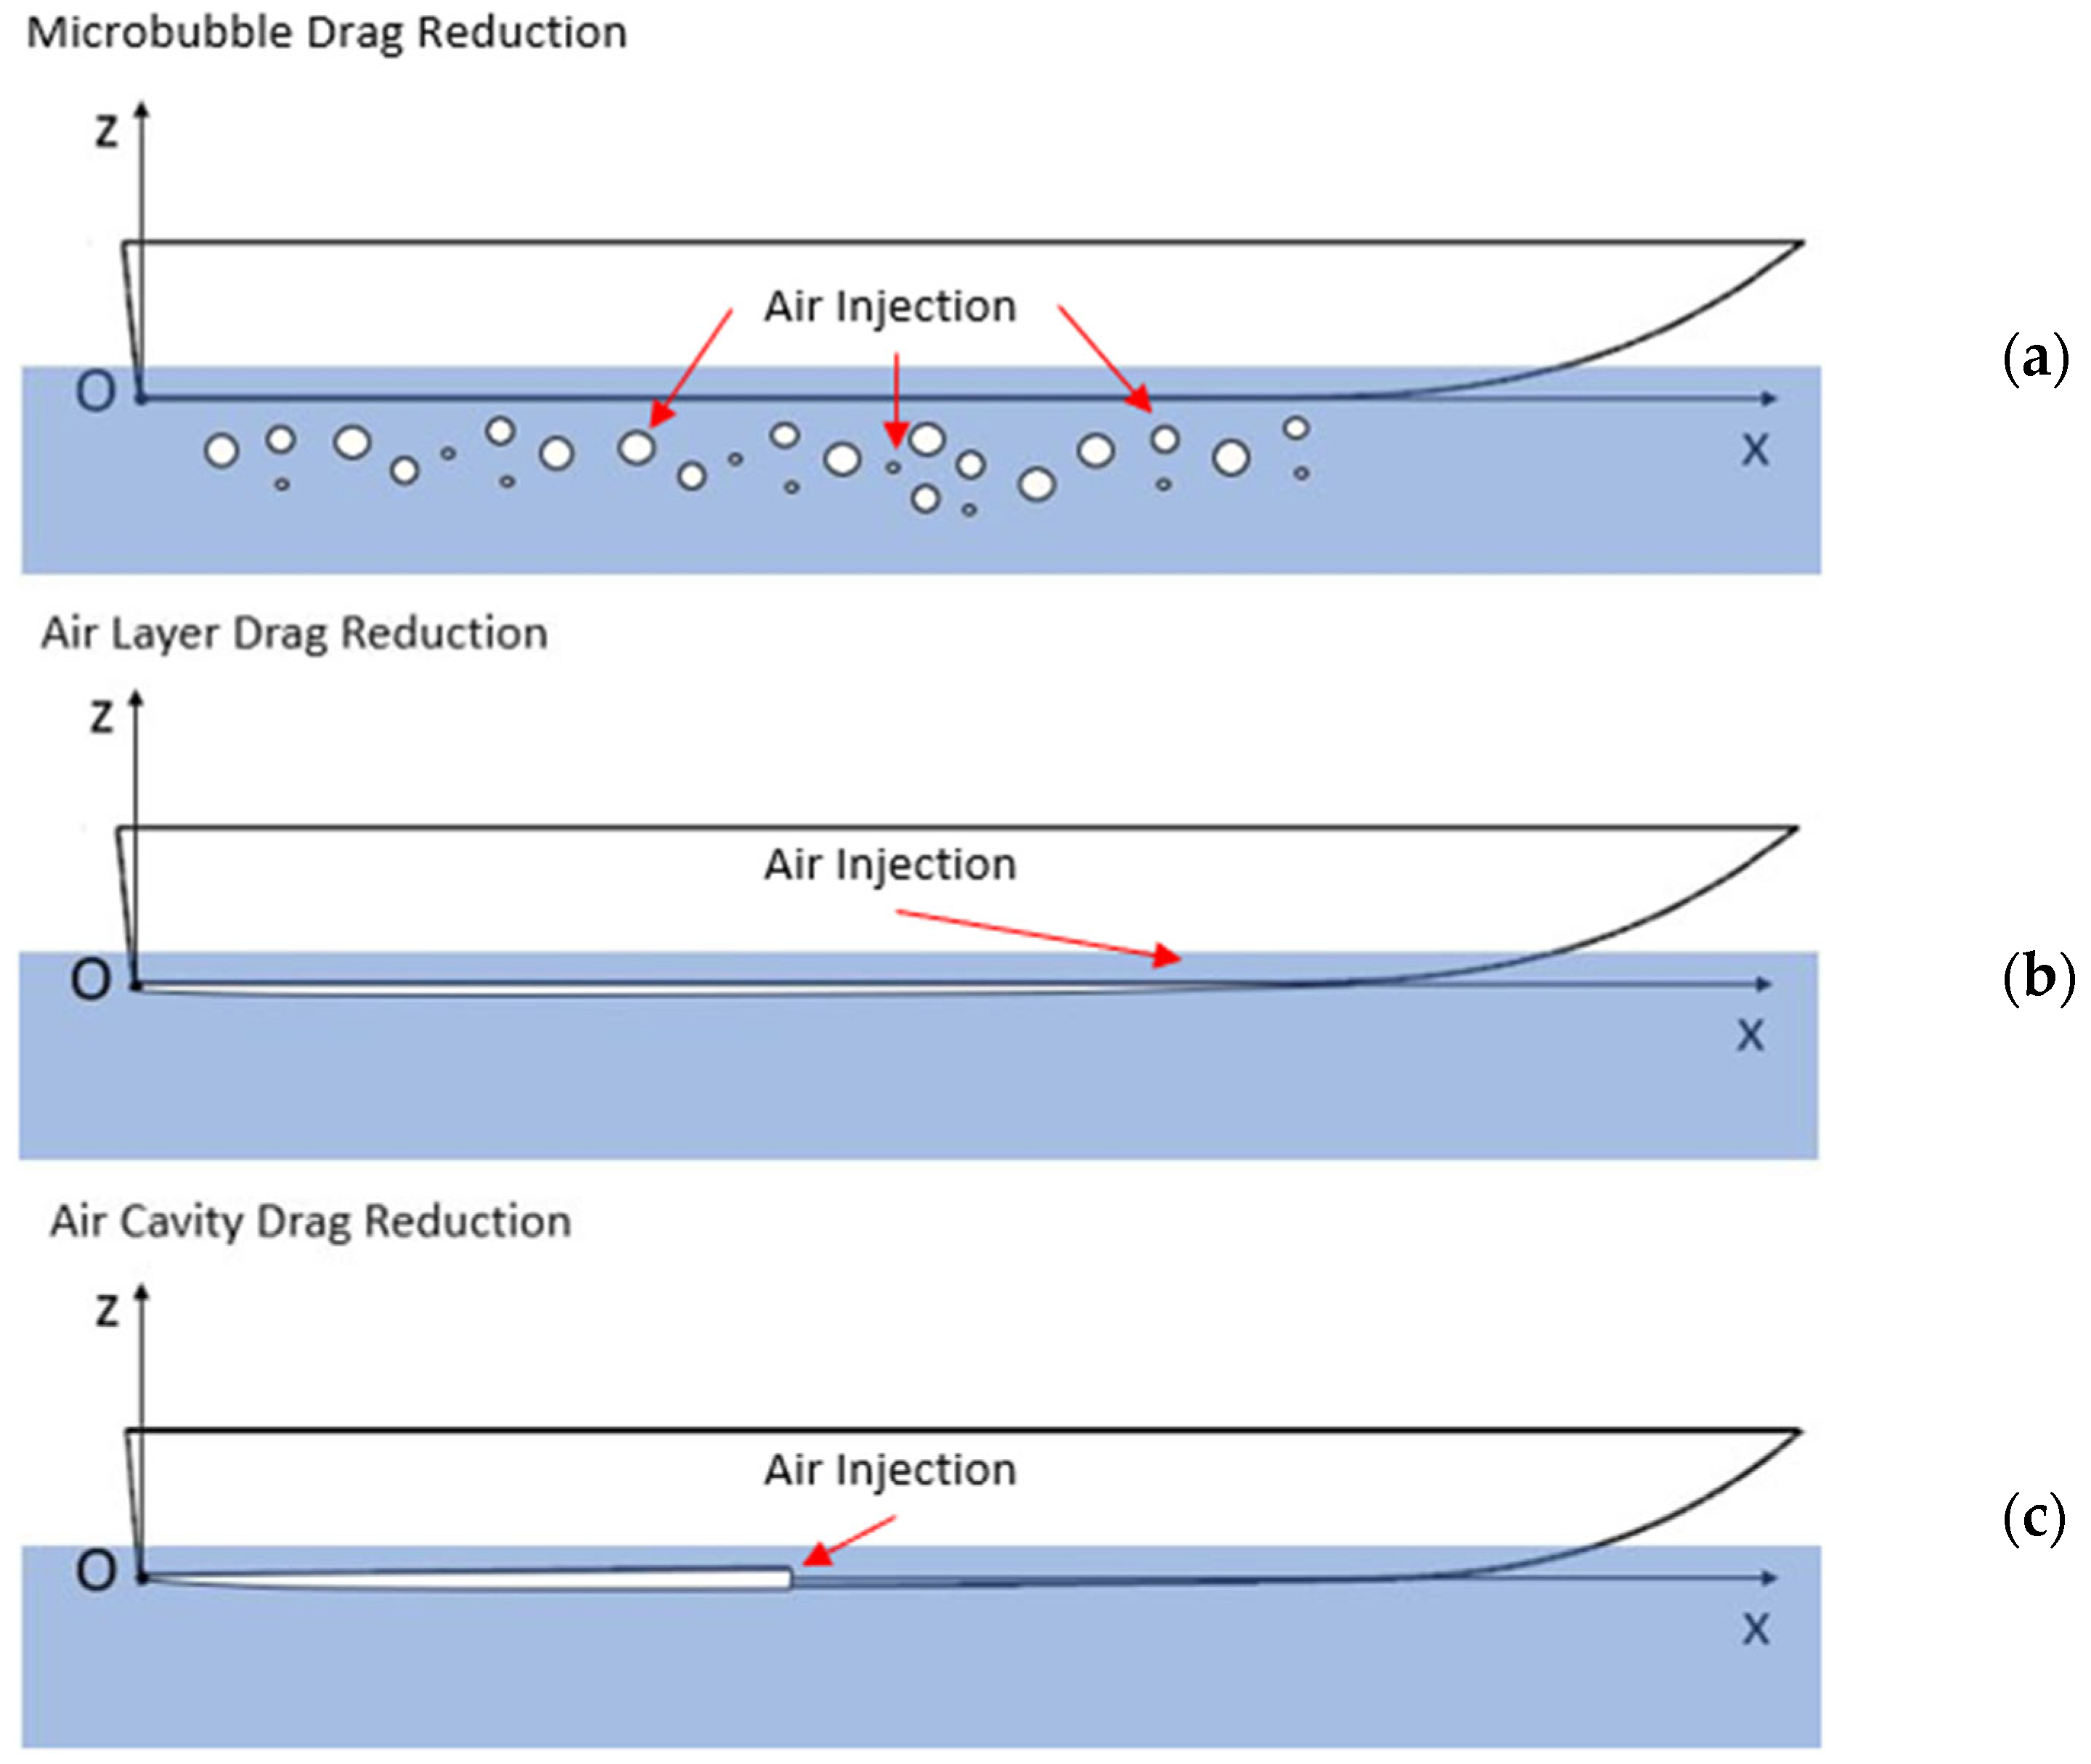
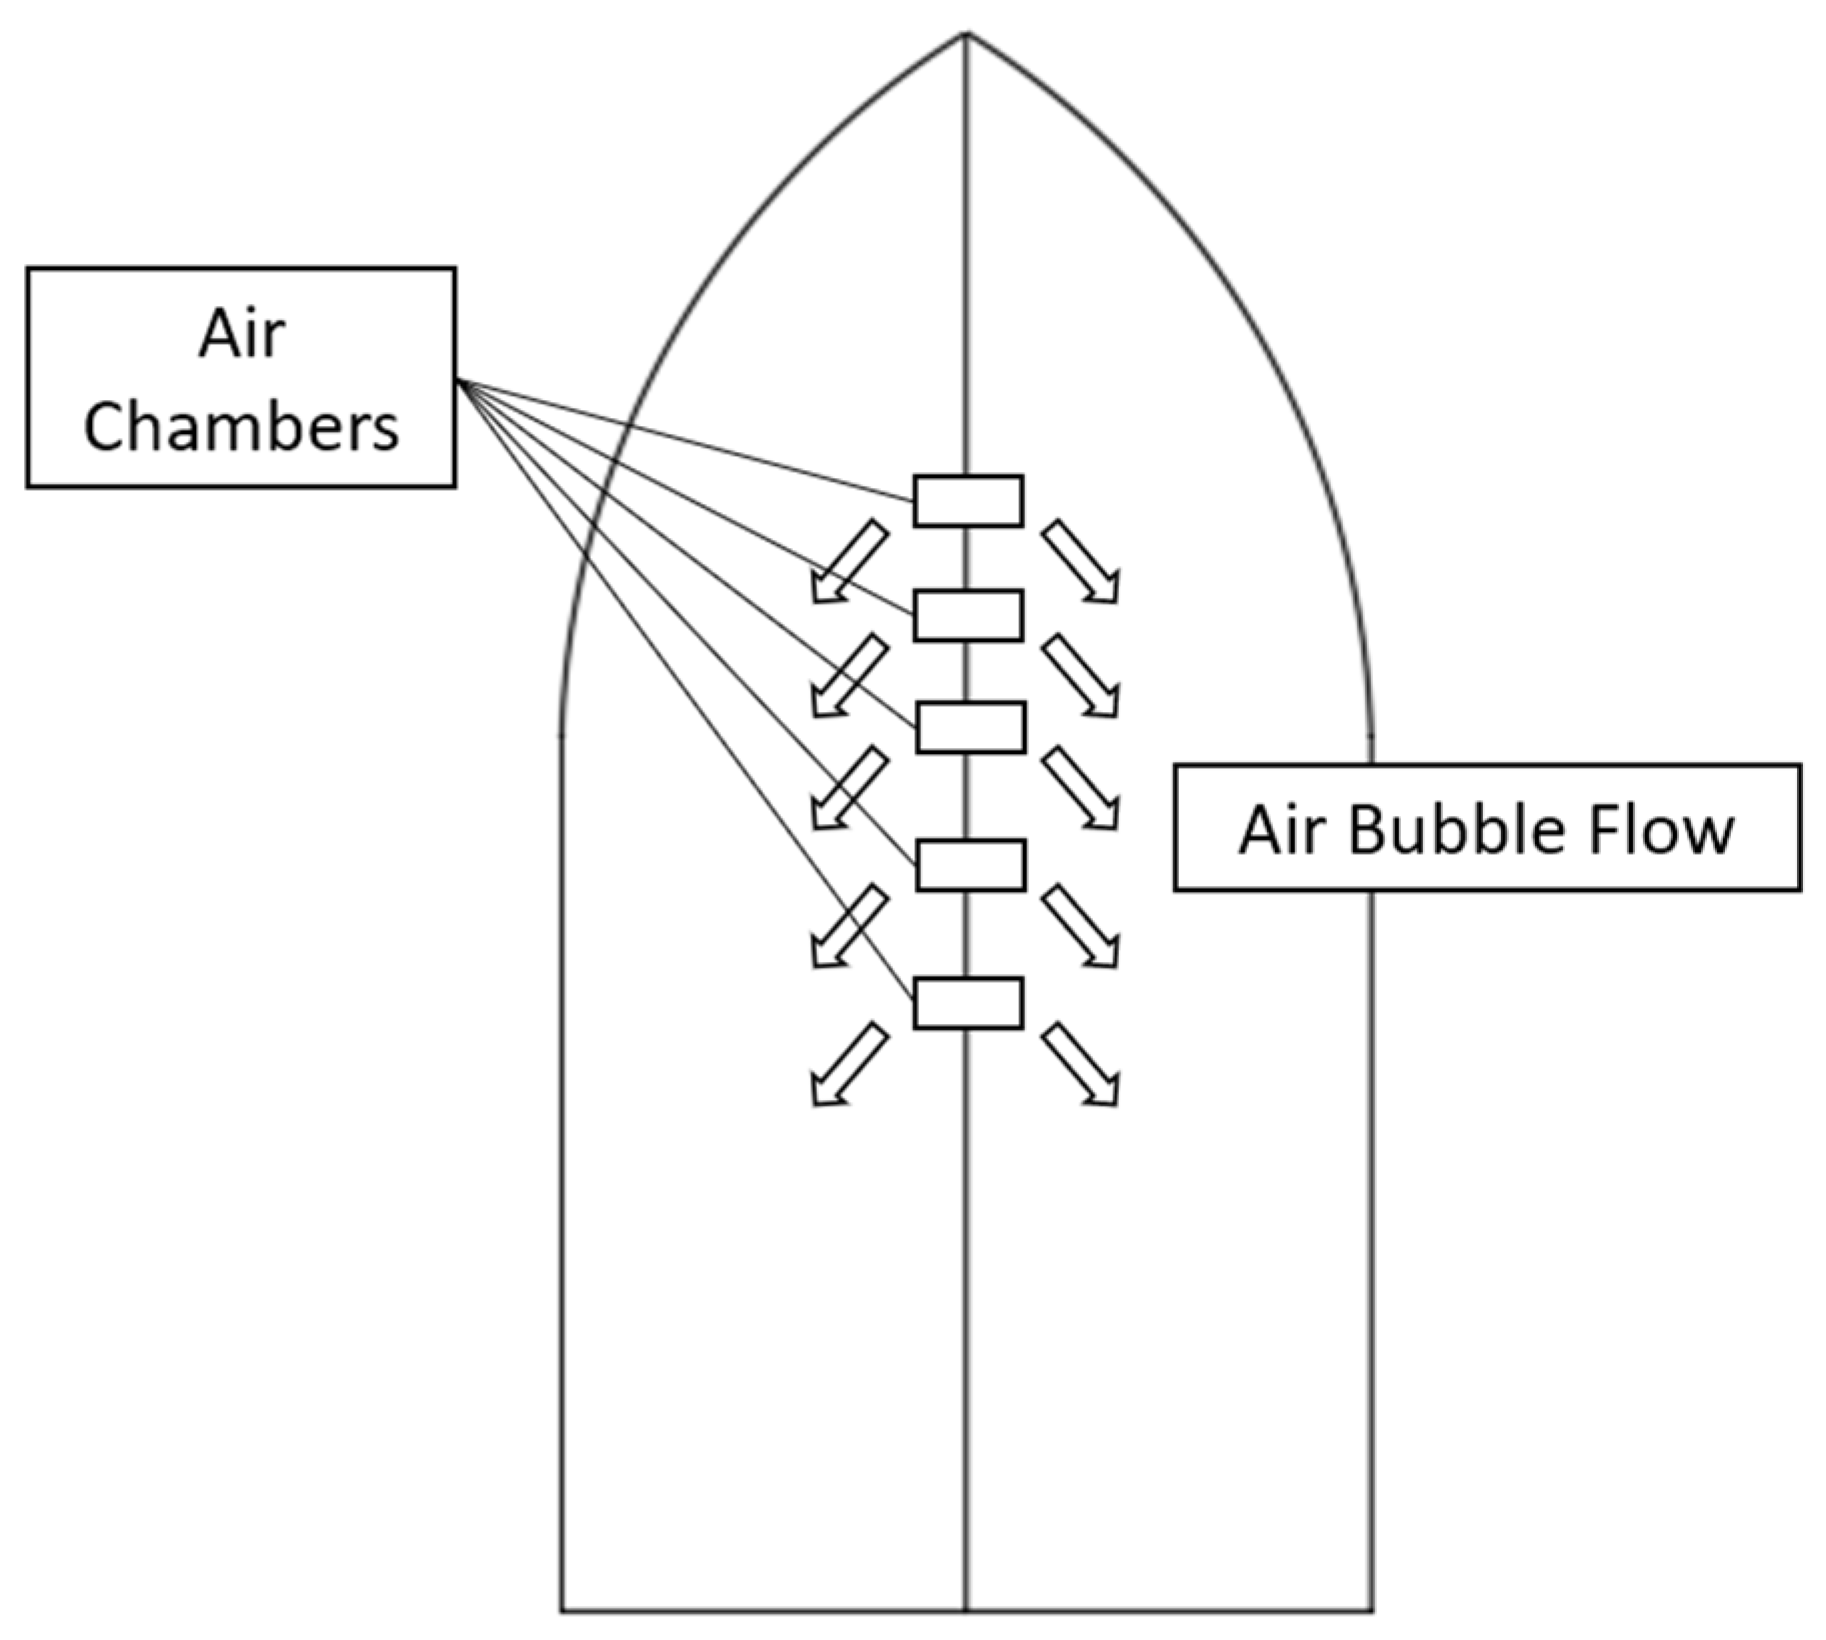
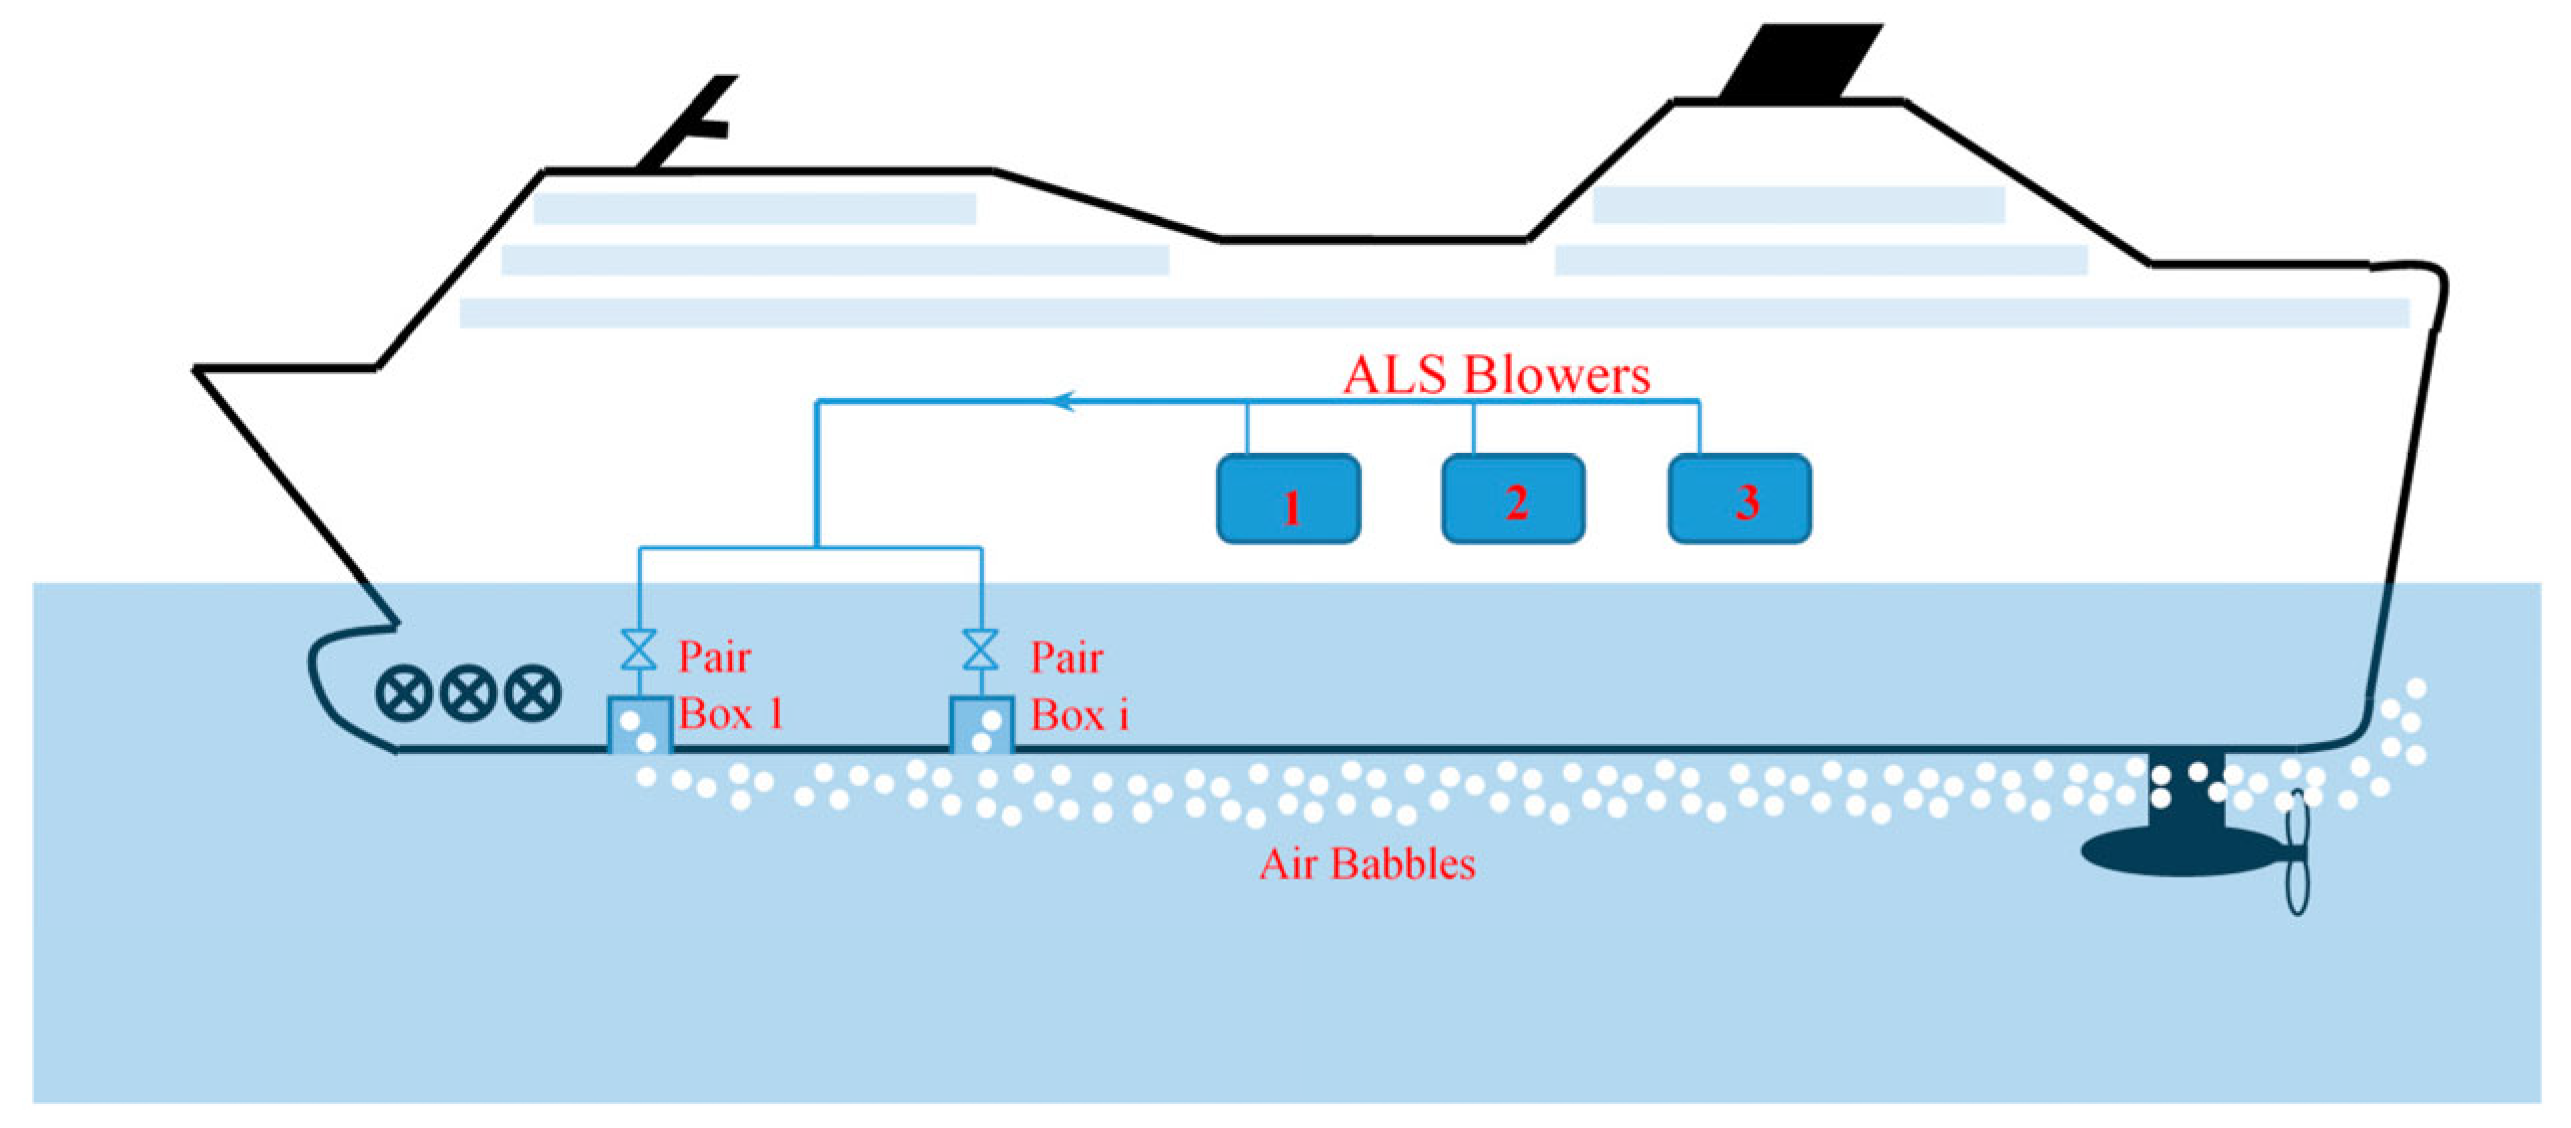
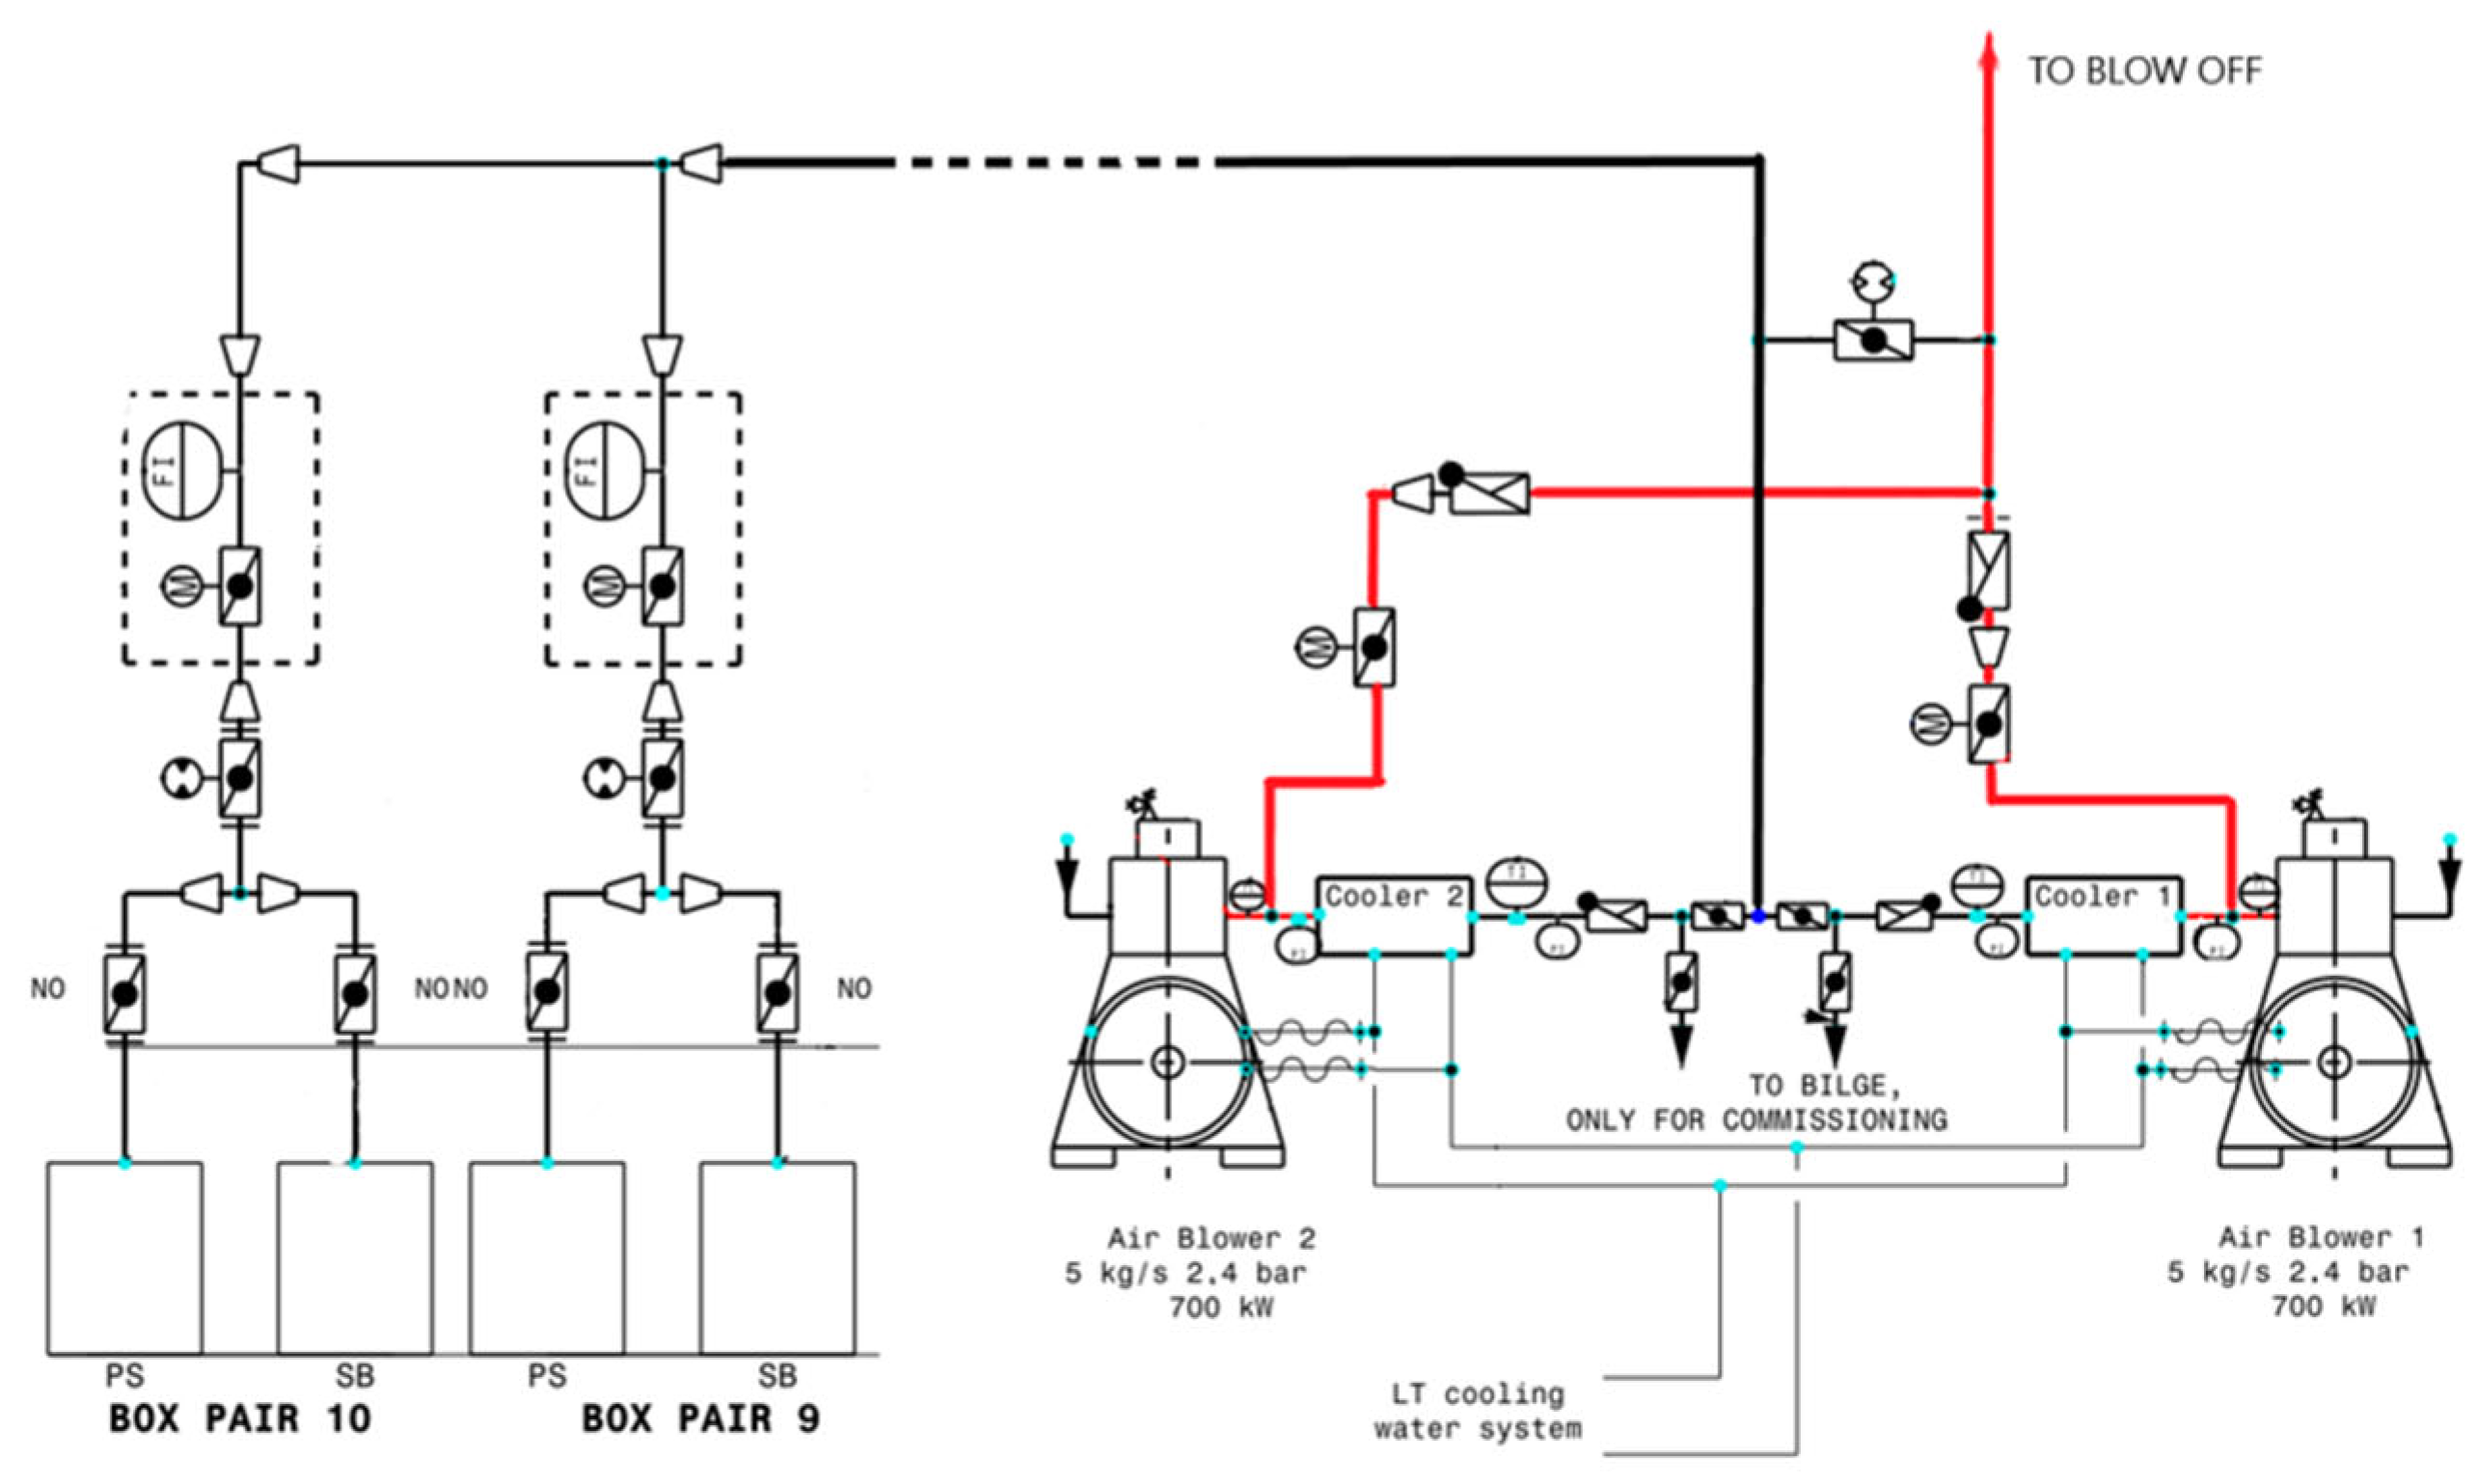
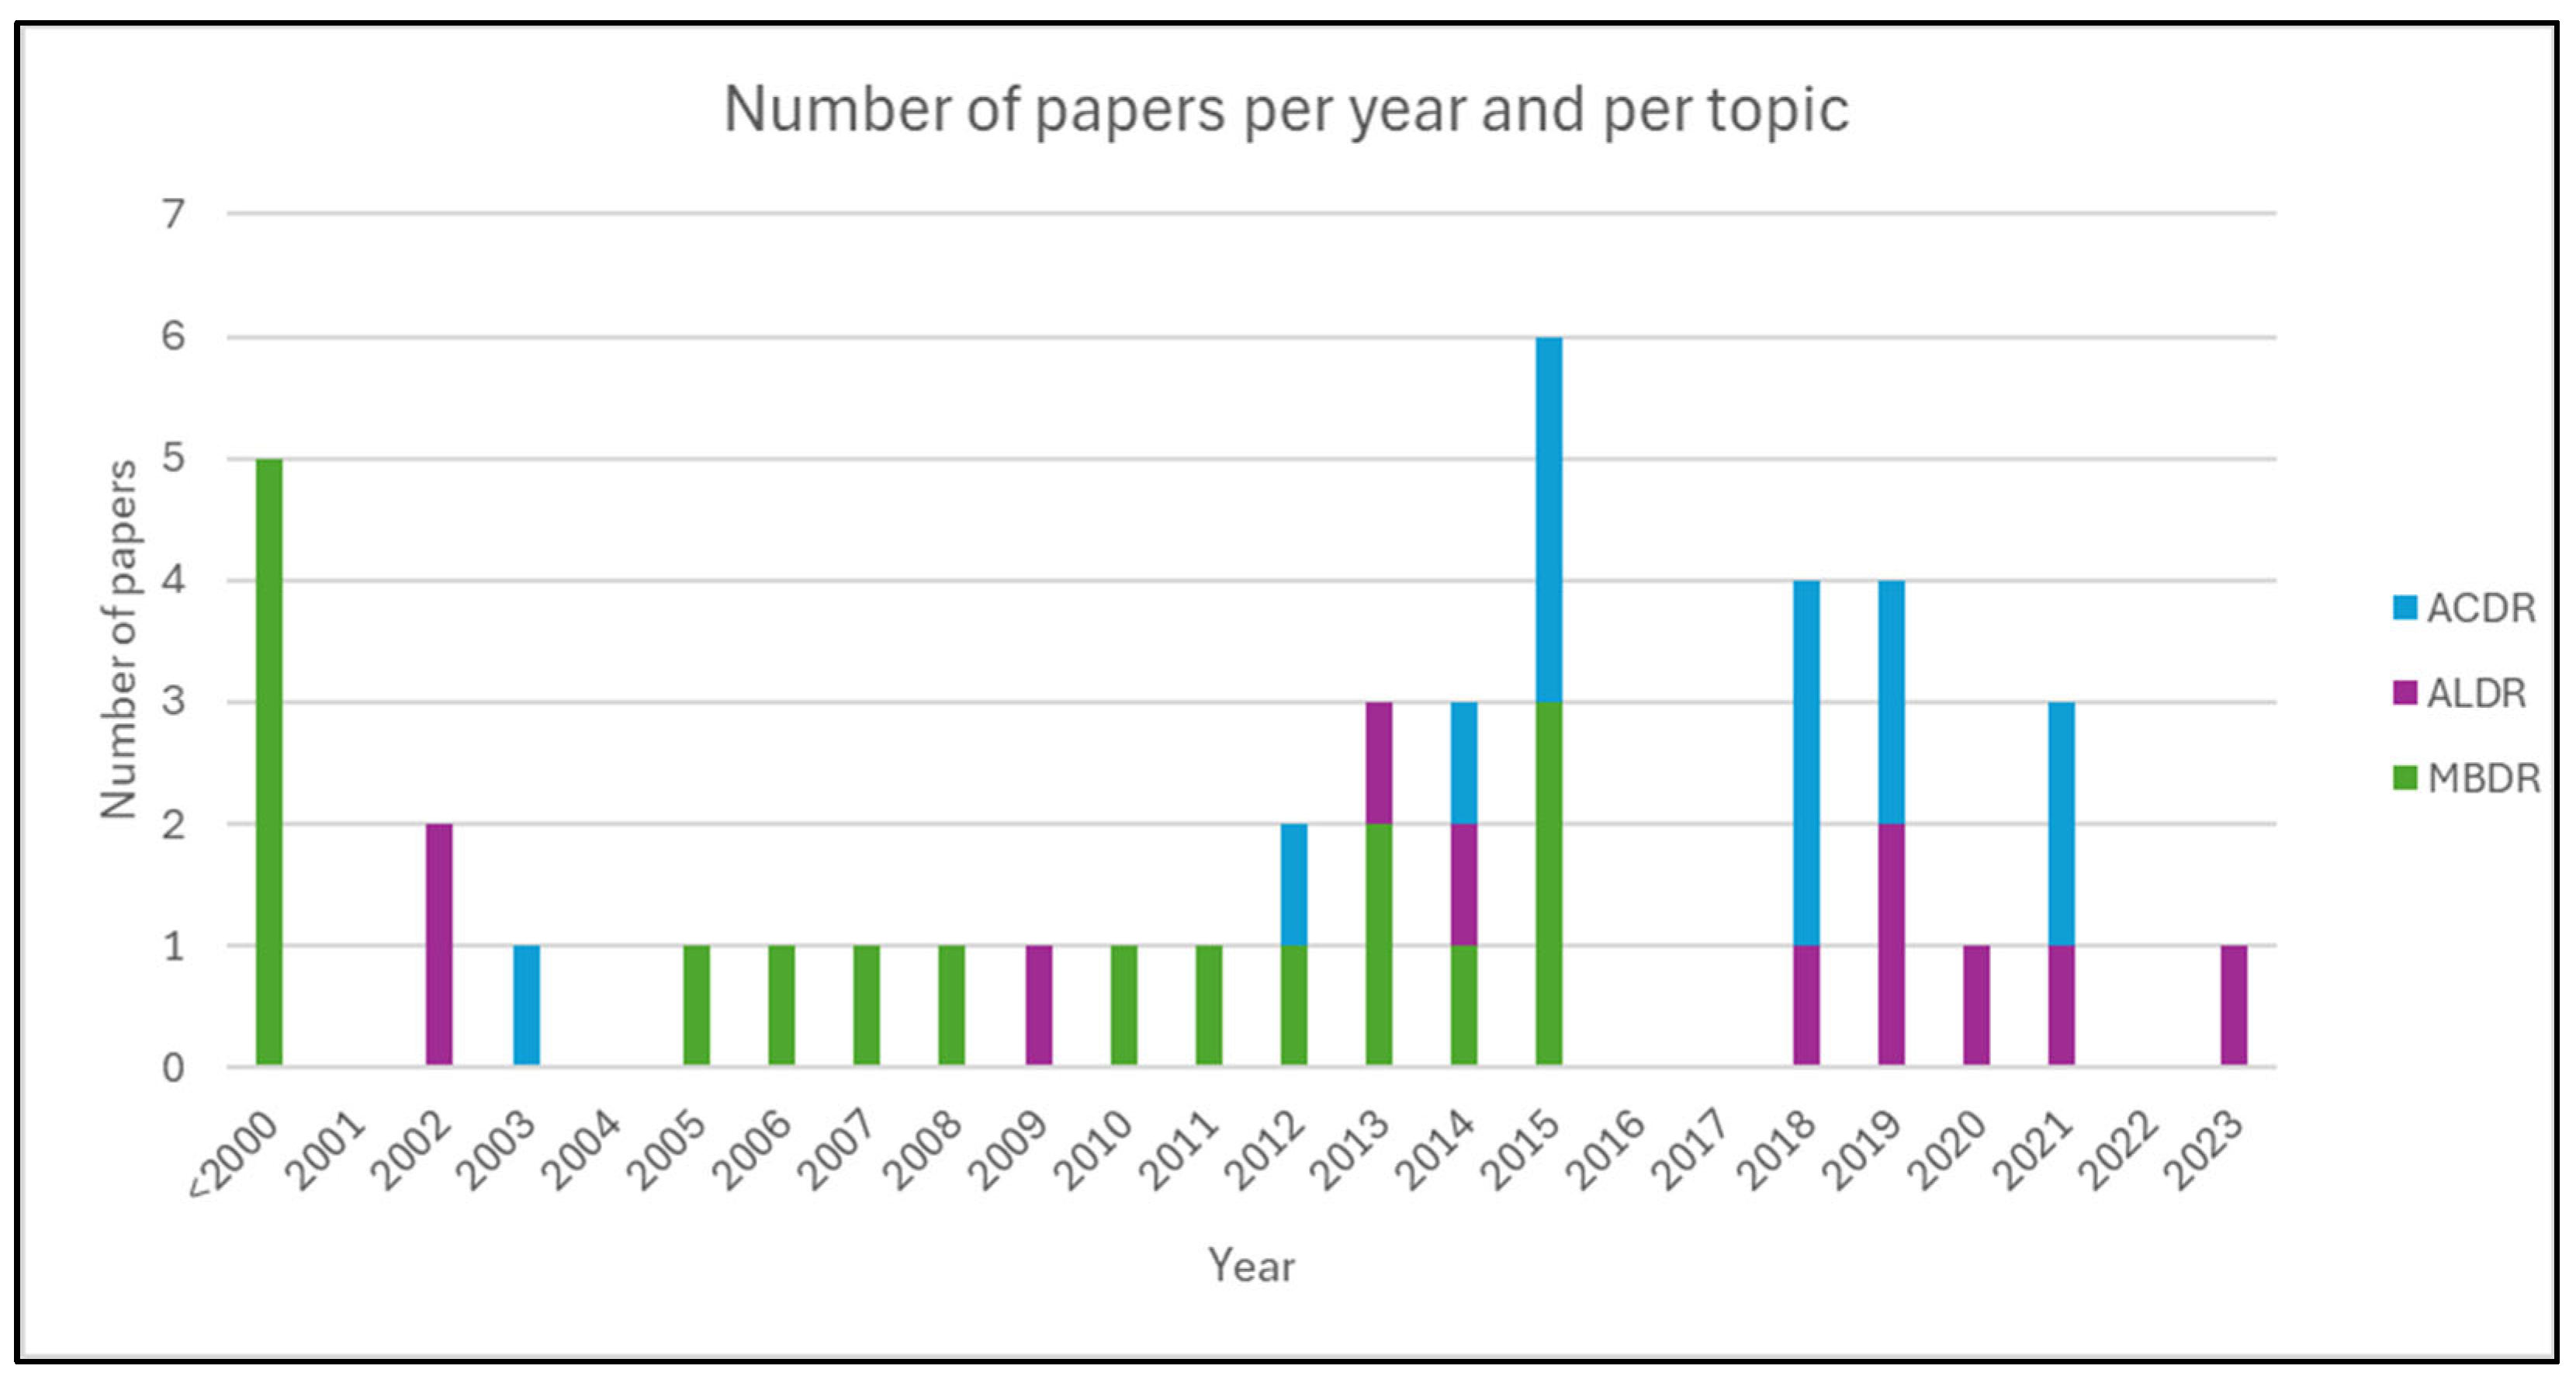
:1. Introduction
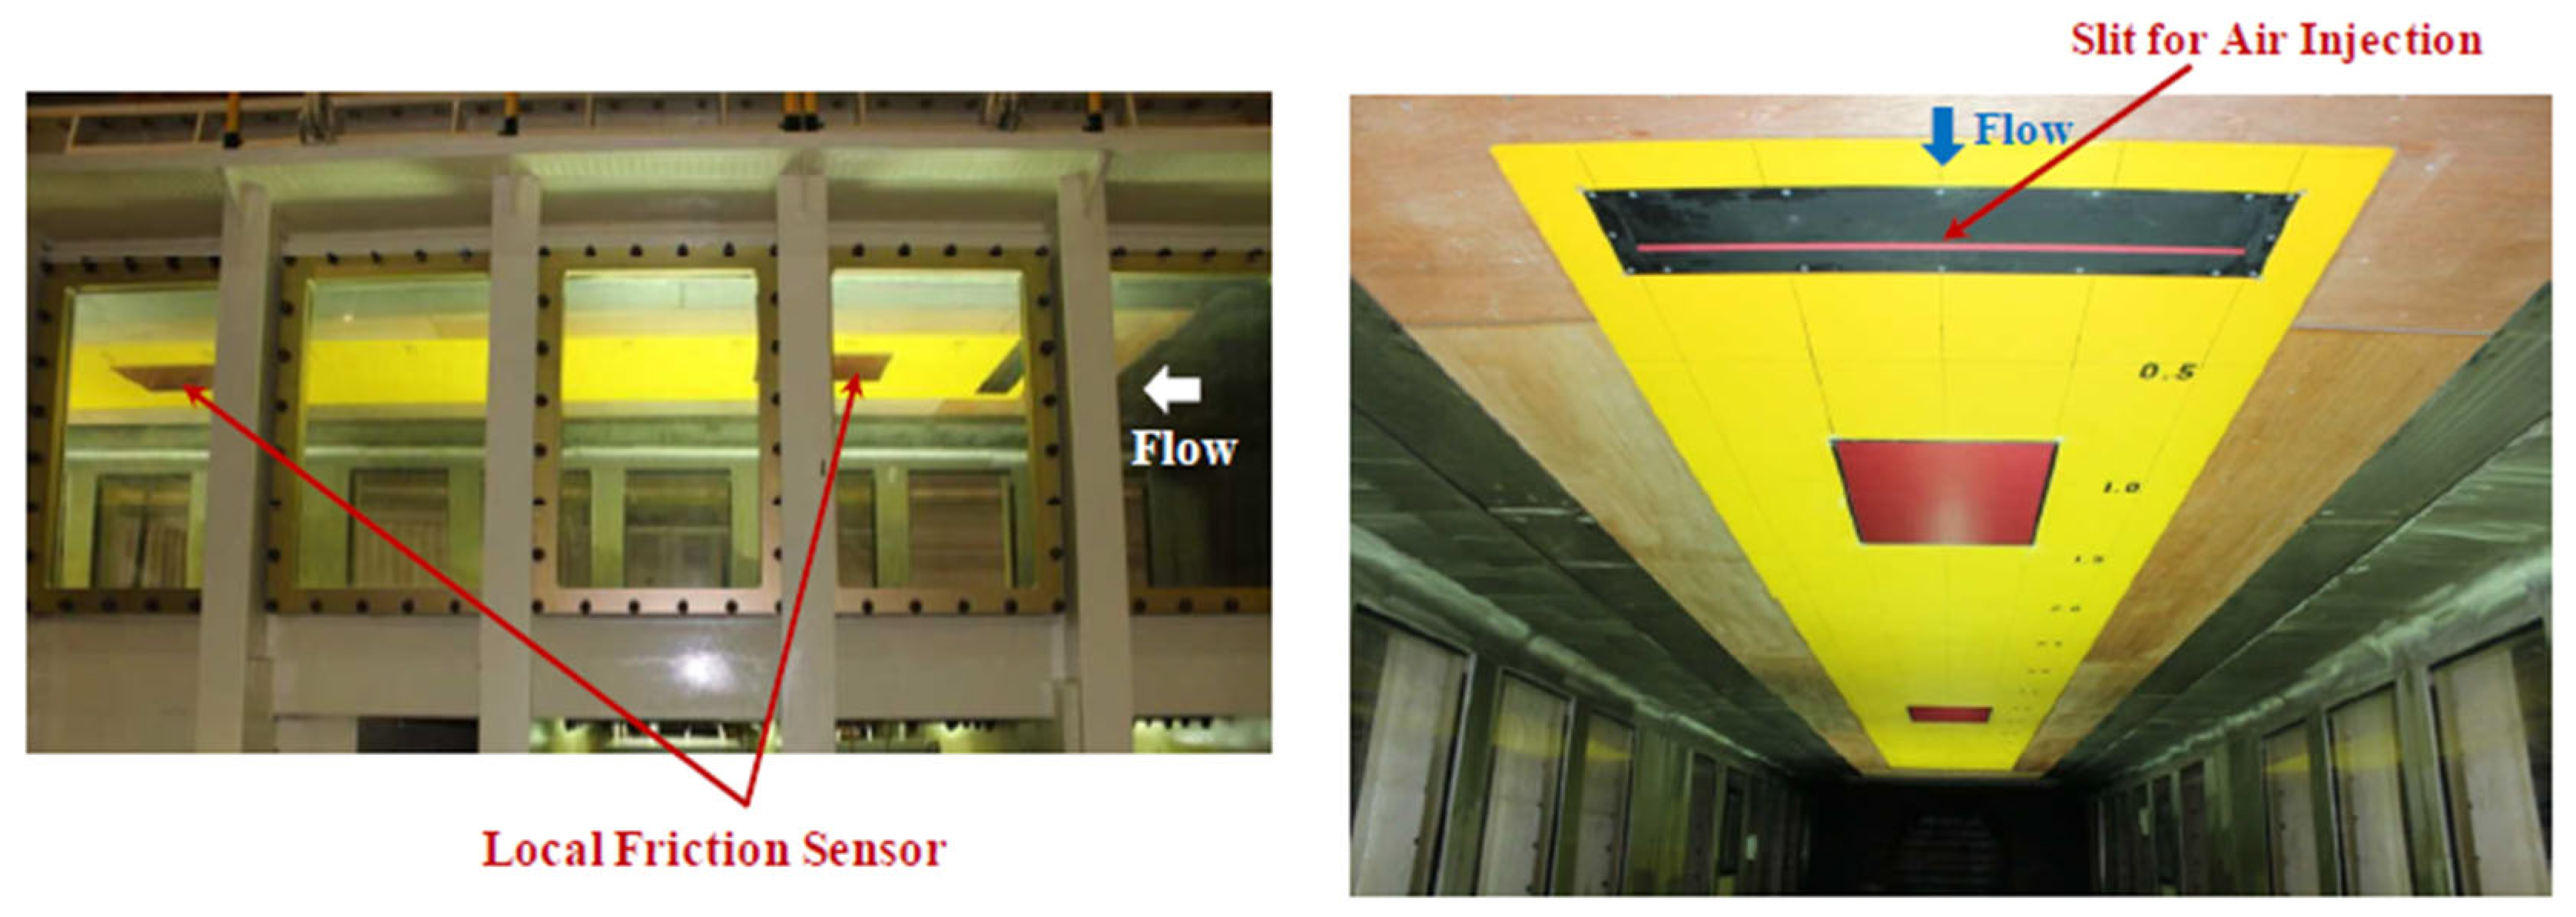
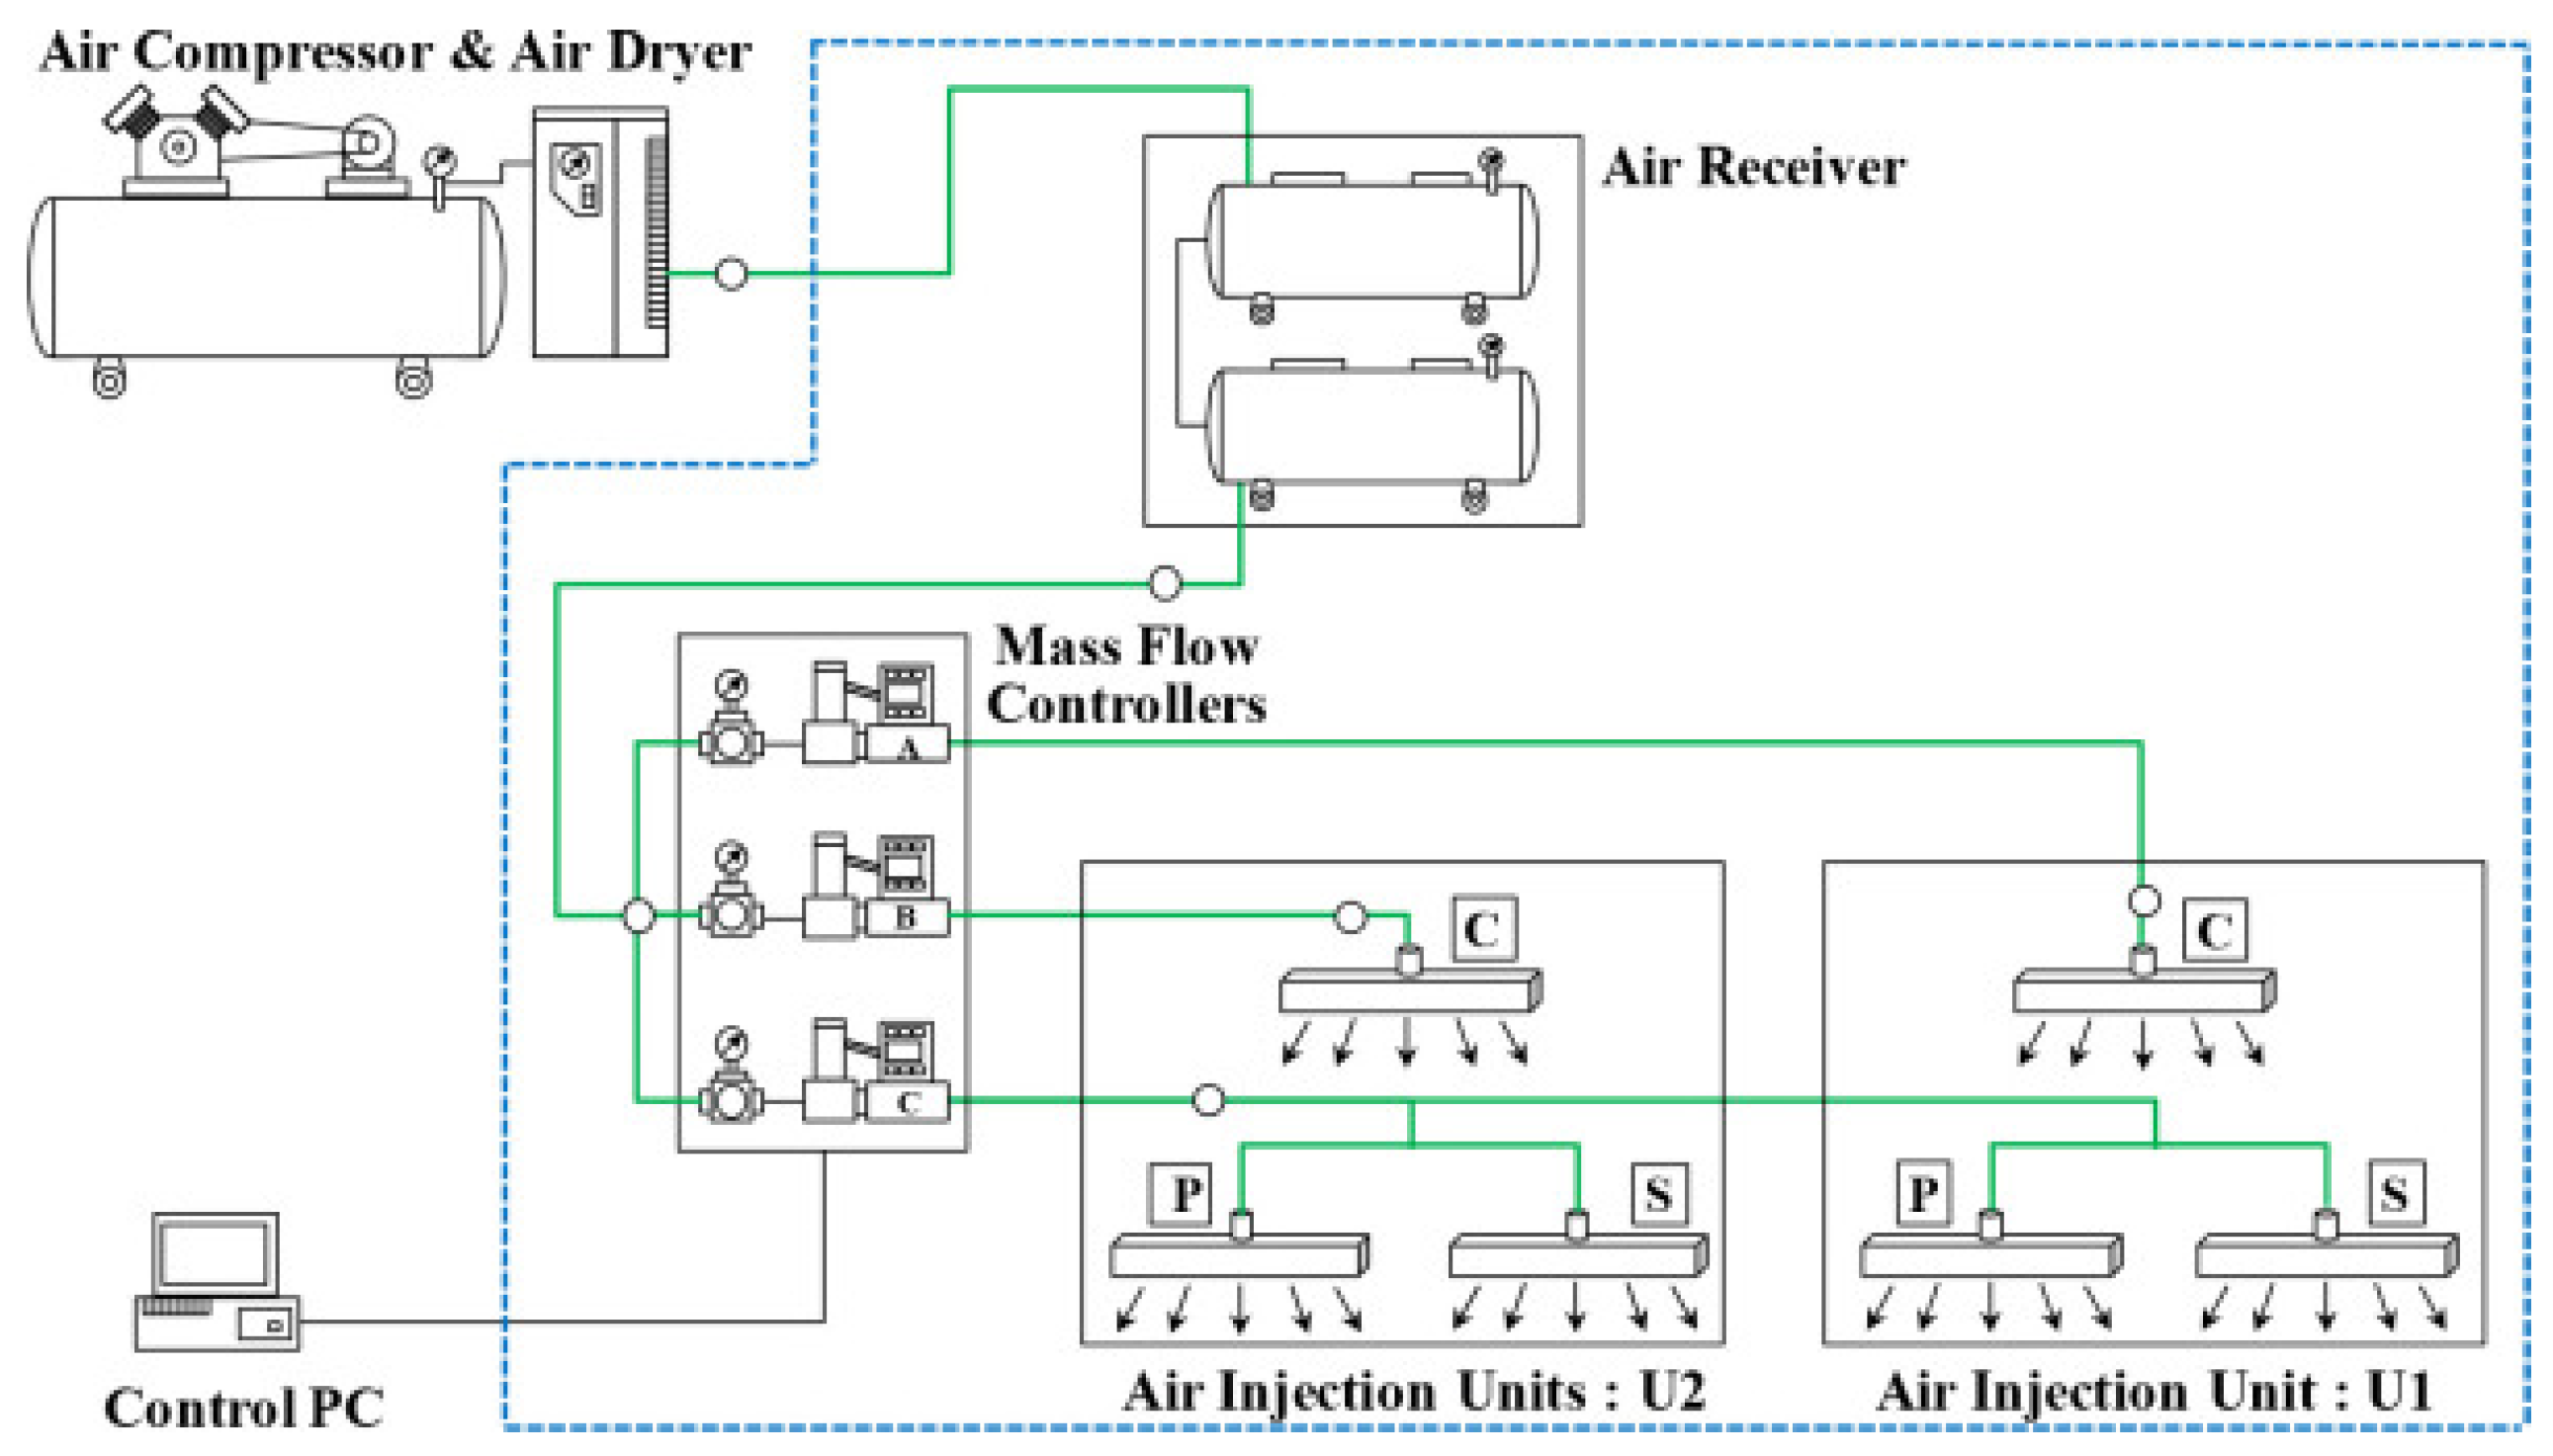
2. Experimental Studies
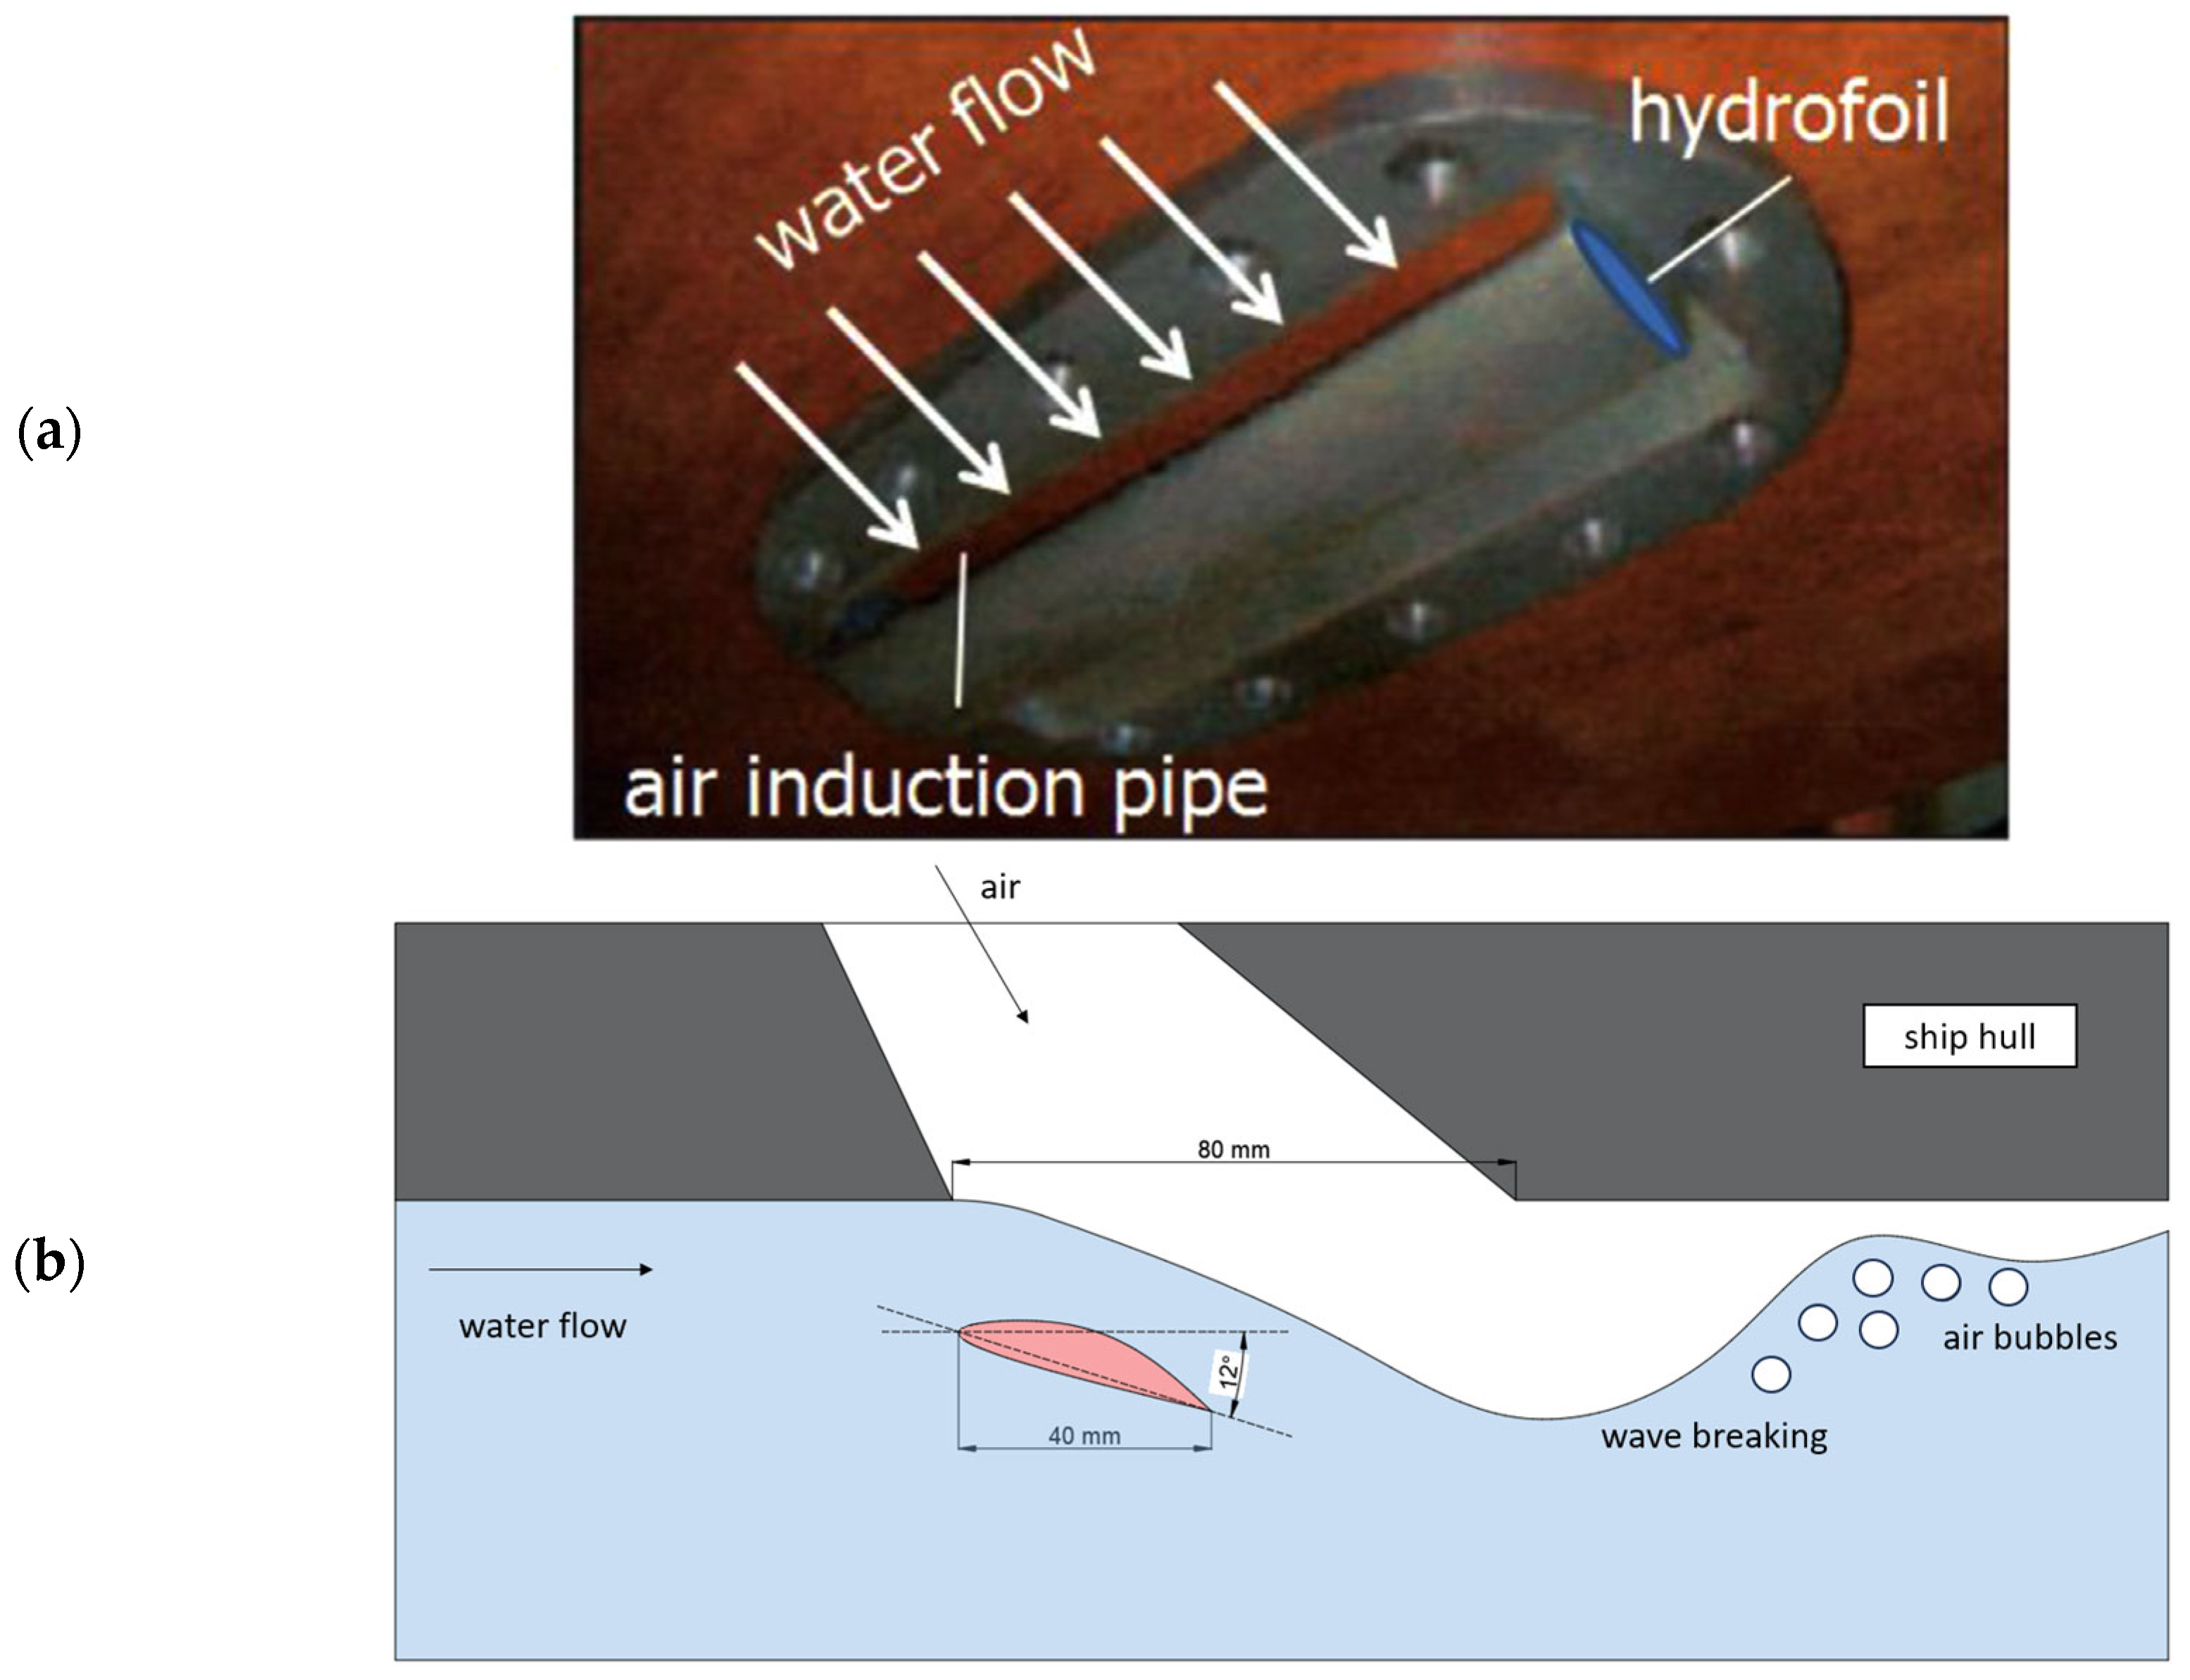
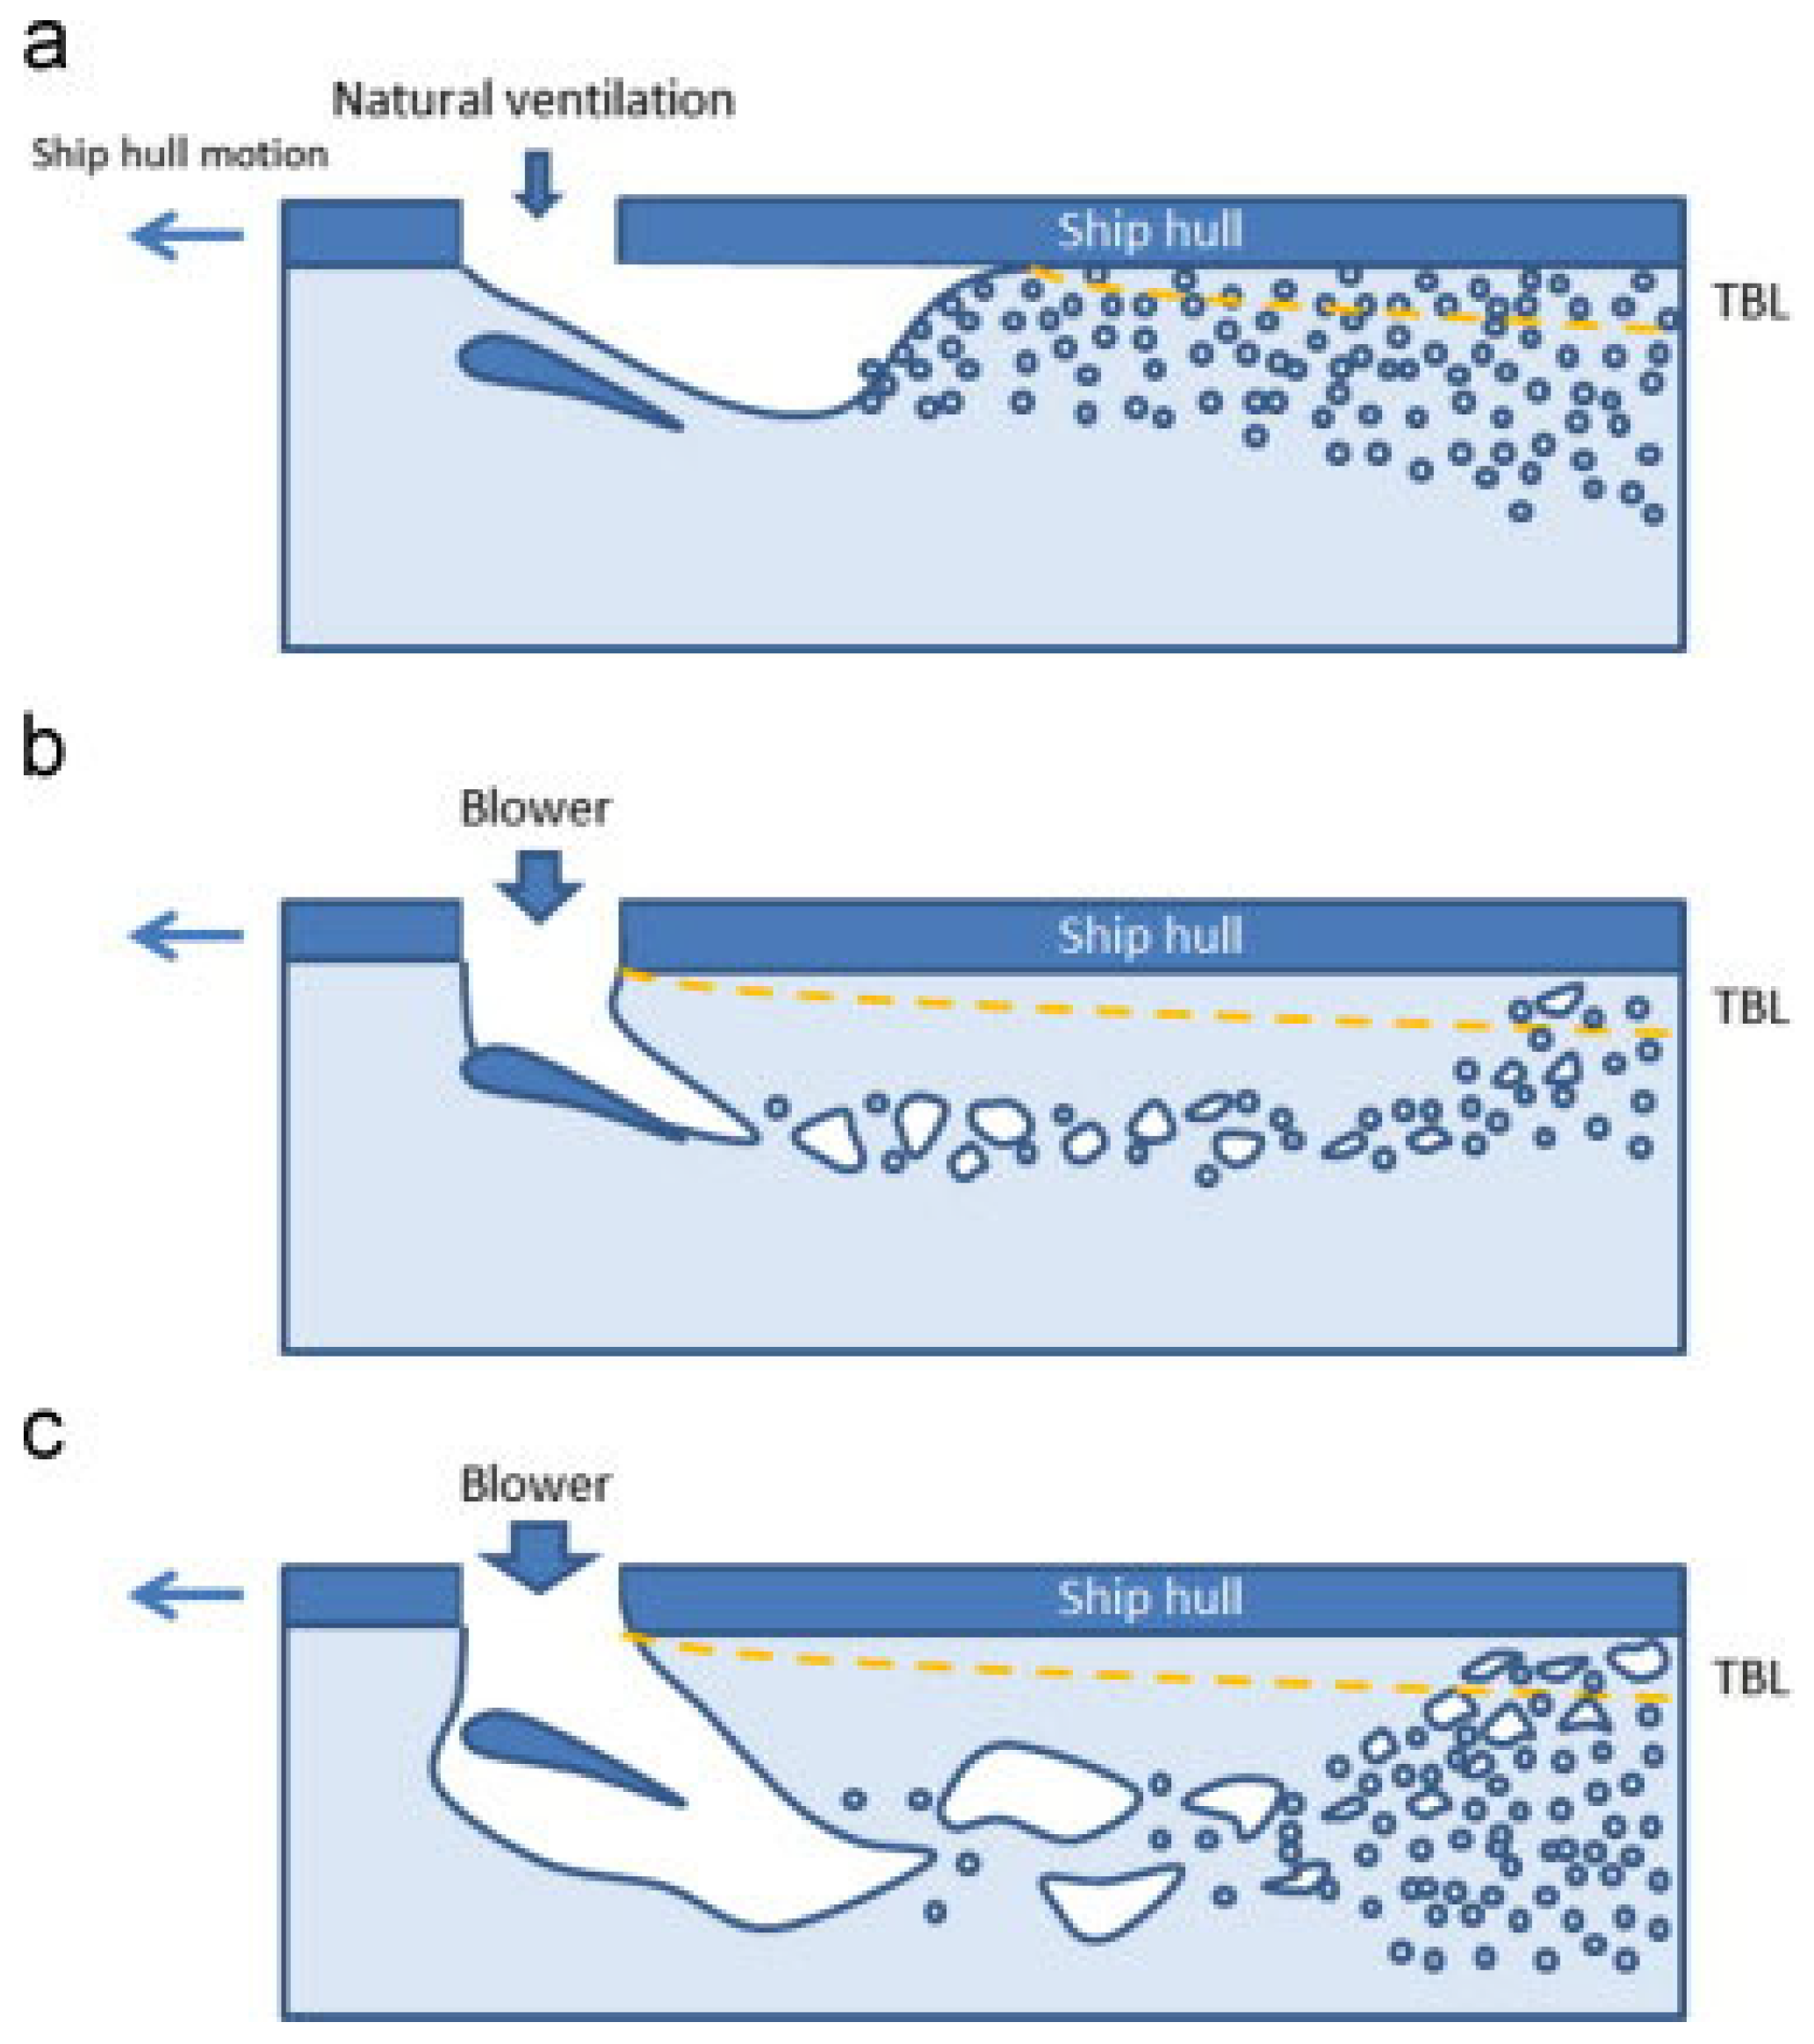
2.1. Tests Performed on MBDR
2.2. Tests Performed on ALDR
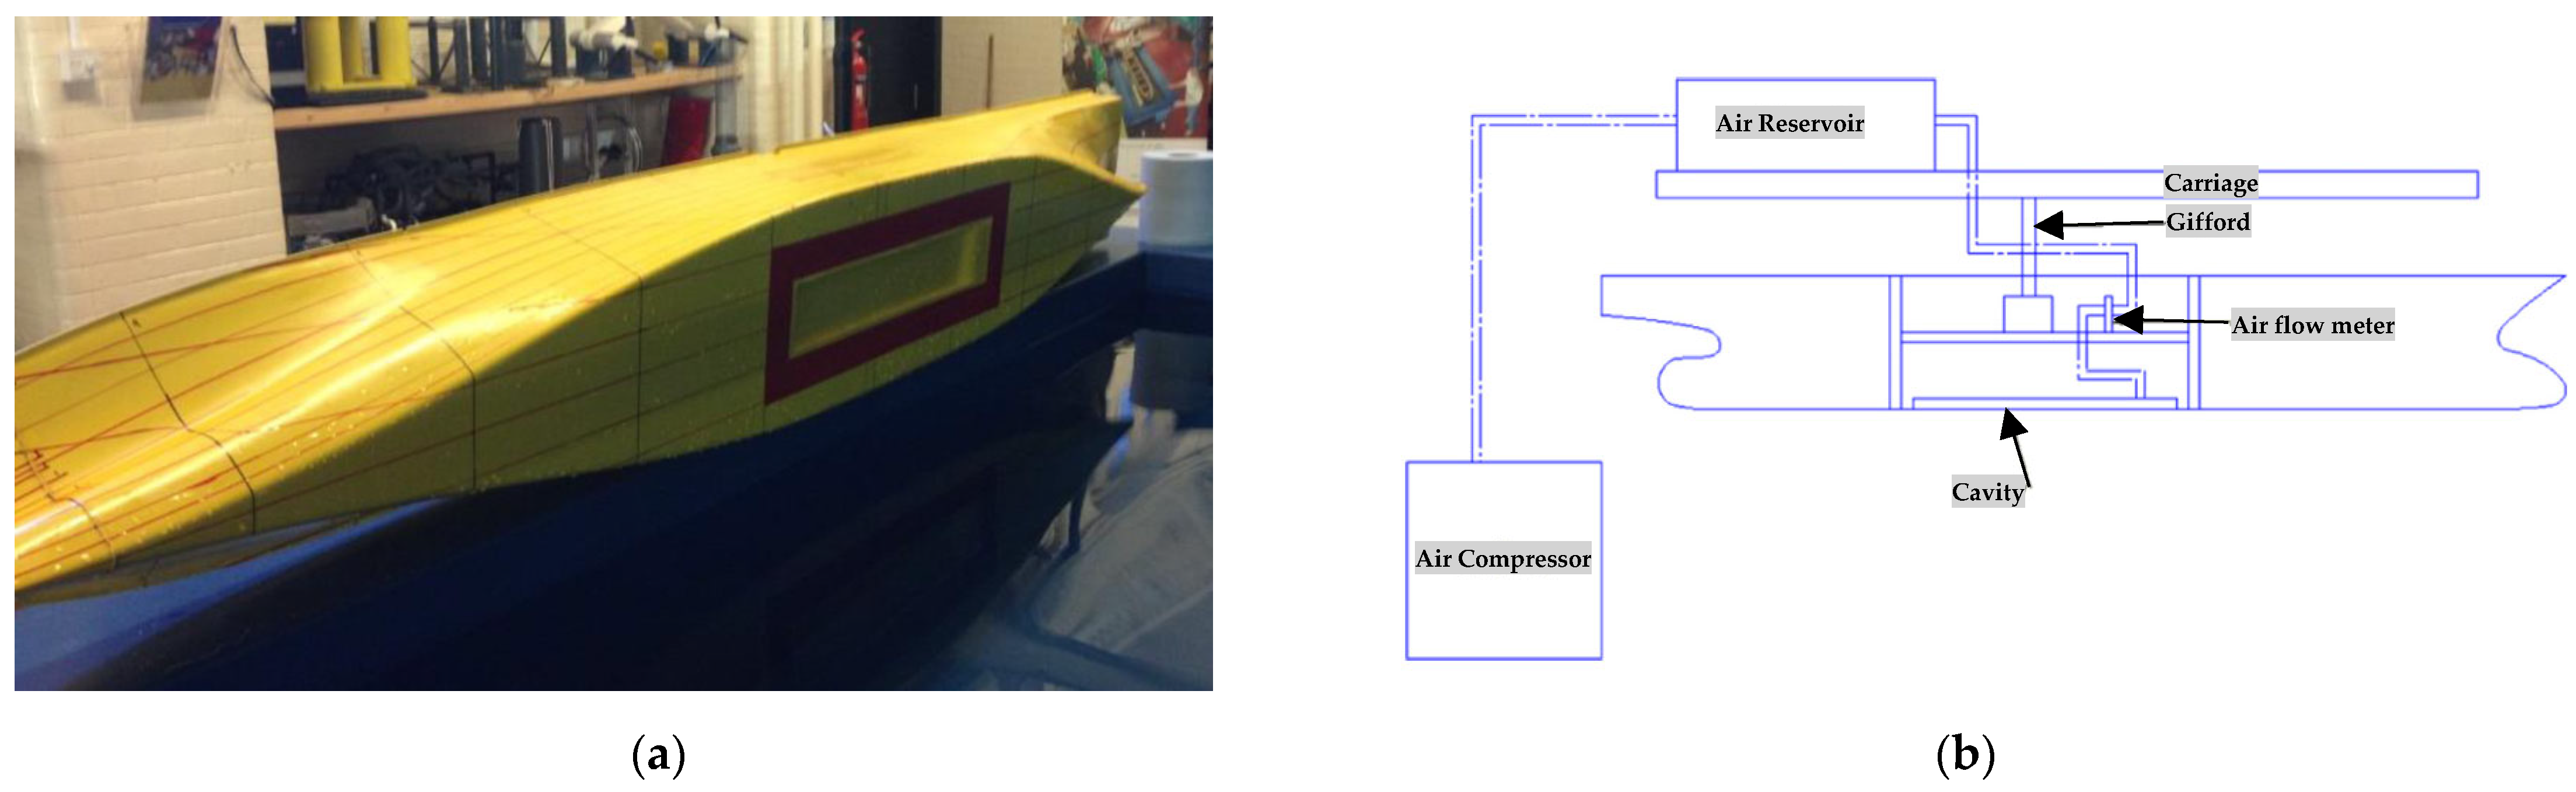
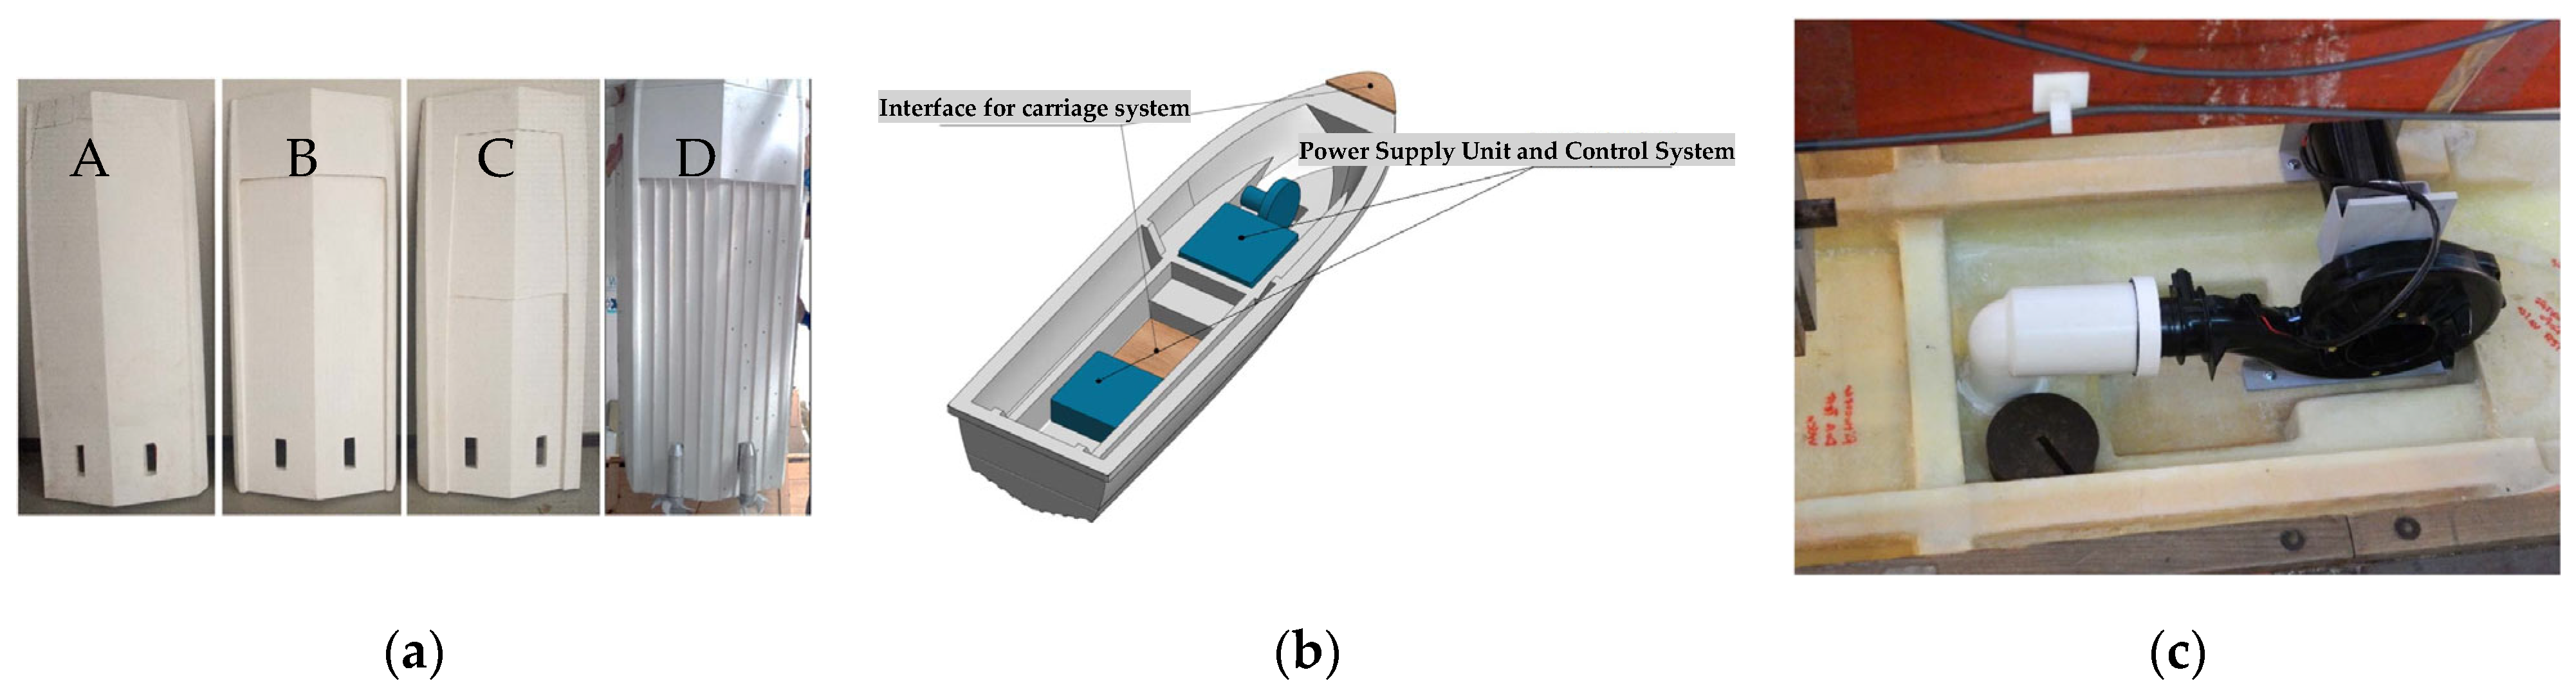
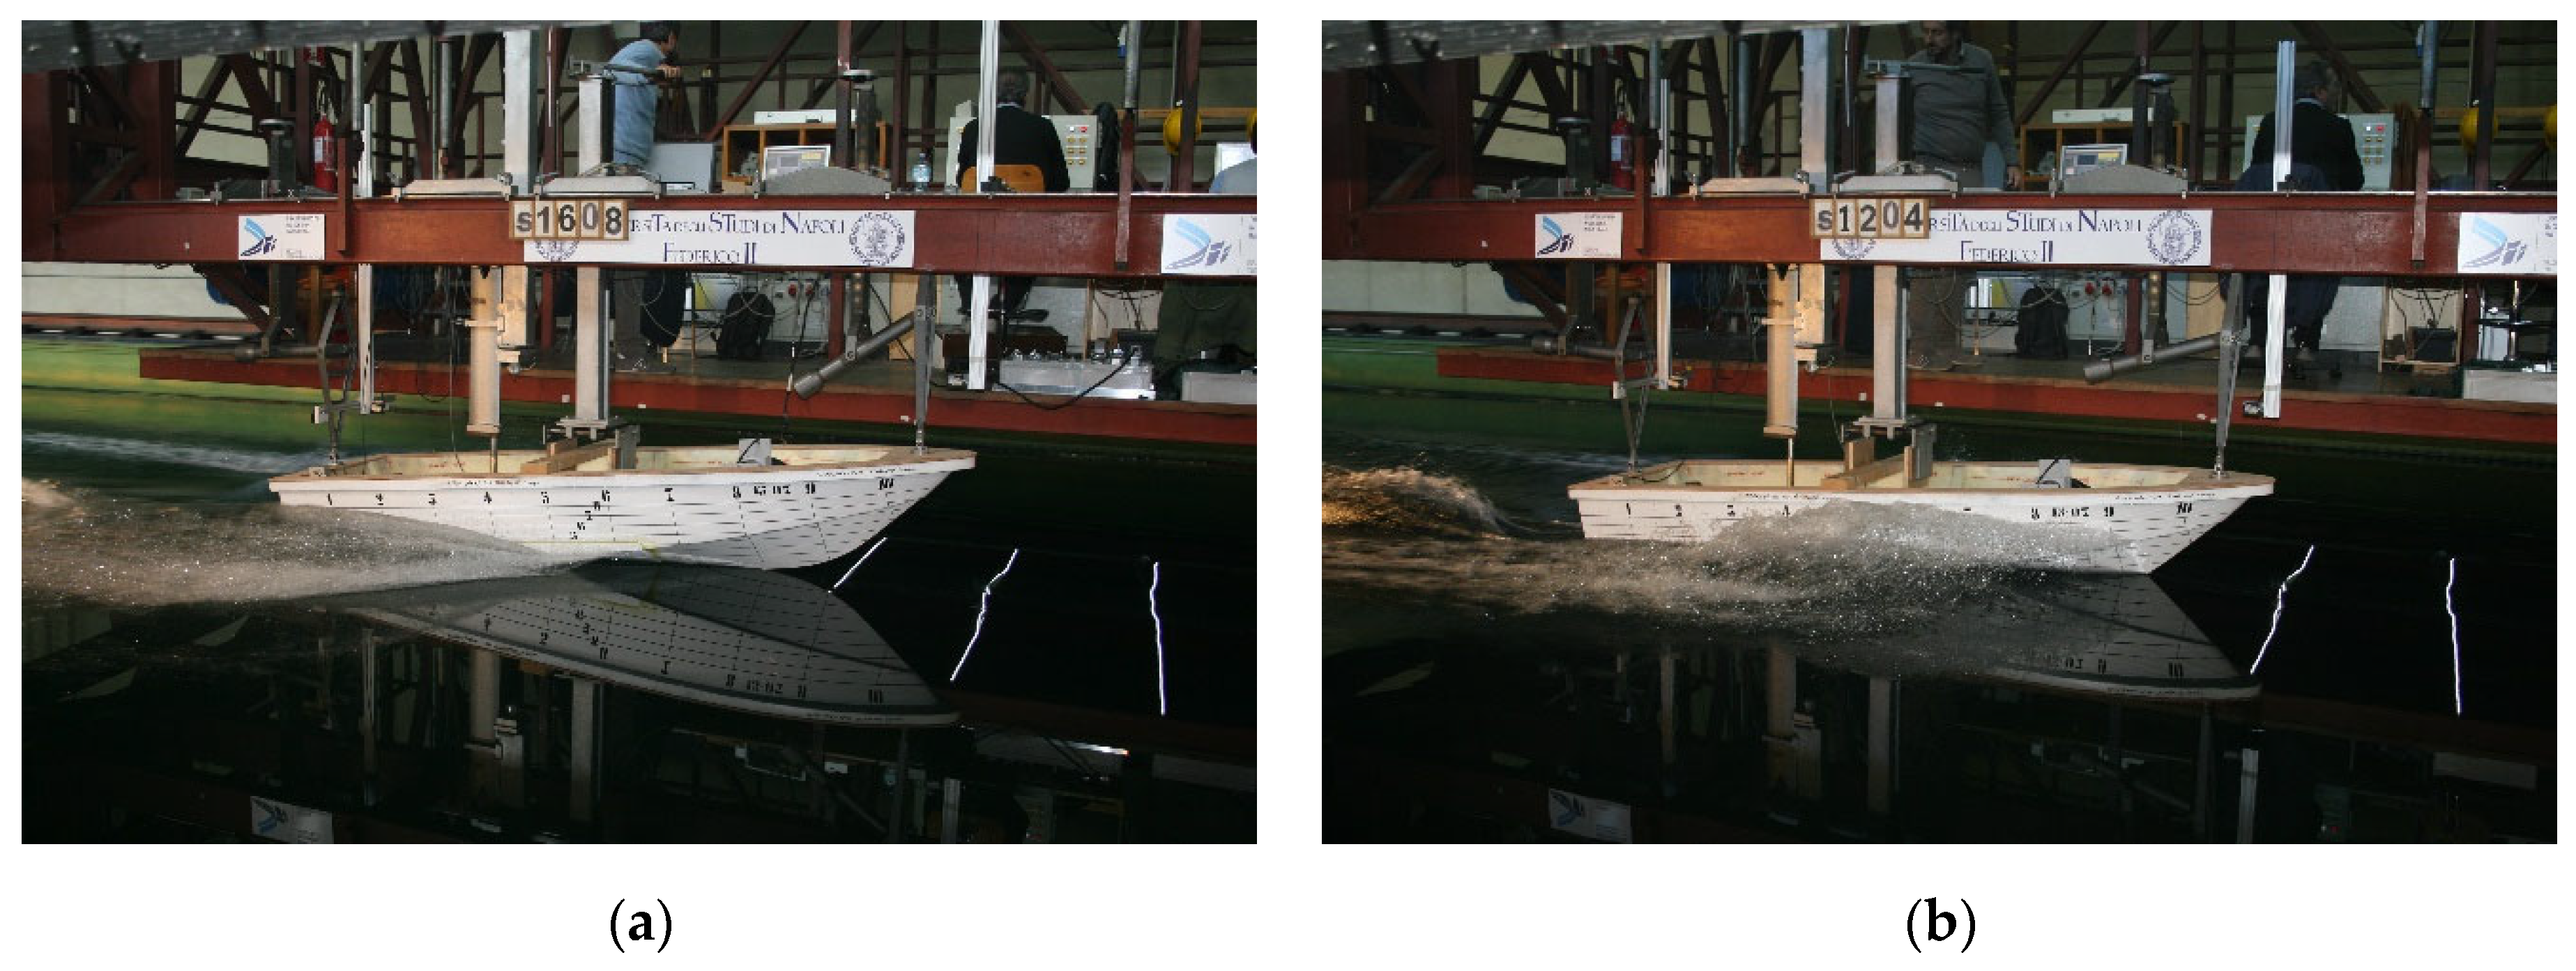
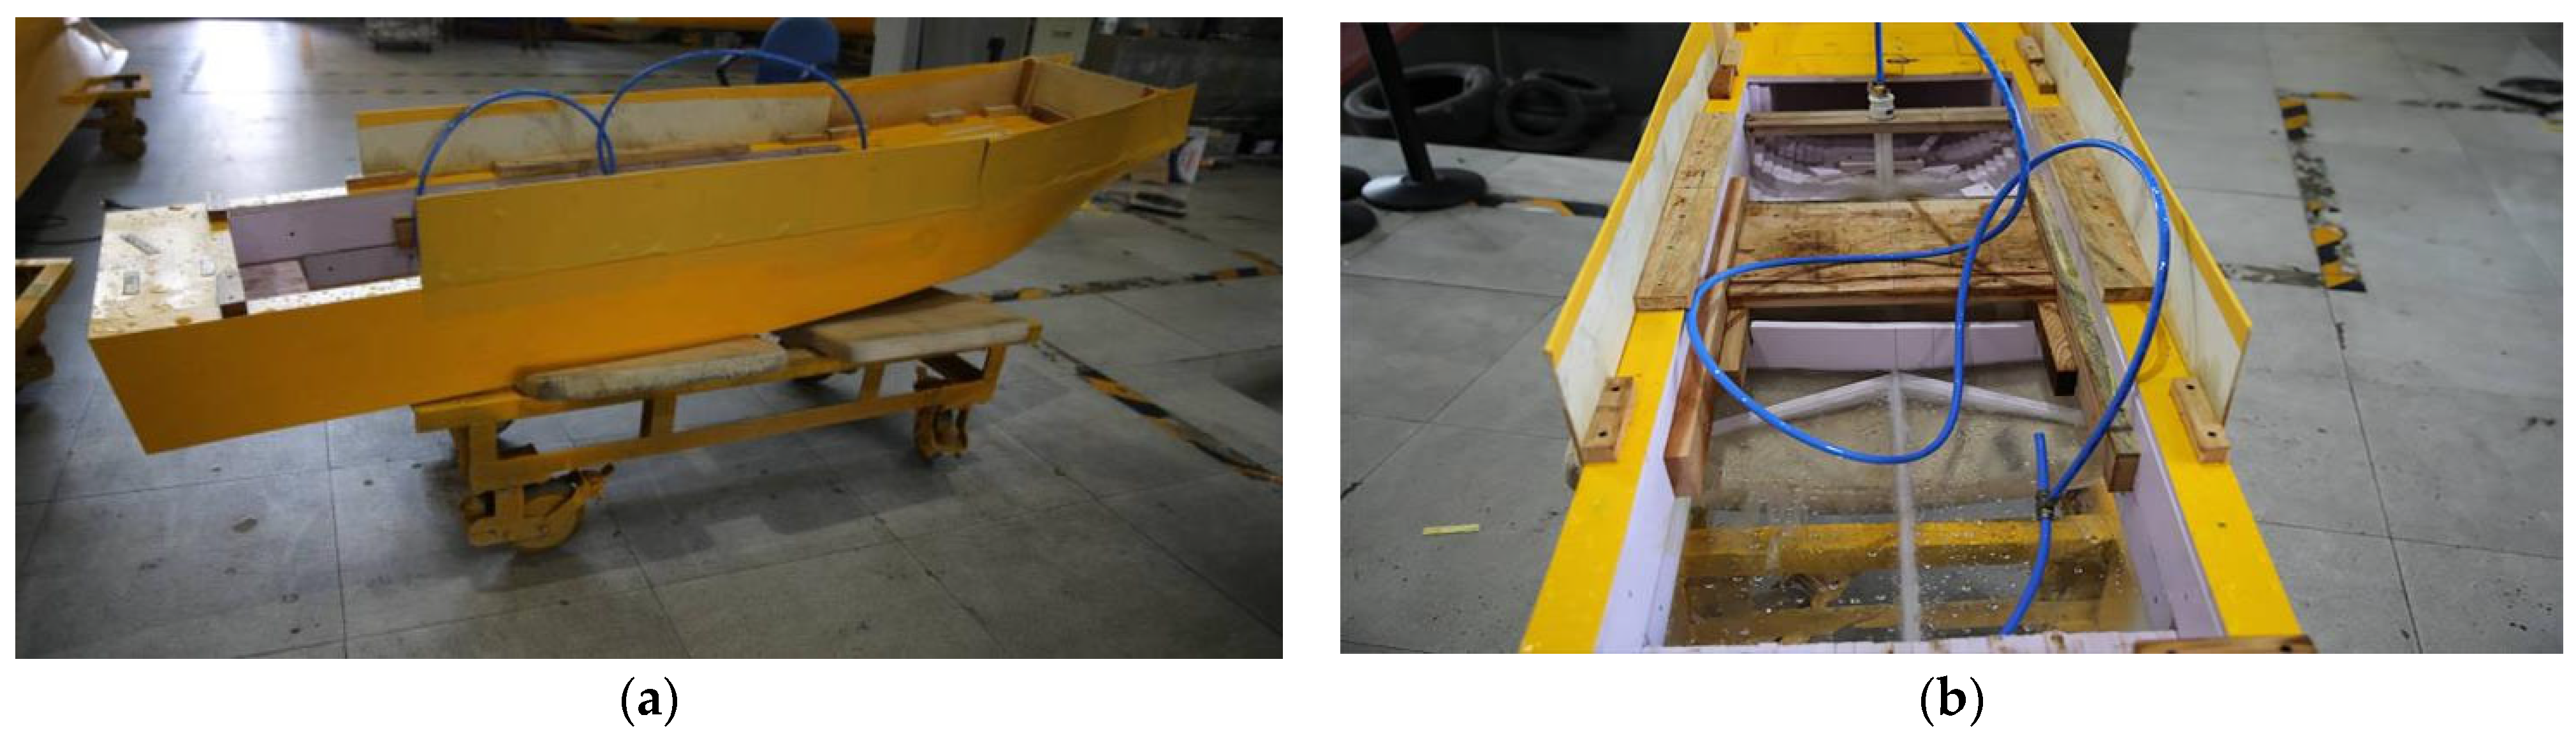
2.3. Tests Performed on ACDR
3. Numerical Studies
3.1. CFD Simulations on MBDR
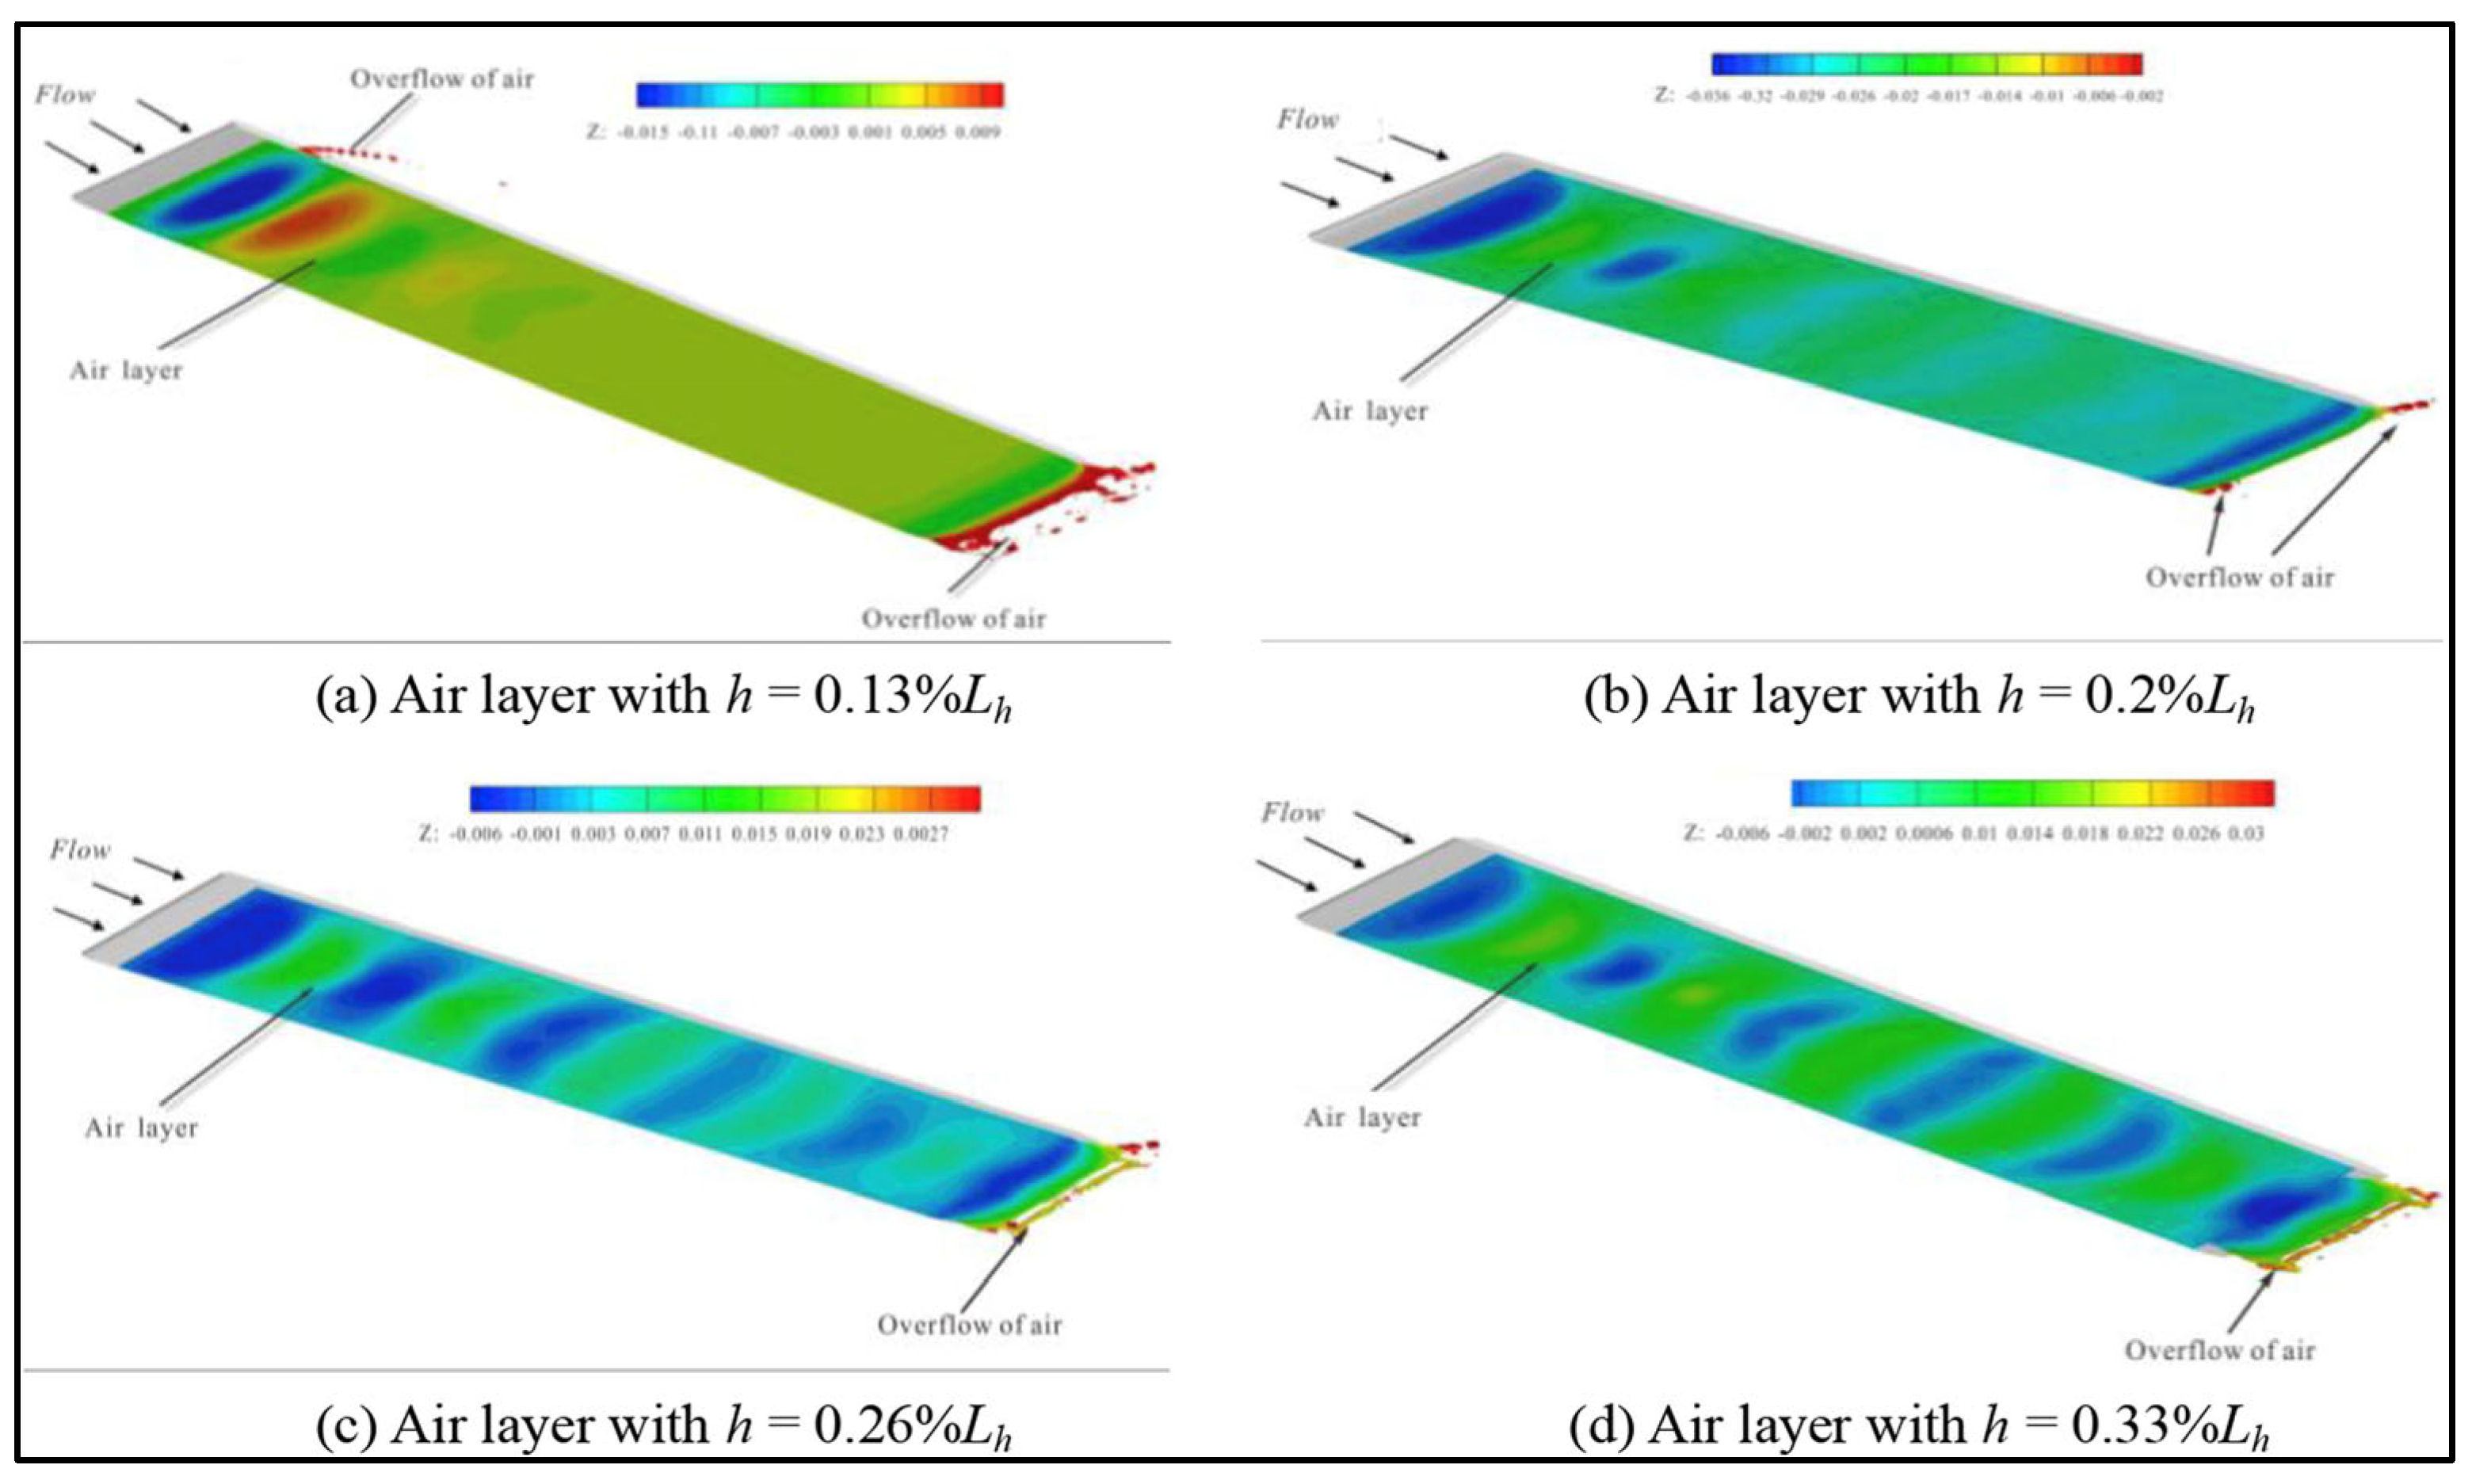
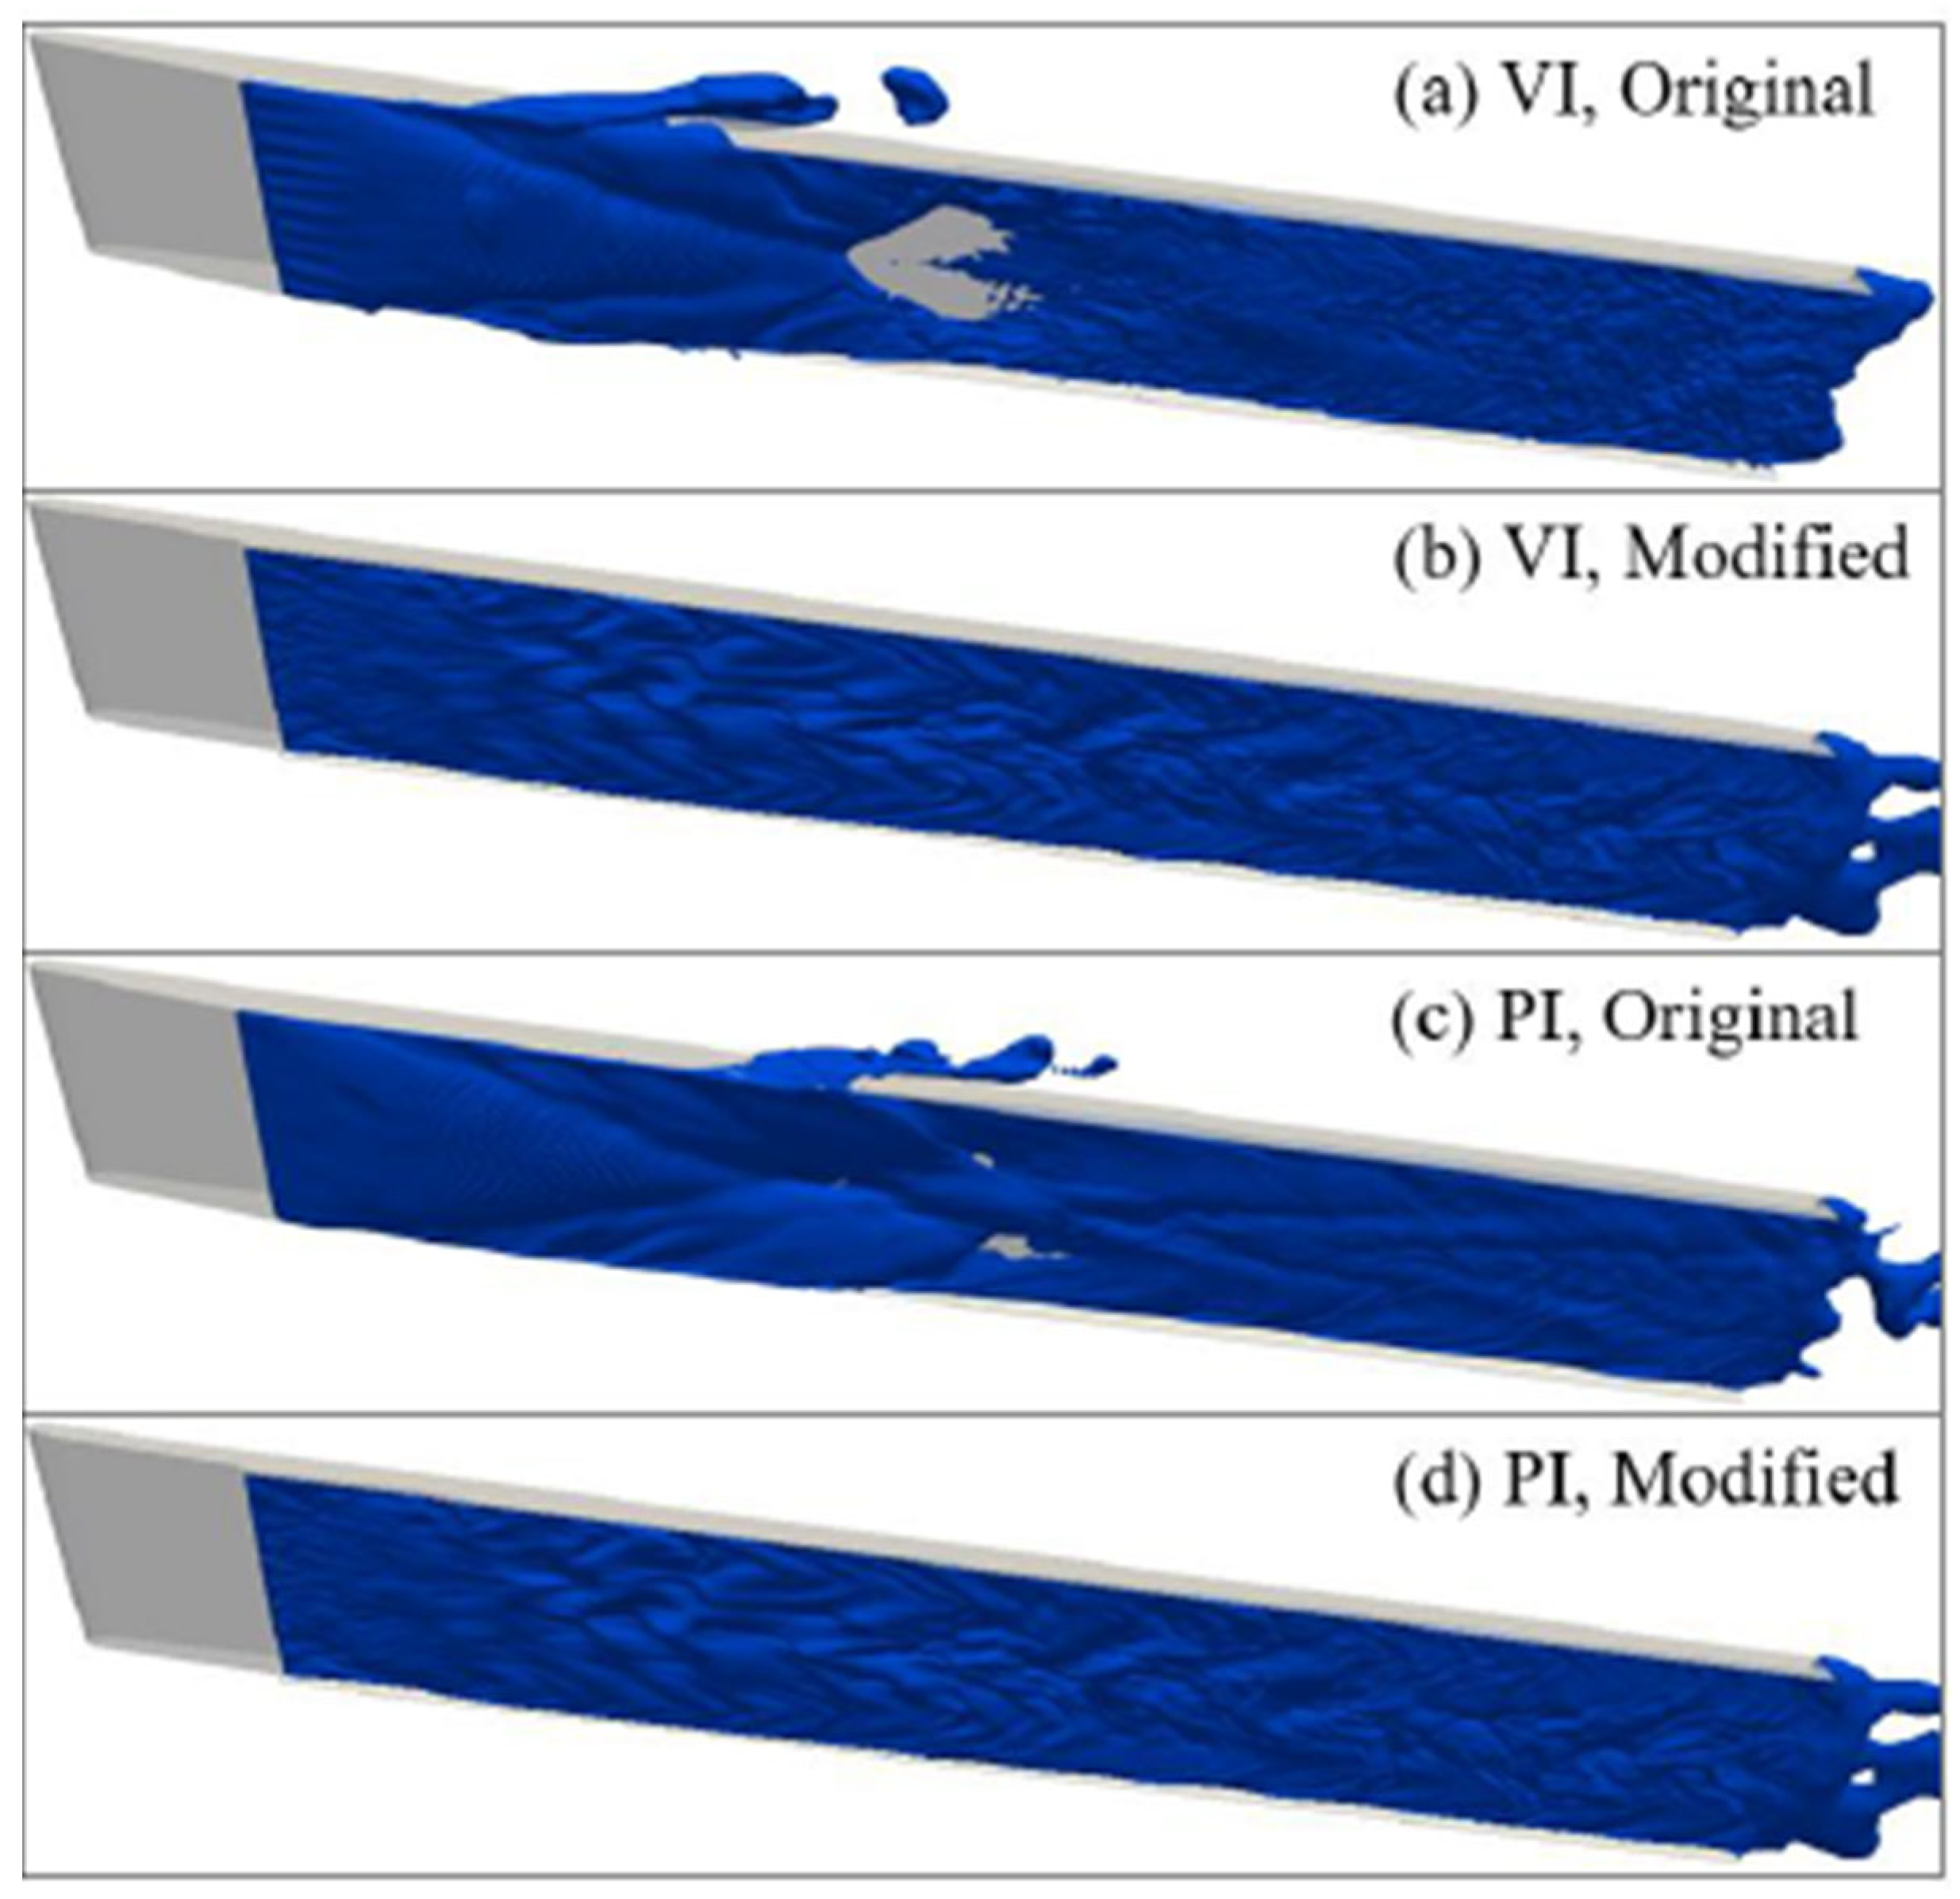
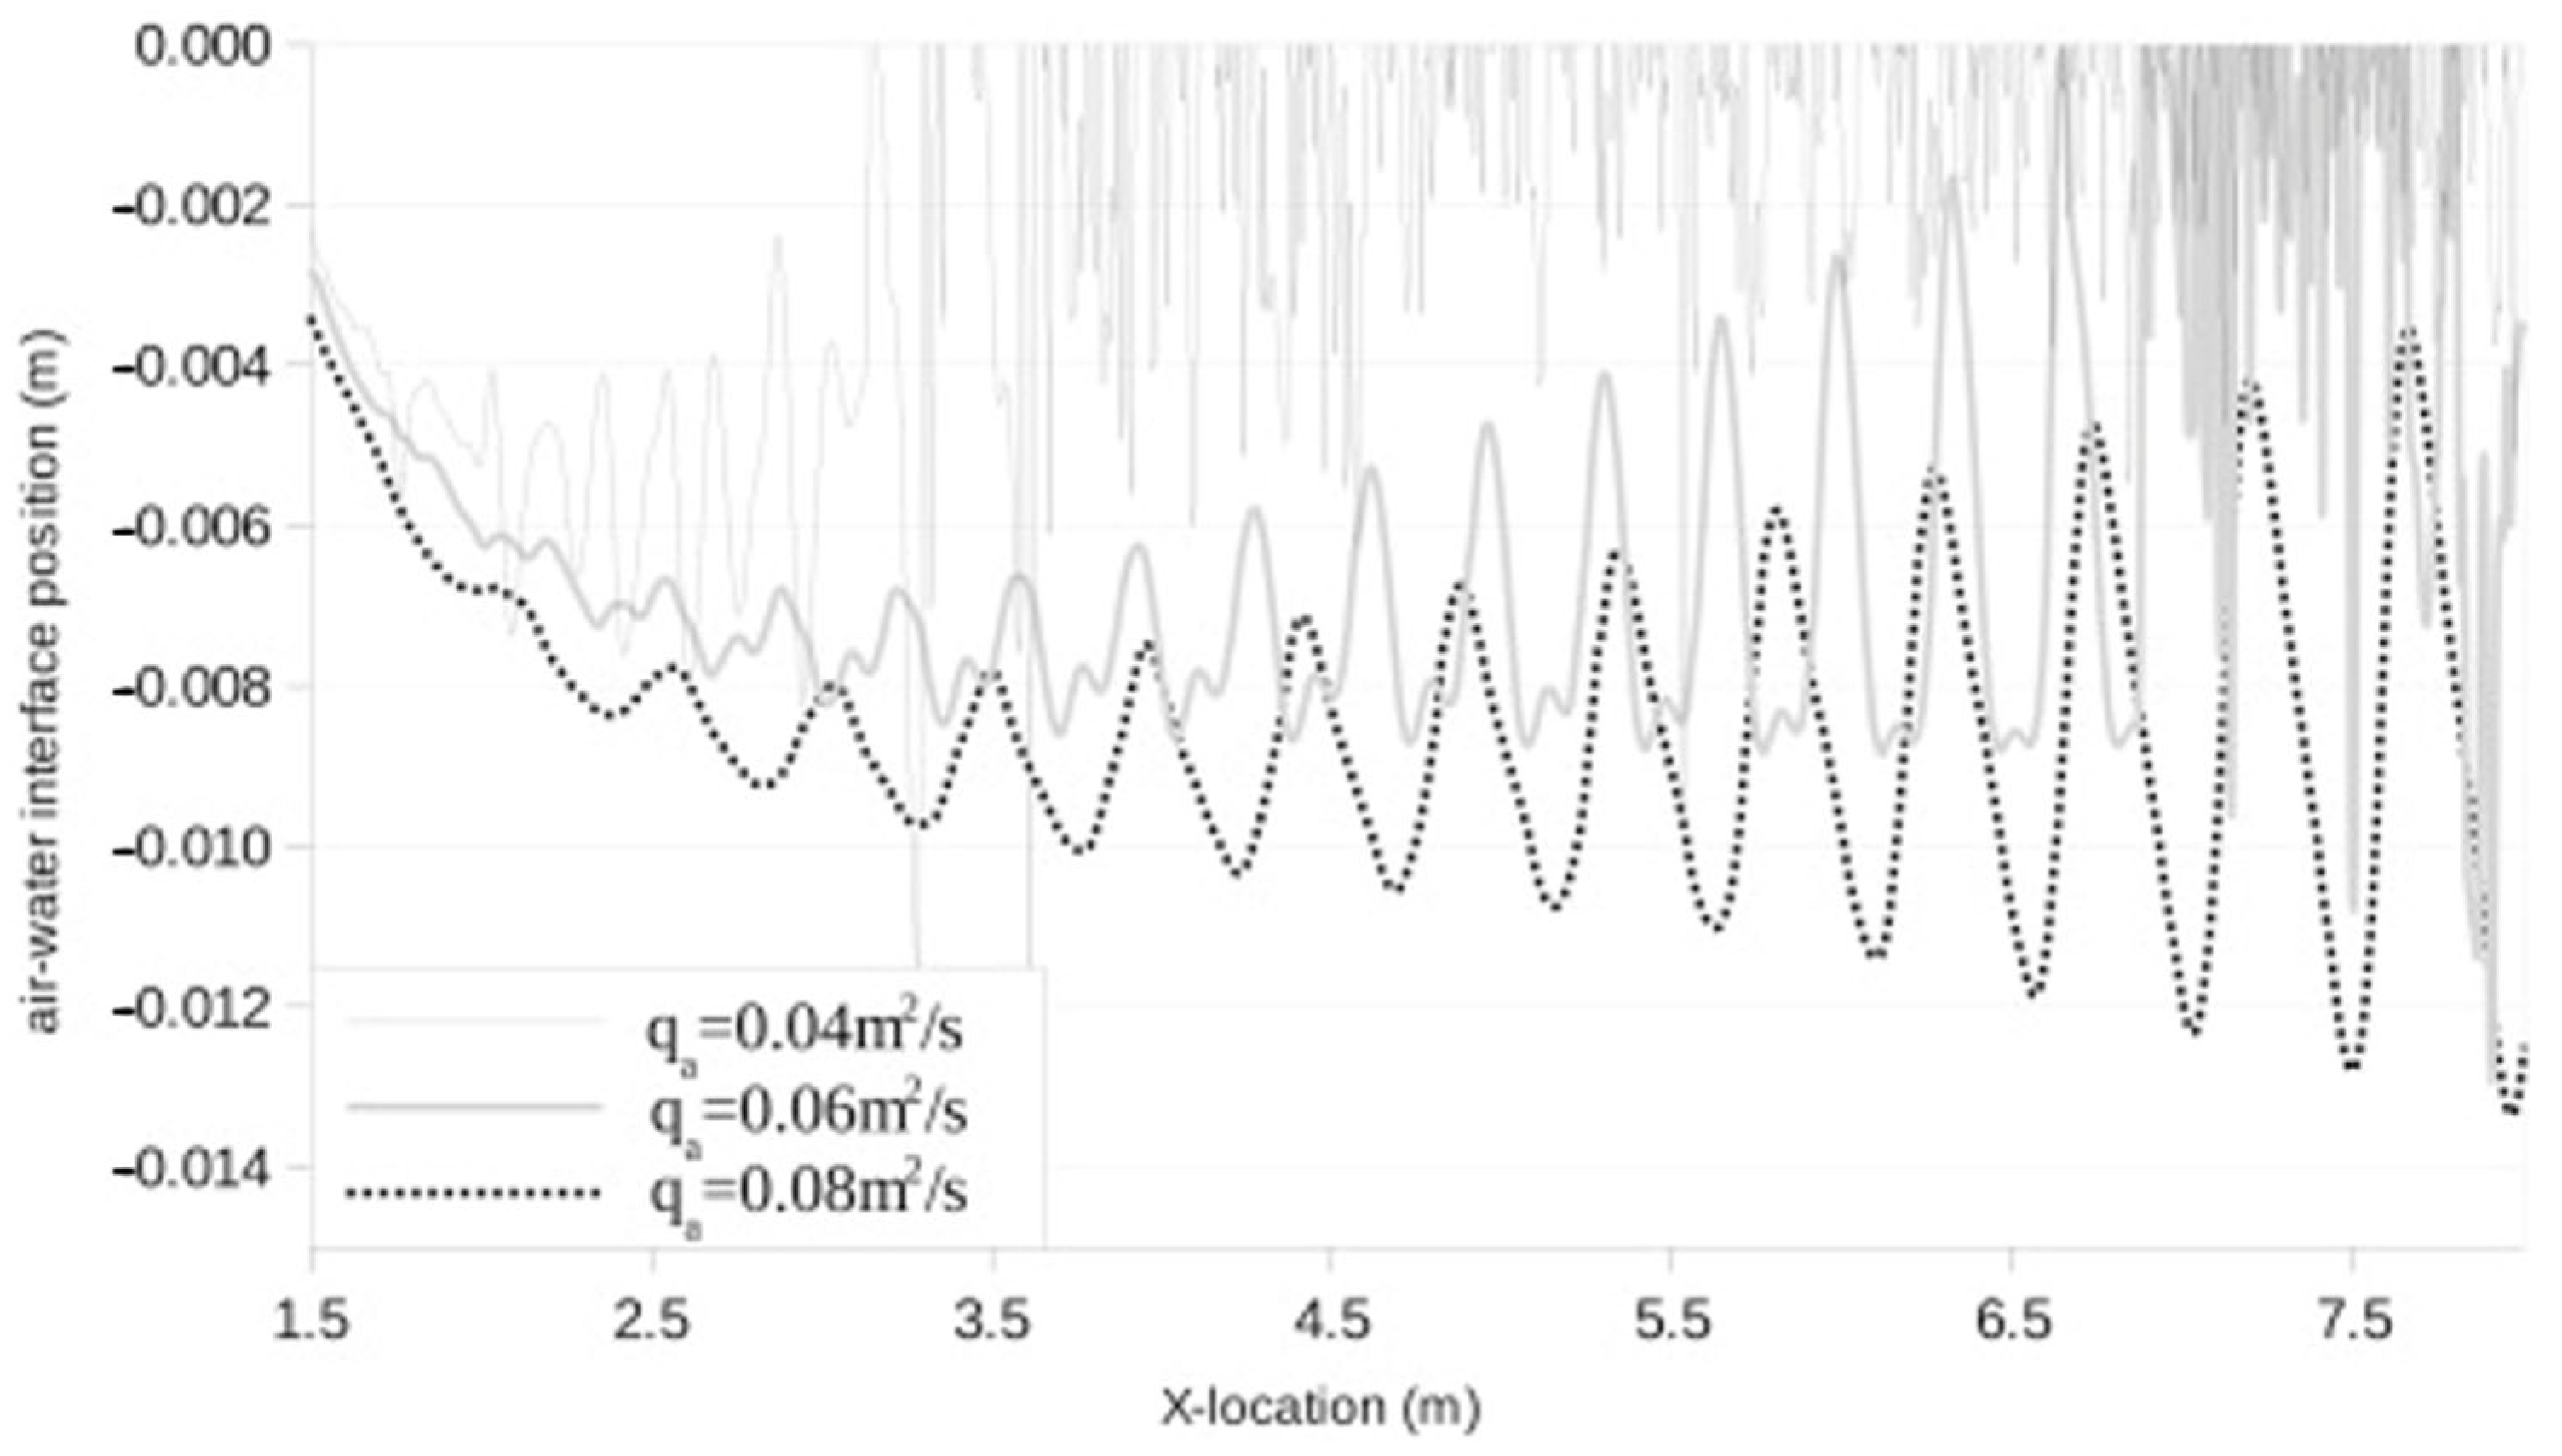
3.2. CFD Simulations on ALDR
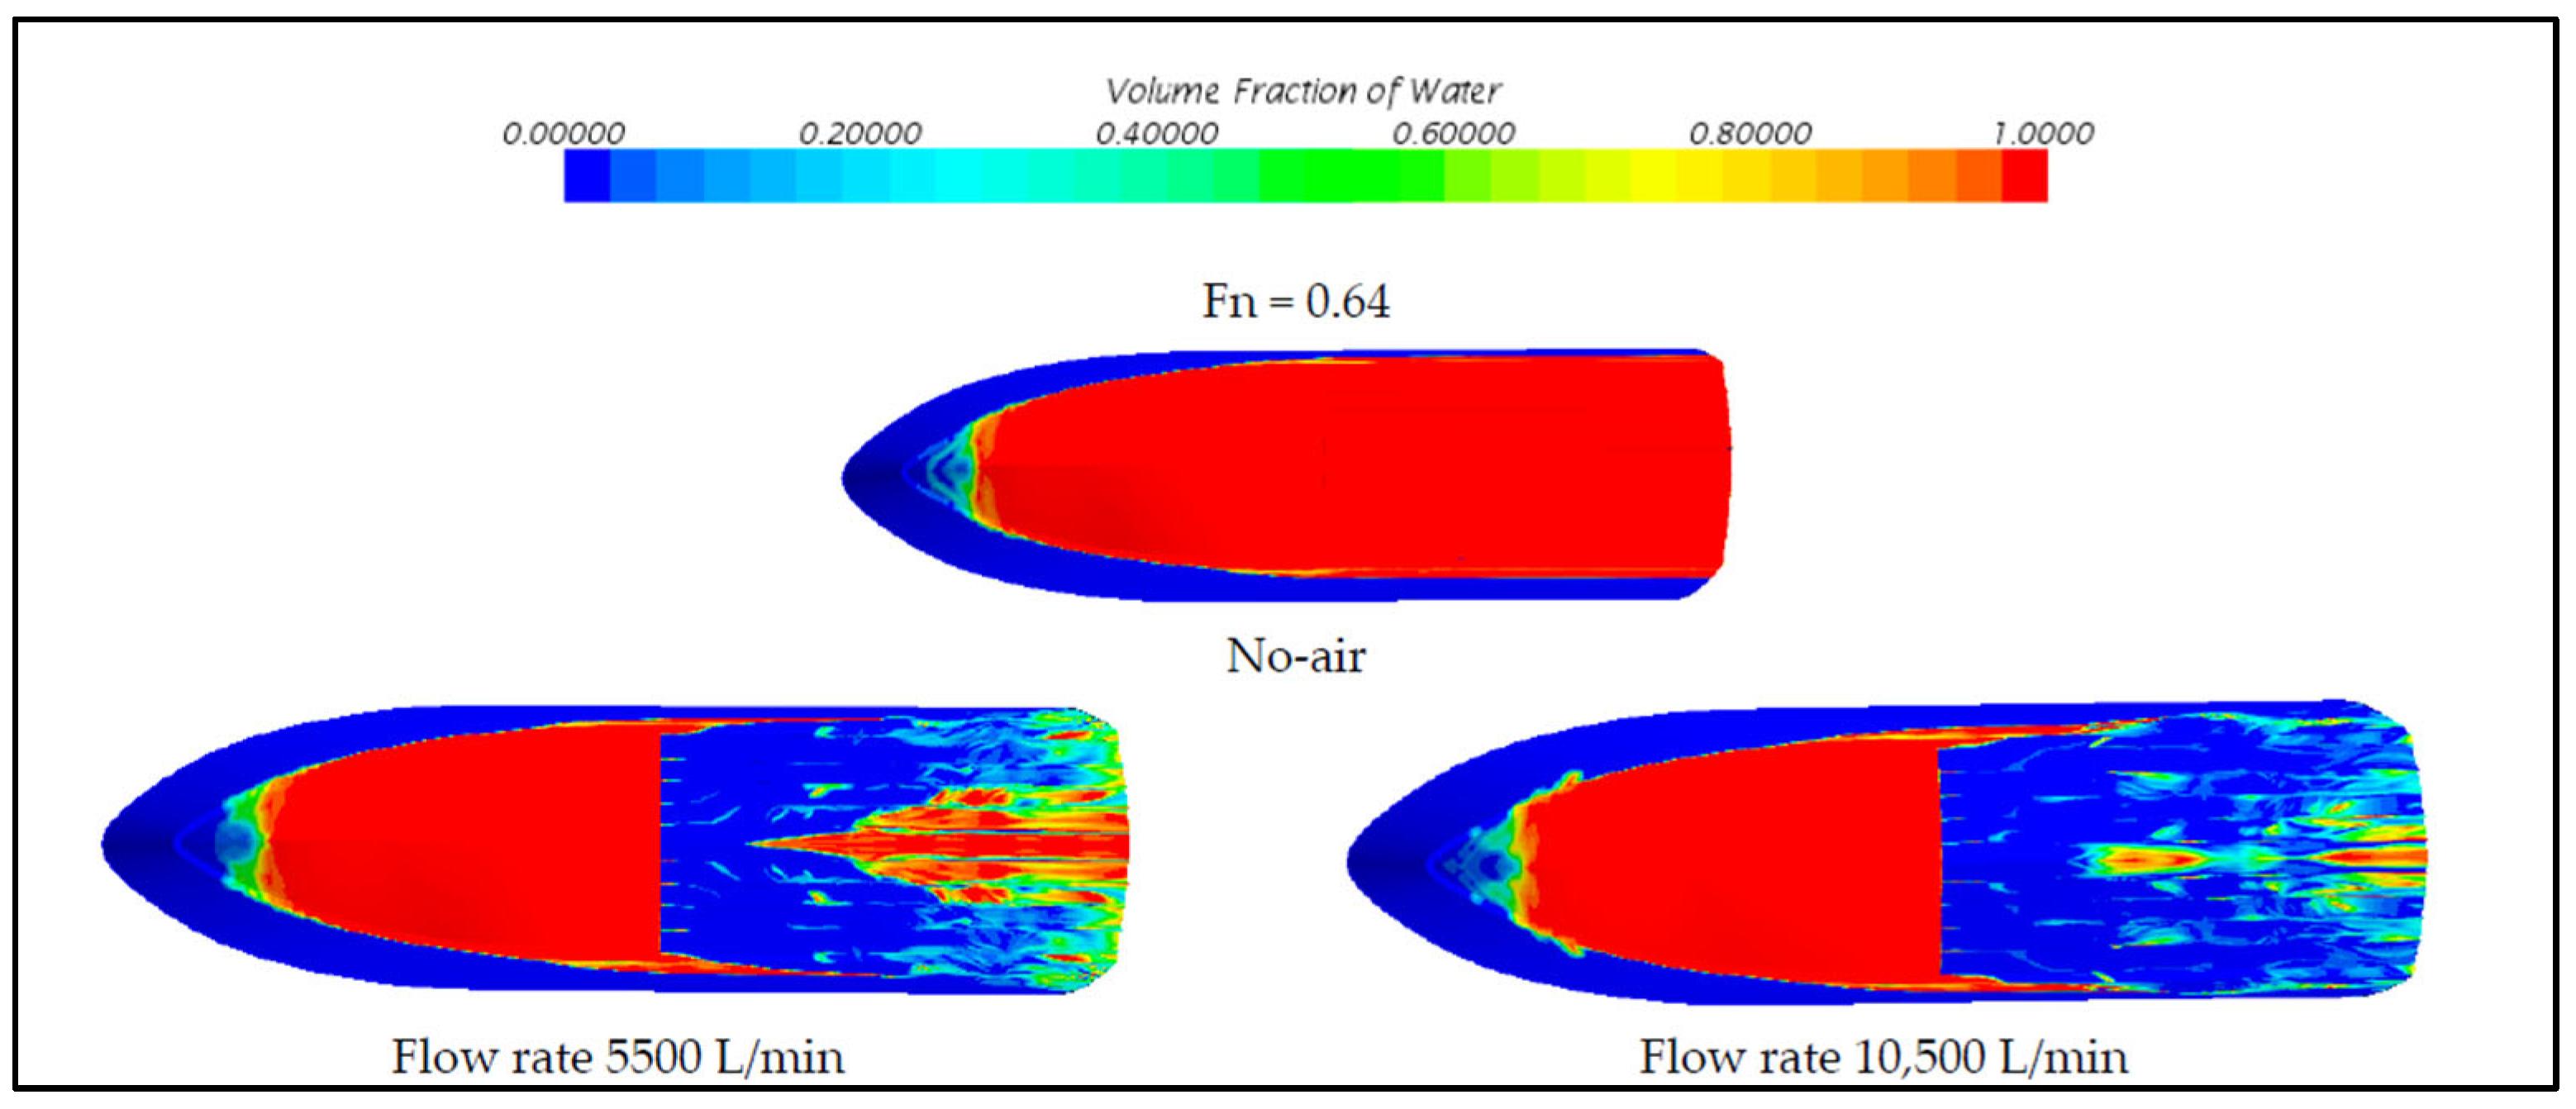
3.3. CFD Simulations on ACDR
4. Mathematical Models
4.1. Models on MBDR
4.2. Models on ALDR
4.3. Models on ACDR
5. Discussion
6. Conclusions
Funding
Data Availability Statement
Conflicts of Interest
References
- Fukuda, K.; Tokunaga, J.; Nobunaga, T.; Nakatani, T.; Iwasaki, T.; Kunitake, Y. Frictional drag reduction with air lubricant over a super-water-repellent surface. J. Mar. Sci. Technol. 2000, 5, 123–130. [Google Scholar] [CrossRef]
- Demirel, Y.K.; Song, S.; Turan, O.; Incecik, A. Practical added resistance diagrams to predict fouling impact on ship performance. Ocean Eng. 2019, 186, 106112. [Google Scholar] [CrossRef]
- Jang, J.; Choi, S.H.; Ahn, S.M.; Kim, B.; Seo, J.S. Experimental investigation of frictional resistance reduction with air layer on the hull bottom of a ship. Int. J. Nav. Archit. Ocean Eng. 2014, 6, 363–379. [Google Scholar] [CrossRef]
- Chillemi, M.; Cucinotta, F.; Passeri, D.; Scappaticci, L.; Sfravara, F. CFD-Driven Shape Optimization of a Racing Motorcycle; Lecture Notes in Mechanical Engineering; Springer Nature: Cham, Switzerland, 2024; pp. 488–496. [Google Scholar] [CrossRef]
- Diez, M.; Campana, E.F.; Stern, F. Stochastic optimization methods for ship resistance and operational efficiency via CFD. Struct. Multidiscip. Optim. 2018, 57, 735–758. [Google Scholar] [CrossRef]
- Singh, S.; Singh, B.; Hans, V.S.; Gill, R.S. CFD (computational fluid dynamics) investigation on Nusselt number and friction factor of solar air heater duct roughened with non-uniform cross-section transverse rib. Energy 2015, 84, 509–517. [Google Scholar] [CrossRef]
- Onwuegbuchunam, D.E.; Ogbenna, F.C.; Ezeanya, N.C.; Okeke, K.O. Ship Hull Form Optimization: A Computational Fluid Dynamics (CFD) Approach. Int. J. Transp. Eng. Technol. 2019, 5, 43–49. [Google Scholar] [CrossRef]
- Haase, M. Energy-efficient large medium-speed catamarans: Hull form design by full-scale CFD simulations. Ship Technol. Res. 2016, 63, 133–134. [Google Scholar] [CrossRef]
- Cucinotta, F.; Raffaele, M.; Salmeri, F. A Well-to-Wheel Comparative Life Cycle Assessment between Full Electric and Traditional Petrol Engines in the European Context; Springer Nature: Cham, Switzerland, 2021; pp. 188–193. [Google Scholar] [CrossRef]
- Di Bella, G.; Alderucci, T.; Salmeri, F.; Cucinotta, F. Integrating the sustainability aspects into the risk analysis for the manufacturing of dissimilar aluminium/steel friction stir welded single lap joints used in marine applications through a Life Cycle Assessment. Sustain. Futures 2022, 4, 100101. [Google Scholar] [CrossRef]
- Prestipino, M.; Salmeri, F.; Cucinotta, F.; Galvagno, A. Thermodynamic and environmental sustainability analysis of electricity production from an integrated cogeneration system based on residual biomass: A life cycle approach. Appl. Energy 2021, 295, 117054. [Google Scholar] [CrossRef]
- Mio, A.; Fermeglia, M.; Favi, C. A critical review and normalization of the life cycle assessment outcomes in the naval sector Articles description. J. Clean. Prod. 2022, 370, 133476. [Google Scholar] [CrossRef]
- Kim, Y.R.; Steen, S. Potential energy savings of air lubrication technology on merchant ships. Int. J. Nav. Archit. Ocean. Eng. 2023, 15, 100530. [Google Scholar] [CrossRef]
- Tsai, J.-F.; Chen, C.-C. Boundary Layer Mixture Model for a Microbubble Drag Reduction Technique. ISRN Mech. Eng. 2011, 2011, 1–9. [Google Scholar] [CrossRef]
- Sanders, W.C.; Winkel, E.S.; Dowling, D.R.; Perlin, M.; Ceccio, S.L. Bubble friction drag reduction in a high-Reynolds-number flat-plate turbulent boundary layer. J. Fluid. Mech. 2006, 552, 353. [Google Scholar] [CrossRef]
- Schultz-Grunow, F. New Frictional Resistance Law for Smooth Plates; National Advisory Commitee for Aeronautics: Hampton, VA, USA, 1941; pp. 1–24. [Google Scholar]
- Elbing, B.R.; Winkel, E.S.; Lay, K.A.; Ceccio, S.L.; Dowling, D.R.; Perlin, M. Bubble-induced skin-friction drag reduction and the abrupt transition to air-layer drag reduction. J. Fluid Mech. 2008, 612, 201–236. [Google Scholar] [CrossRef]
- Sayyaadi, H.; Nematollahi, M. Determination of optimum injection flow rate to achieve maximum micro bubble drag reduction in ships; an experimental approach. Sci. Iran. 2013, 20, 535–541. [Google Scholar]
- Park, H.J.; Tasaka, Y.; Oishi, Y.; Murai, Y. Drag reduction promoted by repetitive bubble injection in turbulent channel flows. Int. J. Multiph. Flow 2015, 75, 12–25. [Google Scholar] [CrossRef]
- Jacob, B.; Olivieri, A.; Miozzi, M.; Campana, E.F.; Piva, R. Drag reduction by microbubbles in a turbulent boundary layer. Phys. Fluids 2010, 22, 115104. [Google Scholar] [CrossRef]
- Guin, M.M.; Kato, H.; Yamaguchi, H.; Maeda, M.; Miyanaga, M. Reduction of skin friction by microbubbles and its relation with near-wall bubble concentration in a channel. J. Mar. Sci. Technol. 1996, 1, 241–254. [Google Scholar] [CrossRef]
- Yanuar; Gunawan; Sunaryo; Jamaluddin, A. Micro-bubble drag reduction on a high speed vessel model. J. Mar. Sci. Appl. 2012, 11, 301–304. [Google Scholar] [CrossRef]
- Murai, Y.; Fukuda, H.; Oishi, Y.; Kodama, Y.; Yamamoto, F. Skin friction reduction by large air bubbles in a horizontal channel flow. Int. J. Multiph. Flow 2007, 33, 147–163. [Google Scholar] [CrossRef]
- Kodama, Y.; Kakugawa, A.; Takahashi, T.; Kawashima, H. Experimental study on microbubbles and their applicability to ships for skin friction reduction. Int. J. Heat Fluid Flow 2000, 21, 582–588. [Google Scholar] [CrossRef]
- Madavan, N.K.; Deutsch, S.; Merkle, C.L. Reduction of Turbulent Skin Friction by Microbubbles. Phys. Fluids 1984, 27, 356–363. [Google Scholar] [CrossRef]
- Kumagai, I.; Takahashi, Y.; Murai, Y. Power-saving device for air bubble generation using a hydrofoil to reduce ship drag: Theory, experiments, and application to ships. Ocean Eng. 2015, 95, 183–194. [Google Scholar] [CrossRef]
- Kitagawa, A.; Hishida, K.; Kodama, Y. Flow structure of microbubble-laden turbulent channel flow measured by PIV combined with the shadow image technique. Exp. Fluids 2005, 38, 466–475. [Google Scholar] [CrossRef]
- Murai, Y. Frictional drag reduction by bubble injection. Exp. Fluids 2014, 55, 1773. [Google Scholar] [CrossRef]
- Ohashi, H.; Matsumoto, Y.; Ichikawa, Y.; Tsukiyama, T. Air/water two-phase flow test tunnel for airfoil studies. Exp. Fluids 1990, 8, 249–256. [Google Scholar] [CrossRef]
- Finn, J.; Shams, E.; Apte, S.V. Modeling and simulation of multiple bubble entrainment and interactions with two dimensional vortical flows. Phys. Fluids 2011, 23, 023301. [Google Scholar] [CrossRef]
- Tanaka, T.; Oishi, Y.; Park, H.J.; Tasaka, Y.; Murai, Y.; Kawakita, C. Downstream persistence of frictional drag reduction with repetitive bubble injection. Ocean Eng. 2023, 272, 113807. [Google Scholar] [CrossRef]
- Giernalczyk, M.; Kaminski, P.; Chybowski, L.; Tomczak, A.; Kozak, M.; Kim, J. Assessment of the Propulsion System Operation of the Ships Equipped with the Air Lubrication System. Sensors 2021, 21, 1357. [Google Scholar] [CrossRef]
- Hao, W.U.; Yongpeng, O.; Qing, Y.E. Experimental study of air layer drag reduction on a flat plate and bottom hull of a ship with cavity. Ocean Eng. 2019, 183, 236–248. [Google Scholar] [CrossRef]
- Wu, H.; Ou, Y. Experimental Study of Air Layer Drag Reduction with Bottom Cavity for A Bulk Carrier Ship Model. China Ocean Eng. 2019, 33, 554–562. [Google Scholar] [CrossRef]
- Elbing, B.R.; Mäkiharju, S.; Wiggins, A.; Perlin, M.; Dowling, D.R.; Ceccio, S.L. On the scaling of air layer drag reduction. J. Fluid Mech. 2013, 717, 484–513. [Google Scholar] [CrossRef]
- Yanuar; Waskito, K.T.; Pratama, S.Y.; Candra, B.D.; Rahmat, B.A. Comparison of Microbubble and Air Layer Injection with Porous Media for Drag Reduction on a Self-propelled Barge Ship Model. J. Mar. Sci. Appl. 2018, 17, 165–172. [Google Scholar] [CrossRef]
- Aljallis, E.; Sarshar, M.A.; Datla, R.; Sikka, V.; Jones, A.; Choi, C.H. Experimental study of skin friction drag reduction on superhydrophobic flat plates in high Reynolds number boundary layer flow. Phys. Fluids 2013, 25, 025103. [Google Scholar] [CrossRef]
- Slyozkin, A.; Atlar, M.; Sampson, R.; Seo, K.-C. An experimental investigation into the hydrodynamic drag reduction of a flat plate using air-fed cavities. Ocean Eng. 2014, 76, 105–120. [Google Scholar] [CrossRef]
- Butterworth, J.; Atlar, M.; Shi, W. Experimental analysis of an air cavity concept applied on a ship hull to improve the hull resistance. Ocean Eng. 2015, 110, 2–10. [Google Scholar] [CrossRef]
- De Marco, A.; Mancini, S.; Miranda, S.; Scognamiglio, R.; Vitiello, L. Experimental and numerical hydrodynamic analysis of a stepped planing hull. Appl. Ocean Res. 2017, 64, 135–154. [Google Scholar] [CrossRef]
- Cucinotta, F.; Guglielmino, E.; Sfravara, F. An experimental comparison between different artificial air cavity designs for a planing hull. Ocean Eng. 2017, 140, 233–243. [Google Scholar] [CrossRef]
- Song, L.; Yu, J.; Yu, Y.; Wang, Z.; Wu, S.; Gao, R. An Experimental Study on the Resistance of a High-Speed Air Cavity Craft. J. Mar. Sci. Eng. 2023, 11, 1256. [Google Scholar] [CrossRef]
- Zhao, X.; Zong, Z.; Jiang, Y.; Pan, Y. Numerical simulation of micro-bubble drag reduction of an axisymmetric body using OpenFOAM. J. Hydrodyn. 2018, 31, 900–910. [Google Scholar] [CrossRef]
- Mohanarangam, K.; Mohanarangam, K.; Cheung, S.C.P.; Zhang, L.; Tu, J.; Chen, L. Numerical simulation of micro-bubble drag reduction using population balance model. Ocean Eng. 2009, 36, 863–872. [Google Scholar] [CrossRef]
- Gamal, M.; Kotb, M.; Ahmed, N.; Khaled, E.; Elsherbiny, K. Numerical investigations of micro bubble drag reduction effect for container ships. Mar. Syst. Ocean Technol. 2021, 16, 199–212. [Google Scholar] [CrossRef]
- Xia, W.; Song, W.; Wang, C.; Yi, W.; Meng, Q.; Deng, H. Microbubbles drag reduction characteristics of underwater vehicle during pitching movement. Ocean Eng. 2023, 285, 115350. [Google Scholar] [CrossRef]
- An, H.; Yang, P.; Zhang, H.; Liu, X. Numerical Study of the Influence of the Type of Gas on Drag Reduction by Microbubble Injection. Inventions 2024, 9, 7. [Google Scholar] [CrossRef]
- Xiaosong, Z.; Jian-hua, W.; Decheng, W. Euler-Lagrange study of bubble drag reduction in turbulent channel flow and boundary layer flow. Phys. Fluids 2020, 32, 027101. [Google Scholar] [CrossRef]
- Xu, J.; Maxey, M.R.; Karniadakis, G.E. Numerical simulation of turbulent drag reduction using micro-bubbles. J. Fluid Mech. 2002, 468, 271–281. [Google Scholar] [CrossRef]
- Pang, M.; Wei, J.; Yu, B. Numerical study on modulation of microbubbles on turbulence frictional drag in a horizontal channel. Ocean Eng. 2014, 81, 58–68. [Google Scholar] [CrossRef]
- Montazeri, M.; Alishahi, M. An efficient method for numerical modeling of thin air layer drag reduction on flat plate and prediction of flow instabilities. Ocean Eng. 2019, 179, 22–37. [Google Scholar] [CrossRef]
- Zhang, J.; Yang, S.; Liu, J.; Liu, J. Numerical investigation of frictional drag reduction with an air layer concept on the hull of a ship. J. Hydrodyn. 2019, 32, 591–604. [Google Scholar] [CrossRef]
- Hao, W.U.; Yongpeng, O.U. Numerical simulation of air layer morphology on flat bottom plate with air cavity and evaluation of the drag reduction effect. Int. J. Nav. Archit. Ocean. Eng. 2019, 11, 510–520. [Google Scholar] [CrossRef]
- Ye, Q.; Ou, Y.; Xiang, G.; Chen, J. Numerical Study on the Influence of Water Depth on Air Layer Drag Reduction. Appl. Sci. 2024, 14, 431. [Google Scholar] [CrossRef]
- Besagni, G.; Varallo, N.; Mereu, R. Computational Fluid Dynamics Modelling of Two-Phase Bubble Columns: A Comprehensive Review. Fluids 2023, 8, 91. [Google Scholar] [CrossRef]
- Zhang, X. CFD Study of Air-Layer Drag Reduction on a Plate with Different Kinds of Cavity Design. Available online: https://dcwan.sjtu.edu.cn/userfiles/OMAE2020-18088.pdf (accessed on 9 December 2023).
- Xu, K.; Su, X.; Bensow, R.; Krajnovic, S. Large eddy simulation of ship airflow control with steady Coanda effect. Phys. Fluids 2023, 35, 015112. [Google Scholar] [CrossRef]
- Kim, D.; Moin, P.; Kim, D.; Moin, P. Direct Numerical Simulation of Air Layer Drag Reduction over a Backward-facing Step, APS 2010, 63, EU.008. Available online: https://ui.adsabs.harvard.edu/abs/2010APS..DFD.EU008K/abstract (accessed on 9 December 2023).
- Lotfi, P.; Ashrafizaadeh, M.; Kowsari-Esfahan, R.; Esfahan, R.K. Numerical investigation of a stepped planing hull in calm water. Ocean Eng. 2015, 94, 103–110. [Google Scholar] [CrossRef]
- Cucinotta, F.; Guglielmino, E.; Sfravara, F.; Strasser, C. Numerical and experimental investigation of a planing Air Cavity Ship and its air layer evolution. Ocean Eng. 2018, 152, 130–144. [Google Scholar] [CrossRef]
- Cucinotta, F.; Nigrelli, V.; Sfravara, F. Numerical prediction of ventilated planing flat plates for the design of Air Cavity Ships. Int. J. Interact. Des. Manuf. (Ijidem) 2018, 12, 537–548. [Google Scholar] [CrossRef]
- Cucinotta, F.; Mancini, D.; Sfravara, F.; Tamburrino, F. The Effect of Longitudinal Rails on an Air Cavity Stepped Planing Hull. J. Mar. Sci. Eng. 2021, 9, 470. [Google Scholar] [CrossRef]
- Tagliafierro, B.; Mancini, S.; Ropero-Giralda, P.; Domínguez, J.M.; Crespo, A.J.C.; Viccione, G. Performance Assessment of a Planing Hull Using the Smoothed Particle Hydrodynamics Method. J. Mar. Sci. Eng. 2021, 9, 244. [Google Scholar] [CrossRef]
- Han, Y.; Lu, J.; Lin, D.; Gao, Q.; Ma, Z.; Song, K.; Yan, M. Numerical study on growth of air cavity and drag reduction affected by cavity depth. In Proceedings of the International Offshore and Polar Engineering Conference, Ottawa, ON, Canada, 18–23 June 2023; pp. 4061–4066. [Google Scholar]
- Cucinotta, F.; Guglielmino, E.; Sfravara, F. A critical CAE analysis of the bottom shape of a multi stepped air cavity planing hull. Appl. Ocean Res. 2019, 82, 130–142. [Google Scholar] [CrossRef]
- Mukha, T.; Bensow, R. Large-Eddy Simulation of an Internal Ship Air Cavity in Model Scale. Available online: https://www.esi-group.com/sites/default/files/resource/other/1981/mukha_abstract_openfoam_2019.pdf (accessed on 9 December 2023).
- Matveev, K.I. On the limiting parameters of artificial cavitation. Ocean Eng. 2003, 30, 1179–1190. [Google Scholar] [CrossRef]
- Yang, D.; Sun, Z.; Jiang, Y.; Gao, Z. A Study on the Air Cavity under a Stepped Planing Hull. J. Mar. Sci. Eng. 2019, 7, 468. [Google Scholar] [CrossRef]
- Amromin, E.L. Analysis of interaction between ship bottom air cavity and boundary layer. Appl. Ocean Res. 2016, 59, 451–458. [Google Scholar] [CrossRef]
- Yoshida, Y.; Takahashi, Y.; Kato, H.; Masuko, A.; Watanabe, O. Simple Lagrangian formulation of bubbly flow in a turbulent boundary layer (bubbly boundary layer flow). J. Mar. Sci. Technol. 1997, 2, 1–11. [Google Scholar] [CrossRef]
- Matveev, K.I. Two-dimensional modeling of stepped planing hulls with open and pressurized air cavities. Int. J. Nav. Archit. Ocean Eng. 2012, 4, 162–171. [Google Scholar] [CrossRef]
- Matveev, K.I. Hydrodynamic modeling of semi-planing hulls with air cavities. Int. J. Nav. Archit. Ocean Eng. 2015, 7, 500–508. [Google Scholar] [CrossRef]
- Keehnel, D.; Matveev, K.I. Drop Tests and Modeling of Water Entry of Air-Cavity Hull Sections. In Proceedings of the International Conference on Offshore Mechanics and Arctic Engineering—OMAE 8A, San Francisco, CA, USA, 8–13 June 2014. [Google Scholar] [CrossRef]


| Year | Vessel Name | Type | Length (m) |
|---|---|---|---|
| 2015 | Quantum of tir Sea | Cruise | 348 |
| 2016 | AIDA prima | Cruise | 300 |
| 2017 | AIDA perla | Cruise | 300 |
| 2017 | Norwegian Joy | Cruise | 333 |
| 2018 | Diamond Princess | Cruise | 290 |
Disclaimer/Publisher’s Note: The statements, opinions and data contained in all publications are solely those of the individual author(s) and contributor(s) and not of MDPI and/or the editor(s). MDPI and/or the editor(s) disclaim responsibility for any injury to people or property resulting from any ideas, methods, instructions or products referred to in the content. |
© 2024 by the authors. Licensee MDPI, Basel, Switzerland. This article is an open access article distributed under the terms and conditions of the Creative Commons Attribution (CC BY) license (https://creativecommons.org/licenses/by/4.0/).
Share and Cite
Chillemi, M.; Raffaele, M.; Sfravara, F. A Review of Advanced Air Lubrication Strategies for Resistance Reduction in the Naval Sector. Appl. Sci. 2024, 14, 5888. https://doi.org/10.3390/app14135888
Chillemi M, Raffaele M, Sfravara F. A Review of Advanced Air Lubrication Strategies for Resistance Reduction in the Naval Sector. Applied Sciences. 2024; 14(13):5888. https://doi.org/10.3390/app14135888
Chicago/Turabian StyleChillemi, Massimiliano, Marcello Raffaele, and Felice Sfravara. 2024. "A Review of Advanced Air Lubrication Strategies for Resistance Reduction in the Naval Sector" Applied Sciences 14, no. 13: 5888. https://doi.org/10.3390/app14135888
APA StyleChillemi, M., Raffaele, M., & Sfravara, F. (2024). A Review of Advanced Air Lubrication Strategies for Resistance Reduction in the Naval Sector. Applied Sciences, 14(13), 5888. https://doi.org/10.3390/app14135888