Article

Study on the Vibration Effects of Cyclic Blasting on Bridge Structures under Construction

Mining College, Guizhou University, Guiyang 550025, China
*
Author to whom correspondence should be addressed.
Appl. Sci. 2024, 14(13), 5940; https://doi.org/10.3390/app14135940
Submission received: 19 May 2024 / Revised: 25 June 2024 / Accepted: 5 July 2024 / Published: 8 July 2024
(This article belongs to the Special Issue Recent Advances in the Effect of Blast Loads on Structures)

Abstract

:
This study investigates the impact of cyclic tunnel blasting on adjacent bridge structures under construction. Monitoring vibration velocities of the bridge deck, piers, and middle column adjacent to the Zhanma Tian Tunnel, a three-dimensional numerical model was developed using FLAC3D software, utilizing blasting vibration test data from the Zhanma Tian Tunnel project in Guizhou. Results show that, as the distance between the bridge and tunnel increases, vibration velocity at the bridge deck decreases more rapidly compared to the base of the pier. Peak vibration velocities recorded were 0.235 cm/s for the bridge deck, 0.081 cm/s for the pier base, and a predicted 0.209 cm/s for the middle column. The impact order from blasting vibrations on the bridge structure is: pier base, middle column, bridge deck. Peak vibration velocity induced by blasting ranged between 0.05 and 0.25 cm/s, within safe limits of bridge material strength. Eight daily blasting cycles do not compromise the safety of bridge structures located 43 m away.

1. Introduction

Blasting is a widely employed technique in various engineering fields, including water conservancy, hydropower engineering, highway and railway construction, and mining. The vibrations generated by blasting during construction can impact the stability of bridge structures. Repeated exposure to these vibrations can lead to cumulative damage, which, if it exceeds a certain critical threshold, will inevitably result in structural compromise. Once the damage accumulates to a certain level, it poses a significant threat to the structural integrity and safe usage of the building [1,2,3]. Frequent disturbances exacerbate the extent of damage, significantly shortening the service life of the structure and potentially leading to direct structural failure. Currently, most studies on the effects of blasting on bridges focus solely on single blasting events, neglecting the impacts of cyclic blasting. Recently, numerous scholars have investigated the effects of blasting vibrations on nearby structures [4,5]. Lu et al. [6] analyzed the impact of blasting vibrations on nearby structures and early-stage concrete in the context of China’s safety regulations on blasting vibrations. Bayraktar et al. [7,8] assessed the safety impacts of blasting vibrations on reinforced concrete highway bridges, masonry buildings, and stone arch bridges by monitoring quarry blasting vibrations near urban centers in Turkey. Dhakal and Pan [9] investigated the response characteristics of structures subjected to blasting-induced ground motion. Li et al. [10,11] examined the drift control design of reinforced concrete frame structures subjected to long-distance blasting conditions. The primary construction material of bridge structures is concrete. Numerous scholars have investigated the impact of blasting vibrations on the performance of newly poured concrete. Ramulu et al. [12] indicated that repeated blasting loads during excavation accelerate the development of damage zones in the surrounding rock. Studies have shown that the macroscopic failure of engineering rock masses due to cyclic blasting is induced by repeated blasting disturbances. Huo and Wong [13] experimentally investigated the early properties of high-performance concrete. Wang et al. [14] examined the early strength development of outer concrete in well walls through both laboratory and field tests. They discovered that the early strength development of mass concrete is rapid, with the strength at 3 and 7 days reaching 70% and 90% of the final strength, respectively.
Ru He and Nan Jiang [15] investigated the dynamic responses of adjacent buildings to subway tunnel blasting within a complex urban environment. They employed the Hilbert–Huang Transform (HHT) model to analyze blast-induced vibrations, introducing the concept of effective vibration duration to enhance hazard prediction and management. Xiaoming Guan and Ning Yang [16] examined the impact of tunnel blasting on temporary middle walls. Their study identified significant damage proximal to the blasting source, progressing through stages of crack formation and subsequent structural failure. They formulated a BTS-based function for designing and evaluating the safety of temporary support structures. Xianghui Deng and Jingyuan Wang [17] devised a modified PPV prediction formula for tunnel blasting, yielding accurate results in multihole, multistage blasting scenarios at the Guanlinzi Tunnel. H.Z. Yue and C. Yu [18] explored the effects of multihole blasting on rock damage and vibration attenuation. Their study revealed the significant influences of blast-hole arrangement, delay time, and decoupling charge on peak particle velocity (PPV) attenuation parameters, which were validated with field data. These findings offer crucial insights for optimizing blasting designs and enhancing blasting effectiveness. Lu He and Dezhong Kong [19] studied bench blasting in a Guizhou sand and gravel mine, analyzing vibration propagation and developing a regression model to predict blast effects on nearby buildings. Fan Chen and Gengsheng He [20] utilized a fuzzy neural network and the TC-6850 vibrator to investigate the effects of urban underground blasting on vibration intensity. They accurately predicted attenuation and amplification across different strata and building types, emphasizing stronger vibrations in excavated areas and complex propagation patterns in high-rise buildings. Chunquan Dai and Hongtao Sui [21] analyzed the impacts of multiple blasts on tunnels using finite element simulations. They identified significant cumulative vibration damage at the arch bottom, with subsequent blasts increasing peak velocities while decreasing acceleration. The application of concrete spray reduced displacement by 50.4%, thereby improving stability in grade V rock conditions.
When tunnel blasting occurs in close proximity to a bridge under construction, the incomplete formation of the bridge structure and the not fully cured concrete result in low strength and stability. Repeated blasting operations will significantly affect the bridge [22,23]. Using the flood discharge tunnel project in Zhanma Tian, Qinglong, Guizhou, as a case study, this study employs FLAC3D 6.0 to develop a three-dimensional model to investigate the impact of cyclic blasting-induced vibrations on the safety of bridge structures under construction, specifically the bridge deck, piles, and piers [24,25,26].

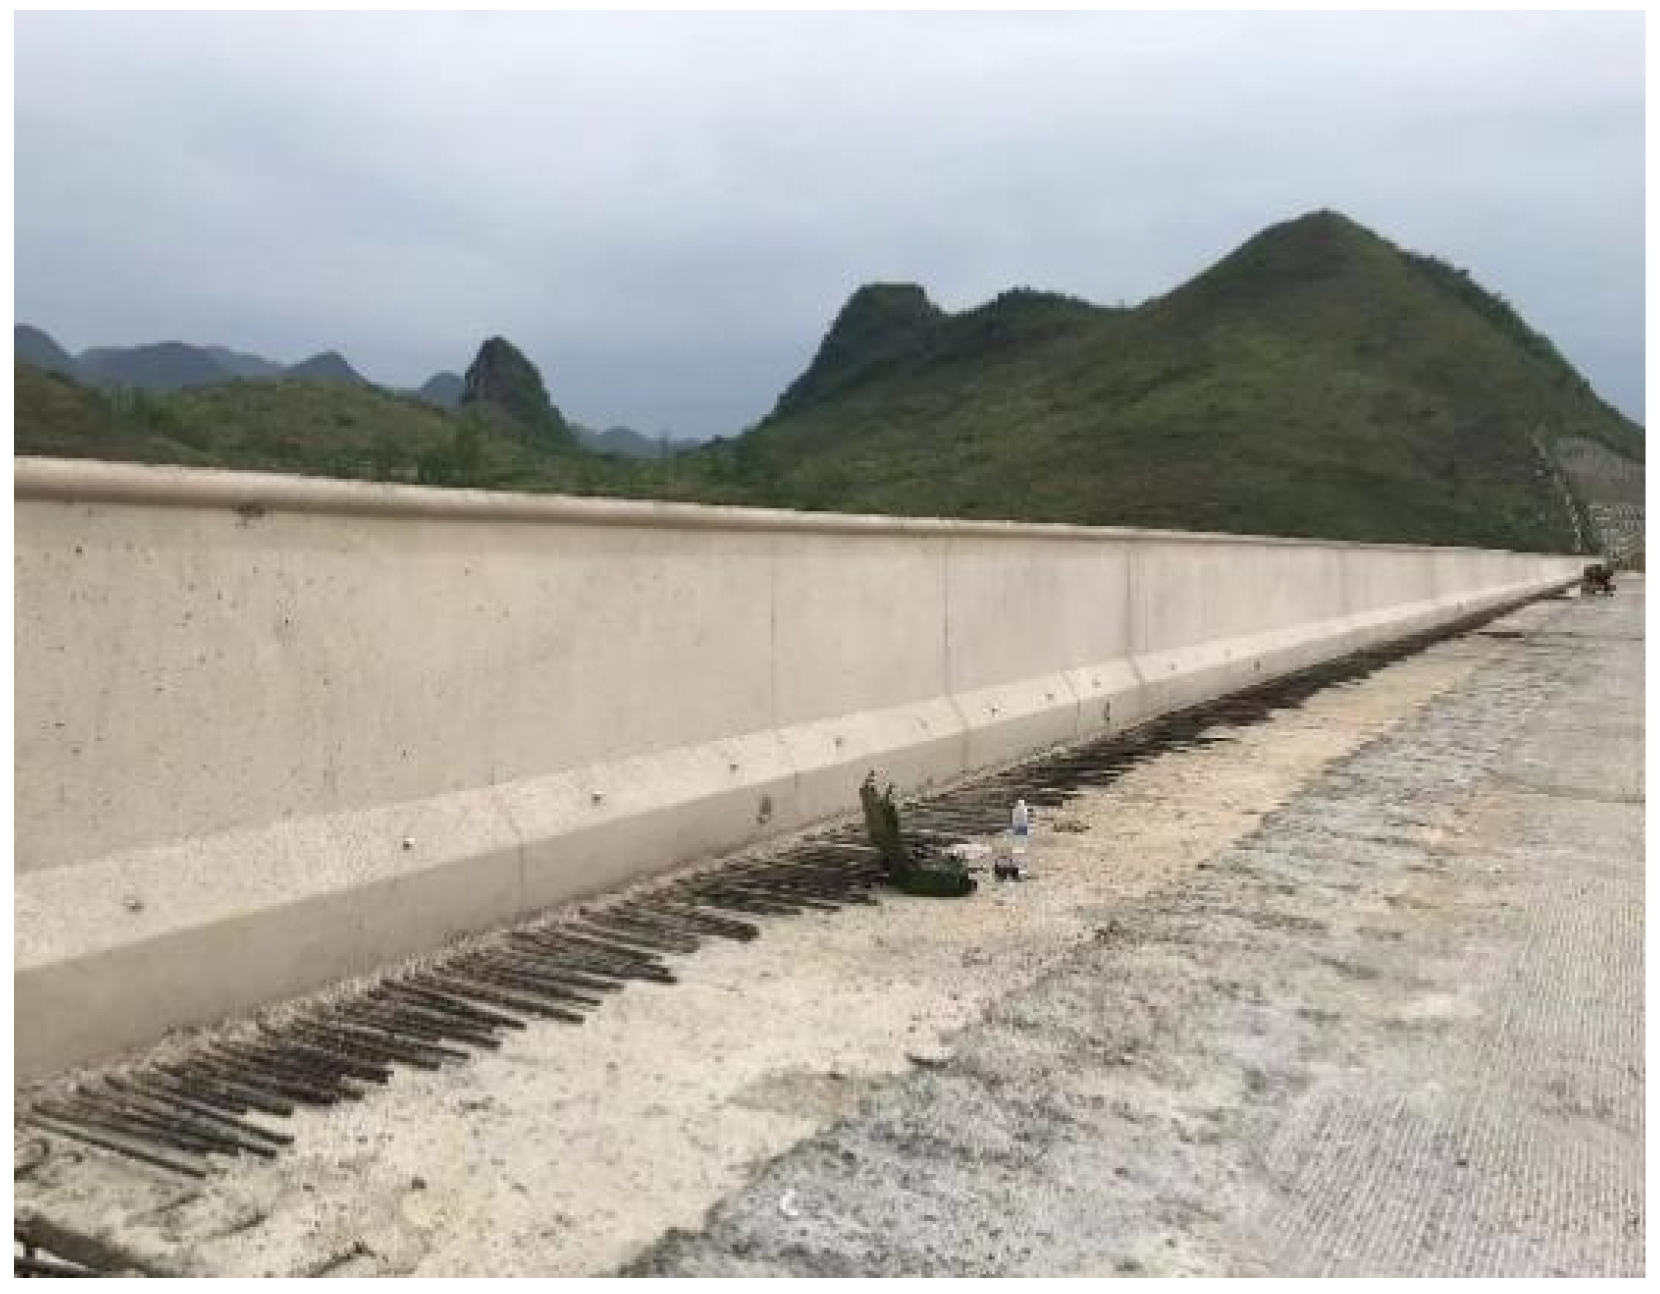
2. Overview of the Zhanma Tian Tunnel Project

The tunnel passes beneath the subgrade of the Qinglong to Guangzhao secondary highway under construction, intersecting the road at an angle of 79°. The elevation of the road surface under construction is approximately 1204 m, with a height difference of 96 m from the tunnel excavation contour line at 1110 m. The northern contour line of the tunnel body is 43 m from the nearest abutment of the Kongjia Zhuang Bridge and approximately 75 m from the base of the bridge abutment piles. The contour line of the tunnel body is about 100 m from the base of the bridge abutment piles. The upper section is undergoing road and slope construction, with the west side of the intersection featuring rubble piled from subgrade excavation on the hillside. A satellite image of the project location is shown in Figure 1.
The tunnel is relatively close to the bridge under construction, with the piers and columns already cast and the deck in the process of being laid. At this stage, the cement has not fully cured, and the reinforced concrete material of the bridge is not yet fully formed. Given the heavy rainfall during the rainy season in Guizhou and the imminent risk of mountain water convergence leading to flooding, the construction schedule is tight with heavy tasks. As a result, tunnel blasting operations are frequent, occurring up to eight times a day. Therefore, to ensure construction safety and the stability of the bridge upon completion, it is necessary to monitor and analyze the primary structures of the bridge to prevent accidents. The on-site condition of the bridge is shown in Figure 2. The main blasting scheme for the project is as follows: The blasting holes and delay settings are shown in Figure 3. The cut holes are located at the bottom of the cross-section, with a charge density of 0.33 kg/t or 0.42 kg/t, chosen based on actual engineering monitoring results. Other blast holes have a charge density of 0.3 kg/m. The cut holes are positioned 0.6 to 0.8 m from the bottom of the excavation section and are the first to be detonated. There are 28 peripheral holes with a spacing of 0.40 to 0.5 m, appropriately inclined towards the contour line, with a line charge density of 0.33 kg/t. There are eight bottom holes.

3. Numerical Simulation and Analysis of Blasting Vibration

In the experiment, due to the short distance between the War Horse Field Tunnel and the bridge, and the incomplete maturity of the bridge, blasting vibrations may threaten the bridge’s safety. This study utilizes FLAC3D to simulate the blasting vibration response of the immature concrete bridge, analyzing the impact of different single-charge blasting operations.

3.1. Model Overview

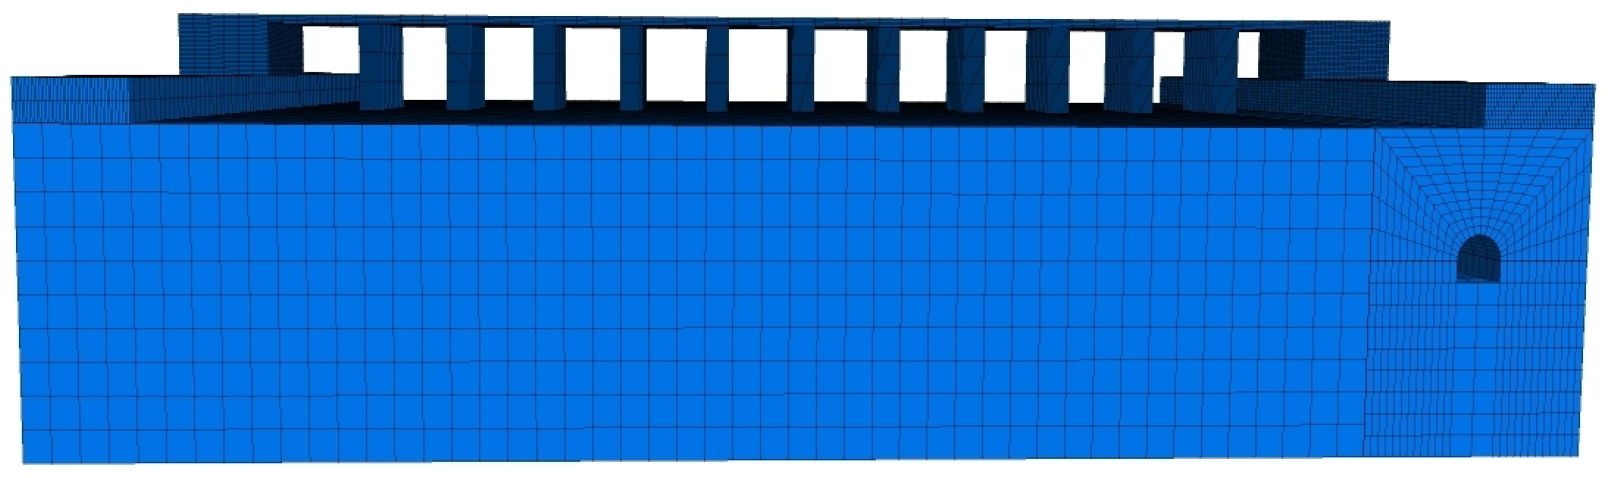
3.1.1. Construction of the Finite Element Model

The model parameters are obtained from on-site data: the tunnel excavation height is 4.4 m, with a width of 4 m, resulting in a cross-sectional area of 17.2 m2. The tunnel cross-section is depicted in Figure 1. To mitigate boundary effects during modeling, the model width is set to be five times the diameter of the tunnel. Due to the significant influence of the lower boundary on the tunnel model’s blasting vibrations, the model height is set to be three times the tunnel height, with the upper boundary corresponding to the actual average burial depth of the tunnel. The tunnel’s advance per cycle ranges from 2 to 2.5 m. In accordance with the actual project, the excavated section of the tunnel face is set to 100 m; to eliminate boundary conditions ahead of the tunnel face, an unexcavated section of 50 m is established.
The surrounding rock of this tunnel section mainly comprises blocky breccia dolomite. The Hoek–Brown constitutive model is employed to simulate the mountain, with the material parameters for dolomite listed in Table 1.
The overall dimensions of the model are 1400 m × 400 m × 300 m. To further mitigate boundary effects, non-reflective boundaries are applied to all sides of the model.
The bridge is constructed using reinforced concrete, and the Hoek–Brown constitutive model is employed to simulate the material properties of the reinforced concrete. Since the concrete has not yet fully solidified, the material parameters are slightly lower than those of fully solidified materials. The parameter settings are determined based on research on the model parameters of reinforced concrete, with specific values provided in Table 1.
Explosive type 2 emulsion with a detonation velocity of 3500–5000 m/s is used. The finite element models for the bridge and tunnel are illustrated in Figure 4.

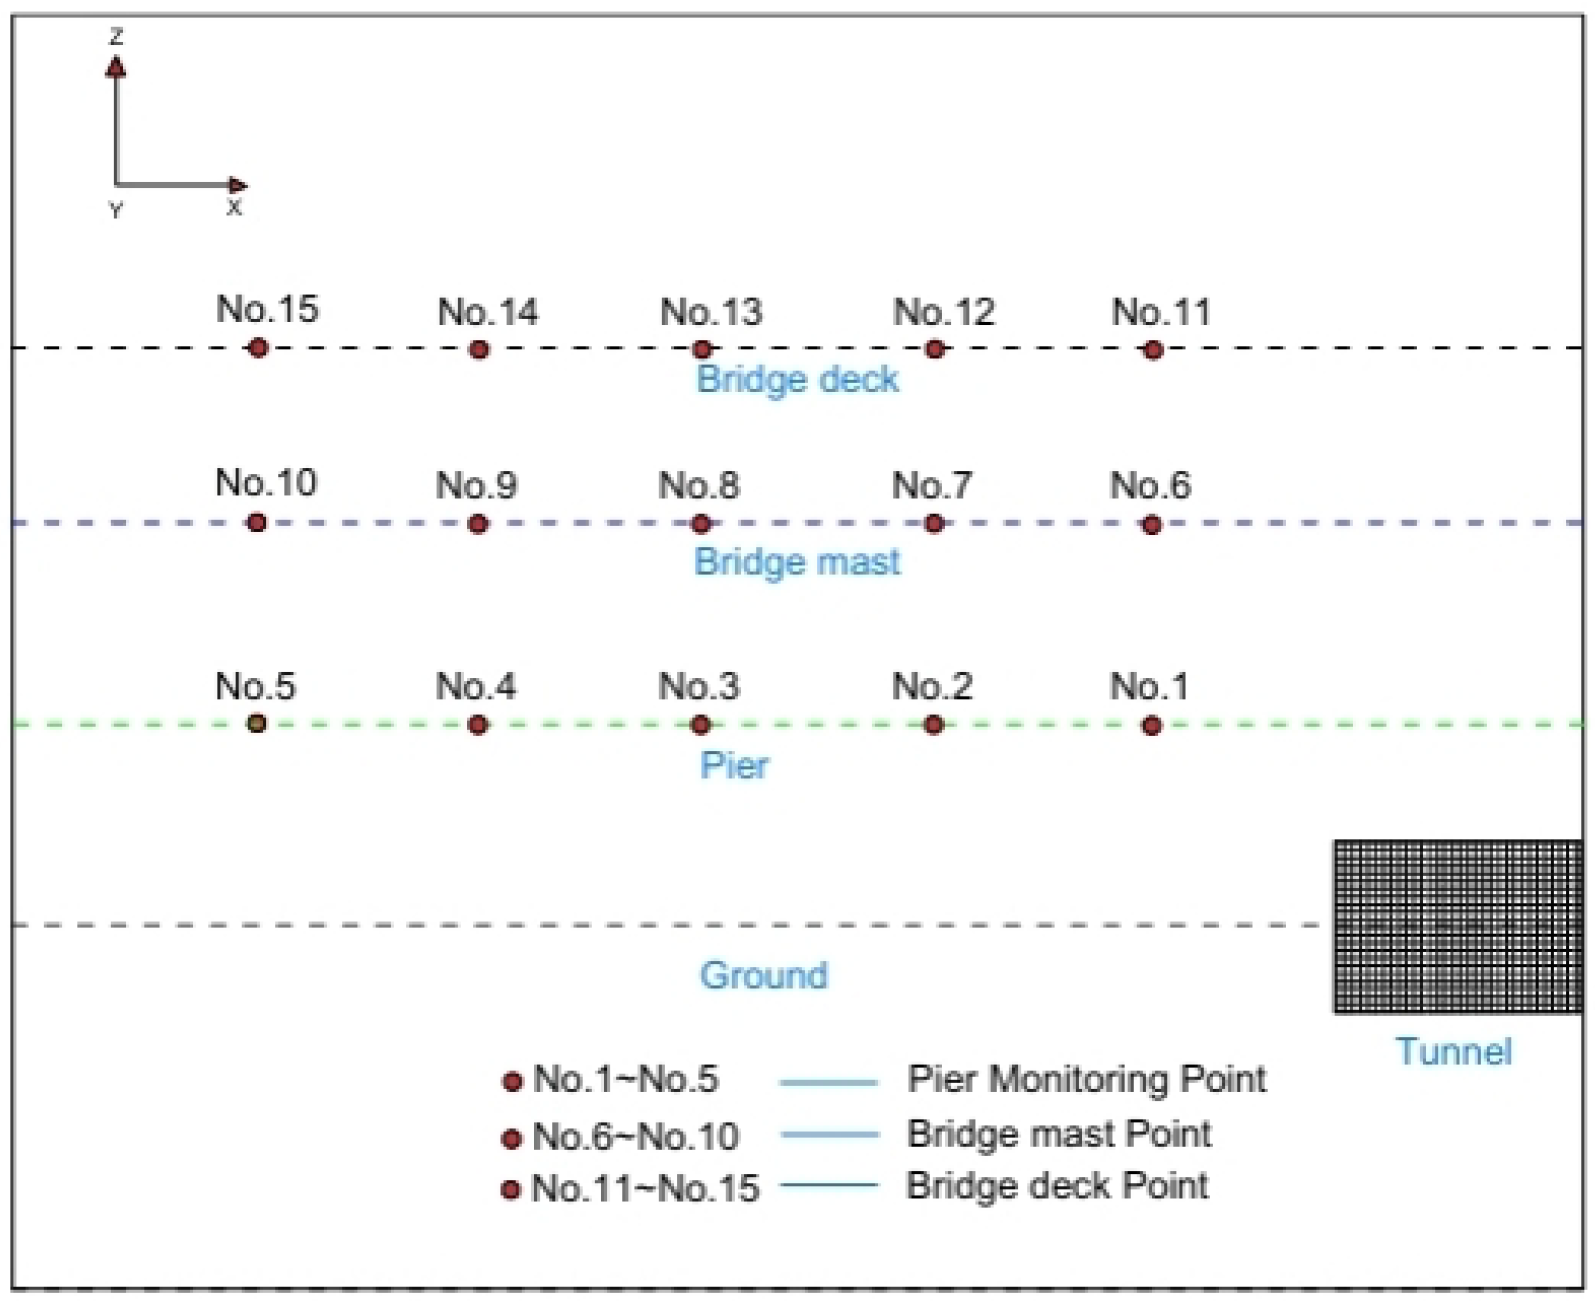
3.1.2. Arrangement of Blast Vibration Monitoring Points

Vibration monitoring points are arranged on the bridge deck and piers, with five points at ground level piers (No.1 to No.5) and five on the bridge deck (No.11 to No.15), as shown in Figure 5. Historical monitoring points are set at the middle of the bridge column closest to the tunnel (No.6 to No.10)

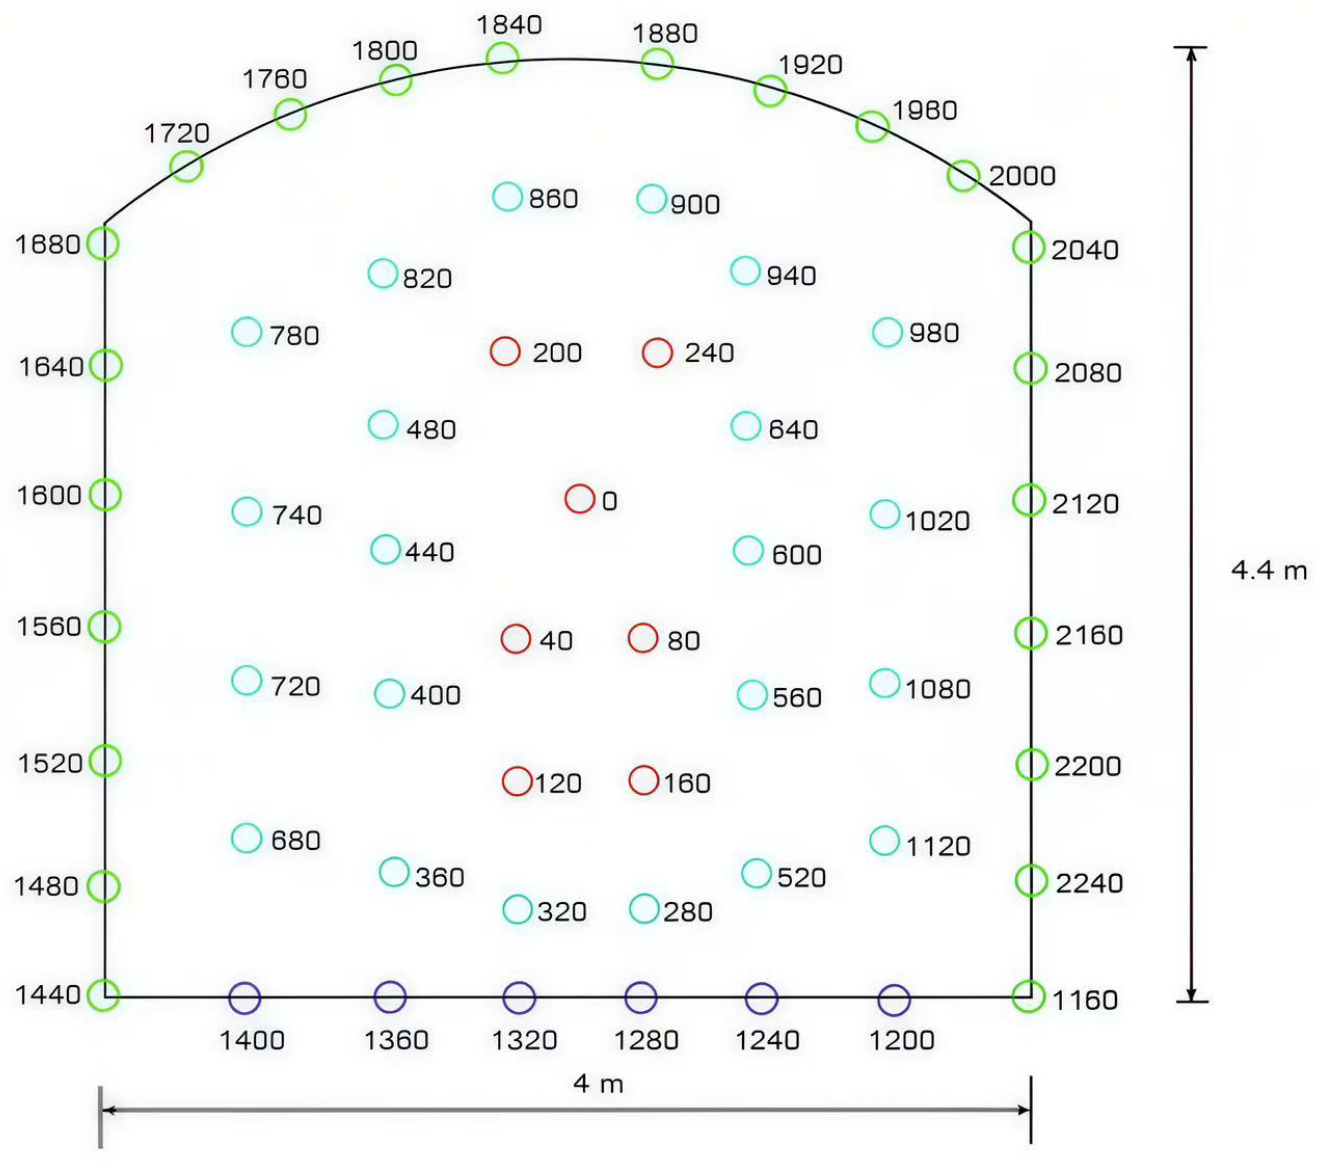
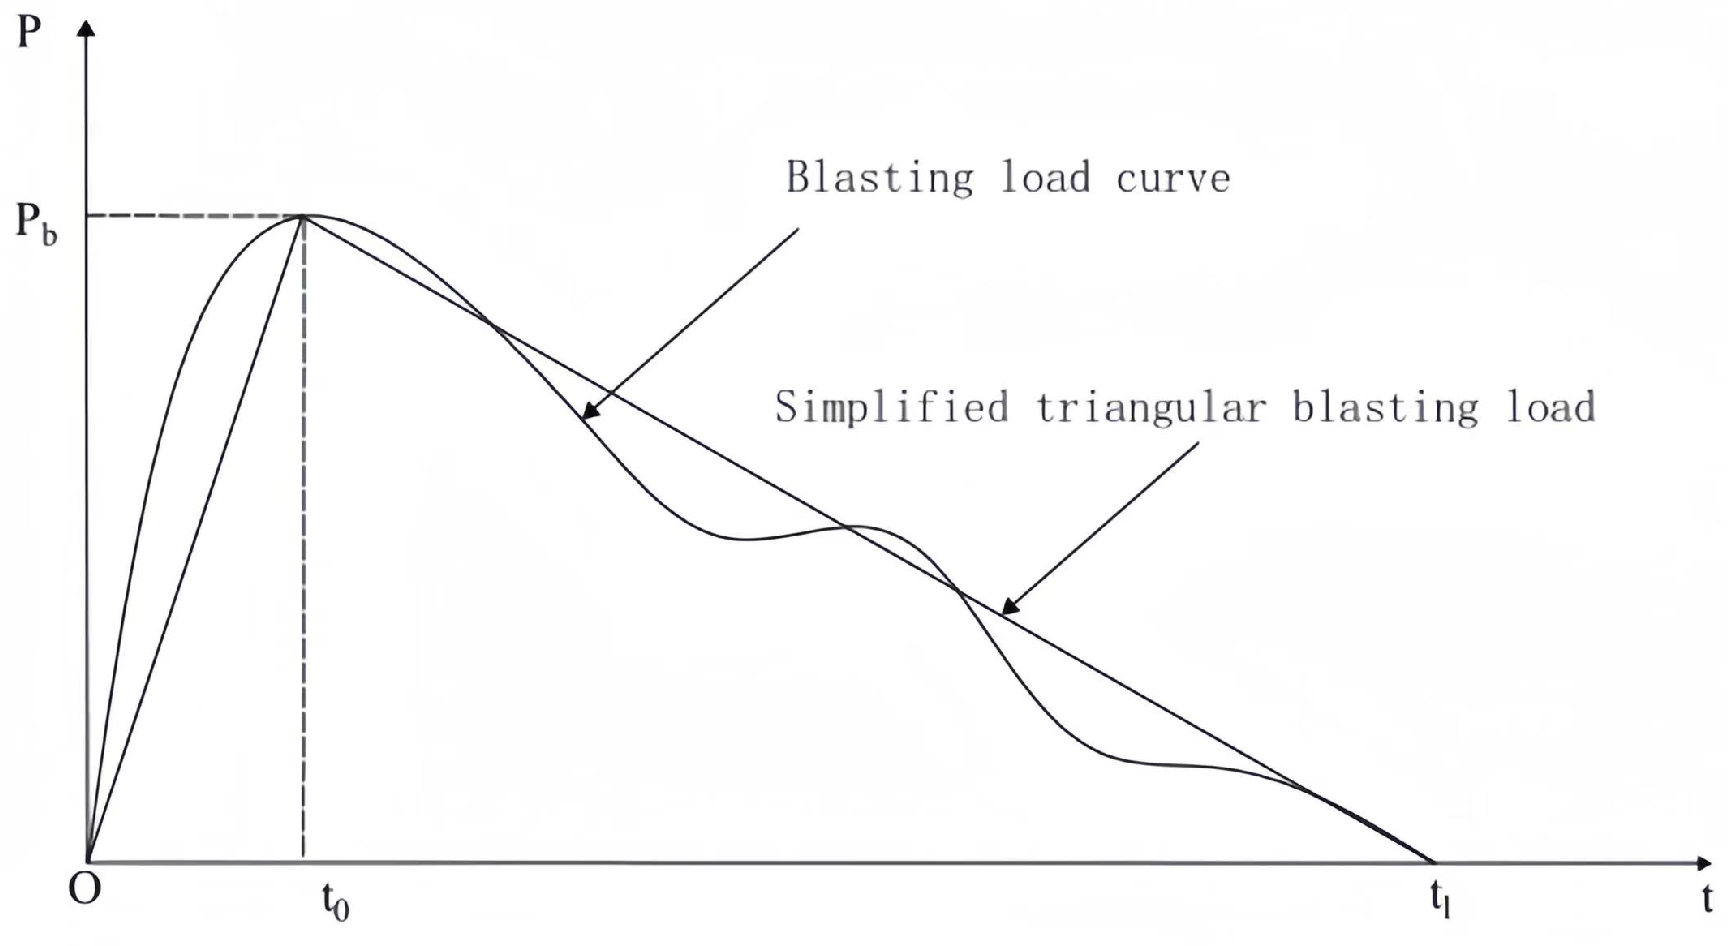
3.2. Blasting Vibration Load

The blasting load acts on the tunnel wall and its support system. The dynamic load in FLAC3D is used to simulate thestress propagation due to blasting, and the time-history curve of the explosion load is simplified to a triangular load to simulate the equivalent blasting load. The formula for calculating the equivalent blast load is as follows [27]:
P D = D 2 ρ 0 2 ( γ + 1 )
where P D represents the average detonation pressure of the explosive, D represents the detonation speed of the explosive, rho is explosive density, and γ is the isentropic coefficient of explosive, which is 1.3. When the blast hole is filled with the decoupled charge, the blasting gas pressure P is
P = A ρ v 0
where P is the pressure of the explosive gas in a certain state, A is a constant, ρ is the density of explosive gas in a certain state, and v0 is the isentropic index of the explosive gas. When the uncoupled charge coefficient is small, we have P P k and v 0 = γ = 3 . Additionally, when P < P k , and v 0 = v = 4 , v 0 = v = 1.4 , P k is the critical pressure of blasting, and the initial average pressure resulting from the blast holes is as follows:
P 0 = 1 8 ρ 0 D 2 k d 6 η
If the charge uncoupling coefficient is large, the expansion of the explosive gas can only pass through the P P k stage, and Formula (4) can be obtained.
P 0 = P k γ v γ ( ϱ e D 2 2 ( 1 + λ ) ) v λ k d 6 η
p(t) is usually considered as an exponential time-delay function, which is generally a decreasing exponential function, and the calculation can be handled according to the triangle approximation. The load–time relationship is as follows:
P ( t ) = P 0 t t r ( 0 t t r )
P ( t ) = P 0 t r + t b t t r ( t r t t r + t b )
According to the treatment method of explosive parameters and related literature, the increase time of explosion load is set to 100 μs, and the duration of blasting seismic wave is set to 0.6 s. The triangular shock wave load is shown in Figure 6, which is the peak value of blasting load. t r is the rise time.

3.3. Comparative Analysis of Numerical Simulation Results

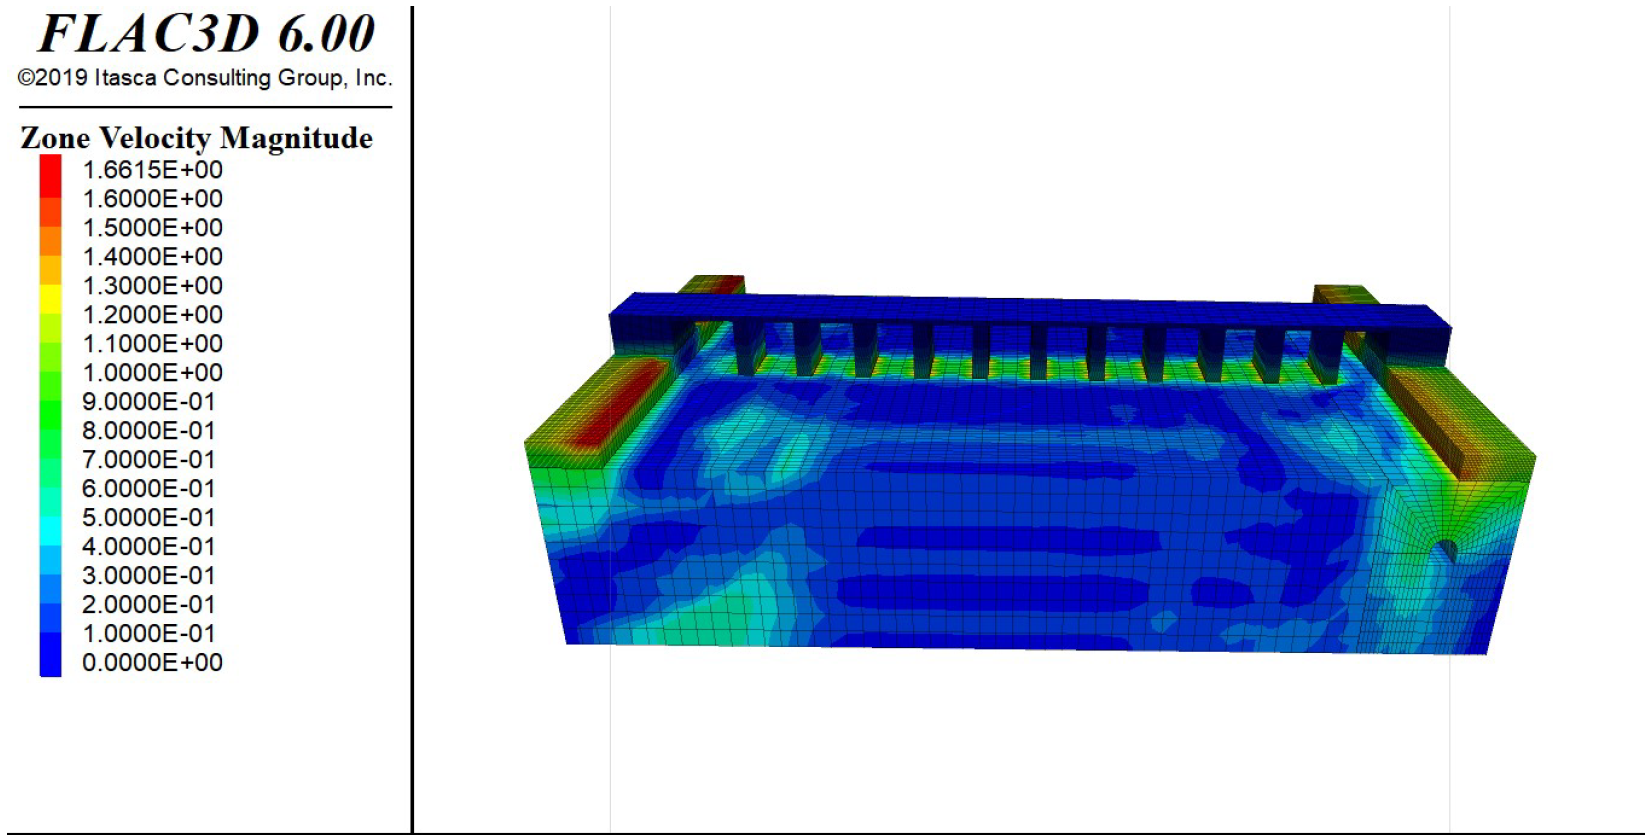
3.3.1. Stress Cloud Map Analysis of the Bridge Model under Vibration Caused by Circular Blasting

According to the tunnel stress distribution diagram (Figure 7), the energy generated by the explosive induces an initial impact on the surrounding rock of the tunnel, causing the circumferential stress to diffuse radially from the tunnel’s arch surface. As the stress wave propagates through the surrounding rock, it disrupts the stress equilibrium of the rock and soil layers, leading to stress relief in the surrounding rock strata. The diffusion rate of stress at the tunnel’s apex is markedly faster than that at its base. During the diffusion process, the generated stress within the energy rock strata interacts, allowing the stress state near the tunnel face to rapidly return to equilibrium, while the stress wave propagates swiftly through the mountain rock.
According to the stress distribution diagram (Figure 8), as the vibration wave propagates to the abutment situated above the tunnel, the simulated stress distribution induced by the abutment’s stress is the most intense, indicating a high peak vibration velocity and significant vibration intensity. Subsequently, the vibration wave is transmitted to the bridge deck, rendering it the area with the most pronounced peak vibration velocity within the entire bridge structure. According to the stress distribution diagram (Figure 8 and Figure 9), as the vibration wave propagates to the abutment situated above the tunnel, the simulated stress distribution induced by the abutment’s stress is the most intense, indicating a high peak vibration velocity and significant vibration intensity. Subsequently, the vibration wave is transmitted to the bridge deck, rendering it the area with the most pronounced peak vibration velocity within the entire bridge structure.

3.3.2. Analysis of the Measured Vibration Velocity of the Bridge under Blasting Conditions

Through vibration monitoring of the bridge, the time histories of peak vibration velocity for the bridge pier and deck are presented in Figure 10 and Figure 11, respectively.
From Figure 10 and Figure 11, it is evident that the maximum peak vibration velocity of the bridge deck is 0.235 cm/s, while the peak vibration velocity at the bottom of the bridge pile is 0.095 cm/s.

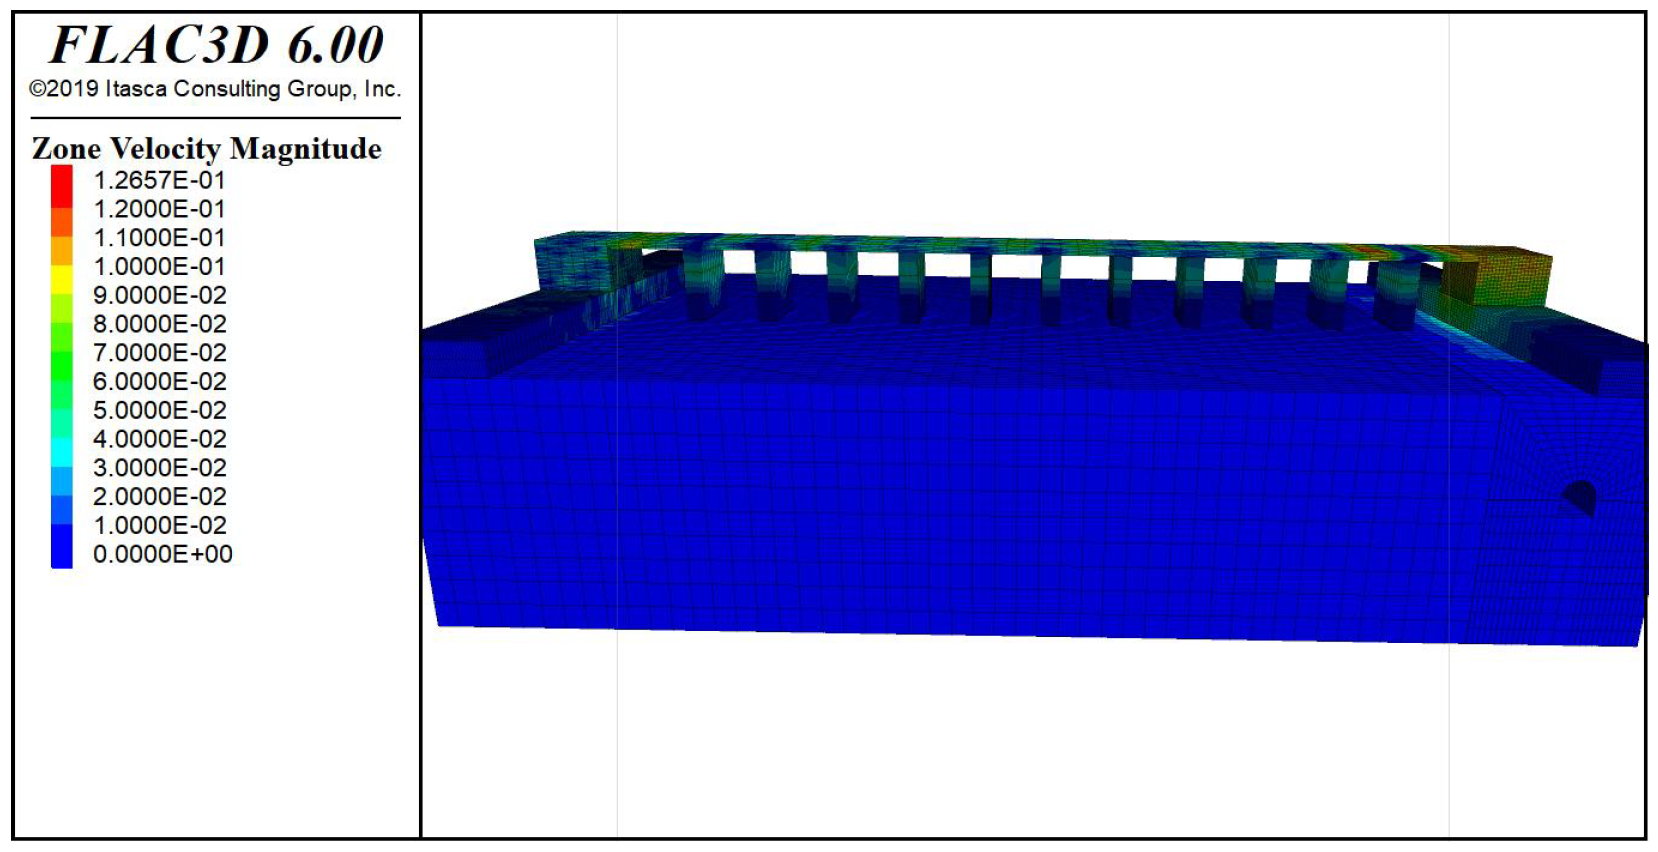
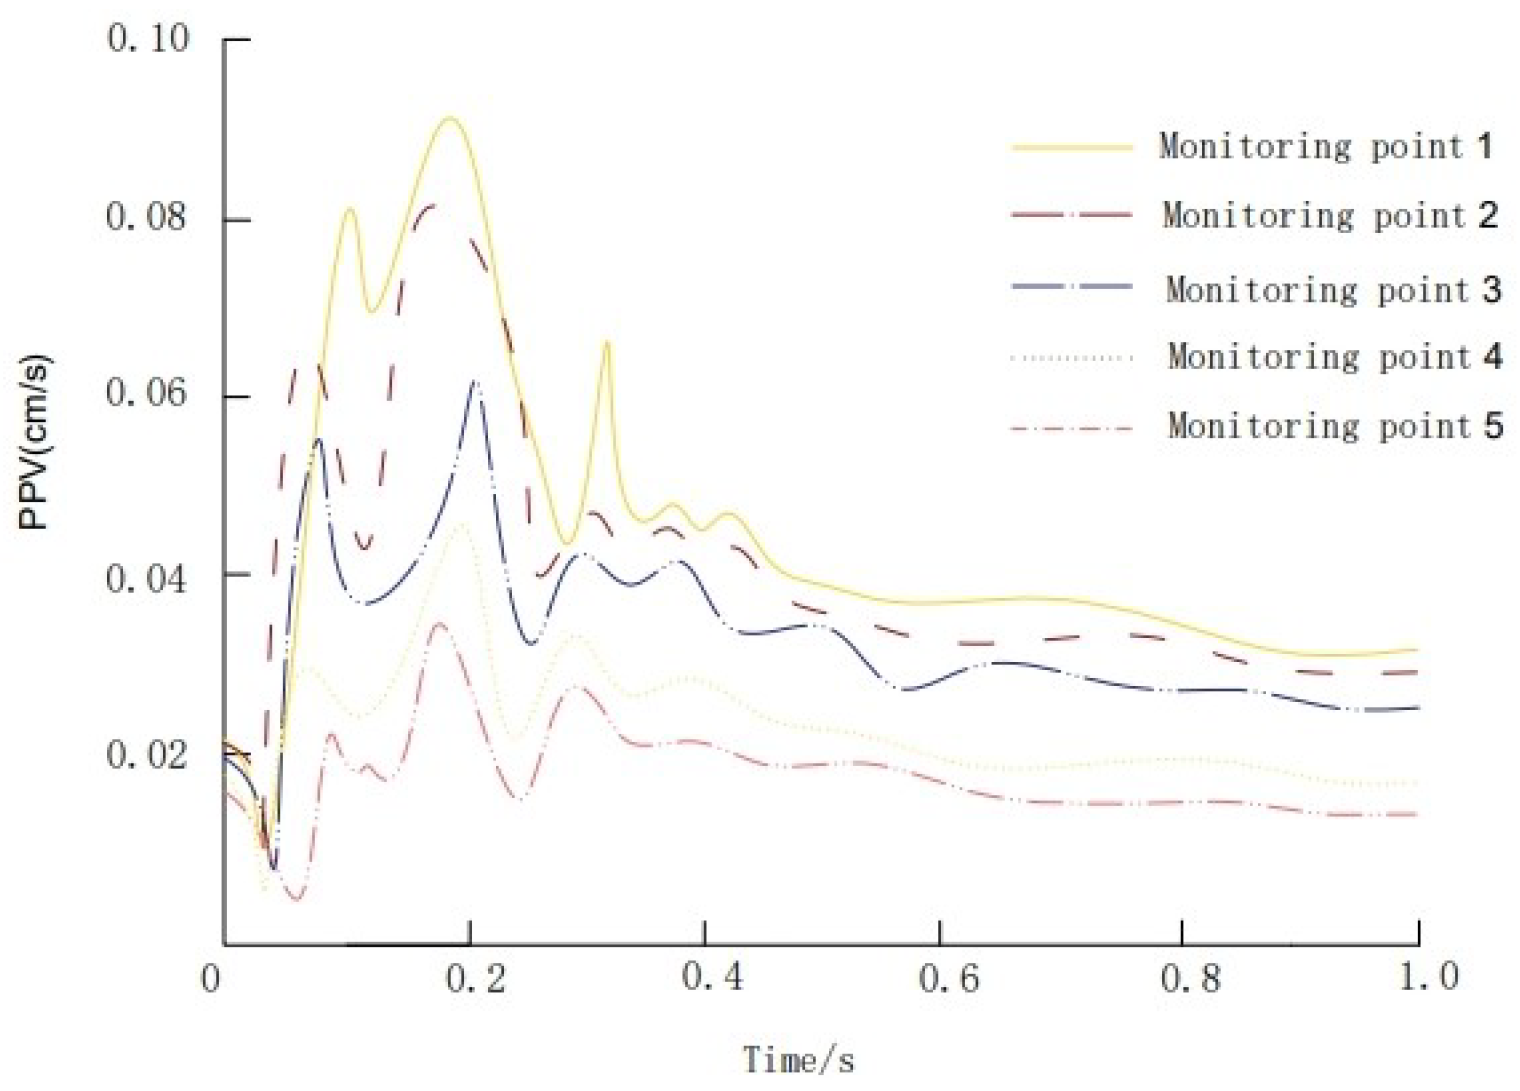
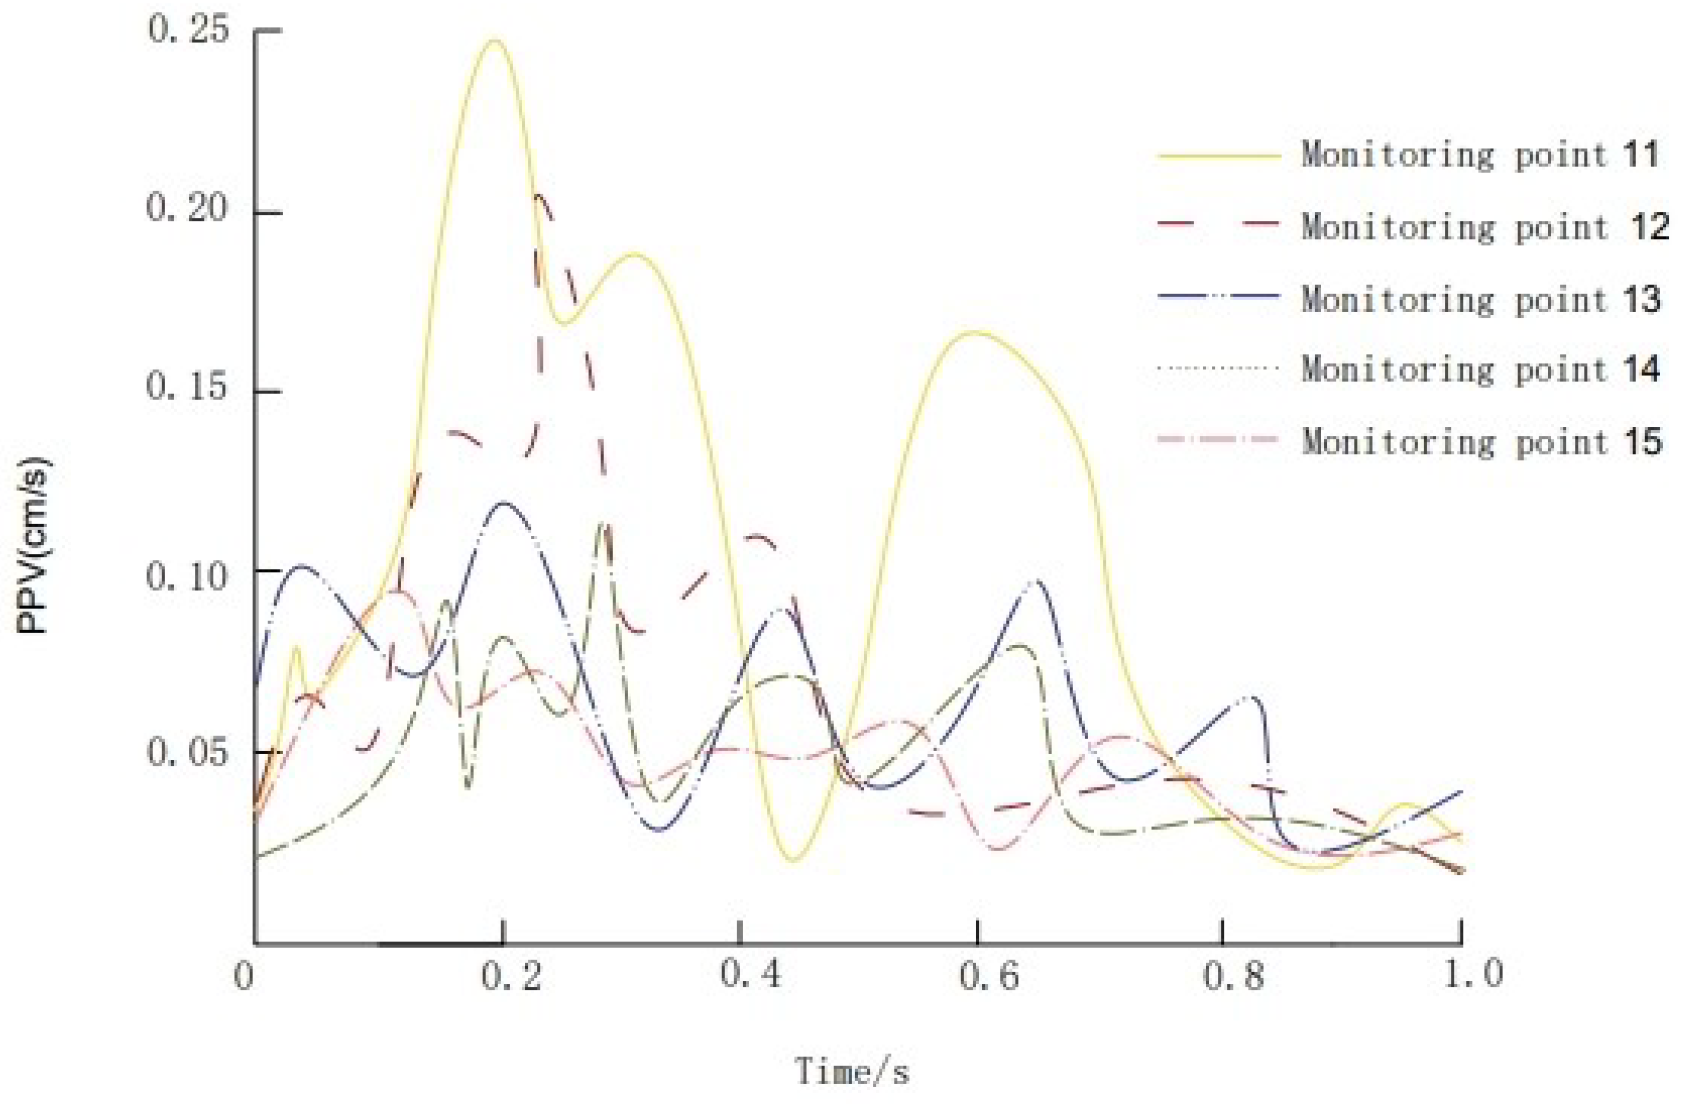
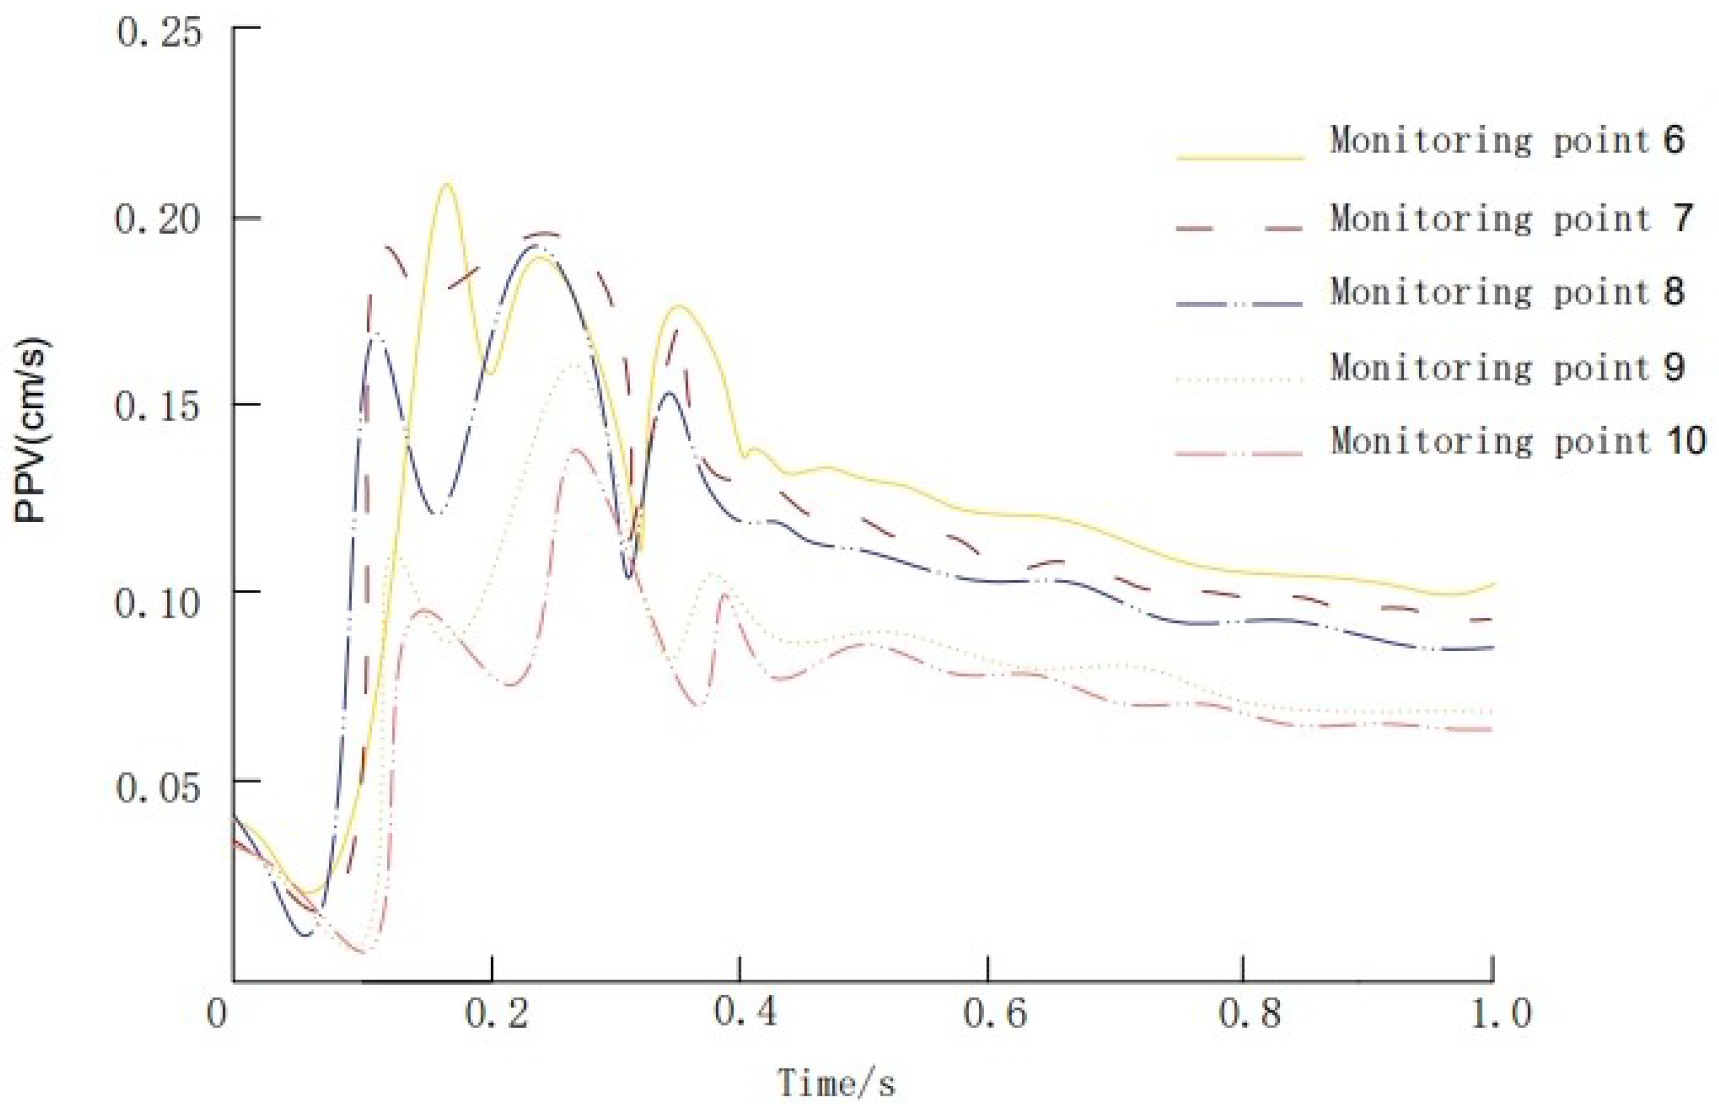
3.3.3. Analysis of Simulated Blasting Vibration Velocity of the Bridge

Figure 12 and Figure 13 depict the numerical simulation values for the bridge piers and bridge deck, respectively. Examination of the peak vibration velocity waveform simulated by FLAC3D reveals that the highest simulated peak vibration velocity occurs at Bridge Deck Measurement Point 1, reaching 0.250 cm/s, whereas for the bridge pile simulation, it is 0.095 cm/s, as depicted in Figure 14. The small discrepancy between the maximum peak vibration velocity and the actual measured value suggests that the numerical simulation results are acceptable. In comparison with the measured value, the peak vibration of the simulated value occurs around 0.2 s.
FLAC3D simulation predicts that the maximum peak vibration velocity at measuring points 6–10 in the middle of the bridge column is 0.209 cm/s. Consequently, the peak vibration velocity induced by tunnel blasting is highest at 0.235 cm/s on the bridge floor, followed by 0.209 cm/s on the bridge column, and 0.095 cm/s on the bridge pier.
Considering that the vibration velocity of bridge measuring points typically ranges between 0.05 and 0.25 cm/s, it could potentially exert a minor influence on the concrete that has not fully solidified within a short timeframe. For bridge concrete with a strength exceeding 95%, the permissible vibration limit is less than 2 cm/s within 6 h, and less than 6 cm/s after 72 h. In the context of this project, with the tunnel blast site located 43 m from the bridge, the highest vibration intensity resulting from blasting construction on the bridge measures 0.235 cm/s, comfortably below the vibration safety threshold of 2 cm/s. Thus, the vibration impact of blasting construction on the reinforced concrete materials of the bridge remains within the safety standard.

4. Effect and Optimization of Multiple Blasting Vibrations on Bridges under Construction

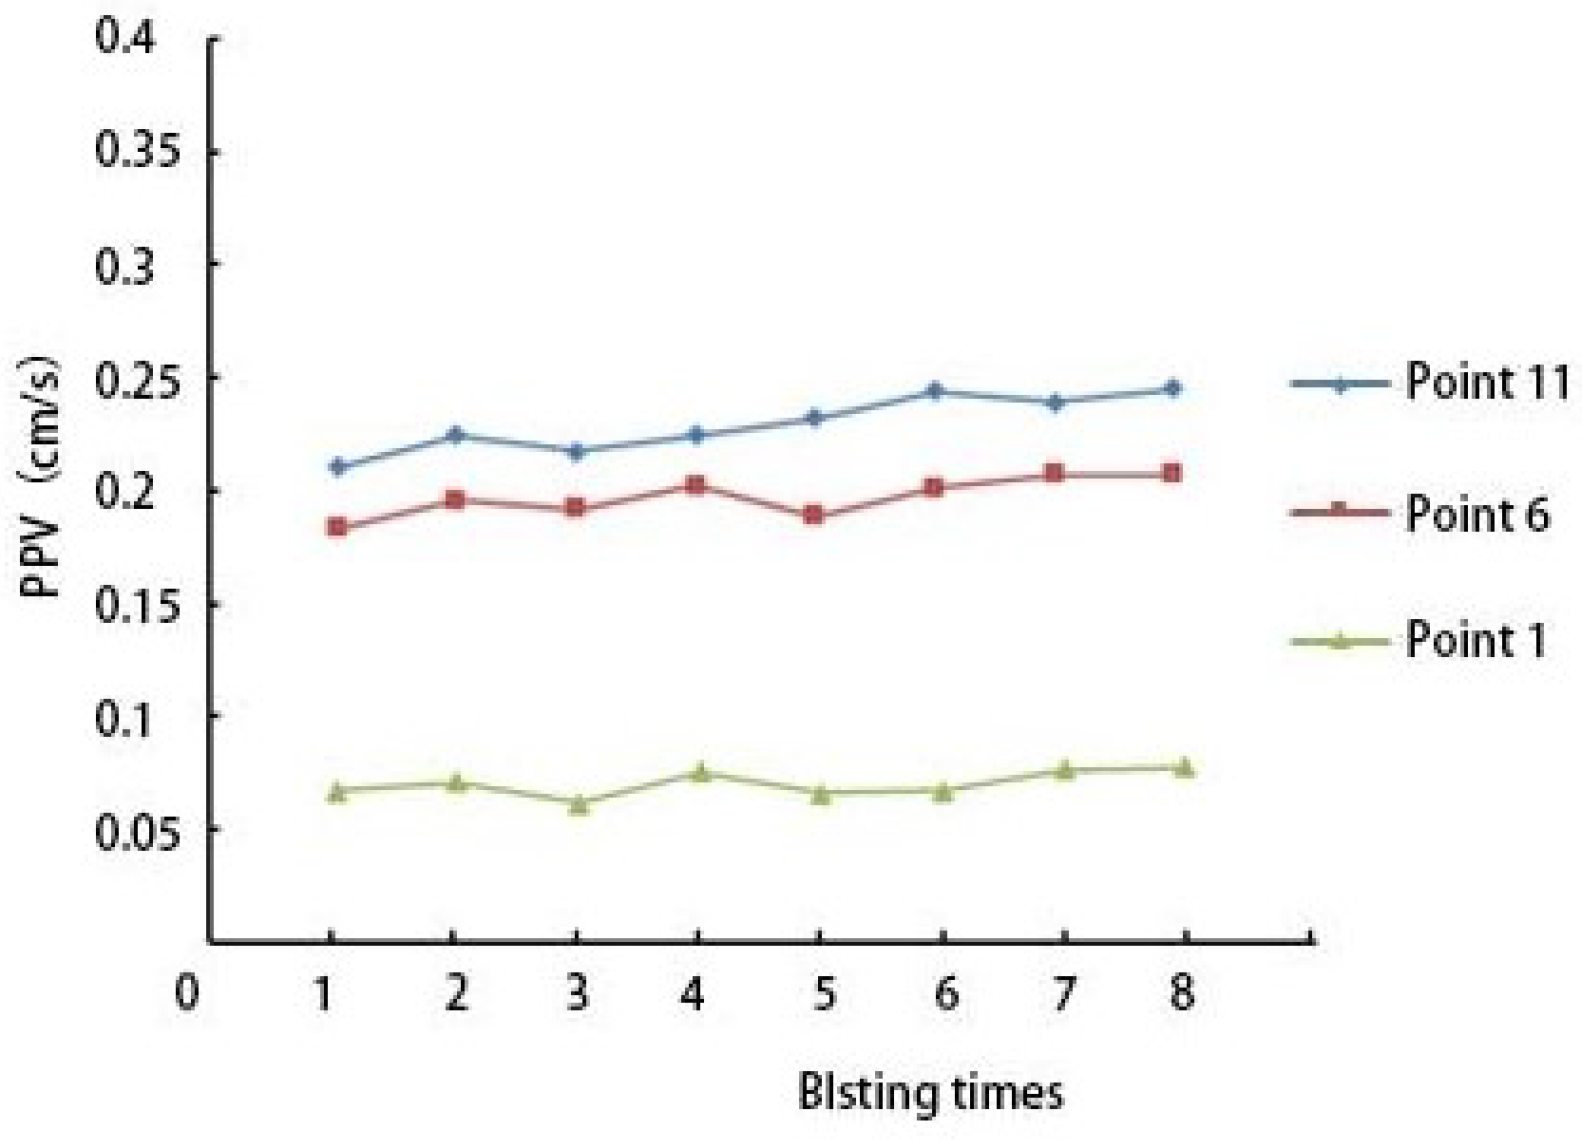
4.1. Relationship between Blasting Vibration Velocity and Blasting Frequency of Bridge Structures

To perform a macro-analysis of the overall condition of the bridge, peak vibration velocity data from measurement points on the bridge deck, bridge pile, and pier were selected for multiple cumulative blasting analyses. Specifically, the peak vibration velocities at Bridge Deck Measurement Point 11 and Pier Measurement Point 1 were measured multiple times, while the peak vibration velocity at bridge column measurement point 6 was simulated and predicted. These results are depicted in Figure 15. Examination of Figure 15 reveals irregular changes in vibration velocity for the first five peak vibration velocities at the three measurement points. However, from the fifth vibration velocity onwards, a consistent gradual increase followed by a gentle trend can be observed, all of which remain below 0.25 cm/s. Hence, the peak vibration velocity induced by cyclic blasting falls below the bridge construction safety standard requirement of 2.5 cm/s [28,29,30].
Additionally, regression calculation and analysis of the change in blasting vibration at identical monitoring points can establish the relationship between the bridge structure and blasting frequency, thereby elucidating the overall trend of vibration velocity at the measuring point. The curve depicting the relationship between blasting vibration values at the measuring point and blasting frequency is illustrated in Figure 16.
F ( x ) = 0.00255 x 3 + 0 . 02 3 + 0.18 x + 0.13
Regression calculation and analysis yield the polynomial regression equation for unit blasting vibration velocity and blasting frequency, as depicted in Equation (7), with a confidence level exceeding 0.95. The findings indicate that the relationship between blasting damage and blasting frequency of the bridge structure conforms to a cubic polynomial relationship. Moreover, although no damage occurs in this simulation after eight blasting events, there is an increase in the peak value of overall blasting vibration velocity. Hence, optimization of the current blasting scheme is imperative.
Through regression analysis, the polynomial regression equation for unit blasting vibration velocity as a function of the number of blasts is obtained, as shown in Equation (7), with confidence levels exceeding 0.95. The results indicate that the relationship between blasting damage to the bridge structure and the number of blasts follows a cubic polynomial pattern. Additionally, according to the trend of this equation, as the number of blasts increases, the blasting vibration velocity initially increases and then begins to decrease. Although no damage is observed, the overall peak blasting vibration velocity increases, suggesting a need to ameliorate the current blasting plan.

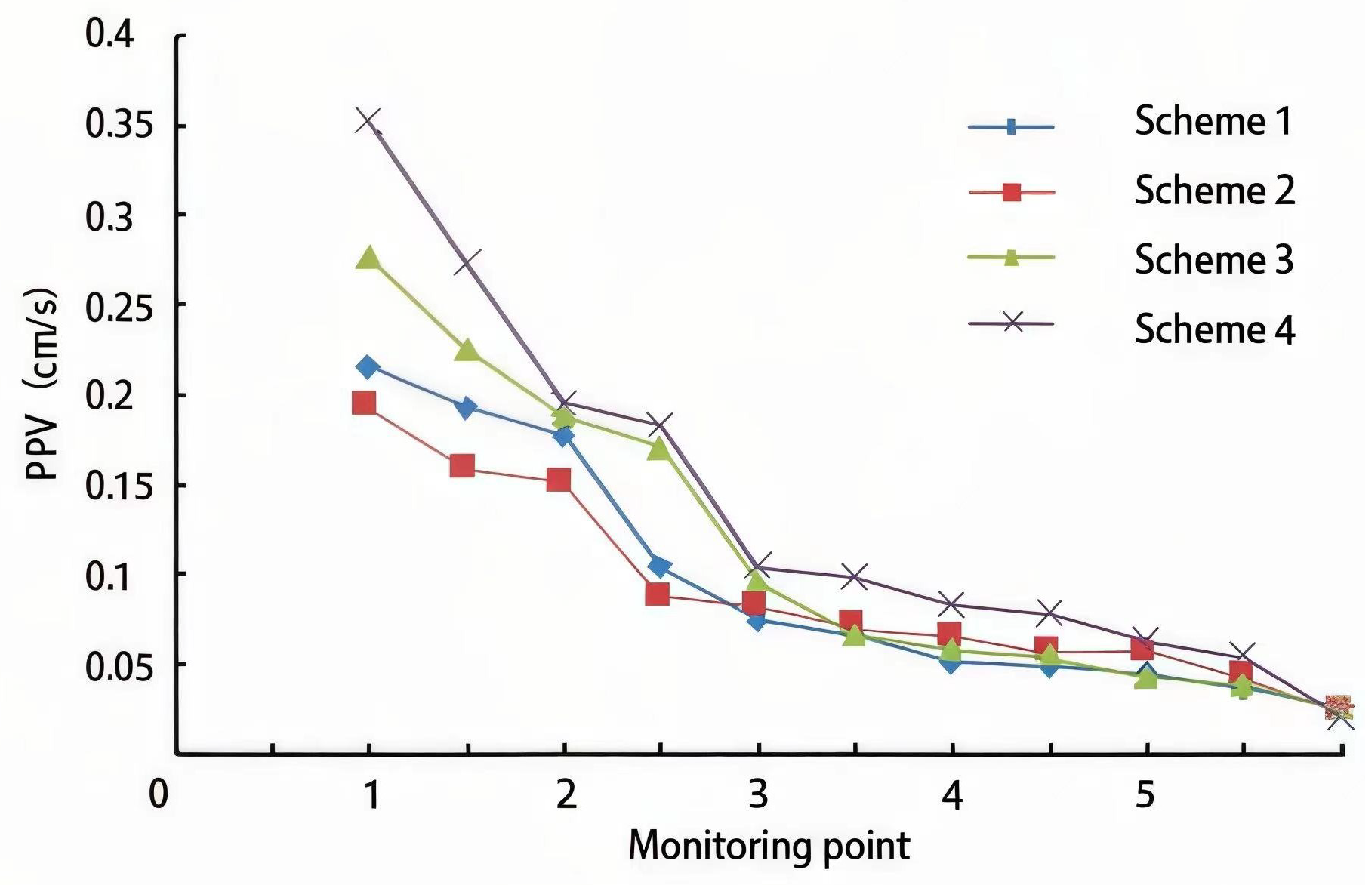
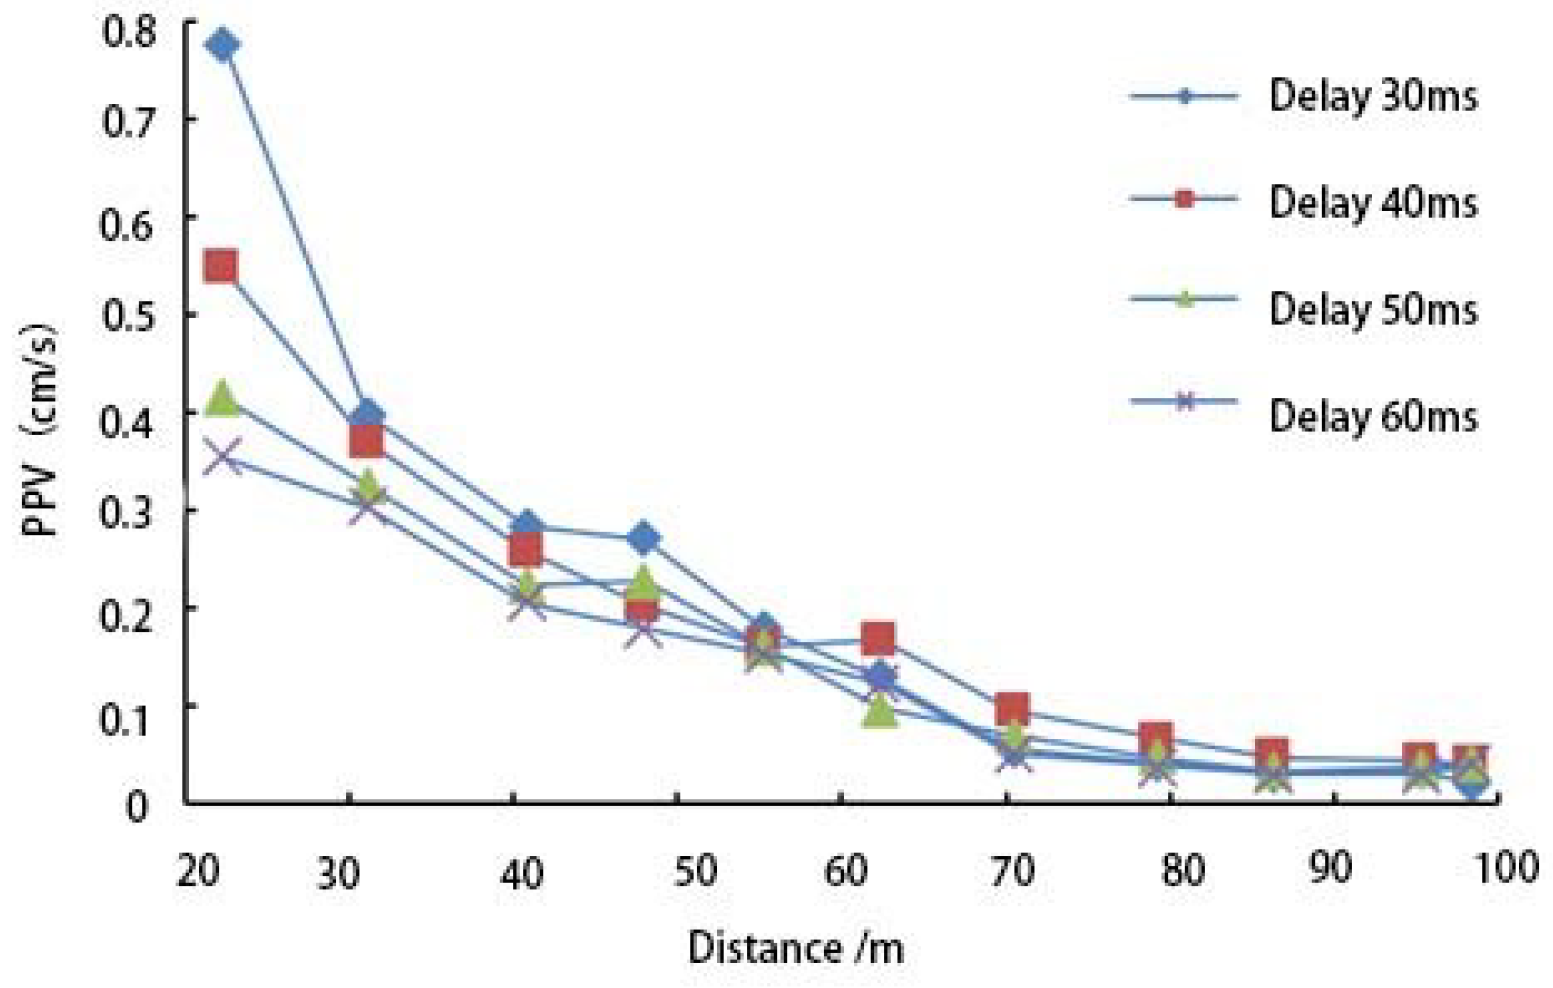
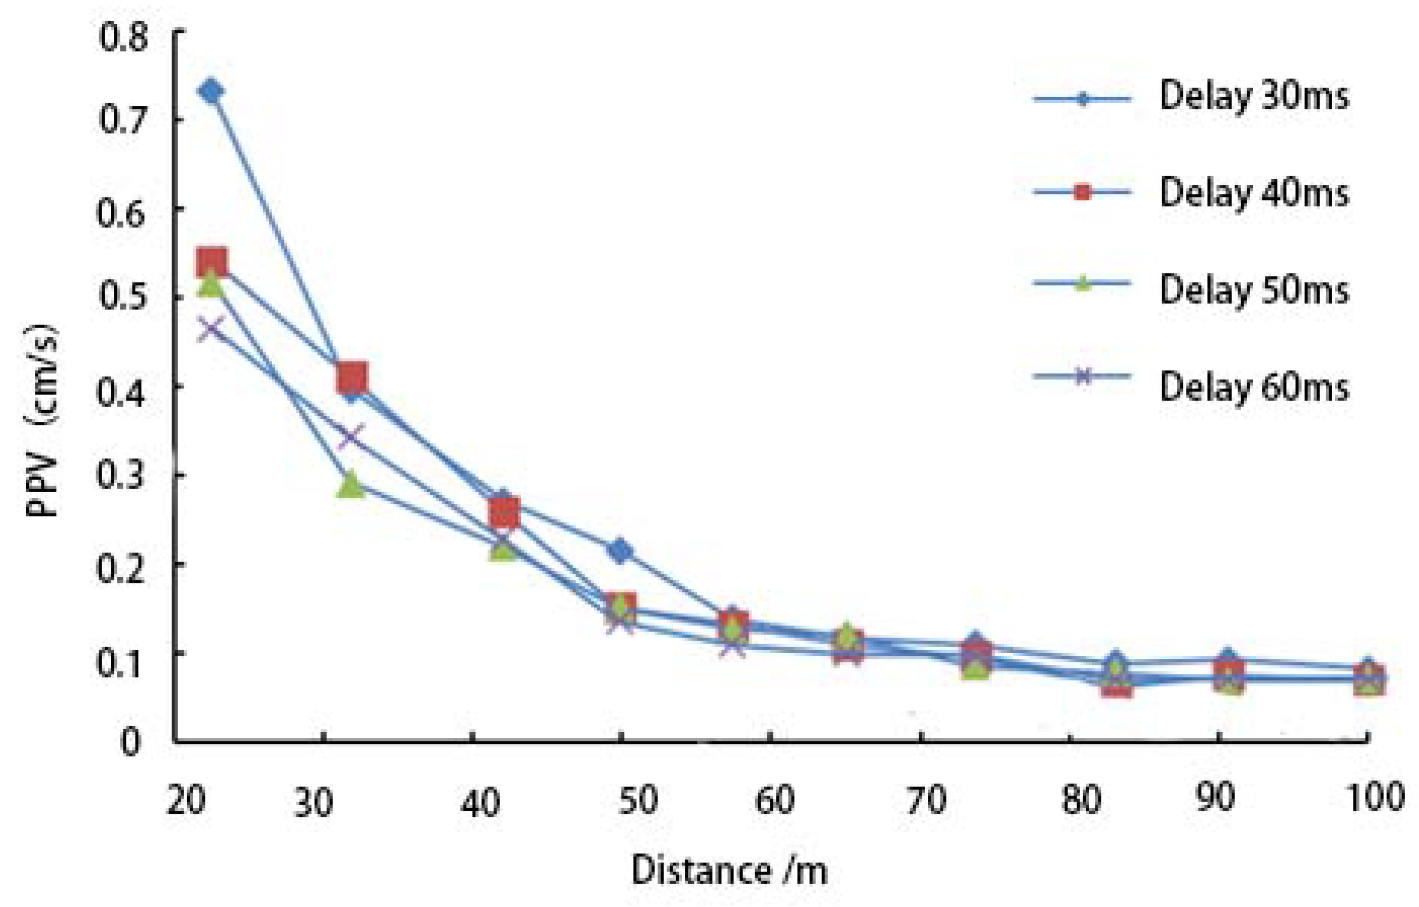
4.2. Optimization and Analysis of Blasting Vibration Scheme

Numerous factors influence the cyclic damage to structures caused by blasting vibrations. Based on formulas and site conditions, economical, significant, and controllable parameters were selected as research variables, namely, the number of slot holes, the amount of explosive charge in the slot holes, and different delay segments. Four blasting schemes were tested by adjusting the actual field experiment plans: Scheme 1 (hole depth 1.7 m, linear charge density in slot holes 0.33 kg/t), Scheme 2 (hole depth 1.9 m, linear charge density 0.33 kg/t), Scheme 3 (hole depth 1.7 m, linear charge density 0.42 kg/t), and Scheme 4 (hole depth 1.9 m, linear charge density 0.42 kg/t), compared with the original engineering Scheme 3. Scheme 3 corresponds to the blasting scheme illustrated in Figure 3. The maximum vibration velocity peaks generated on the bridge deck by the four blasting schemes were compared to select the optimal construction parameter scheme. The comparison results are shown in Figure 17.
As shown in Figure 17, Schemes 1 and 2 have the lowest overall peak vibration velocities, while Scheme 4 produces the highest peak vibration velocity on the bridge deck, posing the greatest safety risk. Given that construction should aim for efficiency, with Scheme 1 achieving a penetration rate of 1.7 m per cycle and Scheme 2 achieving 1.9 m per cycle, it is recommended to adopt Scheme 2 (hole depth 1.9 m, linear charge density 0.33 kg/t) for tunnel excavation. The primary distinctions between Scheme 2 and Scheme 3 lie in two parameters: the depth of the blasting holes and the amount of explosive charge used. All other design aspects remain consistent between the two schemes.
Investigating the impact of different segment delays on the bridge deck near the tunnel based on Scheme 2 for tunnel construction, vibration distribution analysis is conducted along the bridge axis, depicting the tri-directional peak vibration velocities at different delayed segments along the bridge deck axis, as illustrated in Figure 18, Figure 19 and Figure 20.
Analysis of Figure 18, Figure 19 and Figure 20 reveals the following: (1) With increasing blasting delay time, within a lateral distance of 50 m from the blasting point on the bridge deck, the peak transverse vibration velocity decreases rapidly for different delay segments of blasting schemes, followed by a gradual reduction in the differences between various delay segments. It becomes challenging to discern the delay with the lowest vibration impact due to the cross-effect of longitudinal and vertical vibrations, while the maximum peak transverse vibration velocity is observed for the 30 ms delay, which is the numerically highest. (2) Within the range of 50 to 250 m on the bridge deck, the lateral and longitudinal peak vibration velocities for the same instance and monitoring point fluctuate beyond each other for delays of 30 to 40 ms. The longitudinal peak vibration velocity for the 30 ms delay is significantly higher than the other three delay segments, and after 200 m, the peak vibration velocity remains relatively stable. Consequently, delays of 30 and 40 ms have the highest impact on bridge vibration, with the 50 ms delay exhibiting lower vibration compared to the 60 ms delay. (3) There is little difference in vibration velocity between delays of 50 and 60 ms within the range of 250 to 400 m. (4) A comprehensive comparison of the tri-directional vibration along the bridge axis within the three segments reveals that the maximum peak vibration velocity occurs for the 30 ms delay, while the minimum occurs for delays of 50 and 60 ms. Given the advantage of the 50 ms delay in the midsection, and to ensure blasting effectiveness, selecting a delay of 50 ms for construction is safer and more cost-effective.

5. Discussion

The results of our study provide valuable insights into the impact of cyclic tunnel blasting on the stability of nearby bridge structures under construction. This section will discuss the implications of our findings, the limitations of the study, and directions for future research.

5.1. Implications of Findings

Our research confirms that cyclic blasting significantly affects the stability of adjacent bridge structures, with the vibration velocity at the bridge deck decreasing more rapidly than at the pier base as the distance from the tunnel increases. This differential response highlights the need for careful consideration of the location-specific impact when planning blasting operations near sensitive structures.
The recorded peak vibration velocities, all within the range of 0.05 to 0.25 cm/s, fall well below the threshold for material damage. This indicates that the structural integrity of the bridge components can be maintained even with frequent blasting operations, provided that the blasting parameters are carefully controlled. The identification of Scheme 2 as the optimal blasting scheme underscores the importance of optimizing blasting parameters to balance construction efficiency and safety. The chosen parameters (a hole depth of 1.9 m, a linear charge density of 0.33 kg/t, and a blasting delay of 50 ms) ensure that vibration impacts remain within safe limits while maintaining effective progress in tunneling operations.

5.2. Limitations of the Study

While the study provides a robust framework for assessing the impact of cyclic blasting on bridge structures, there are several limitations to consider. First, the study focuses on a specific type of bridge structure and material composition. The results may not be directly applicable to different bridge designs or materials without further validation. Second, the environmental conditions and geological settings of the study area are unique, and variations in these factors could influence the vibration response of nearby structures.
Additionally, the numerical model, while highly accurate, is based on certain assumptions and simplifications that may not capture all of the complexities of real-world blasting scenarios. For instance, the model assumes uniform material properties and does not account for potential variations in the blasting process or unforeseen geological anomalies.

5.3. Directions for Future Research

Future research should address the limitations identified in this study by expanding the scope of investigation to include different types of bridge structures and materials. Studies should also consider a wider range of environmental conditions and geological settings to enhance the generalizability of the findings.
Long-term monitoring of bridge structures subjected to repeated blasting operations is necessary to understand the cumulative effects and potential degradation over time. This will help in developing more comprehensive guidelines and safety standards for cyclic blasting near sensitive structures.
The integration of real-time monitoring and dynamic adjustment technologies represents a promising direction for future research. Advanced sensors and data analytics can provide continuous feedback on the vibration impacts during blasting operations, enabling real-time adjustments to blasting parameters to minimize risks.
Moreover, collaboration with construction projects worldwide could facilitate the collection of a broader dataset, allowing for the refinement of predictive models and the development of universally applicable best practices.
In summary, our study demonstrates that cyclic tunnel blasting can be conducted safely near bridge structures under construction, provided that the blasting parameters are optimized to control vibration impacts. The findings contribute to a better understanding of the vibration response of bridge components and offer practical guidance for safe and efficient blasting operations. Future research should build on these findings to enhance the safety and resilience of infrastructure projects subjected to cyclic blasting.

6. Conclusions

Our study highlights the significant impact of cyclic tunnel blasting on the stability of adjacent bridge structures under construction. Utilizing FLAC3D software, we developed a 3D numerical model to simulate the vibration response of the bridge. The results demonstrate that the peak vibration velocities induced by cyclic blasting on bridge components are within safe limits, ensuring structural integrity. Specifically, the vibration velocity at the bridge deck decreases more rapidly with increasing distance from the tunnel compared to the pier base.
Key findings include the following:
  • The results show that vibration velocity decreases more rapidly at the bridge deck than at the pier base with increasing distance from the tunnel.
  • Peak vibration velocities were recorded at 0.235 cm/s for the bridge deck and 0.081 cm/s for the pier base, with a predicted 0.209 cm/s at the middle column.
  • The peak vibration velocity induced by blasting remains within safe limits, and regression analysis indicates that eight daily blasting cycles do not compromise the safety of bridge structures 43 m away.
  • The optimized blasting scheme is Scheme 2, with a hole depth of 1.9 m, a linear charge density of 0.33 kg/t, and a blasting delay of 50 ms, making it the optimal blasting scheme for this project. This scheme ensures both construction efficiency and compliance with safety standards.
Our research provides a systematic evaluation of the differential impacts of cyclic blasting on various bridge components and introduces a highly accurate three-dimensional numerical model. This model serves as a scientific reference for ensuring safety in blasting operations. Future research should focus on the long-term effects of repeated blasting on different materials and under varying environmental conditions. Additionally, the development of real-time monitoring and dynamic adjustment technologies for blasting parameters will further enhance construction safety and efficiency.

Author Contributions

Conceptualization, Y.C. and E.C.; funding acquisition, E.C.; methodology, Y.C.; software, Y.C.; validation, E.C.; writing—original draft, Y.C.; writing—review editing, Y.C. All authors have read and agreed to the published version of the manuscript.

Funding

This research received no external funding.

Institutional Review Board Statement

Not applicable.

Informed Consent Statement

Not applicable.

Data Availability Statement

The raw data supporting the conclusions of this article will be made available by the authors upon request.

Conflicts of Interest

The authors declare no conflicts of interest.

References

  1. Liu, G.; Feng, X.-T.; Jiang, Q.; Yao, Z.; Li, S. In situ observation of spalling process of intact rock mass at large cavern excavation. Eng. Geol. 2017, 226, 52–69. [Google Scholar] [CrossRef]
  2. Wang, S.; Sloan, S.; Sheng, D.; Tang, C. Numerical analysis of the failure process around a circular opening in rock. Comput. Geotech. 2012, 39, 8–16. [Google Scholar] [CrossRef]
  3. Zhang, H.; Chen, L.; Chen, S.; Sun, J.; Yang, J. The spatiotemporal distribution law of microseismic events and rockburst characteristics of the deeply buried tunnel group. Energies 2018, 11, 3257. [Google Scholar] [CrossRef]
  4. Li, H.; Shu, D. Influential factors analysis of blasting vibration attenuation law. J. Wuhan. Univ. Technol. 2005, 38, 79–82. [Google Scholar]
  5. Ma, G.; Hao, H.; Zhou, Y. Assessment of structure damage to blasting induced ground motions. Eng. Struct. 2000, 22, 1378–1389. [Google Scholar] [CrossRef]
  6. Lu, W.B.; Luo, Y.; Chen, M.; Shu, D.Q. An introduction to chinese safety regulations for blasting vibration. Environ. Earth. Sci. 2012, 67, 1951–1959. [Google Scholar] [CrossRef]
  7. Bayraktar, A.; Altunişik, A.C.; Özcan, M. Safety assessment of structures for near-field blast-induced ground excitations using operational modal analysis. Soil. Dyn. Earthq. Eng. 2012, 39, 23–36. [Google Scholar] [CrossRef]
  8. Bayraktar, A.; Türker, T.; Altunişik, A.C.; Sevim, B. Evaluation of blast effects on reinforced concrete buildings considering operational modal analysis results. Soil. Dyn. Earthq. Eng. 2010, 30, 310–319. [Google Scholar] [CrossRef]
  9. Dhakal, R.P.; Pan, T.-C. Response characteristics of structures subjected to blasting-induced ground motion. Int. J. Impact Eng. 2003, 28, 813–828. [Google Scholar] [CrossRef]
  10. Li, B.; Rong, H.-C.; Pan, T.-C. Drift-controlled design of reinforced concrete frame structures under distant blast conditions—Part i: Theoretical basis. Int. J. Impact. Eng. 2007, 34, 743–754. [Google Scholar] [CrossRef]
  11. Li, B.; Rong, H.-C.; Pan, T.-C. Drift-controlled design of reinforced concrete frame structures under distant blast conditions—Part ii: Implementation and evaluation. Int. J. Impact. Eng. 2007, 34, 755–770. [Google Scholar] [CrossRef]
  12. Ramulu, M.; Chakraborty, A.; Sitharam, T. Damage assessment of basaltic rock mass due to repeated blasting in a railway tunnelling project—A case study. Tunn. Undergr. Sp. Technol. 2009, 24, 208–221. [Google Scholar] [CrossRef]
  13. Huo, X.S.; Wong, L.U. Experimental study of early-age behavior of high performance concrete deck slabs under different curing methods. Constr. Build. Mater. Ater. 2006, 20, 1049–1056. [Google Scholar] [CrossRef]
  14. Wang, Z.W.; Li, X.B.; Peng, K.; Xie, J.F. Impact of blasting parameters on vibration signal spectrum: Determination and statistical evidence. Tunn. Undergr. Sp. Technol. 2015, 48, 94–100. [Google Scholar] [CrossRef]
  15. He, R.; Jiang, N.; Li, D.W.; Qi, J.F. Dynamic response characteristic of building structure under blasting vibration of underneath tunnel. Shock. Vib. 2022, 2022, 9980665. [Google Scholar] [CrossRef]
  16. Guan, X.; Yang, N.; Zhang, W.; Li, M.; Liu, Z.; Wang, X.; Zhang, S. Vibration response and failure modes analysis of the temporary support structure under blasting excavation of tunnels. Eng. Fail. Anal. 2022, 136, 106188. [Google Scholar] [CrossRef]
  17. Deng, X.; Wang, J.; Wang, R.; Liu, Q. Influence of blasting vibrations generated by tunnel construction on an existing road. Int. J. Civ. Eng. 2020, 18, 1381–1393. [Google Scholar] [CrossRef]
  18. Yue, H.Z.; Yu, C.; Li, H.B.; Zhou, C.B.; Chen, S.H.; Shao, Z.S. The Effect of Blast-Hole Arrangement, Delay Time, and Decoupling Charge on Rock Damage and Vibration Attenuation in Multihole Blasting. Shock. Vib. 2022, 2022, 2110160. [Google Scholar] [CrossRef]
  19. He, L.; Kong, D.; Lei, Z. Research on vibration propagation law and dynamic effect of bench blasting. Mathematics 2022, 10, 2951. [Google Scholar] [CrossRef]
  20. Chen, F.; He, G.; Dong, S.; Zhao, S.; Shi, L.; Liu, X.; Zhang, B.; Qi, N.; Deng, S.; Zhang, J. Space-time effect prediction of blasting vibration based on intelligent automatic blasting vibration monitoring system. Appl. Sci. 2021, 12, 12. [Google Scholar] [CrossRef]
  21. Dai, C.; Sui, H.; Ma, C. Study on the vibration effect of short footage blasting load on surrounding rock-support structure of tunnel. Shock. Vib. 2020, 2020, 8829349. [Google Scholar] [CrossRef]
  22. Lai, J.; Wang, K. Vibration response characteristics of the cross tunnel structure. Shock. Vib. 2016, 2016, 9524206. [Google Scholar] [CrossRef]
  23. Huang, D.; Cui, S.; Li, X. Wavelet packet analysis of blasting vibration signal of mountain tunnel. Soil. Dyn. Earthq. Eng. 2019, 117, 72–80. [Google Scholar] [CrossRef]
  24. Wan, S.; Huang, J.; Luo, Y.; Li, X.; Pu, Q. Research on cumulative damage characteristics of rock anchor beam concrete supporting structure by blasting vibration of underground powerhouse. Shock. Vib. 2021, 2021, 8887713. [Google Scholar] [CrossRef]
  25. Yao, Q.; Yang, X.G.; Chen, X.Z.; Li, H.T. Numerical simulation of dynamic response of large underground powerhouse subjected to blasting vibration. J. Vib. Control. 2014, 33, 66–76. [Google Scholar]
  26. Geniş, M. Assessment of the dynamic stability of the portals of the dorukhan tunnel using numerical analysis. Int. J. Rock. Mech. Min. 2010, 47, 1231–1241. [Google Scholar] [CrossRef]
  27. Zhu, B.; Jiang, N.; Zhou, C.; Luo, X.; Li, H.; Chang, X.; Xia, Y. Dynamic interaction of the pipe-soil subject to underground blasting excavation vibration in an urban soil-rock stratum. Tunn. Undergr. Sp. Technol. 2022, 129, 104700. [Google Scholar] [CrossRef]
  28. Li, J.; Hao, H. A simplified numerical method for blast induced structural response analysis. Int. J. Prot. Struct. 2014, 5, 323–348. [Google Scholar] [CrossRef]
  29. Li, Z.; Wu, S.; Cheng, Z.; Jiang, Y. Numerical investigation of the dynamic responses and damage of linings subjected to violent gas explosions inside highway tunnels. Shock. Vib. 2018, 2018, 2792043. [Google Scholar] [CrossRef]
  30. Li, H.; Zhang, X.; Li, D.; Wu, L.; Gao, W.; Zhou, H. Numerical simulation of the effect of empty hole between adjacent blast holes in the perforation process of blasting. J. Intell. Fuzzy. Syst. 2019, 37, 3137–3148. [Google Scholar] [CrossRef]
Figure 1. Satellite map of the project site.
Applsci 14 05940 g001
Figure 2. Images of the project site.
Applsci 14 05940 g002
Figure 3. Blasting hole and delay layout diagram.
Applsci 14 05940 g003
Figure 4. The finite element models of the tunnel and bridge.
Applsci 14 05940 g004
Figure 5. The arrangement of vibration monitoring points.
Applsci 14 05940 g005
Figure 6. Diagram of a triangular shock wave load curve.
Applsci 14 05940 g006
Figure 7. The stress cloud map of the tunnel.
Applsci 14 05940 g007
Figure 8. Stress distribution map of bridge column and bridge deck.
Applsci 14 05940 g008
Figure 9. Stress distribution map of the bridge deck.
Applsci 14 05940 g009
Figure 10. Peak vibration velocity measurement at the pier measuring point.
Applsci 14 05940 g010
Figure 11. Peak vibration velocity measurement at the bridge deck measuring points.
Applsci 14 05940 g011
Figure 12. Simulation of peak vibration velocity at pier measurement points.
Applsci 14 05940 g012
Figure 13. Simulation of peak vibration velocity at measurement point on the bridge deck.
Applsci 14 05940 g013
Figure 14. Simulation of the peak vibration velocity at the bridge pile measuring points.
Applsci 14 05940 g014
Figure 15. Vibration data from multiple blasting events on the bridge deck, pile, and pier.
Applsci 14 05940 g015
Figure 16. Regression relationship between peak particle velocity (PPV) at Point 1 and blasting frequency.
Applsci 14 05940 g016
Figure 17. Peak vibration velocity of various blasting schemes.
Applsci 14 05940 g017
Figure 18. Peak transverse vibration velocity for Scheme 2.
Applsci 14 05940 g018
Figure 19. Peak longitudinal vibration velocity for Scheme 2.
Applsci 14 05940 g019
Figure 20. Peak vertical vibration velocity for Scheme 2.
Applsci 14 05940 g020
Table 1. Material parameters.
MaterialDensity/(g/cm3)Elastic Modulus/MPaPoisson’s RatioTensile Stress/MPa
Dolomite2.8600.2580,250
Reinforced concrete2.4825.5250.219
Disclaimer/Publisher’s Note: The statements, opinions and data contained in all publications are solely those of the individual author(s) and contributor(s) and not of MDPI and/or the editor(s). MDPI and/or the editor(s) disclaim responsibility for any injury to people or property resulting from any ideas, methods, instructions or products referred to in the content.

