Abstract
Accessibility is commonly defined and operationalised through objective measurements, such as travel time and physical distance to destinations; however, there is a lack of empirical studies capturing perceived accessibility from individual perspectives. With the aim of sustainable transport for inclusive communities, it is crucial to investigate the impact of socio-economy and travel mode on perceived accessibility and key driving factors of perceived safety and service quality. Through the collection of primary data from one of the fastest-growing suburbs in Melbourne, this study examined variation of perceptions towards accessibility, safety, and service quality among diverse social groups and travellers using different modes of transport. The findings of this study would assist transport planners in making informed decisions in creating inclusive transport networks that can improve community health and well-being.
1. Introduction
Accessibility is commonly assessed using objective indicators calculated from spatial data, which are linked with the ability to move, distance to stations/stops, and travel time to destinations [1]. According to Pot et al. (2021), these types of calculated measures can only be viewed as proxies for the actual accessibility that individuals experience [2]. Thus, such understanding overlooks the need to evaluate accessibility based on the opportunities it creates for different groups of people and the contributions to daily life activities and well-being from individual perspectives. Disregarding this could lead to reduced mobility for particular groups of travellers with respect to factors, such as age, gender, family profile, and modal choice [3]. When travel obstacles cause difficulties for some people to participate in daily activities, this may result in social exclusion [4]. Given that having access to necessary daily activities is essential to a person’s wellness [5], which is positively connected with transport-related social inclusion [6], there is a need to understand and consider perceived accessibility in achieving sustainable and accessible transport systems.
Perceived accessibility is defined in terms of “how easy it is to live a satisfactory life using the transport system”, which includes accessibility while using the transport system per se, ease of getting to the transport system, and the perceived possibilities and ease of performing usual daily living activities with the help of the transport system [7]. Although perceived accessibility has been acknowledged as an important aspect of transport policy, there are still very few empirical studies to investigate its application to transport planning and policies, and these are mostly Eurocentric [7,8,9,10], affecting the possibility of drawing lessons from other regions with different settlement patterns and travel characteristics. This study contributes to this topic in an Australian context.
Large-scale infrastructure projects, referred to as “big build” or “major infrastructure” projects, have been created across Australia as a result of a population boom and the resulting spatial expansion. These initiatives aim to promote socioeconomic growth and community viability in large cities. However, the contribution of these initiatives in creating values for society in ways that support lifestyles and well-being has not been explored. Meanwhile, one of the primary goals of transport investments is to enhance the accessibility to opportunities and daily activities to improve standards of living and create well-being dividends for users and the community in general [7,11,12]. Satisfaction with and use of public transport are also driven by perceptions of safety and service quality [13,14], and yet an exploration of how public transport infrastructure and services influence perceived accessibility, safety, and service quality from the perspectives of residents, travellers, and workers at the locations they are provided has been limited in Australian cities. Ryan et al. (2016), who examined objective and perceived accessibility in Perth, Western Australia, only explored this in relation to one public transport station [15]. Since the purpose of public transport is to support daily activities and enhance quality of living, a better comprehension of the entire travel experience is necessary, including individuals’ perceptions of service quality of public transport and infrastructure features around stations and stops for walking and cycling [16], together with associated perceived safety and security [17]. In light of this, this study seeks to (1) explore the perceptions of accessibility, safety, and service quality of public transport in supporting daily activities, and (2) examine whether these perceptions are shaped by social and travel factors such as gender, age, and travel mode.
This paper examines perceived accessibility based on peoples’ assessments of how the transport systems facilitate and enable them to perform the activities and live the lives they want, covering assessments of whole-trip experiences. The paper explores perceptions of safety and service quality that have been identified as critical drivers to actual transport use. The paper also addresses issues among social groups to assess whether some groups are excluded from the benefits of public transport investments, so as to better target policies for ensuring equitable access. In addition to gender and age, which are the primary social groups explored, the paper explores if there are perceived differences based on means of transport. If public transport is expected to drive sustainability and liveability in new communities, then understanding why and how non-users do not patronise the service will be critical.
The analysis is organised into five sections. The study area and the methods of data collection and analysis are presented in Section 2, which also discusses and justifies the key concepts and indicators of measurement used in this paper. Section 3 presents the results of the analysis, while Section 4 discusses them in context with previous research. The conclusion of the paper is presented in Section 5.
2. Materials and Methods
2.1. Study Area
This study primarily examines how Western Melbourne residents and travellers evaluate the accessibility of public transport services. Despite the fact that Northern and Western Melbourne are growing significantly quicker than other parts of Melbourne, there are noticeable delays in the delivery of infrastructure in these areas. A recent study found that public transport service and active transport infrastructure were largely absent in the early years of development of the suburbs [18]. Additionally, existing bus services operate infrequently via indirect routes, thus lengthening waiting times and travel distances [19]. The poor public transport infrastructure and services also create forced car ownership in these suburbs due to the lack of alternative modes for mobility [20].
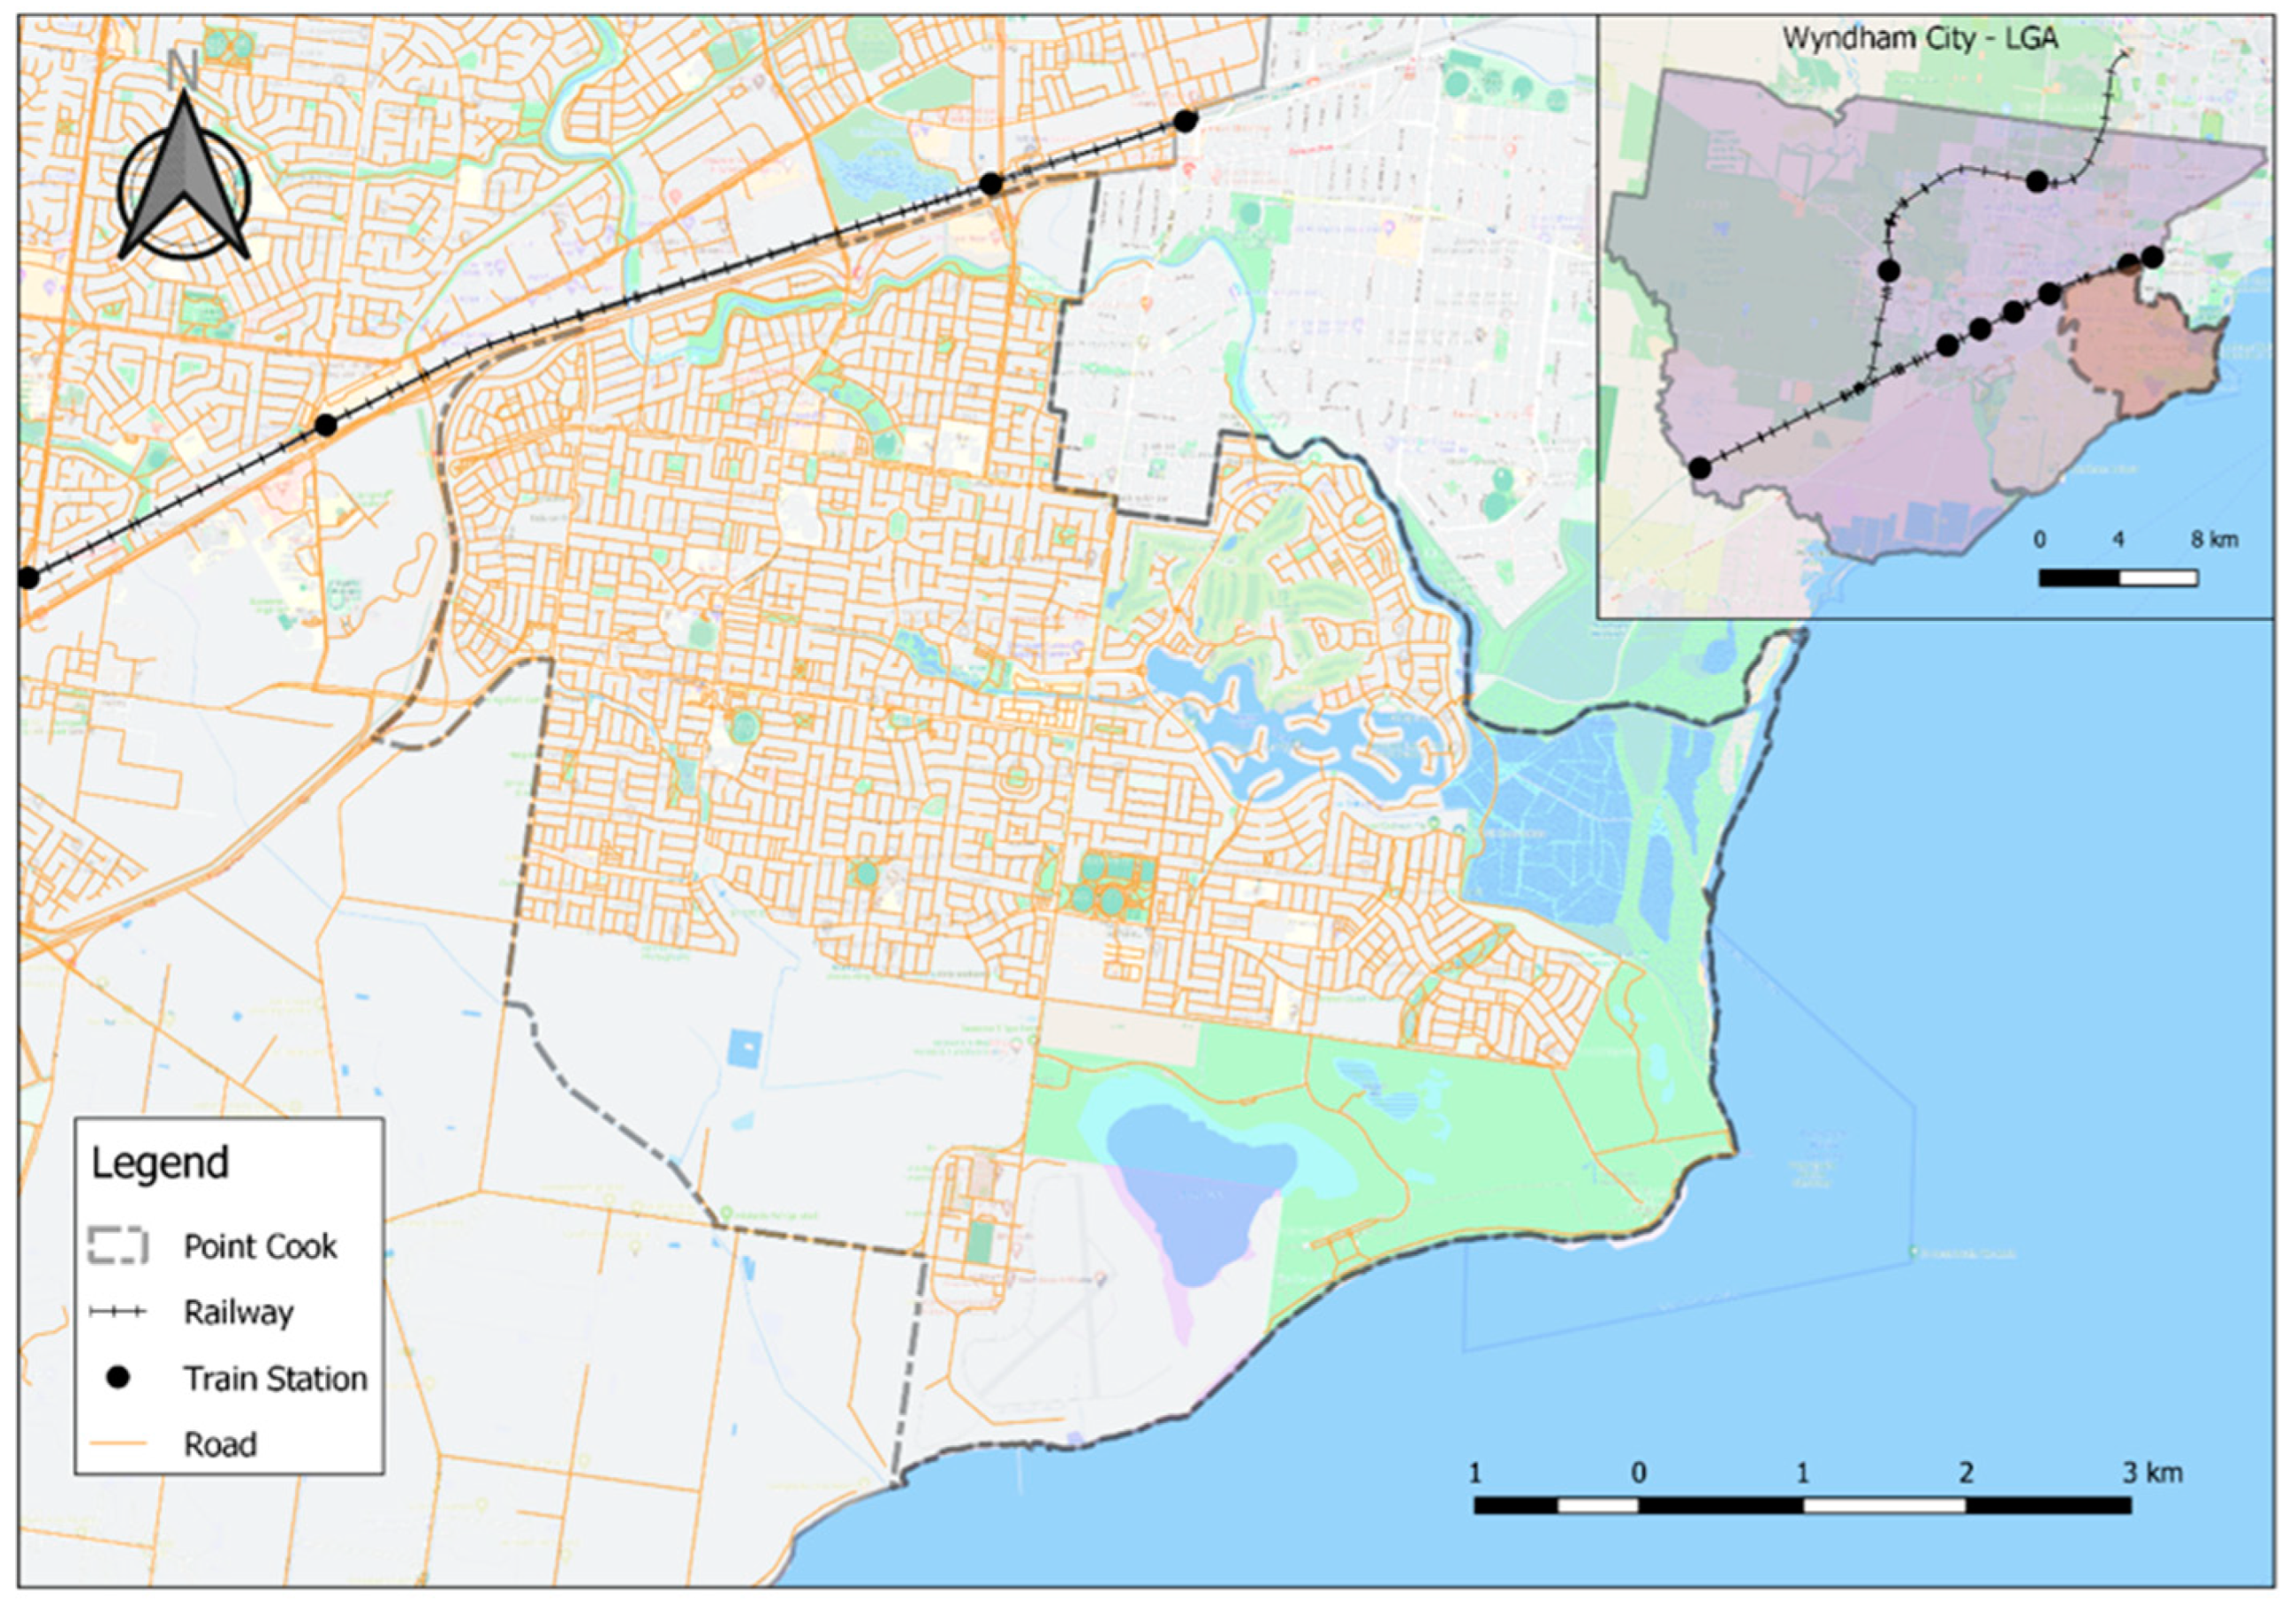
This study focuses particularly on the City of Wyndham in Melbourne’s west. With a current population of over 330,000, the municipality’s population is expected to grow to over 500,000 by 2041, making it one of the fastest-growing areas in Melbourne [21]. Due to its rapid population expansion and limited access to public transport, the Point Cook suburb of the City of Wyndham was chosen for this study after consultation with council stakeholders (Figure 1).
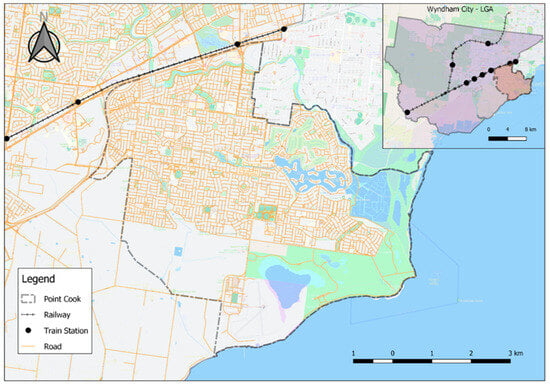
Figure 1.
Map of the study area.
2.2. Data Collection
The primary data were collected through surveys of residents, travellers, and workers in the selected study area of Point Cook. A survey questionnaire was designed to gather data on the perceptions of the accessibility, safety, and service quality of public transport among the respondents. The questionnaire comprised four parts. Parts A to C collected information about the respondents’ assessments of the perceived accessibility, safety, and service quality of public transport, whereas Part D focused on demographic characteristics that enabled an evaluation of how these assessments varied among specific groups of people. A five-point Likert scale was applied to most of the questions, with respondents asked to specify their level of agreement (1—strongly disagree, 2—disagree, 3—neutral, 4—agree, and 5—strongly agree) with each statement. Open-ended questions were also provided at the end of each section that encouraged respondents to share other feedback or suggestions.
Lättman et al.’s framework (Table 1) involving four quantifiable items was adopted to assess perceived accessibility to daily activities in Part A of the questionnaire [7]. As shown in Table 2, the first four survey questions (A1–A4) were about the respondents’ perceived accessibility with the use of their existing travel mode, followed by another four questions (A5–A8) to assess their perceived accessibility by using public transport only. This restriction helps us access how perceptions of accessibility to daily activities and life choices change in favour of public transport over car usage. Assessing accessibility with restricted car use is seen as very critical for the global sustainability agenda [9], and is particularly relevant for areas with frequent car usage, such as Point Cook.

Table 1.
Measures of perceived accessibility.
Table 2.
Questions measuring perceived accessibility among survey respondents.
Parts B and C of the questionnaire covered perceived safety and service quality, respectively, which were also measured on a five-point Likert scale. In view of the lack of studies about people’s safety perceptions on whole-trip experiences of using public transport [22], the indicators of perceived safety were designed to assess the feeling of safety (a) in getting to and from public transport stations/stops, (b) at the public transport stations/stops, and (c) on board. In Part C, the SERVQUAL approach was adopted to capture respondents’ perceptions of the service quality of public transport [23]. The SERVQUAL framework is often used to explore different dimensions of quality expectations for most services assessing the trust, confidence, and satisfaction people have in using services like public transport [24].
The final section of the survey asked about respondents’ gender, age, means of transport, and frequency of usage of public transport. The survey questions were reviewed by the Project Steering Group members with representatives of public, private, and not-for-profit organisations and received ethical clearance from the University Human Research Ethics Committee.
Data from the survey were collected using both online and offline methods. The survey’s online questionnaire was developed and reviewed using the survey design software Qualtrics XM for data collection. Regarding the sampling strategy, three approaches were adopted to reach a variety of travellers and residents of the study area. Firstly, postcards showing the study information, including the website link and the quick response (QR) code of the online survey, were distributed into letterboxes to invite the residents of Point Cook to participate. Secondly, the website link and the QR code were sent via emails to staff and students of the project institution to invite qualified persons and their contacts residing in the Point Cook area to complete the survey. Finally, an offline version of the Qualtrics application on mobile digital devices (e.g., phones and tablets) was used to collect survey responses onsite at public locations, such as shopping centres, train stations, bus stops, and the local library. The data collection was conducted on both weekdays and weekends at different times and lasted for over two months—14 February to 18 April 2022. These approaches ensured that a diverse range of respondents, including residents, workers, students, shoppers, and travellers, was recruited.
For ethical reasons, only adults of age 18 and above were recruited to participate in this study. For ensuring that only valid responses were gathered, two screening questions were introduced at the beginning of the questionnaire, as follows. (1) “What is your age?” If the respondent chose “below 18 years”, the survey ended automatically. The second screening question (2)—“In the past six months, have you lived, worked or visited Point Cook for any reason?”—aimed to ensure that respondents performed reasonably regular daily activities in the study area and were therefore qualified to share their experiences with perceived accessibility, safety, and service quality of public transport in the area. A respondent needed to respond in the affirmative to progress with the actual survey. Each survey took about 10–15 min to complete. Average time for respondents to complete the survey was 12 min. By the end of the survey period, a total of 194 had attempted the survey, of which 156 satisfied the screening criteria and provided valid responses and were therefore used for the present analysis. Over 150 collected responses provided a wide array of results for data analysis. Table 3 summarises the profile of the survey respondents.
Table 3.
Socioeconomic and travel characteristics of respondents.
Table 3 shows that a majority of participants were women (57.1%), middle-aged (63.2%), and employed (62.1%). Personal vehicles (45.5%) and public transport (44.3%) were the primary modes of travel, with most respondents (65.4%) being frequent public transport users (i.e., travelling by public transport two or more days per week). More than a quarter of the respondents (28.2%) had more than 20 min walking distance to the nearest public transport station/stop from their homes or workplace within the study area.
2.3. Data Analysis
This study primarily applied quantitative methods for data analysis using the Statistical Package for the Social Sciences (SPSS). Descriptive statistics such as means, frequency, and percentages were used to derive summary statistics of the demographic information of the respondents and their perceived accessibility using the four measurement items for each of the scale versions respectively. For data parsimony purposes, principal component analysis (PCA) was employed to summarise items measuring perceived accessibility, safety, and service quality into fewer dimensions. PCA is suitable for reducing the dimensions of large datasets and enhances interpretability, particularly in exploratory and under-researched topics. To examine how these dimensions differed based on social characteristics of the respondents, the Mann–Whitney U test, which is a non-parametric correlation test for non-normally distributed data, was employed [25]. The results of the analysis are presented seriatim.
3. Results
3.1. Perceived Accessibility
3.1.1. Perceived Accessibility with Current Travel Mode
As shown in Table 4, a majority of the respondents perceived their accessibility to be higher when they perform their daily activities with existing modes of travel. Specifically, more than 60% of respondents agreed or strongly agreed with all four statements assessing the ease and satisfaction of conducting their daily activities using their existing modes of travel. However, this assessment declined to between 25.7% and 41.7% regarding the performance of daily activities accessibility by using public transport only. This suggests that in the study area, residents usually perceive the public transport to be inaccessible and inconvenient to meet their daily needs. On the one hand, this finding is problematic considering the rapid population and spatial growth in the western suburbs of Melbourne. On the other hand, it highlights the poor conditions of public transport services in these rapidly growing areas of the city. The fact that the mean perceived accessibility declines by almost 25% when travel is restricted to public transport partly explains the high car dependency in these areas. Currie (2018) lamented that poor public transport accessibility in Australian cities negatively induces forced car ownership, causing detrimental effects on the environment, well-being, and safety [20].
Table 4.
Respondents’ assessments of perceived accessibility.
The four respective measurement items of perceived accessibility yielded only one factor/latent variable according to PCA, indicating that it is a unidimensional concept, and thus it was used to explore socioeconomic differences in the subsequent analyses. A reliability check using Cronbach’s alpha indicated strong reliability as composite scores (i.e., components) (α = 0.925 for overall accessibility and α = 0.899 for perceived accessibility of public transport). Hence, perceived accessibility scores were created from the means of the four measurement items under each domain [26]. See Appendix A.1 and Appendix A.2 for the results of the PCA.
3.1.2. Gendered Differences in Perceived Accessibility
This study examined gender disparities regarding perceived accessibility and found that generally, men perceived higher accessibility than women within the study area. However, the Mann–Whitney U tests showed that the differences in average scores were not statistically significant (Table 5). Whilst the higher rating among men was replicated across all four perceived accessibility measures (for both existing modes and public transport only), these were not statistically different from the ratings of the female counterparts. Regrettably, the reduced perceived accessibility to public transport compared with existing travel modes is replicated between the genders, even though the reduction is far greater among women than men. In other words, women experience greater dissatisfaction and difficulty to perform their daily activities with public transport in the study area.
Table 5.
Assessment of perceived accessibility based on socioeconomic and travel characteristics.
3.1.3. Perceived Accessibility and Age
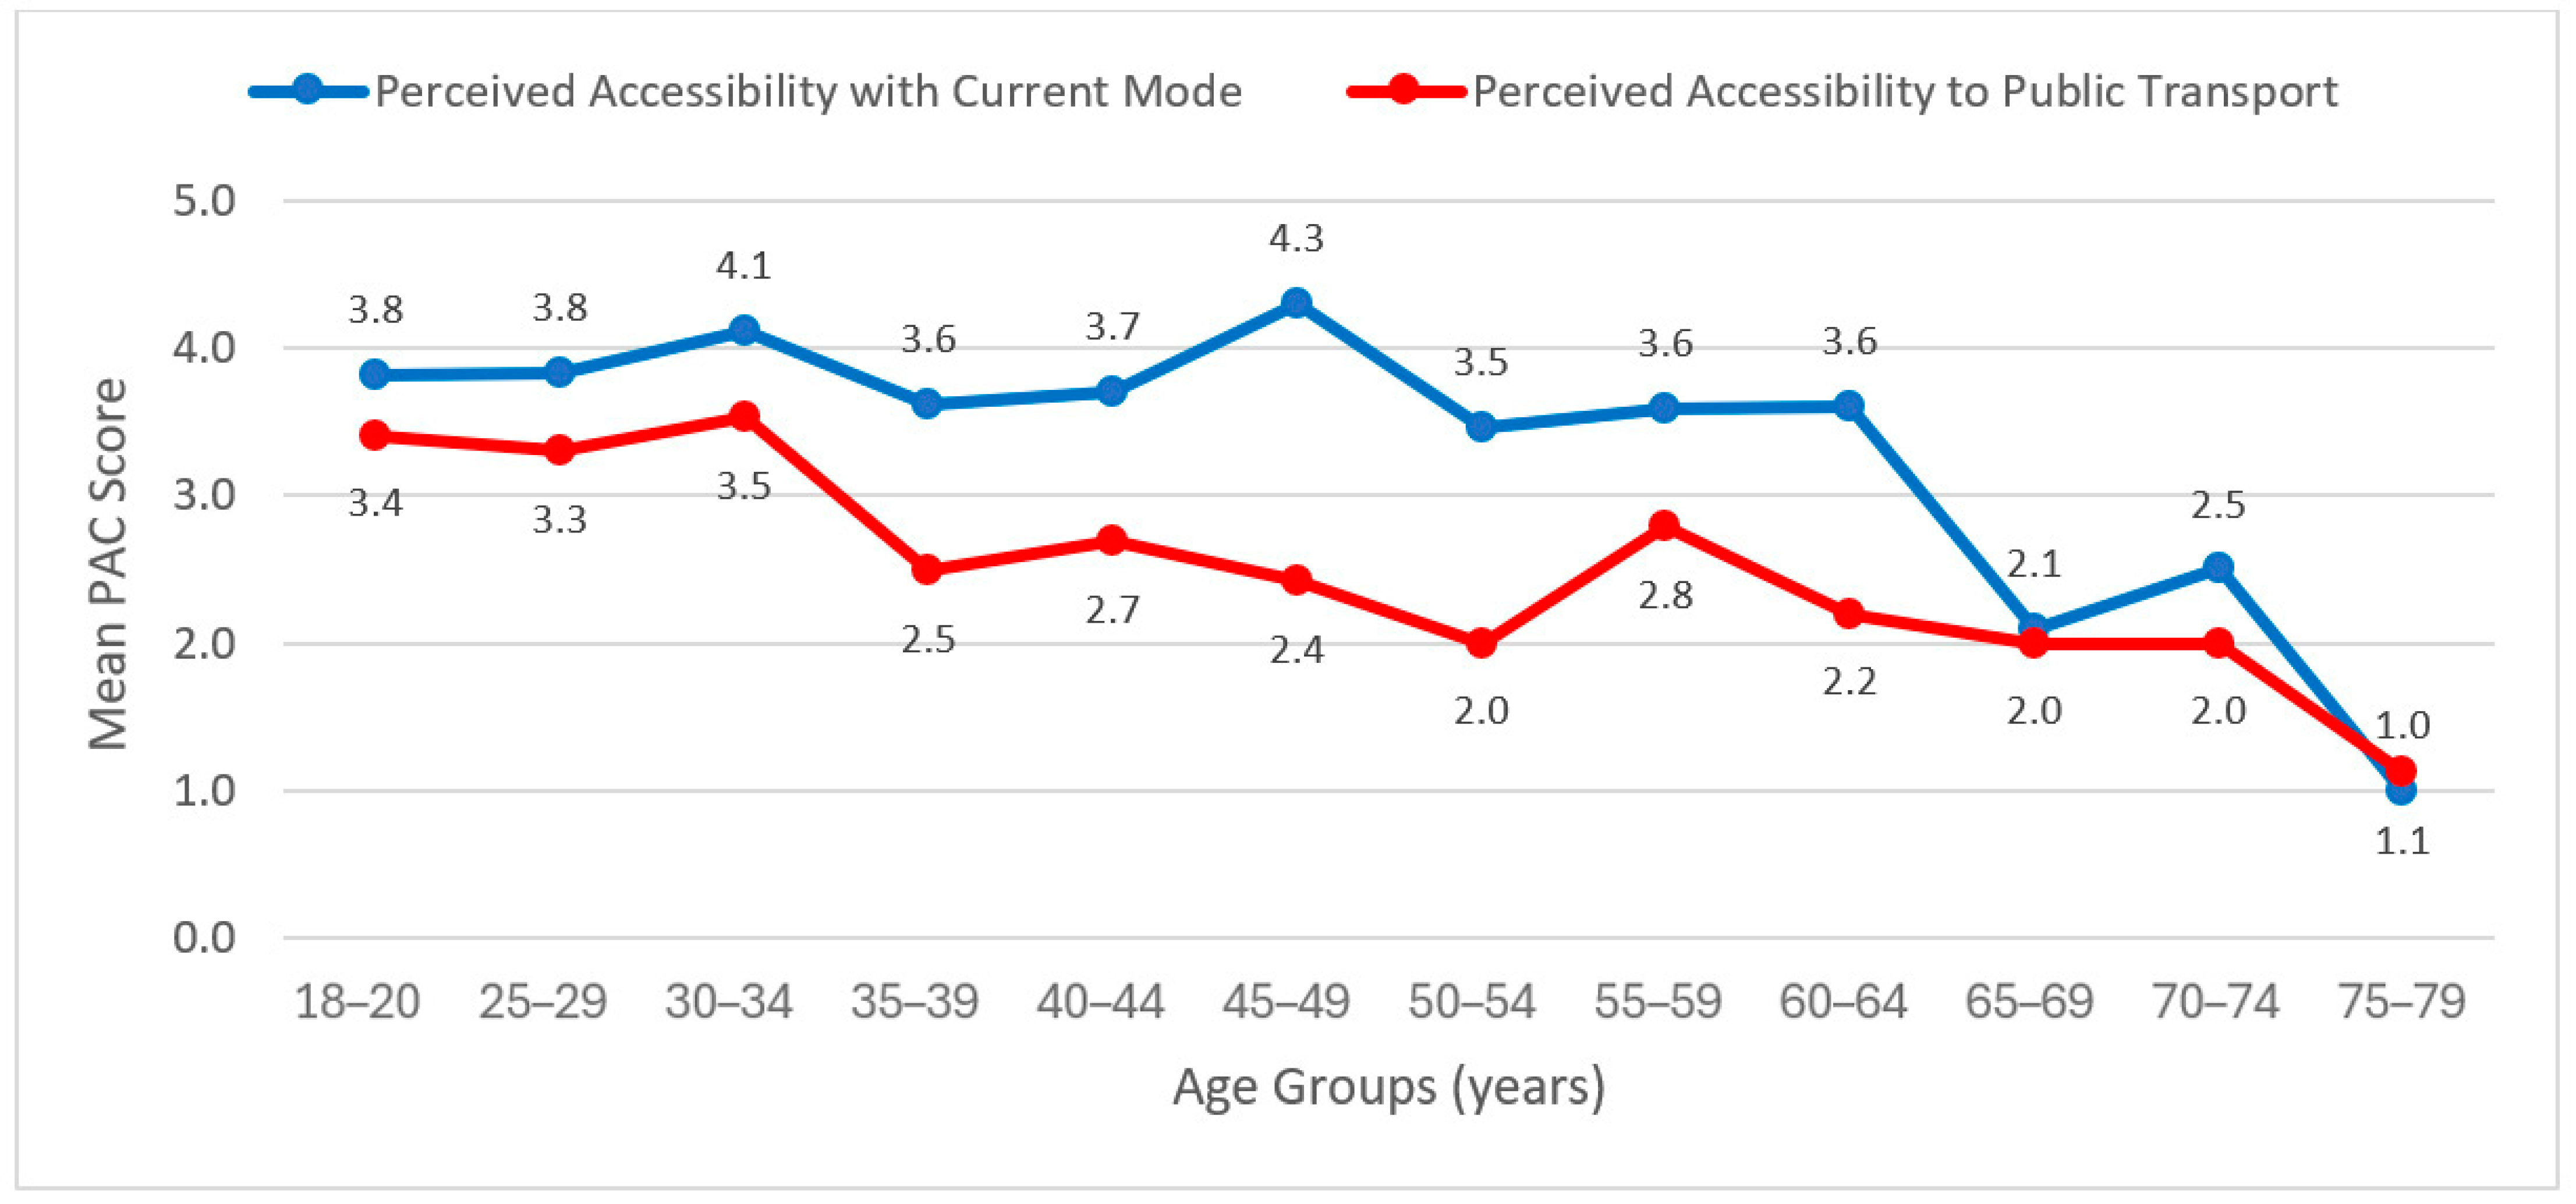
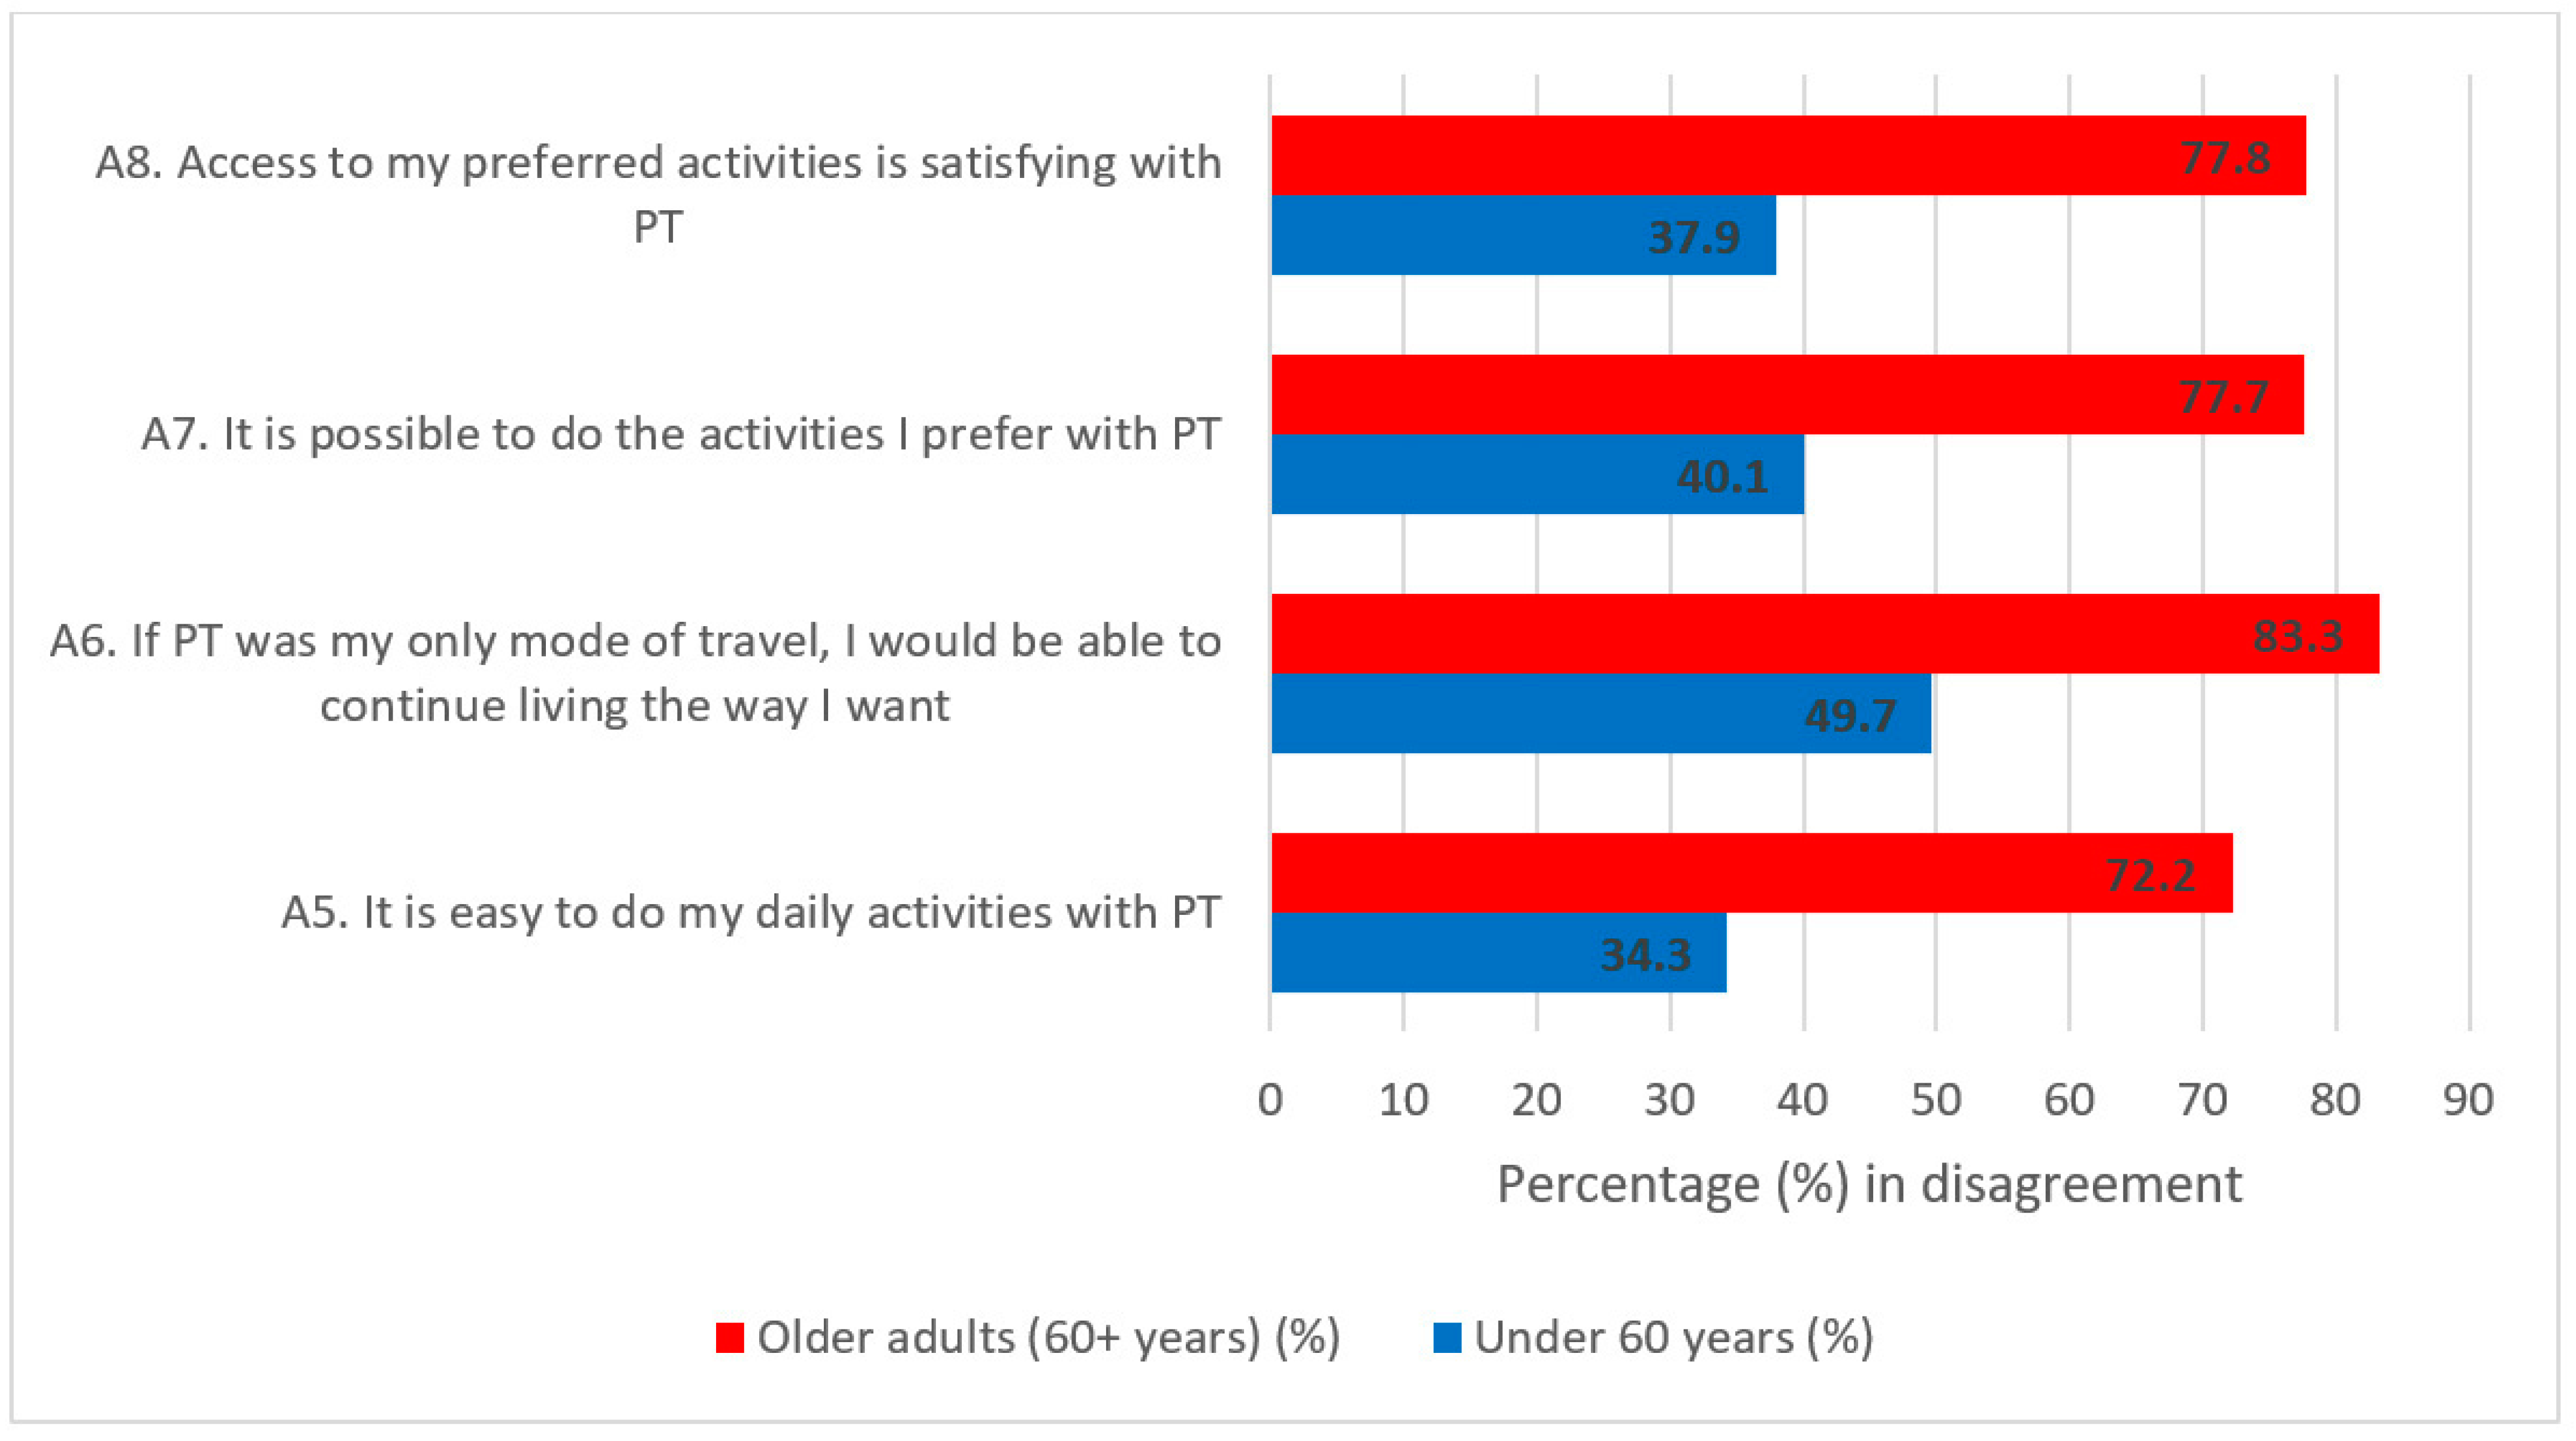
Vulnerable populations such as older adults are often more dependent on public transport due to their reduced abilities to drive cars [27]. However, in the case of Melbourne’s west, where the service is deemed inaccessible to older adults, they appeared to be increasingly isolated from public transport. As shown in Figure 2, perceived accessibility to public transport tends to decline as one ages, dropping by 68% from the mean score of 3.4 among the youngest adults (19–20) to 1.1 among the oldest adults (75–79 years). The Mann–Whitney U test confirmed that indeed older adults regarded their perceived accessibility to be significantly lower with both existing travel modes (p < 0.05) and public transport only (p < 0.001). Moreover, while both younger and older adults agreed that their perceived accessibility would be diminished if they restricted travels for daily activities to public transport, with the older adults feeling significantly dissatisfied with public transport use. On all four measures of perceived accessibility, older adults (60 years and above) were more likely to disagree or strongly disagree that public transport was accessible to them (Figure 3). For instance, they were twice as likely to disagree that they could easily perform their daily activities with public transport. The likelihood that individuals would not be able to live as they want, engage in their preferred activities, or have satisfactory access to their preferred activities using public transport was also higher. This lack of accessibility and satisfaction with using public transport among the older population is seriously problematic in the current ageing environment of Australian cities.
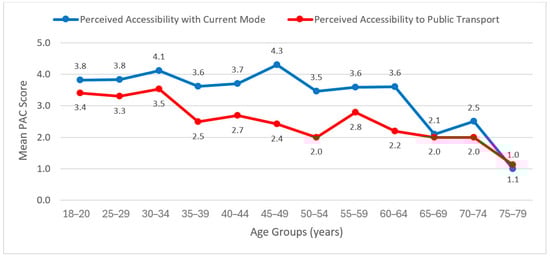
Figure 2.
Mean perceived accessibility score between age groups.

Figure 3.
Disagreement on perceived accessibility between younger and older adults.
3.1.4. Differences in Perceived Accessibility Based on Travel Mode
Next, the variation in perceived accessibility to the primary mode of travel measured by the frequency of public transport usage for daily activities was examined. Interestingly, there was no statistically significant difference in perceived accessibility between frequent and infrequent public transport users when using their existing travel modes for daily activities. This indicates that when using their preferred mode of transport, both groups were satisfied with their ability to access daily life activities. On the contrary, perceived accessibility was significantly lowered among infrequent public transport users when asked about their ease and satisfaction of performing their daily activities with public transport only. The perceived accessibility of infrequent public transport users drops by 39.2% (compared with 15.2% for frequent public transport users) if public transport is the only travel option in the study area (Table 5). This may be due to accessibility with public transport only lowering infrequent public transport users’ ability/opportunities to go to their preferred destinations, as this group of people may take part in activities where other modes are essential for getting there. However, another reason may be a lack of knowledge of what and how public transport can be used for. To address this scenario, there is a need for more measures to be implemented to encourage greater use of public transport services among infrequent users. This requires understanding the factors driving perceived accessibility, which some scholars indicate include perceived safety and service quality [13,14]. An analysis of these factors and the influences of gender, age and travel modes are discussed in the following sections.
3.2. Perceived Safety
As indicated earlier, this study adopted the whole-trip approach [28] to explore perceived safety in different circumstances while travelling to or waiting at stations/stops and while on board. For data parsimony, a PCA was conducted, yielding four components of perceived safety. The Kaiser–Meyer–Olkin (KMO) sampling adequacy measure (0.792) and Bartlett’s test of sphericity (X2 = 1348.145, df = 91, p < 0.001) confirmed the suitability of the PCA (see Appendix A.3). As shown in Table 6, component 1 was about night-time safety, which was explained by three variables: safety when walking to/waiting at stations/stops and using public transport at night (B2, B4, B10). Component 2 reflected feelings of safety with surveillance and was measured by five items assessing safety in police presence, CCTV, and proper lighting (B5, B8, B13–B15). Component 3 related to accidents and crime safety (B7, B11–B12), whereas component 4 focused on daytime safety (B1, B3, B9). The scores of each perceived safety component were derived by the arithmetic mean of the constituent variables and used for the subsequent analysis.
Table 6.
Summary statistics of perceived safety components and indicators.
The findings indicate that respondents had the highest safety perceptions under surveillance (i.e., CCTV, proper lighting and police presence, with a mean score of 4.2 out of 5), followed by daytime safety (4.0) with night-time safety being the most concerning for them, as shown by the lowest mean score of 2.8 (Table 6).
3.2.1. Gender and Perceived Safety
In terms of the association of perceived safety and gender, this study revealed that women were highly concerned about public transport safety on all components except surveillance (Table 7). In other words, compared with men, women generally had lower perceptions of safety relating to public transport use during daytime and night-time as well as accidents and crimes on public transport. The only aspect in which women’s perceived safety was comparable to men was surveillance safety. Thus, proper lighting, police presence, and availability of CCTV cameras improved women’s feeling of safety.
Table 7.
Socioeconomic features and perceived safety.
3.2.2. Age Influence on Perceived Safety
As people age and become incapable of driving while lacking regular support for car-based transport, they tend to resort to public transport as their primary travel mode. However, the feeling of safety is more likely to influence their accessibility and satisfaction of use. Table 7 revealed that older adults felt significantly less secure with public transport usage at night. Even the presence of surveillance factors like CCTV, lighting, and police did not seem to assuage the fears of the older population when using public transport in Melbourne’s west. Older adults still felt comparatively secure to take public transport during daytime.
3.2.3. Travel Mode and Perceived Safety
In terms of travel mode, it appears that frequent public transport users generally felt more secure travelling with public transport use than infrequent users during daytime and at night. However, the perceptions of accidents or crime and surveillance safety were similar between the groups. This result suggests that improving travelling experiences during daytime and at night may attract infrequent users to use public transport more regularly.
3.3. Perceived Service Quality
Like safety, PCA was used to summarise the indicators of perceived service quality, assessed based on the SERVQUAL framework [24]. The KMO = 0.770 and Bartlett’s test of sphericity (X2 = 906.642, df = 120, p < 0.001) confirmed the suitability of PCA [25] (see Appendix A.4). Using the varimax rotation method, four components were extracted, reflecting functionality, assurance, usability, and communication, as listed in Table 8. Functionality represents quality aspects relating to cleanliness and air conditioning of the vehicles, as well as the connection, frequency, and accessibility of services to all, including vulnerable people. Assurance concerns the characteristics of the drivers based on experience, service/assistance, politeness, and neatness. Usability refers to the user friendliness in relation to payments (myki), routes, and timetabling information, whereas communication assesses the promptness in communicating planned and unplanned disruptions, as well as availability of real-time service information. Table 8 presents the descriptive statistics of these four components and constituent indicators of measures.
Table 8.
Summary statistics of perceived service quality components and indicators.
As shown in Table 8, usability and assurance were the two components of perceived service quality most highly ranked in the study area. Thus, the driver services, payment, and information about the schedules were deemed to be above average for perceived service quality. In contrast, functionality and communication components were ranked the lowest and the second-lowest, as public transport is hampered by the poor connection, frequency, accessibility, and communication of the service. In Melbourne’s growing suburbs, research indicates that the waiting times to supply ideal public transport services to residents are considerably long, which partly explains why respondents condemned its functioning in assessing the perceived service quality [18]. The communication of unplanned public transport service outage also received a very low ranking (C19), which has to be addressed.
3.3.1. Gender and Perceived Service Quality
Women generally expressed higher perceived service quality of public transport than men across all four components, but this was not statistically significant (Table 9). Thus, unlike perceived accessibility and safety, the perception of respondents about service quality was gender-neutral, with both genders showing consistency in their ratings of perceived service quality components.
Table 9.
Socioeconomic features and perceived service quality.
3.3.2. Age and Perceived Service Quality
There were similar perceptions among the study participants of different age groups with regard to three components of service quality: functionality, assurance and communication. Thus, both younger and older adults agreed in their ratings of the poor connectivity, reliability, accessibility, communication of disruptions, and driver characteristics. On the contrary, older adults felt more concerned about the user friendliness of the payment system, as well as finding timetable and route information. This might be not surprising given that these aspects are mostly built on information communication technology (ICT). Indeed, in a service quality item examining the perception about whether “public transport was accessible to all, including the aged and disabled”, the older respondents expressed extremely strong sentiments in pointing out their disagreements compared with younger people (27.8% of older adults versus 54% of younger people agreed with the statement). Thus, older adults felt more excluded because the public transport service did not adequately meet the needs of the vulnerable population (which included them).
3.3.3. Travel Mode and Perceived Service Quality
A conspicuous social driver of perceived service quality is related to travel mode. Unsurprisingly, this study found that frequent public transport users generally had higher perceived service quality with public transport than infrequent users, with more significant variations reported in the functionality and usability components. Thus, while it is generally accepted that the public transport system in Melbourne’s west is poor, non-frequent users find it more problematic and not user-friendly, potentially explaining their lack of patronage (Table 9). This finding probably highlights the limitations within the public transport system that provide the greatest disincentives to non-committed users. Hence, improvements will be required to attract them for a more sustainable future.
4. Discussion
Against the backdrop of recent trends of increasing infrastructure development across metropolitan Melbourne, this study sought to examine the social value created by public transport services in Melbourne’s west, one of the city’s fastest-growing and -sprawling regions. Based on a questionnaire survey conducted in Point Cook, the largest suburb in the City of Wyndham, the study explored (1) perceptions of accessibility, safety, and service quality of public transport in supporting daily activities, and (2) how these perceptions are shaped by social and travel factors such as gender, age, and travel mode. The findings reveal that perceived accessibility to people’s daily life activities is regarded reasonably highly (3.7 out of 5) when they use their existing travel mode, which is predominantly driving and public transport. However, this assessment is significantly reduced (2.8 out of 5) in a scenario where public transport is the only travel mode available in the study area. The respondents believed that their ease and satisfaction in performing their daily activities would be greatly hindered by travelling by public transport only. This decline in perceived accessibility was driven by the sharp drop in ratings among frequent car users. This result aligns with a study on residents in Malmö, Sweden, where car users reported lower perceived accessibility when car use was restricted [9].
The correlation of social features with perceived accessibility varied according to the findings of this study. Age was found to be a highly influential driver in determining perceived accessibility in both existing modes and public transport usage. The study found perceived accessibility in both instances (i.e., existing modes and public transport usage) to reduce as one aged, but more significant concerns were raised among older adults with regard to the accessibility of public transport services to them and other vulnerable populations. As raised by Sundling et al. (2016), it is crucial for a public transport service to be open and convenient to older adults [29]. Men perceived greater accessibility in relation to public transport than women, who had greater dissatisfaction in performing daily activities by public transport. Non-public transport users felt substantially less satisfied with carrying out their daily activities by relying largely on public transport, even if perceived accessibility does not appear to alter whether people choose their preferred travel modes.
Concerns with the perceived safety of public transport were highlighted. The responses of the study participants confirmed insecure trip experiences of public transport use during night-time travels. An inherent implication of these findings is that design and environment factors are some of the most concerning factors and therefore influencing people’s perceived safety. This is because people (especially women, older adults and infrequent users) found it more difficult and insecure to travel between public transport stations/stops and their homes/workplaces or wherever their trips originate or end in the study area at night. This aligns with a study by Abenoza et al. (2018) [30]. As suggested by Ingvardson and Nielsen (2021) in their Copenhagen study, it is true that the walking environment and station vicinity and characteristics are important factors affecting perceived safety of public transport usage [31]. The present study confirms that while improvement is required in the urban design and perhaps distance to stations/stops, increasing surveillance through installation of proper lighting, CCTV cameras, and increased police visibility may help improve safety perceptions, leading to an increase in the use of public transport.
Regarding the perceived service quality of public transport, assurance and usability received higher rankings among the four components of perceived service quality. The fact that functionality was the most underrated component of perceived service quality of public transport in Melbourne’s west is very concerning for a city bent on improving sustainability and liveability in its communities. The study revealed that while there were relatively limited concerns with operability with regard to personal experience of the service providers, the poor connectivity, frequency, and reliability within the network reduced public transport usage. Men and women and younger and older adults all rated functionality poorly, although there was no significant difference between these two groupings. Infrequent users expressed their dissatisfaction vehemently, suggesting that functionality is a main factor dissuading their usage. Friman et al. (2020) observed that improvement in functionality (explained by reliability, frequency, travel time, and distance) is critical for improving public transport quality and efficiency [13]. The survey respondents also expressed their dissatisfaction with the lack of communication of unplanned disruptions of public transport services.
The findings of the study outline avenues for planners and policymakers to influence the perceived accessibility and use of public transport for supporting daily living activities and thereby enhancing the quality and satisfaction of life in a rapidly growing suburb. The study informs the following policy indications.
- (1)
- Improvement in facilities and surveillance through the installation of CCTV cameras and proper lighting and an increase of police visibility can enhance people’s perceptions of safety, especially for women and older adults during night-time travels.
- (2)
- Transformation of transport nodes into activity centres with proper facilities and signage can enhance people’s perceptions of safety and incentivise the use of public transport.
- (3)
- Increased service frequency and improvement in connectivity within the transport network can shorten waiting and travel time, make first- and last-mile travel via walking and cycling convenient, and enhance people’s perceptions of service quality in terms of functionality.
- (4)
- The use of technology to provide real-time information on routes, timetabling, planned and unplanned disruptions, route changes, and optimising schedules can enhance the convenience of use and people’s perceptions of service quality in terms of communication and usability.
5. Conclusions
This study reveals that despite the rapid expansion of metropolitan Melbourne towards the western region and consequent increases in infrastructure development, the perceived accessibility, safety, and service quality associated with public transport may be hampering liveability and sustainability in the area. Using data collected from a survey in Point Cook, one of the rapidly growing suburbs, this study finds significant declines in perceived accessibility of public transport as the primary mode of travel. Safety and service quality concerns are also rife, particularly concerning travelling to/from stations at night. First- and last-mile travel is seen as increasingly inconvenient due to poor connections within the public transport system and with other sustainable modes such as cycling and walking. This has impacted the reliability and frequency of services and essentially dissuaded usage.
A more worrying pattern is the increased concern that specified demographic groups, such as women, older adults, and infrequent users of public transport, show when asked about perceived accessibility, safety, and service quality in relation to public transport in the study area. As a result, these groups of people are increasingly isolated from society and excluded from access to social and economic possibilities. Such revelations contradict the expectation of public transport to foster accessibility and inclusion, particularly among vulnerable populations such as women, the disabled, and older adults [12,32].
It is obvious that inadequate planning and the distribution of scarce public transport services are endangering people’s accessibility, health, and well-being along a popular growth corridor accommodating much of Melbourne’s recent population boom. In the selected suburb of Point Cook, this exclusion is partly attributable to longer walking distances between homes and public transport stations/stops (spatial separation), poor network connections, and infrequent services, as well as the unreliable schedules that travellers often have to grapple with. These factors potentially create social exclusion among vulnerable populations for whom the use of alternative modes of travel is also compromised due to gender-defining roles and power, functional abilities, and financial capacities. Previous studies indicated that women’s travel behaviour is increasingly influenced by their relatively lower wages, job locations, and inequitable access to household vehicles [33,34]. Moreover, sensory and mobility limitations hinder the capacity of older adults to adopt alternative travel modes [27], forcing them to primarily rely on public transport as their primary travel mode. With an ageing population, older adults are expected to constitute a more substantial proportion of Melbourne’s residents in the future. Hence, more concerted effort is required to address these concerns to leverage public transport investments for greater health and well-being benefits in a post-pandemic world. Satisfaction with perceived accessibility, safety, and service quality is more likely to induce greater use of public transport services. Our findings of perceived accessibility, safety, and service quality in the Point Cook area can be used as a reference for further evaluation in combination with interventions aimed at improving any of these social values.
There are some limitations of this study. As a pilot study, the study area was confined to the suburb of Point Cook. Despite the fact that Point Cook is one of the fastest-growing areas in Melbourne with rapid population expansion, it may not be appropriate to generalise the findings to other regions in Australia. Although 156 survey responses were collected, this may not comprehensively represent the residents and travellers in the study area. For future research directions, it is recommended to extending the area study to the entire City of Wyndham, other appropriate suburbs in Victoria, or even to other states in Australia for comparison. For increasing the number of participants in completing the survey, incentives can be considered, such as vouchers or coupons, subject to funding availability. Apart from conducting questionnaire surveys, interviews and focus group discussion with relevant stakeholders can be arranged to obtain qualitative insights and deeper understanding of users’ experiences and perceptions of perceived accessibility, safety, and service quality of public transport.
Author Contributions
Conceptualisation, H.-W.C., E.J., M.C. and E.G.; methodology, H.-W.C. and E.G.; software, E.G.; validation, H.-W.C., E.J. and M.C.; formal analysis, H.-W.C., E.J., M.C. and E.G.; investigation, H.-W.C., E.J., M.C. and E.G.; resources, H.-W.C., E.J. and M.C.; data curation, H.-W.C., E.J., M.C. and E.G.; writing—original draft preparation, H.-W.C., E.J., M.C. and E.G.; writing—review and editing, H.-W.C., E.J., M.C., E.G. and K.L.; visualisation, H.-W.C. and E.G.; project administration, H.-W.C., E.J. and M.C.; funding acquisition, H.-W.C., E.J. and M.C. All authors have read and agreed to the published version of the manuscript.
Funding
This research was funded by the Victorian Higher Education State Investment Fund (2021–2022).
Institutional Review Board Statement
The study was approved by the University Human Research Ethics Committee of Victoria University (reference HRE21-161, date of approval 10 December 2021).
Informed Consent Statement
Informed consent was obtained from all subjects involved in the study.
Data Availability Statement
Data is contained within the article.
Acknowledgments
The authors would like to express their thanks to anonymous reviewers for their constructive comments.
Conflicts of Interest
The authors declare no conflicts of interest.
Appendix A. Results of the Principal Component Analysis (PCA)
Appendix A.1. PCA of Perceived Accessibility with Current Travel Mode
| Component 1 | |
| A1. Considering how I travel today, it is easy to do my daily activities. | 0.888 |
| A2. Considering how I travel today, I am able to live my life as I want to. | 0.925 |
| A3. Considering how I travel today, I am able to do all activities I prefer. | 0.922 |
| A4. Access to my preferred activities is satisfying, considering how I travel today. | 0.877 |
| Notes: KMO = 0.854, Bartlett’s test of sphericity (X2 = 476.325, df = 6, p < 0.001). Extraction method: PCA. Only one component was extracted. The solution cannot be rotated. | |
Appendix A.2. PCA of Perceived Accessibility with Public Transport
| Component 1 | |
| A5. It is easy to do my daily activities with public transport. | 0.895 |
| A6. If public transport was my only mode of travel, I would be able to continue living the way I want. | 0.880 |
| A7. It is possible to do the activities I prefer with public transport. | 0.855 |
| A8. Access to my preferred activities is satisfying with public transport. | 0.884 |
| Notes: KMO = 0.846, Bartlett’s test of sphericity (X2 = 378.958, df = 6, p < 0.001). Extraction method: PCA. Only one component was extracted. The solution cannot be rotated. | |
Appendix A.3. Rotated Component Loadings of Perceived Safety Items
| Component | ||||
| 1 | 2 | 3 | 4 | |
| B2. I feel safe when walking to/from public transport stations/stops at night. | 0.898 | |||
| B4. I feel safe when waiting at public transport stations/stops at night. | 0.884 | |||
| B10. I feel safe to take public transport at night. | 0.869 | |||
| B15. I feel safe when police are present on board. | 0.834 | |||
| B8. I feel safe when police are present at public transport stations/stops. | 0.814 | |||
| B13. I feel safe when CCTV cameras are installed on board. | 0.731 | |||
| B5. I feel safe when CCTV cameras are installed at public transport stations/stops. | 0.603 | |||
| B14. I feel safe as proper lighting is installed on board. | 0.564 | |||
| B11. I feel safe from traffic accidents on board. | 0.782 | |||
| B7. I feel safe from traffic accidents when waiting at public transport stations/stops. | 0.766 | |||
| B12. I feel safe from crime on board. | 0.680 | |||
| B1. I feel safe when walking to/from public transport stations/stops in the daytime. | 0.806 | |||
| B3. I feel safe when waiting at public transport stations/stops in the daytime. | 0.793 | |||
| B9. I feel safe to take public transport in the daytime. | 0.765 | |||
| Notes: KMO = 0.792, Bartlett’s test of sphericity (X2 = 1348.145, df = 91, p < 0.001). Extraction method: PCA. Rotation method: varimax with Kaiser normalisation. | ||||
Appendix A.4. Rotated Component Loadings of Perceived Service Quality Items
| Component | ||||
| 1 | 2 | 3 | 4 | |
| C14. Connection of public transport service is adequate. | 0.847 | |||
| C13. The frequency of public transport service is adequate. | 0.839 | |||
| C9. Public transport is always clean. | 0.598 | |||
| C10. Air conditioning on board is appropriate (not too cold or hot). | 0.589 | |||
| C11. Public transport is accessible to all (including disabled and older adults). | 0.548 | |||
| C5. Drivers are always polite. | 0.862 | |||
| C8. Drivers appear neat and tidy. | 0.808 | |||
| C6. Drivers are skilful and experienced in driving. | 0.752 | |||
| C17. Drivers are ready to assist passengers. | 0.708 | |||
| C15. Top up service for myki cards is user-friendly. | 0.737 | |||
| C16. Touch on service to pay public transport fare is user-friendly. | 0.696 | |||
| C12. Information about public transport routes is easy to find. | 0.652 | |||
| C3. Public transport service information and timetables are available at public transport stations/stops. | 0.572 | |||
| C19. Unplanned public transport not in service is communicated promptly. | 0.733 | |||
| C4. Real-time public transport service information and timetables are readily available. | 0.689 | |||
| C18. Planned public transport not in service is communicated in advance. | 0.551 | |||
| Notes: KMO = 0.770, Bartlett’s test of sphericity (X2 = 906.642, df = 120, p < 0.001). Extraction method: PCA. Rotation method: varimax with Kaiser normalisation. | ||||
References
- Curl, A.; Nelson, J.D.; Anable, J. Does accessibility planning address what matters? A review of current practice and practitioner perspectives. Res. Transp. Bus. Manag. 2011, 2, 3–11. [Google Scholar] [CrossRef]
- Pot, F.J.; van Wee, B.; Tillema, T. Perceived accessibility: What it is and why it differs from calculated accessibility measures based on spatial data. J. Transp. Geogr. 2021, 94, 103090. [Google Scholar] [CrossRef]
- Kenyon, S.; Lyons, G. The value of integrated multimodal traveller information and its potential contribution to modal change. Transp. Res. Part F Traffic Psychol. Behav. 2003, 6, 1–21. [Google Scholar] [CrossRef]
- Lucas, K. Transport and social exclusion: Where are we now? Transp. Policy 2012, 20, 105–113. [Google Scholar] [CrossRef]
- De Vos, J.; Schwanen, T.; Van Acker, V.; Witlox, F. Travel and subjective well-being: A focus on findings, methods and future research needs. Transp. Rev. 2013, 33, 421–442. [Google Scholar] [CrossRef]
- Parkhurst, G.; Meek, S. The effectiveness of park-and-ride as a policy measure for more sustainable mobility. In Parking Issues and Policies; Emerald Group Publishing Limited: Bingley, UK, 2014; Volume 5, pp. 185–211. [Google Scholar]
- Lättman, K.; Olsson, L.E.; Friman, M. Development and test of the perceived accessibility scale (PAC) in public transport. J. Transp. Geogr. 2016, 54, 257–263. [Google Scholar] [CrossRef]
- Budd, J.W.; Mumford, K.A. Family-friendly work practices in Britain: Availability and perceived accessibility. Hum. Resour. Manag. Publ. Coop. Sch. Bus. Adm. Univ. Mich. Alliance Soc. Hum. Resour. Manag. 2006, 45, 23–42. [Google Scholar] [CrossRef]
- Lättman, K.; Friman, M.; Olsson, L.E. Restricted car-use and perceived accessibility. Transp. Res. Part D Transp. Environ. 2020, 78, 102213. [Google Scholar] [CrossRef]
- Van Wee, B.; Geurs, K. Discussing equity and social exclusion in accessibility evaluations. Eur. J. Transp. Infrastruct. Res. 2011, 11, 350–367. [Google Scholar] [CrossRef]
- Farrington, J.H. The new narrative of accessibility: Its potential contribution to discourses in (transport) geography. J. Transp. Geogr. 2007, 15, 319–330. [Google Scholar] [CrossRef]
- Preston, J.; Rajé, F. Accessibility, mobility and transport-related social exclusion. J. Transp. Geogr. 2007, 15, 151–160. [Google Scholar] [CrossRef]
- Friman, M.; Lättman, K.; Olsson, L.E. Public transport quality, safety, and perceived accessibility. Sustainability 2020, 12, 3563. [Google Scholar] [CrossRef]
- Jamei, E.; Chan, M.; Chau, H.W.; Gaisie, E.; Lättman, K. Perceived accessibility and key influencing factors in transportation. Sustainability 2022, 14, 10806. [Google Scholar] [CrossRef]
- Ryan, M.; Lin, T.; Xia, J.C.; Robinson, T. Comparison of perceived and measured accessibility between different age groups and travel modes at Greenwood Station, Perth, Australia. Eur. J. Transp. Infrastruct. Res. 2016, 16, 406–423. [Google Scholar] [CrossRef]
- Trolese, M.; De Fabiis, F.; Coppola, P. A Walkability Index including Pedestrians’ Perception of Built Environment: The Case Study of Milano Rogoredo Station. Sustainability 2023, 15, 15389. [Google Scholar] [CrossRef]
- Coppola, P.; Silvestri, F. Assessing travelers’ safety and security perception in railway stations. Case Stud. Transp. Policy 2020, 8, 1127–1136. [Google Scholar] [CrossRef]
- Gunn, L.; Kroen, A.; De Gruyter, C.; Higgs, C.; Saghapour, T.; Davern, M. Early delivery of equitable and healthy transport options in new suburbs: Policy, place and people. J. Transp. Health 2020, 18, 100870. [Google Scholar] [CrossRef]
- Lawrie, I.; Stone, J. Better Buses for Melbourne’s West. Available online: https://msd.unimelb.edu.au/__data/assets/pdf_file/0003/4224729/Better-Buses-for-Melbournes-West-launch.pdf (accessed on 25 May 2024).
- Currie, G.; Delbosc, A.; Pavkova, K. Alarming Trends in the Growth of Forced Car Ownership in Melbourne. Available online: https://www.monash.edu/__data/assets/pdf_file/0004/1515676/ATRF2018_Paper_8_Forced-Car-Ownership-in-Melbourne-.pdf (accessed on 25 May 2024).
- City of Wyndham. A Snapshot of Wyndham. Available online: https://www.wyndham.vic.gov.au/snapshot-wyndham (accessed on 25 July 2022).
- Nguyen-Phuoc, D.Q.; Tran, A.T.P.; Van Nguyen, T.; Le, P.T.; Su, D.N. Investigating the complexity of perceived service quality and perceived safety and security in building loyalty among bus passengers in Vietnam–a PLS-SEM approach. Transp. Policy 2021, 101, 162–173. [Google Scholar] [CrossRef]
- Sam, E.F.; Hamidu, O.; Daniels, S. SERVQUAL analysis of public bus transport services in Kumasi metropolis, Ghana: Core user perspectives. Case Stud. Transp. Policy 2018, 6, 25–31. [Google Scholar] [CrossRef]
- Parasuraman, A.; Zeithaml, V.A.; Berry, L.L. SERVQUAL: A multiple-item scale for measuring consumer perceptions of service quality. J. Retail. 1988, 64, 12–40. [Google Scholar]
- Field, A. Discovering Statistics Using IBM SPSS Statistics; SAGE: London, UK, 2013. [Google Scholar]
- Lättman, K.; Olsson, L.E.; Friman, M. A new approach to accessibility–Examining perceived accessibility in contrast to objectively measured accessibility in daily travel. Res. Transp. Econ. 2018, 69, 501–511. [Google Scholar] [CrossRef]
- Sundling, C.; Berglund, B.; Nilsson, M.E.; Emardson, R.; Pendrill, L.R. Overall accessibility to traveling by rail for the elderly with and without functional limitations: The whole-trip perspective. Int. J. Environ. Res. Public Health 2014, 11, 12938–12968. [Google Scholar] [CrossRef]
- Cheng, Y.-H.; Chen, S.-Y. Perceived accessibility, mobility, and connectivity of public transportation systems. Transp. Res. Part A Policy Pract. 2015, 77, 386–403. [Google Scholar] [CrossRef]
- Sundling, C.; Nilsson, M.E.; Hellqvist, S.; Pendrill, L.R.; Emardson, R.; Berglund, B. Travel behaviour change in old age: The role of critical incidents in public transport. Eur. J. Ageing 2016, 13, 75–83. [Google Scholar] [CrossRef] [PubMed]
- Abenoza, R.F.; Ceccato, V.; Susilo, Y.O.; Cats, O. Individual, travel, and bus stop characteristics influencing travelers’ safety perceptions. Transp. Res. Rec. 2018, 2672, 19–28. [Google Scholar] [CrossRef]
- Ingvardson, J.B.; Nielsen, O.A. The influence of vicinity to stations, station characteristics and perceived safety on public transport mode choice: A case study from Copenhagen. Public Transp. 2022, 14, 459–480. [Google Scholar] [CrossRef]
- Allen, J.; Farber, S. Planning transport for social inclusion: An accessibility-activity participation approach. Transp. Res. Part D Transp. Environ. 2020, 78, 102212. [Google Scholar] [CrossRef]
- Hidayati, I.; Tan, W.; Yamu, C. Conceptualizing mobility inequality: Mobility and accessibility for the marginalized. J. Plan. Lit. 2021, 36, 492–507. [Google Scholar] [CrossRef]
- Kawamura, K. Transportation needs, location choice, and perceived accessibility for businesses. Transp. Res. Rec. J. Transp. Res. Board 2004, 1898, 202–210. [Google Scholar] [CrossRef]
Disclaimer/Publisher’s Note: The statements, opinions and data contained in all publications are solely those of the individual author(s) and contributor(s) and not of MDPI and/or the editor(s). MDPI and/or the editor(s) disclaim responsibility for any injury to people or property resulting from any ideas, methods, instructions or products referred to in the content. |
© 2024 by the authors. Licensee MDPI, Basel, Switzerland. This article is an open access article distributed under the terms and conditions of the Creative Commons Attribution (CC BY) license (https://creativecommons.org/licenses/by/4.0/).