Article

Coffee Silverskin as a Fat Replacer in Chicken Patty Formulation and Its Effect on Physicochemical, Textural, and Sensory Properties

by
İzzet Özhamamcı
Department of Food Engineering, Faculty of Engineering, Ardahan University, 75000 Ardahan, Türkiye
Appl. Sci. 2024, 14(15), 6442; https://doi.org/10.3390/app14156442
Submission received: 2 July 2024 / Revised: 13 July 2024 / Accepted: 20 July 2024 / Published: 24 July 2024
(This article belongs to the Section Food Science and Technology)

Abstract

:
Coffee silverskin (CSS) is a by-product released as waste after roasting coffee beans. This by-product can be used as a functional food ingredient as it contains many valuable compounds such as fibers, sugars, phenolic acids, carotenoids, and flavonoids. In this research, the effects of the partial substitution of animal fat with CSS on physicochemical, textural, and sensory properties in chicken patty production were investigated. For this purpose, four different groups of chicken patties were produced in which animal fat was replaced with CSS at different rates (control: 12% fat, SS1: 10% fat + 2% silverskin, SS2: 8% fat + 4% silverskin, SS3: 6% fat + 6% silverskin). The substitution of animal fat with CSS resulted in decreases in pH, moisture content, water activity, and color values while increasing TBARS (Thiobarbituric acid-reactive substances) and moisture retention. The cooking process also significantly affected the physicochemical properties (p < 0.01). Textural parameters, apart from adhesiveness, were affected by the replacement of animal fat with CSS. While hardness increased compared to the control, resilience, and springiness decreased. On the other hand, cohesiveness was similar in control and SS1 but decreased in other ratios. The use of CSS affected all sensory characteristics, and the sensory evaluation scores closest to the control were determined in the group that used 2% CSS instead of animal fat.

1. Introduction

Coffee is one of the most consumed beverages around the world have increasing consumption. According to data from the International Coffee Organization (ICO), annual coffee consumption reached 177 million 60 kg bags in 2023–2024, compared to 173.1 mil-lion 60 kg bags in 2022–2023 [1]. While coffee is typically associated with the seed of the coffee fruit, significant amounts of by-products also emerge [2]. The coffee fruit has several layers, including the epicarp, mesocarp, endocarp, silverskin, and seed [3]. The epicarp’s color can range from red to yellow, depending on the fruit’s ripeness. The mesocarp is a sticky structure containing pectin, while the endocarp is a thin polysaccharide layer. Silverskin (SS) surrounds the seed and is a transparent shell containing compounds such as monosaccharides, proteins, polyphenols, polysaccharides, cellulose, and hemicellulose. Within this shell is a green seed containing the endosperm and embryo [3,4,5]. Among the layers surrounding the coffee fruit, silverskin is the only by-product released during roasting [6]. In today’s world, there is global political and social pressure to reduce pollution caused by industrial activities. Significant support is provided for scientific studies, projects, and activities to reduce this pollution. Despite the progress worldwide in valorizing coffee fruit waste, practical methods for utilizing silverskin, a by-product generated during roasting, have not been sufficiently developed. Therefore, there is a growing de-mand for new techniques and technologies to recover and use CSS [7].
As the interest in healthy food consumption has increased in recent years, food product manufacturers and researchers are interested in low calories, sugar, fat, and sodium; It is focused on developing products with high fiber, protein, mineral, vitamin, and antioxidant content. However, changing the amount of ingredients in any food to reduce its calories may negatively affect the texture, mouthfeel, flavor, and appearance of the product. Despite this, the demand for fiber-rich, healthier, and also delicious foods is in-creasing as consumers become aware of the benefits of increasing the fiber content of their diets. It is noteworthy that the food industry has replaced the fat used in foods with dietary fiber to produce food products that are both healthy and without losing taste [8]. CSS contains a significant amount of protein (11–19%) and is rich in carbohydrates (60–68%). Although it contains approximately 7% minerals, and it has a low-fat content (<4%) [6,9,10,11]. Additionally, CSS has a high dietary fiber (50–60%), containing 15% soluble dietary fiber and 85% insoluble dietary fiber [12,13,14]. A wide range of health-promoting effects have been attributed to this coffee by-product, including anti-inflammatory, anti-diabetic, and anticholesterolemic. These benefits are related to the presence of bioactive compounds, highlighted by phenolics with high antioxidant activity, such as caffeine and chlorogenic acid [15].
Dietary fiber plays important roles, such as delaying the residence time in the stomach, reducing hunger, facilitating digestion, and reducing obesity [16]. Consumers’ tendencies to increase the amount of fiber in their diets also increase the demand for fiber rich healthy foods [17]. Fiber has been employed recently for developing reduced-fat meat products, given the textural and organoleptic characteristics that it contributes, as well as the reduced caloric value and nutritional effects [18,19]. In this context, a promising way to produce healthy food while preserving product properties in the food industry is to replace fat with dietary fiber [20]. Besides dietary fiber, CSS is also rich in chlorogenic acids (CGAs). Among the 30 different types of CGAs identified in coffee beans, the three main classes are caffeoylquinic acids (CQAs), di-caffeoylquinic acids (diCQAs), and feruloylquinic acids (FQAs). In particular, CSS is distinguished by its high content of 3-CQA, 4-CQA, 5-CQA, 3,4-diCQA, 3,5-diCQA, 4,5-diCQA, FQA, 4-FQA, and 5FQA among these 3 important acids. Chlorogenic acids participate in antioxidant, antibacterial, antiviral, and anti-inflammatory activities. Therefore, having high levels of bioactive compounds, especially polyphenols, CSS is a functional component that can exhibit potential beneficial effects on human health by protecting against oxidative damage, carbonyl stress, and advanced glycation termination accumulation (AGEs). It is also widely claimed to have pro-biotic activity [21].
Fat replacers can be classified into fat substitutes and fat imitators based on their chemical structure and function. Fat substitutes normally have a structure similar to that of TAGs and are used to replace fats one-for-one. Fat mimetics, on the other hand, have similar functions to fats, but they cannot replace fats one-to-one. While limited options exist for lipid- and protein-based fat substitutes, carbohydrate-based substitutes include a very broad family of materials, including starches, fibers, and their derivatives. In reduced-fat or fat-free foods, carbohydrate-based fat substitutes can be found in particle form that mimics fat particles or used to have the capacity to provide fat-like properties by contributing to the textural and sensory properties often found in fatty foods. Carbohydrates can also form microparticles with sizes and shapes similar to those of the fat globules and emulsion droplets. This creates opportunities to mimic fats. Fibers are not structurally similar to fats. However, because microcrystalline cellulose is physically and structurally similar to oil emulsions, it can provide oil-like properties in low-fat foods. Carbohydrate fat substitutes with a shape and size similar to those of fat particles are dispersed separately and can interact with other colloidal particles [22]. Based on this definition, replacing fat in meat products is achieved by adding other ingredients with low or no calorie content. The process of developing processed meat presents a technological challenge in terms of fat reduction. This is because fat significantly affects sensory properties as it serves important functions in determining three basic sensory proper-ties such as appearance (color and surface integrity), texture (viscosity, elasticity, and hardness), and flavor intensity. Options for changing the formulations of meat products include adding dietary fiber and reducing fat [23].
Due to its high fiber content and composition, CSS has become a significant and functional ingredient that can be incorporated into several food formulations [6,24,25]. However, there are few studies on the use of CSS in food formulations [26]. CSS has been studied for its potential use as a dietary fiber source in bread making [14], a nutraceutical component in yogurt [27], and a source of dietary fiber and prebiotics in biscuit production [28]. Additionally, the effect of CSS on oxidation in cooked chicken burgers [29] and its use as a phosphate replacer in sausages [30] have also been investigated. Besides all these, there are limited studies on the use of CSS as a carbohydrate-based fat replacer [31]. However, there is no study on the use of CSS, which has high dietary fiber content, in chicken patties as a fat substitute. The objective of this study is to produce functional chicken patties using CSS as an animal fat substitute with its dietary fiber source. In the present study, the effects of using CSS as an animal fat replacer in chicken patty production on physicochemical, textural, and sensory properties were examined.

2. Materials and Methods

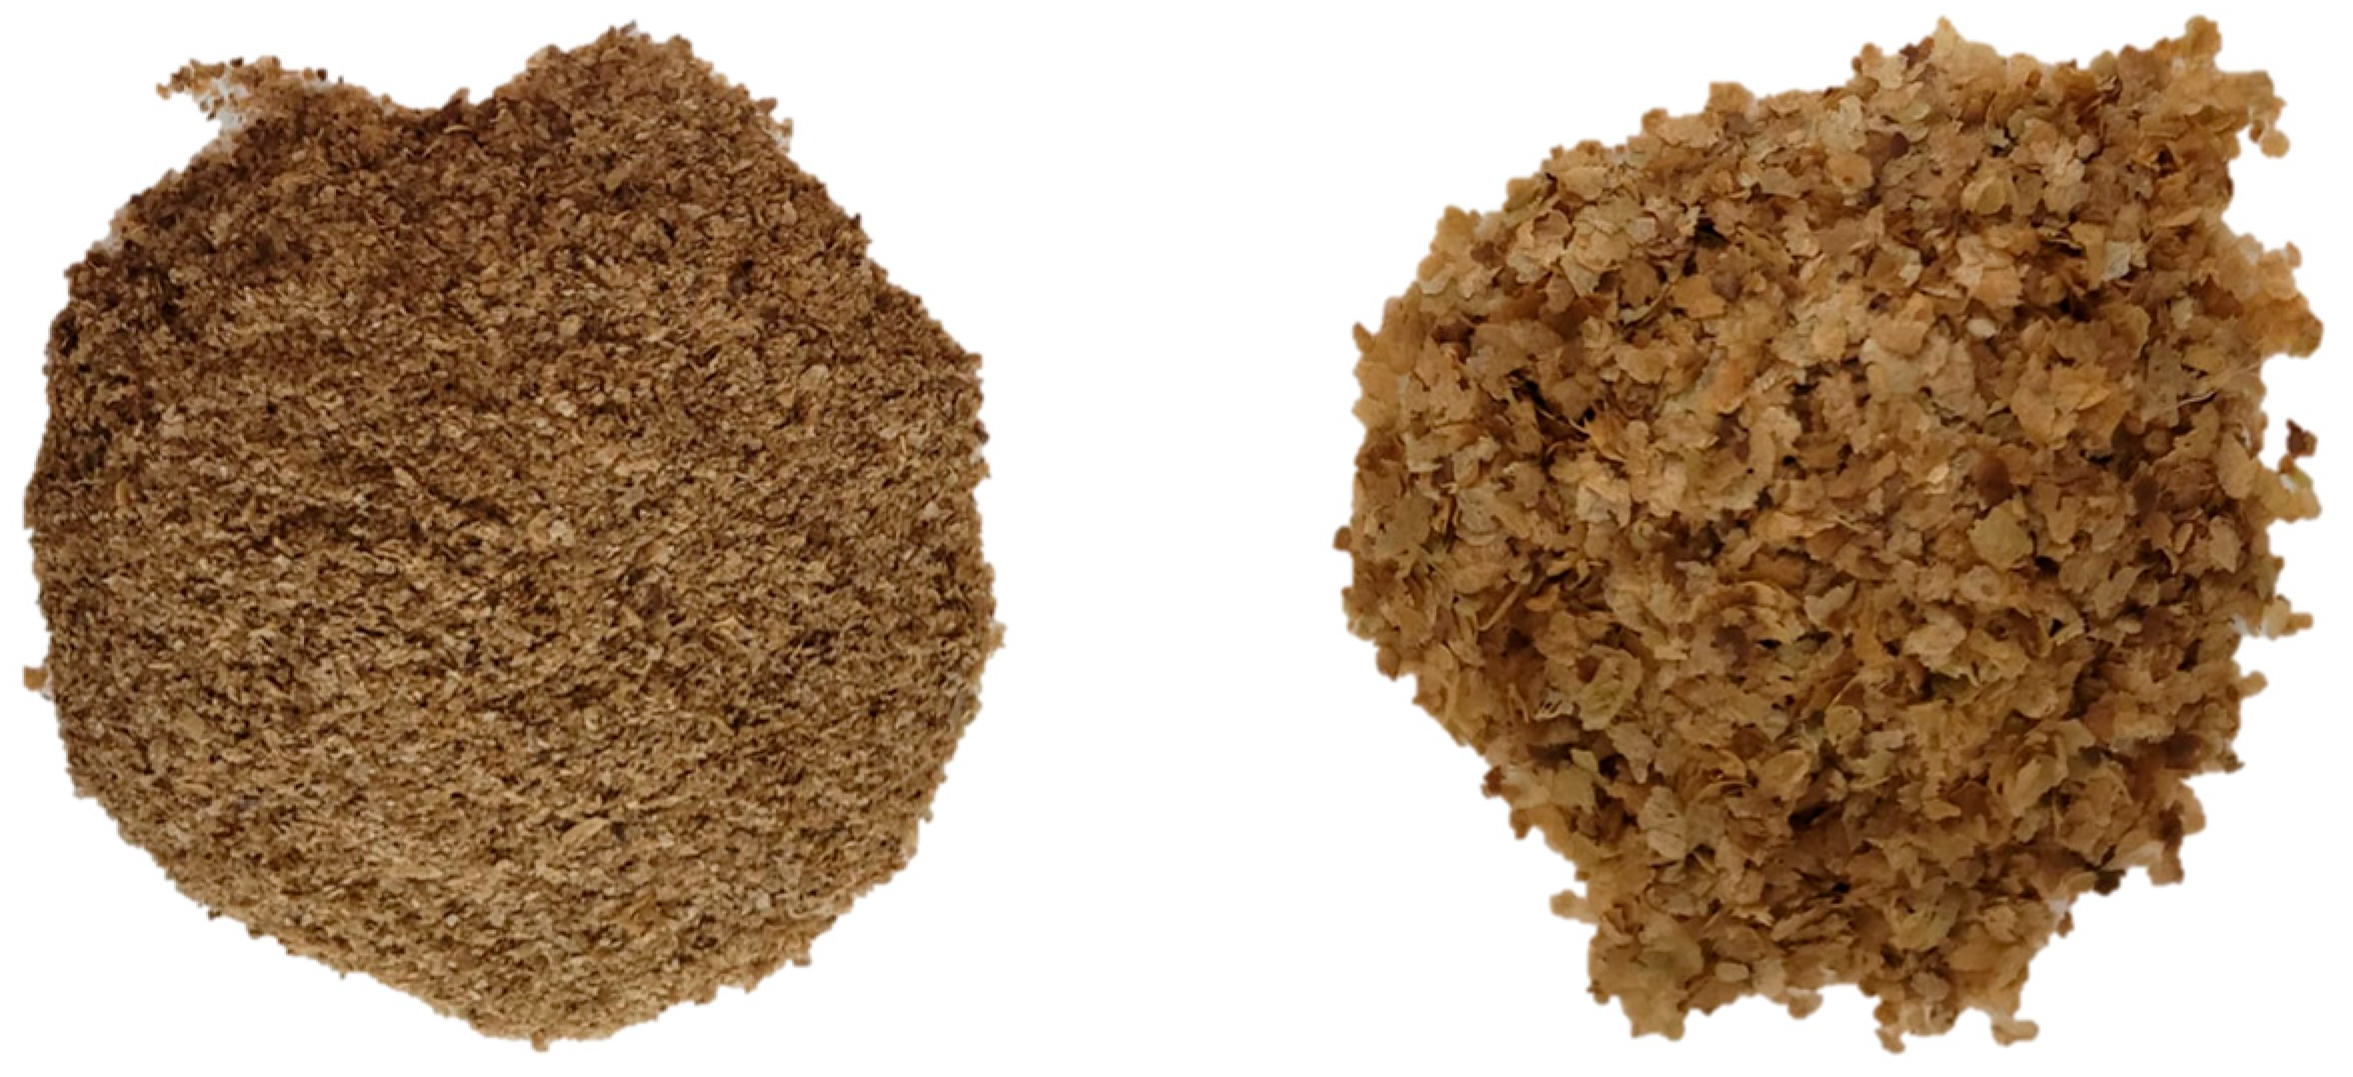
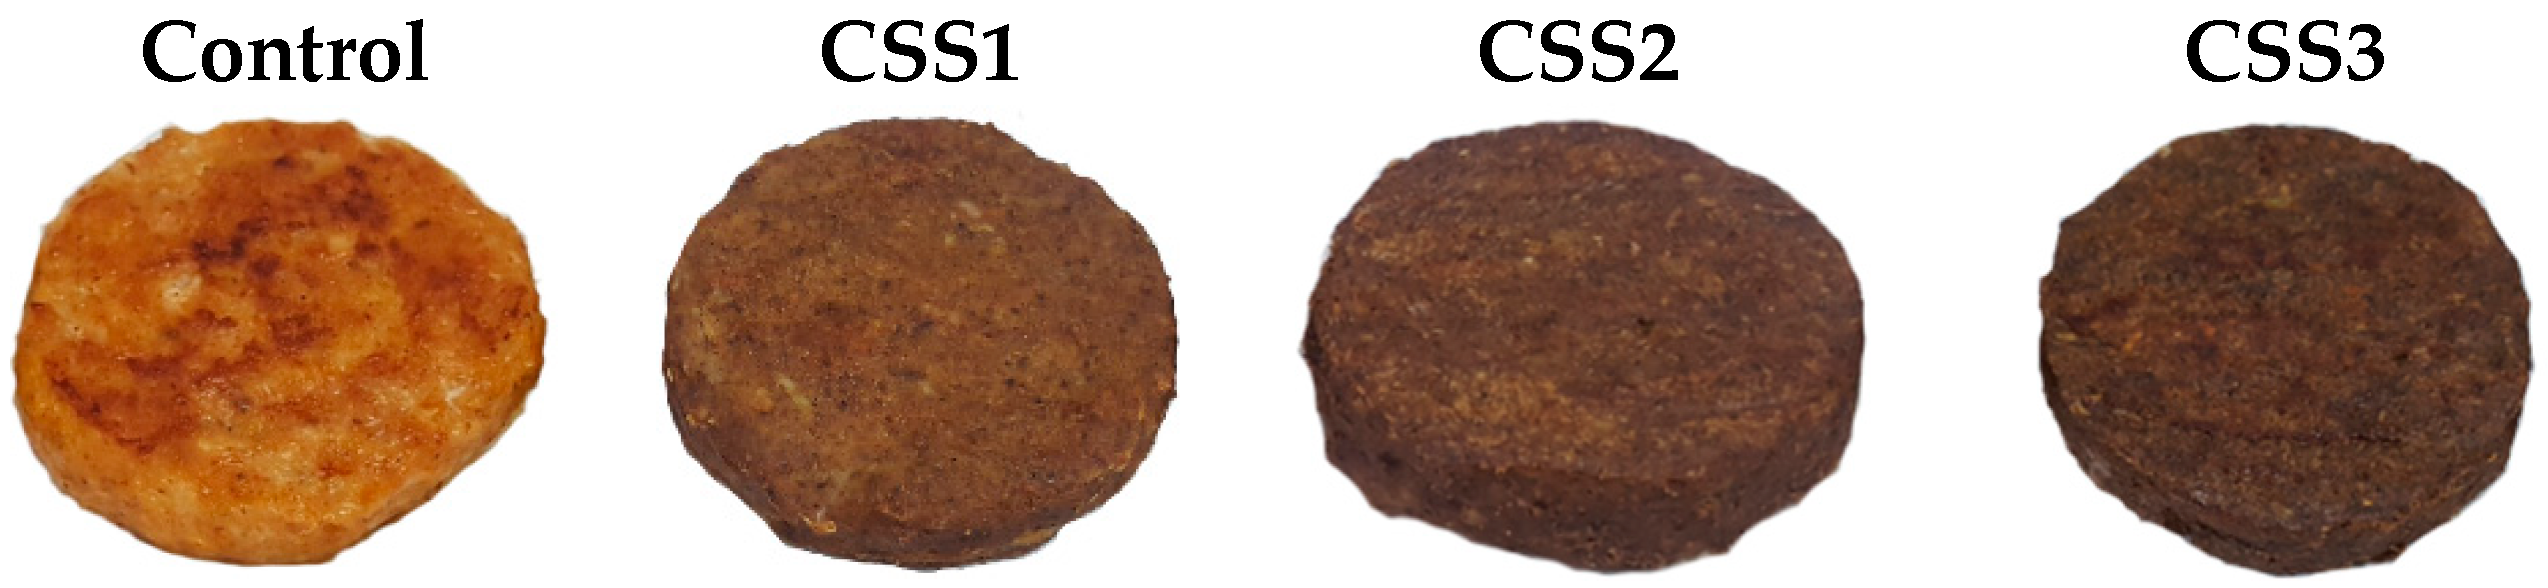
2.1. Production of Chicken Patties

Chicken breast meat, animal fat, garlic, onion, egg, breadcrumbs, and spices used as materials in the study were bought from the local market. Dry CSS derived from a mixture of Arabica varieties was obtained from Miko Gıda (Antalya, Türkiye) and Gönen Kuru Kahve (Izmir, Türkiye) companies. The biomass was ground in a miller (Vorwerk Thermomix TM6-1, Wuppertal, Germany) and sieved to a size of 125–250 µm. Ground and unground coffee silverskin are shown in Figure 1.
Four different groups containing 9 patty samples were produced in 2 blocks. The control group’s patty mixture consisted of 70% chicken breast meat, 12% fat, 6% onion, 0.3% garlic, 1.4% salt, 0.85% paprika, 0.15% thyme, 0.3% black pepper, 0.5% cumin, 2.5% eggs, and 6% bread crumbs. In the other groups, the fat content was reduced, and CSS was used in varying proportions (Control: 12% fat; SS1: 10% fat + 2% silverskin; SS2: 8% fat + 4% silverskin; SS3: 6% fat + 6% silverskin). All ingredients were simultaneously placed in a kneading machine (Schafer Prochef XL, Istanbul, Türkiye) and mixed until a homogeneous mixture (about 4 min). After that, the patty samples (50 g) were shaped with a ready-made mold (7 cm diameter, 1 cm height) from this mixture and refrigerated at 4 °C overnight before cooking. The patties were cooked without using oil or fat on a hot plate (Electro-mag, M4060, Istanbul, Türkiye) at 200 °C for 8 min, with each surface cooked for 4 min. The physical appearance of cooked patty samples is shown in Figure 2.
The physicochemical analyses were performed in raw and cooked patty samples, while Texture Profile Analysis (TPA) and sensory analysis were conducted only in the cooked samples.

2.2. Physicochemical Analysis

The pH and moisture content analyses were performed according to the AOAC International [32]. The pH meter (GLP 22, Crison Instruments, S.A., Allella Barcelona, Spain) was calibrated with pH:4 and pH:7 buffer solutions before use. A water activity device (Novasina, TH-500 aw Sprint, Pfäffikon, Switzerland) was utilized to determine the samples’ water activity (aw) values. Before use, the device was calibrated at 25 °C using six different salt solutions. The samples were placed in special plastic containers and inserted into the measurement chamber of the device, where the aw values were detected at 25 °C. Thiobarbituric acid-reactive substances (TBARS) were determined following the method described by Lemon [33], and the TBARS values were detected as µmol MDA (malondialdehyde) per kg of the sample. The color intensities of the samples were determined according to the criteria provided by the Commission Internationale de l’E-clairage (CIE), which is based on three-dimensional color measurement, and the color values (L*, a*, and b*) were measured using a Minolta colorimeter device (CR-200, Minolta Co., Osaka, Japan). In this context, L* represents the lightness values, where L* = 0 indicates black and L* = 100 indicates white; a* represents the redness/greenness values, where +a* indicates red and −a* indicates green; and b* represents the yellow-ness/blueness values, where +b* indicates yellow and −b* indicates blue color intensities. To calculate the moisture retention of the samples, moisture contents and weights of three patty samples were determined before and after cooking, and the values were calculated by the following equation:
%   M o i s t u r e   R e t e n t i o n = c o o k e d   w e i g h t × %   m o i s t u r e   i n   c o o k e d   m e a t b a l l   r a w   w e i g h t × % m o i s t u r e   i n   r a w   m e a t b a l l × 100

2.3. Texture Profile Analysis (TPA)

TPA was performed using a texture analyzer (CT3 Texture Analyzer, Brookfield Engineering, Middleborough, MA, USA). Cylindrical samples (2 cm diameter and 1 cm thickness) extracted from chicken patties were analyzed at room temperature with two consecutive compression cycles using a 50.8 mm cylindrical probe (TA 25/1000, Brookfield Engineering Laboratories, Middleborough, MA, USA). The analysis used a pre-test speed of 1 mm/s, a test and post-test speed of 2 mm/s, a recovery time of 5 s, and a target strain of 50%. Texture profiles of the samples (hardness, adhesiveness, cohesiveness, springiness, and resilience) were calculated from the force-time curves.

2.4. Sensory Analysis

Ten panelists including five females and five males from the Department of Food Science conducted the sensory evaluation in two separate sessions using a 5-point hedonic scale (1 = very bad, 2 = bad, 3 = medium, 4 = good, 5 = very good) for odor, color, taste, texture, and general acceptability. The panelists were informed about the scale before the test, and the practice was carried out under fluorescent lighting. Water and bread were served to the panelists to cleanse their mouths between samples.

2.5. Statistical Analysis

The research was conducted and implemented according to a completely randomized block design. Patty production was carried out in two blocks using two different raw materials. For each sample, six measurements were taken for TPA, and three were taken for other analyses. The obtained results were subjected to analysis of variance using the IBM SPSS Statistics 20 software package. Mean values of significant sources of variation were compared using the Duncan multiple comparison test at the 95% confidence level (p < 0.05).

3. Results and Discussion

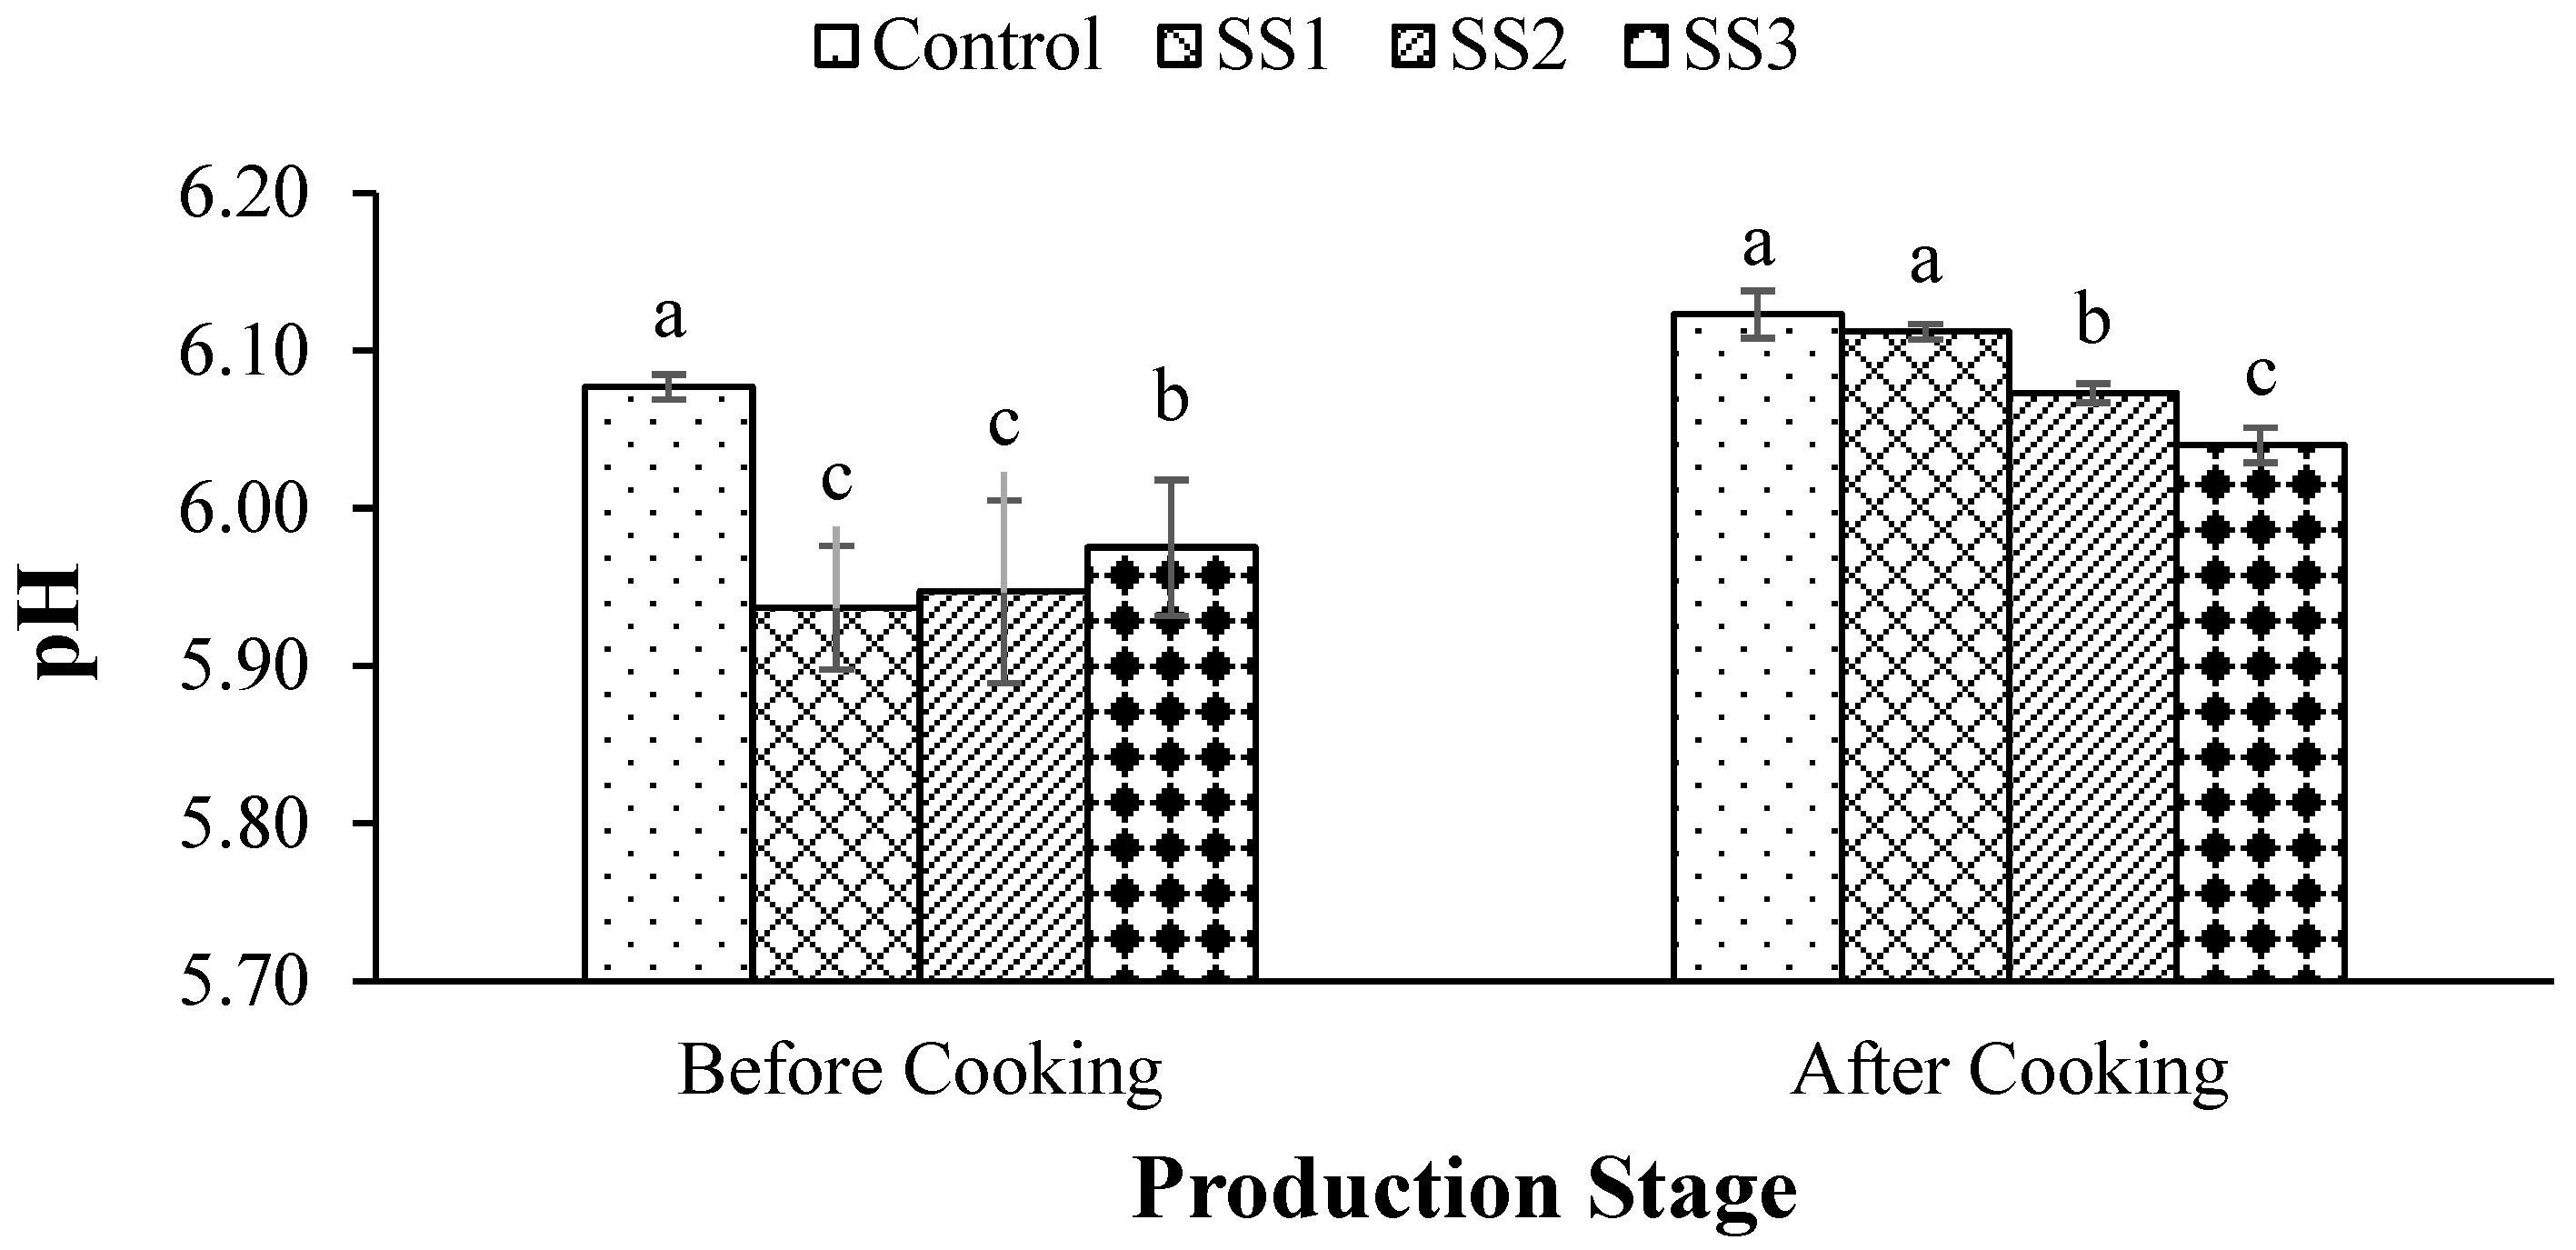
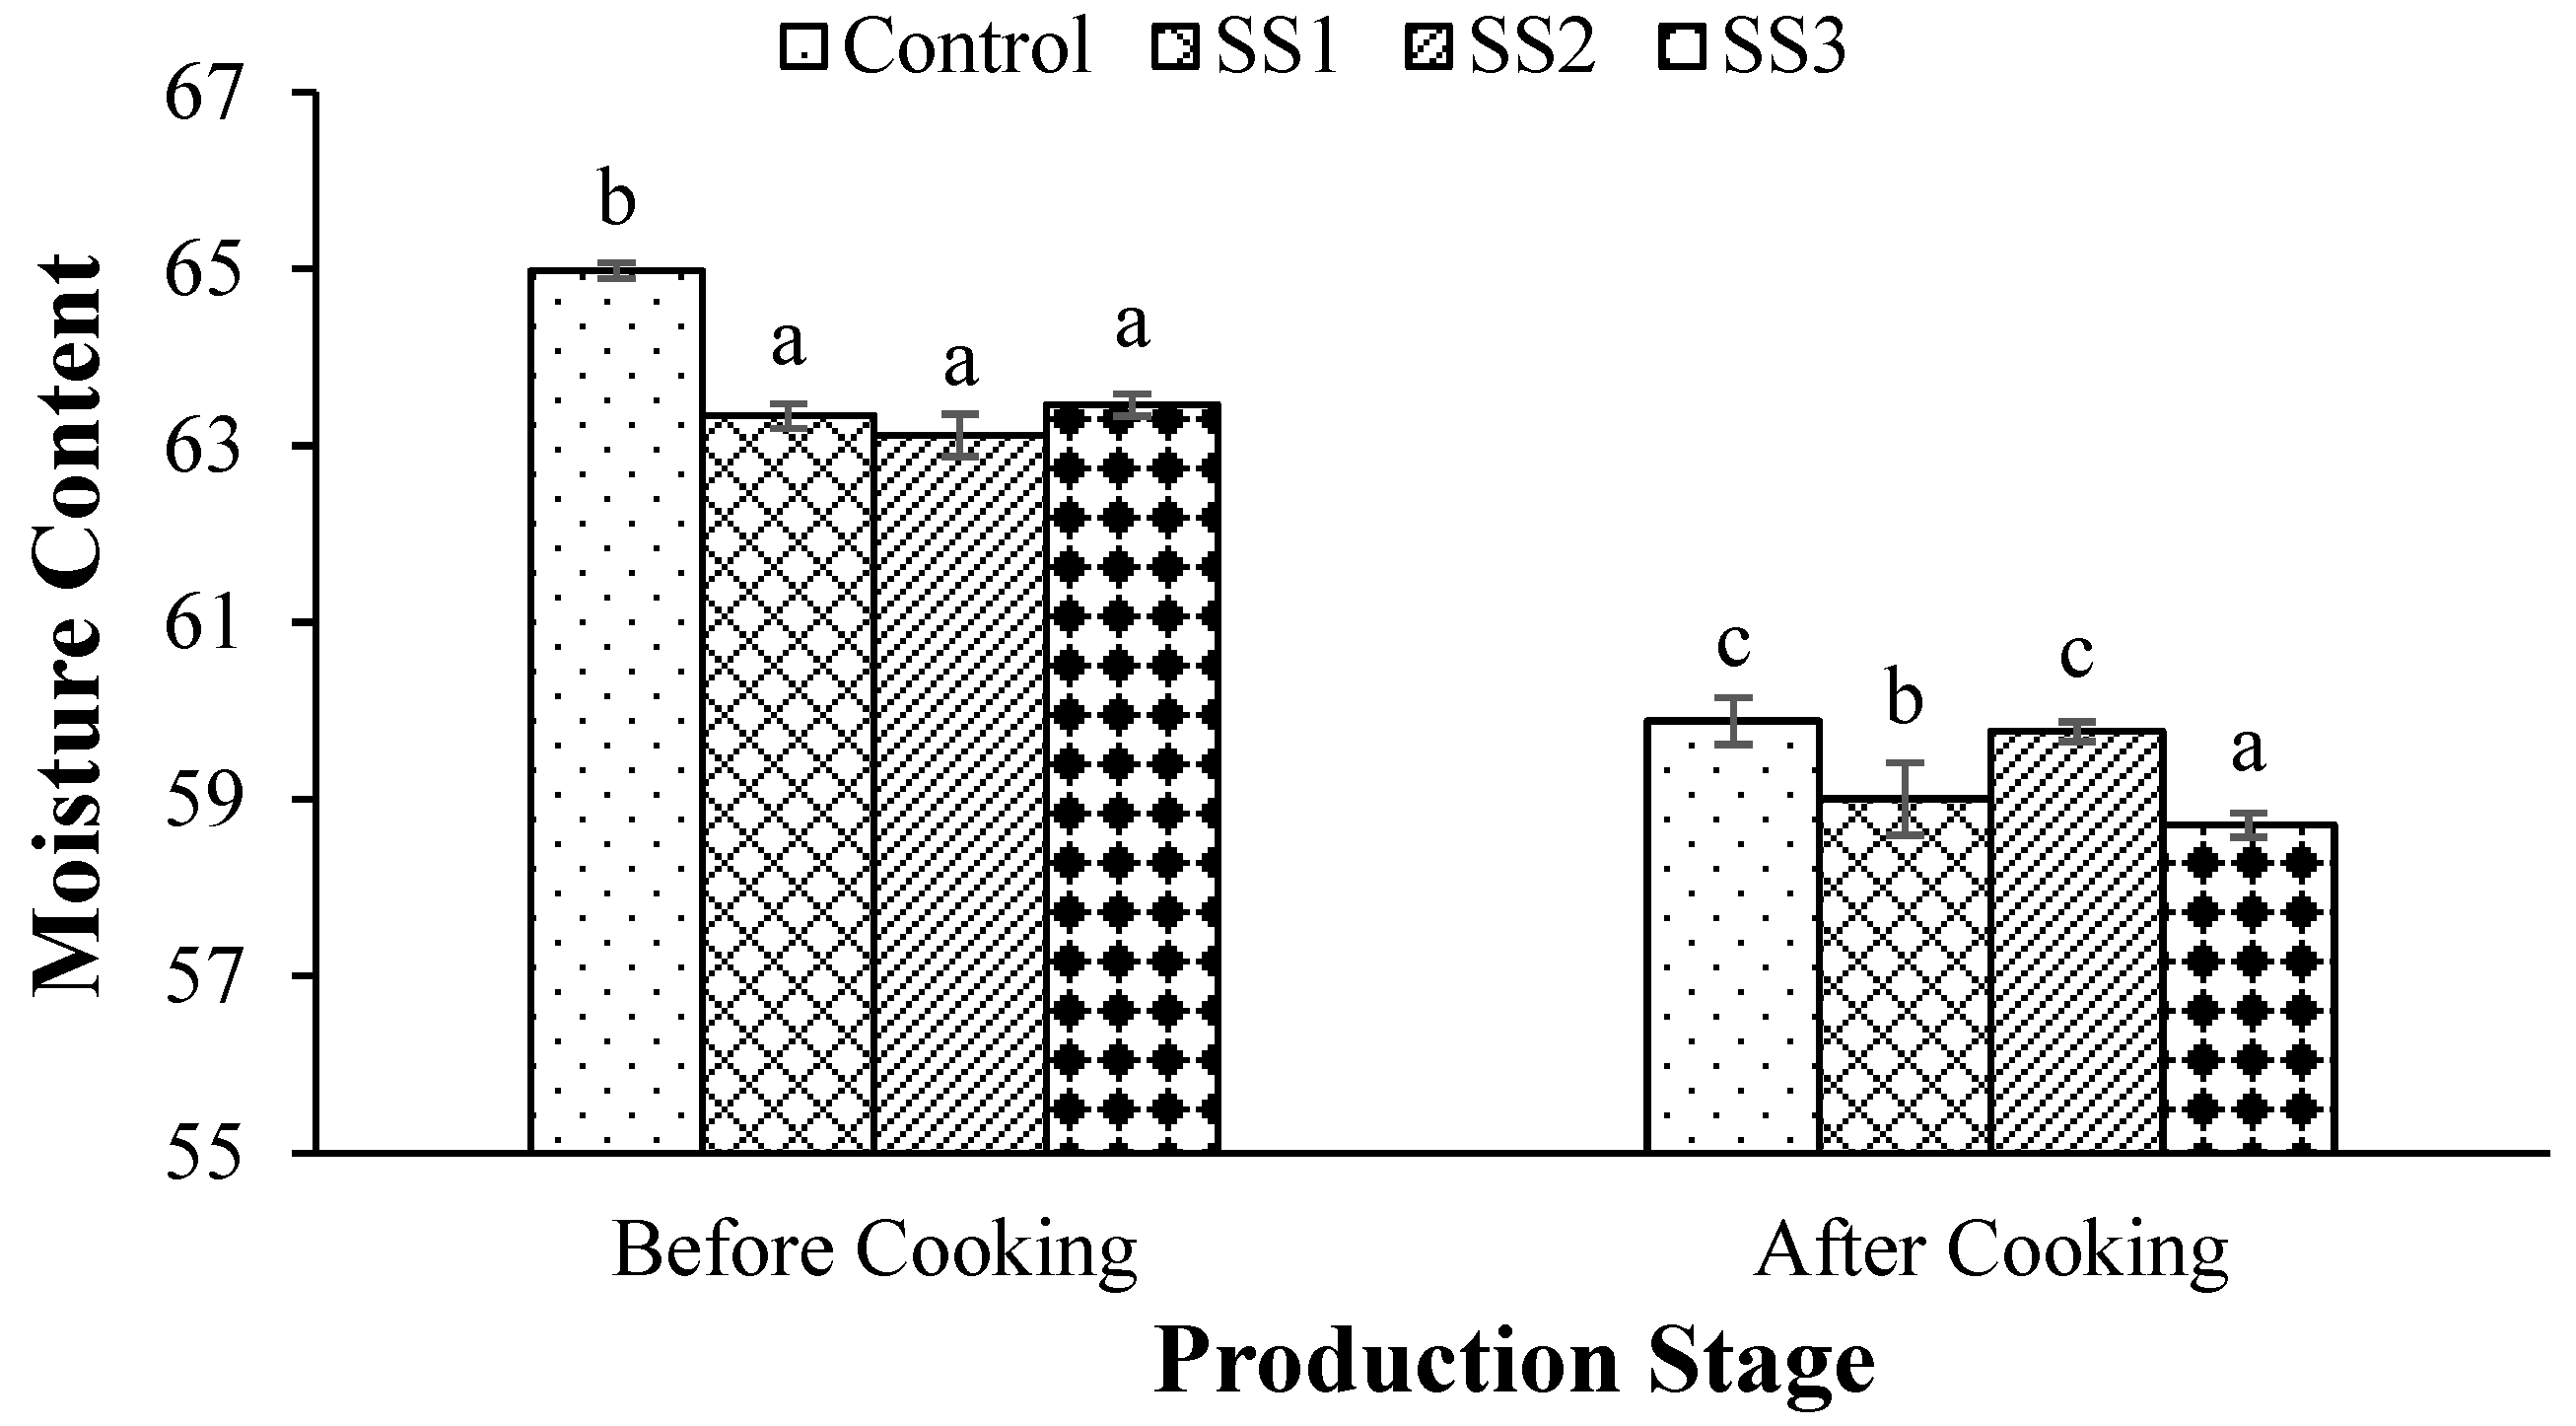
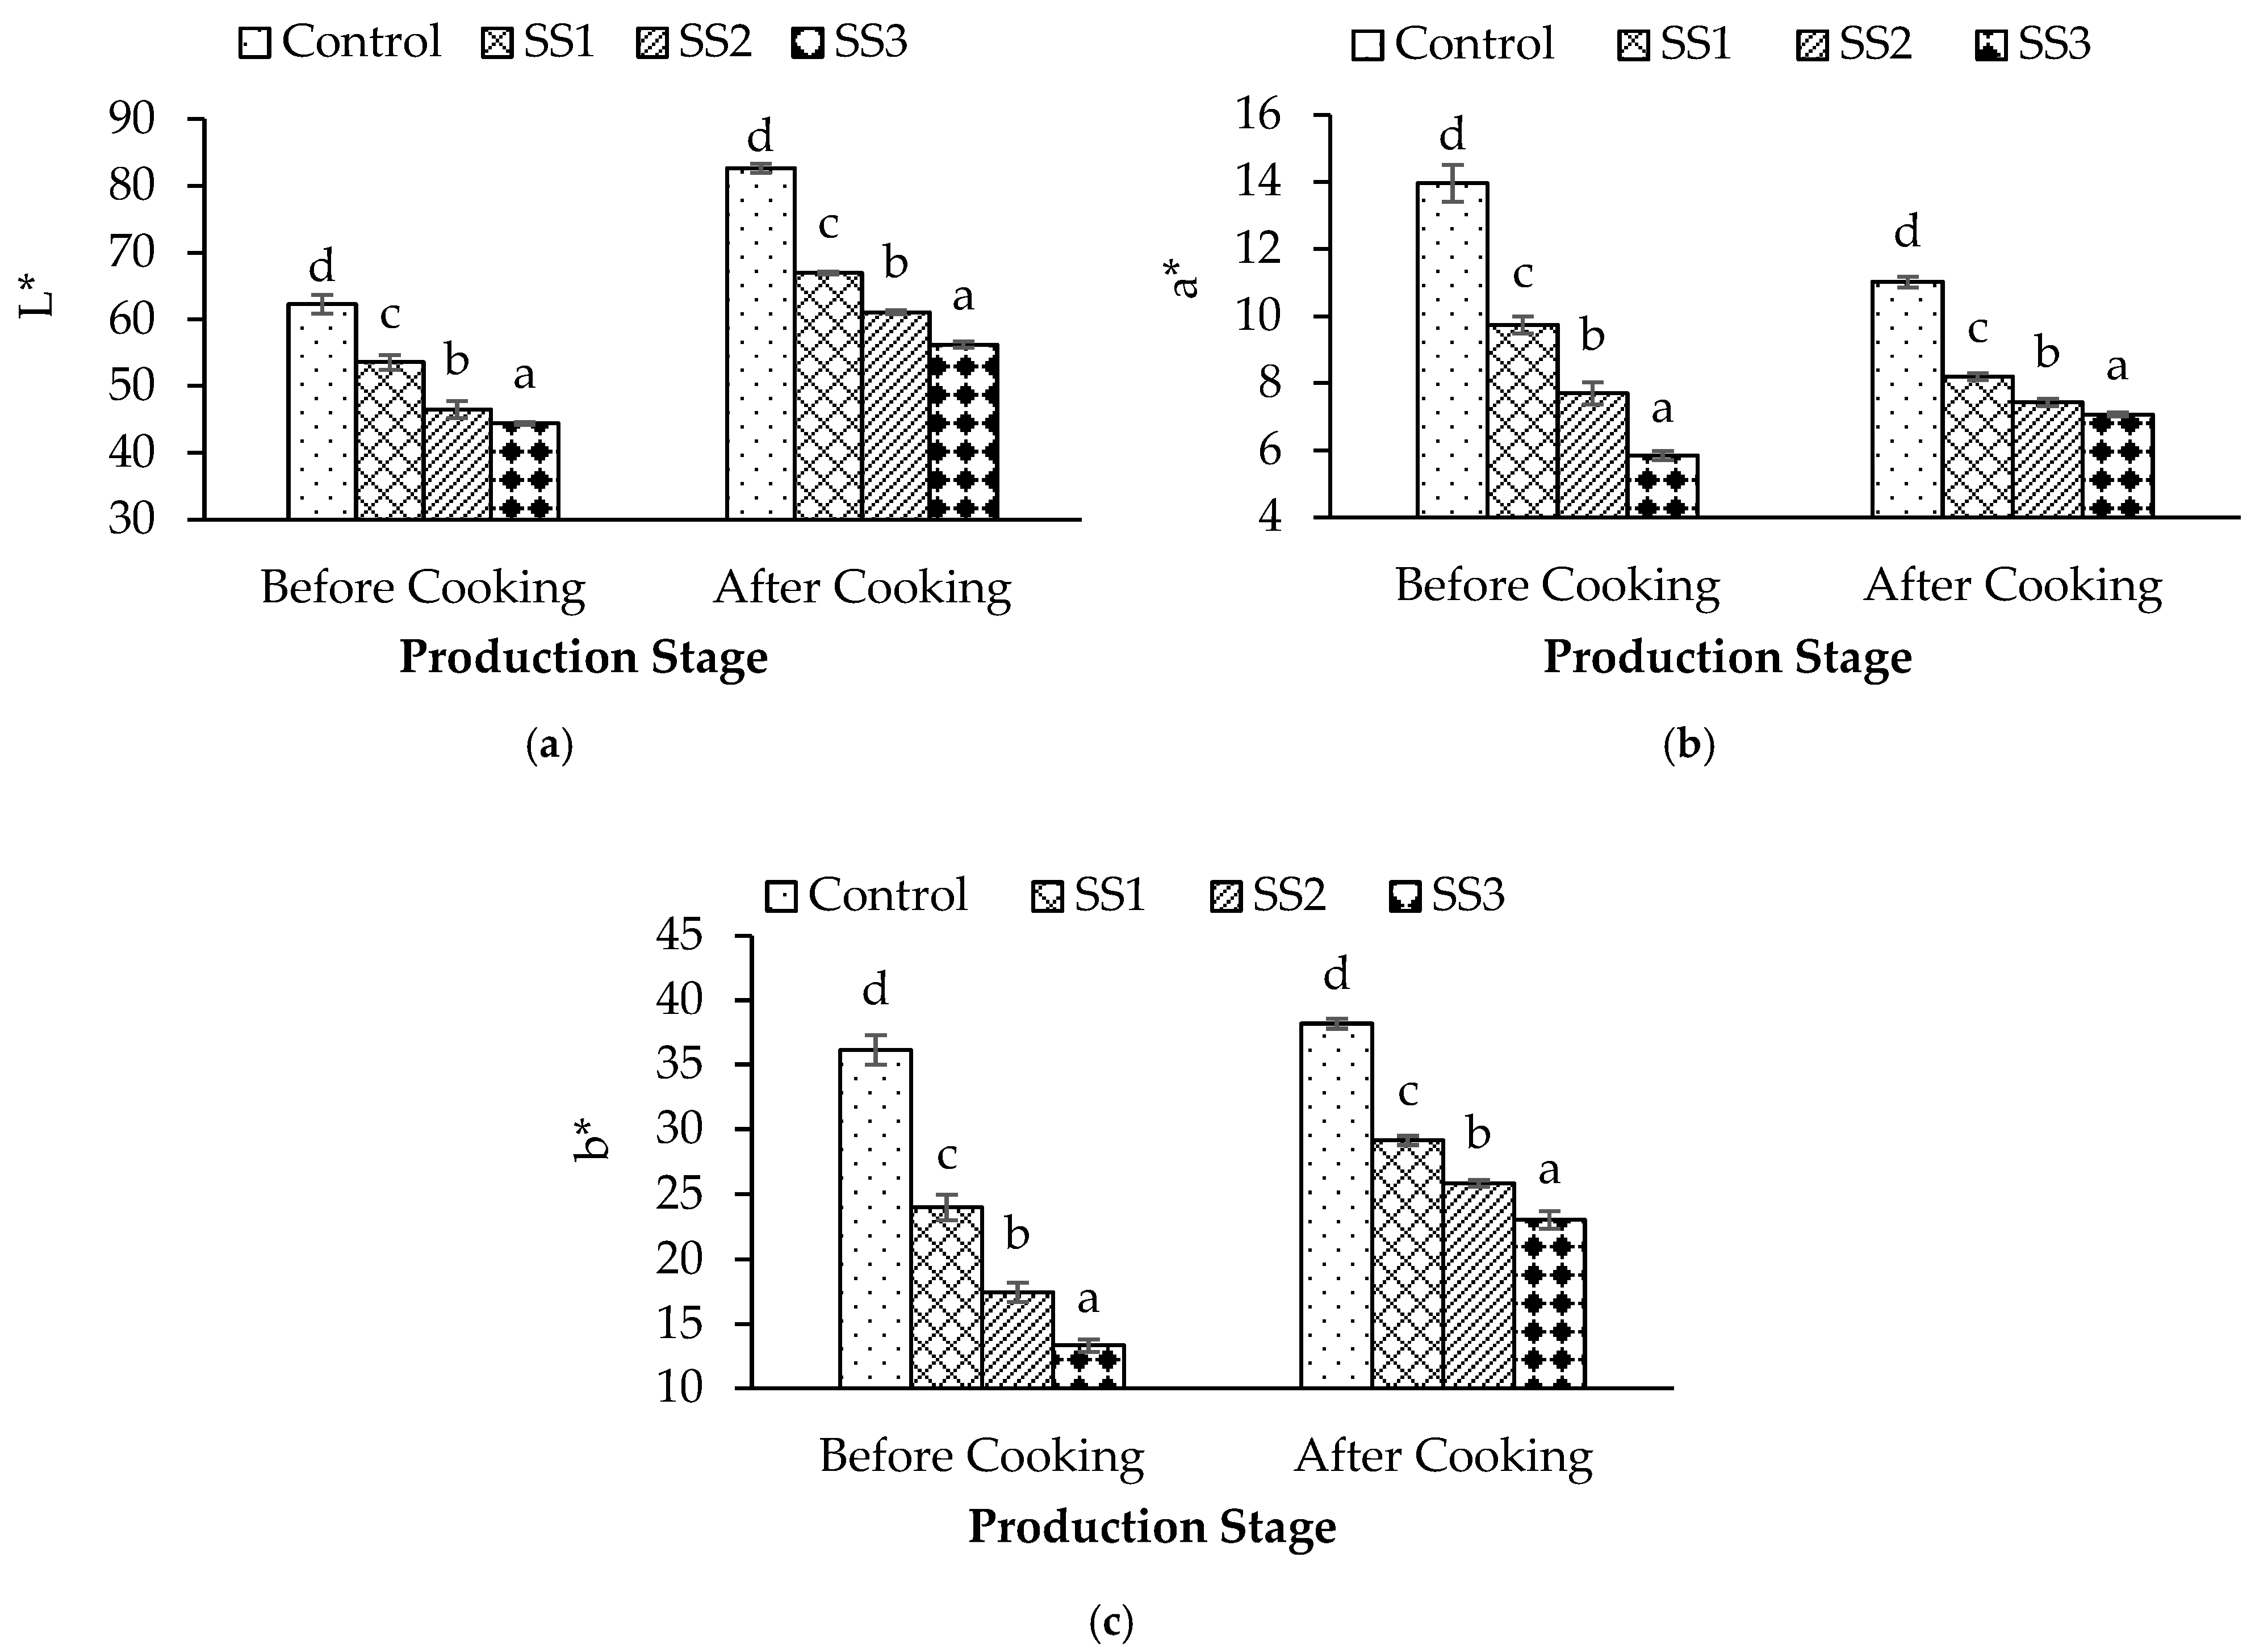
3.1. Physicochemical Properties

The values of the determined physicochemical properties in chicken patties with different levels of CSS addition are presented in Table 1. The use of CSS in chicken patties significantly affected the pH value (p < 0.01), and lower average pH values were observed in all groups with CSS compared to the control. Among them, the lowest average pH values were determined in the SS2 and SS3 groups, where animal fat was replaced with 4% and 6% CSS, respectively.
These results may be due to the addition of CSS, which has a relatively low pH value of 5.34 reported by Martuscelli et al. [2]. Similarly, Choi et al. [34] found that substituting pig-back fat with different levels of germinated wheat fiber in reduced-fat chicken meatballs, and Guedes-Oliveira et al. [35] reported that substituting animal fat with cashew apple fiber in chicken meatballs decreased the pH value compared to the control. On the other hand, Martuscelli et al. [29] reported that the addition of up to 3% of CSS did not significantly affect chicken patties’ pH value. The cooking process also significantly affected the pH value of chicken patties (p < 0.01). While there was a statistical difference between the average pH values of all groups (control, SS1, SS2, SS3) before and after cooking, the average pH value after cooking was higher (Table 2).
This increase in pH is likely due to protein denaturation during cooking which caused imidazolium revelation, the basic R group of the amino acid histidine [36,37]. pH is an important factor for the production of safe, quality and value-added food. The pH of foods plays an important role in determining the extent of heat treatment required to ensure a safe final product. pH also has an impact on color pigments [38]. Kirkyol and Akköse [37] found that the pH values of beef patty samples that replaced animal fat with almond flour increased with the cooking process. Similarly, Martuscelli et al. [29] reported higher pH values in chicken burgers with silverskin after cooking. The effect of treatment × production stage interaction on the pH value of chicken patties is shown in Figure 3.
The highest pH value was determined in the control sample before cooking, while the highest average values after cooking were observed in the control and SS1 samples. The highest increase in pH after cooking was observed in the sample with 2% CSS, followed by samples with 4% and 6% CSS, respectively.
Using CSS instead of animal fat in chicken patty production significantly affected the moisture content and aw values (p < 0.01). The replacement of animal fat with CSS decreased the moisture content and aw values of chicken patties. These results may be due to the addition of CSS, which has a relatively low moisture content of 2.78% reported by Martuscelli et al. [2], and 7.1% reported by Pourfarzad et al. [14]. In addition, it has a relatively low aw value of 0.32 reported by Martuscelli et al. [2] and 0.20 reported by Pourfarzad et al. [14]. While the highest average values were determined in the control group, the lowest average values were observed in the SS3 group with 6% CSS (p < 0.05). Lower moisture content and aw in chicken patties with CSS was probably due to the increase in solid content by dry CSS, which was used in this study having lower moisture content than animal fat. Similar results were reported by Ateş and Elmacı [8] in cakes with different levels of CSS addition as a fat replacer and by Bertolino et al. [27] in yogurt with CSS addition. However, Martuscelli et al. [29] found that adding 1.5% or 3% CSS to chicken burgers did not significantly affect the moisture content and aw values. The cooking process was found to have a significant effect on the moisture content and aw values of chicken patties (p < 0.01). There was a statistical difference between the average moisture content and aw values before and after cooking, with lower average values obtained after cooking (Table 2). This may be attributed to the moisture loss that occurs during cooking. Similar results were reported by Botella-Martinez et al. [39] in beef burgers with the addition of cocoa bean shells. The effect of treatment × production stage interaction on the moisture content of chicken patties is shown in Figure 4.
The highest moisture content was observed in the control group before cooking, while after cooking, the highest average values were found in the control and SS2 groups. After cooking, the moisture content decreased in all groups, with the lowest value determined in the SS3 group with 6% CSS.
Moisture retention is crucial for the taste of food and the preparation, processing, and storage of food. In chicken patties, the replacement of animal fat with CSS significantly influenced the moisture retention capacity (p < 0.01), and higher average moisture retention capacity values were observed in the groups with CSS compared to the control group (p < 0.05). However, no significant difference was observed among the groups with CSS. The high moisture retention capacity may be attributed to the high dietary fiber content (approximately 62.4%) of CSS [40]. Fruit fibers addition to meat products can increase the water-holding capacity of the food matrix causing higher moisture content [35]. Also, cellulose, one of the fiber contents of the coffee silverskin derivatives can be used to entrap moisture in a variety of foods [22]. Kılınççeker and Kurt [41] found that the addition of cellulose to chicken meatballs increased the water-holding/moisture retention capacity, but there was no statistical difference among the groups with different cellulose levels. In another study, adding amaranth and pumpkin seeds to chicken burgers increased the water-holding capacity/moisture retention [18].
TBARS is an important indicator that reflects the level of lipid oxidation in meat products. In chicken patties, replacing animal fat with CSS significantly affected the TBARS value (p < 0.01). The use of CSS increased TBARS values, and the highest average value was observed in the SS3 group, which used 6% animal fat + 6% CSS (p < 0.05). This could be attributed to the presence of polyunsaturated fatty acids (64%) in the CSS. It has been reported that the fat content of CSS is approximately 2–4%, with about 30% of this fat consisting of saturated fatty acids (esterified sterols, di and triacylglycerol), 64% of polyunsaturated fatty acids (free fatty acids, free sterols), and 6% monounsaturated fatty acids (palmitic and linoleic acids) [19,42]. However, Martuscelli et al. [29] found lower TBARS values in cooked chicken burgers with CSS compared to the control group. The cooking process also significantly affected the TBARS value in chicken patties produced using different levels of CSS instead of animal fat (p < 0.01). TBARS values increased after cooking. The TBARS value can vary depending on the processing conditions for different meat products. It has been reported that the threshold value for perceiving bitterness due to lipid oxidation is 2 mg MDA/kg (approximately 27.75 µmol MDA/kg) for some meat products [43,44,45]. In this study, TBARS values lower than this limit were observed in all groups and after cooking, except for the SS3 group.
Color is crucial in influencing consumer preferences for meat and meat products. Changes in the color of the chicken patties during the production stage are shown in Figure 5. The addition of CSS significantly impacted the color values of chicken patties (p < 0.01). Replacing animal fat with CSS resulted in a decrease in all color properties (L*, a*, and b*) of chicken patties, and this decrease continued as the proportion of CSS increased. These results may be due to the addition of CSS, which has a value of L* 20.8, a* 4.27, and b* 13.4 reported by Martuscelli et al. [2]. Therefore, the substitution of animal fat with CSS increased the darkness (L*) while reducing the redness (a*) and yellowness (b*) of chicken patties. This is probably due to the characteristic color of CSS. It has been reported that the color of CSS depends mainly on the interaction of structural polyphenols and anthocyanins that participate in oxidation and polymerization reactions during the coffee roasting stage, and also melanoidin’s formed as a result of Maillard reactions occurring during the roasting process [2]. Similar findings were reported by Martuscelli et al. [29] in CSS-added chicken burgers. Thangavelu et al. [30] also observed decreased L*, a*, and b* values with increasing levels of CSS in Irish sausages. The cooking process also affected the color properties of chicken patties (p < 0.01), with an increase in L* and b* values and a decrease in a* value after cooking. The interaction between the treatment and production stages showed that the control sample had the highest L* value before and after cooking. After cooking, all samples exhibited an increase in L* values, with the control sample showing the highest increase. The a* value decreased in the control, SS1, and SS2 groups whereas increased in the SS3 group after cooking. The b* values increased in all samples after cooking, with the highest increase observed in the SS3 group, followed by the SS2, SS1, and control groups. The main conclusion about the color change is that the addition of CSS at increasing rates darkens the color of the meatballs and reduces redness and yellowness. This change may be undesirable in chicken meatballs, but when the results of the color values in the sensory analysis were examined, it was observed that the difference between the 2% CSS added sample and the control sample was not statistically significant (p > 0.05). This result shows that meatballs with 2% CSS added are acceptable to the consumer in terms of color.

3.2. Textural Properties

TPA results of cooked chicken patties are presented in Table 3.
The hardness value was higher in the samples containing CSS compared to the control; however, there was no statistically significant difference between the SS1 and SS2 groups, while the SS3 group had the highest average value. This is probably due to the decreasing fat and moisture content in samples where animal fat was replaced with CSS. In addition, the high dietary fiber content of CSS may have also contributed to the increase in [37]. Using CSS as a substitute for animal fat in chicken patties production increased the hardness value, consistent with findings in cakes where CSS replaced fat [8] and other studies substituting animal fat with fiber-containing substances in meat products [46,47,48]. On the other hand, the adhesiveness value of chicken patties was not significantly affected by the addition of CSS (p > 0.05). Regarding resilience, the control sample had the highest value, and as the proportion of CSS increased, the resilience value decreased (p < 0.05). Similar observations were made in studies where fiber-containing substances reduced resilience in chicken meat products [37,49,50]. The cohesiveness value showed no statistically significant difference between the control sample and SS1, but it decreased as the proportion of CSS increased (p < 0.05). Studies have consistently reported decreased cohesiveness with adding fiber-containing substances in various meat products [37,47,48,50]. Furthermore, the addition of fiber from angelica keiskei koidz to chicken patties [36], CSS to cake formulations [8], and oat fiber to chicken nuggets [49] reduced cohesiveness compared to control groups, without statistical differences based on usage rates. There was a statistically significant difference in springiness between samples with CSS and the control (p < 0.05), but no significant difference among samples with different proportions of CSS (p > 0.05). Similar results were also found in cakes with CSS addition [8].

3.3. Sensory Evaluation

Sensory evaluation results for chicken patties are presented in Table 4.
Substituting animal fat with CSS significantly affected all sensory parameters (p < 0.01). While there were no significant differences in odor, color, and texture between the control and SS1 groups (p > 0.05), the SS2 and SS3 groups had lower mean sensory scores for these parameters (p < 0.05). This indicates that CSS in amounts exceeding 2% negatively affected odor, color, and texture. Taste also significantly decreased with higher proportions of CSS (p < 0.05). Although the groups using CSS showed lower average values for overall acceptability compared to the control, there was no significant difference between the SS2 and SS3 groups. Similar studies replacing animal fat with dietary fiber sources in chicken meat products have reported lower average values for sensory parameters [34,41,48,50].

4. Conclusions

Substituting animal fat with CSS in chicken patty production significantly affects physicochemical, textural, and sensory properties. These findings offer a potential approach for replacing animal fat in the meat industry to meet the demand for healthier products. The study suggests that substituting animal fat with CSS at a 2% level is feasible in chicken patty production. However, new formulations should consider product quality and consumer preference for higher levels of CSS usage. Further research is needed to investigate the changes that occur during the storage of low-fat chicken patties produced with CSS.

Funding

This work was supported by the Scientific Research Projects Coordination Unit of Ardahan University with the project number: 2022-013.

Institutional Review Board Statement

This study was approved by the Scientific Publication and Ethics Committee of Ardahan University, approval code CPCDM3D and date 13 July 2023.

Informed Consent Statement

Not applicable.

Data Availability Statement

The original contributions presented in this study are included in the article; further inquiries can be directed to the corresponding authors.

Acknowledgments

I would like to thank the Atatürk University Food Analysis Laboratories Coordination Unit. The author acknowledges the Miko Gıda (Antalya, Turkey) and Gönen Kuru Kahve (Izmir, Turkey) companies for providing the coffee silverskin sample for this study.

Conflicts of Interest

The author declares no conflict of interest.

References

  1. International Coffee Organization (ICO). Coffee Report and Outlook; December 2023. Available online: https://icocoffee.org/documents/cy2023-24/Coffee_Report_and_Outlook_December_2023_ICO.pdf (accessed on 17 January 2024).
  2. Martuscelli, M.; Esposito, L.; Di Mattia, C.D.; Ricci, A.; Mastrocola, D. Characterization of Coffee Silver Skin as Potential Food-Safe Ingredient. Foods 2021, 10, 1367. [Google Scholar] [CrossRef]
  3. Alves, R.C.; Rodrigues, F.; Nunes, M.A.; Vinha, A.F.; Oliveira, M.B.P.P. State of the art in coffee processing by-products. In Handbook of Coffee Processing By-Products; Academic Press: Cambridge, MA, USA, 2017; pp. 1–26. [Google Scholar]
  4. Farah, A.; Santos, T.F.D. The Coffee Plant and Beans: An Introduction. In Coffee in Health and Disease Prevention; Preedy, V.R., Ed.; Academic Press: London, UK, 2015; pp. 5–10. [Google Scholar] [CrossRef]
  5. Saenger, M.; Hartge, E.-U.; Werther, J.; Ogada, T.; Siagi, Z. Combustion of coffee husks. Renew. Energy 2001, 23, 103–121. [Google Scholar] [CrossRef]
  6. Narita, Y.; Inouye, K. Review on utilization and composition of coffee silverskin. Food Res. Int. 2014, 61, 16–22. [Google Scholar] [CrossRef]
  7. Bessada, S.; Alves, R.C.; Oliveira, M.B.P.P. Coffee Silverskin: A Review on Potential Cosmetic Applications. Cosmetics 2018, 5, 5. [Google Scholar] [CrossRef]
  8. Ateş, G.; Elmacı, Y. Coffee silverskin as fat replacer in cake formulations and its effect on physical, chemical and sensory attributes of cakes. Lebensm. Wiss. Technol./Food Sci. Technol. 2018, 90, 519–525. [Google Scholar] [CrossRef]
  9. Iriondo-DeHond, A.; Iriondo-DeHond, M.; Del Castillo, M.D. Applications of Compounds from Coffee Processing By-Products. Biomolecules 2020, 10, 1219. [Google Scholar] [CrossRef]
  10. Arya, S.S.; Venkatram, R.; More, P.R.; Vijayan, P. The wastes of coffee bean processing for utilization in food: A review. J. Food Sci. Technol. 2021, 59, 429–444. [Google Scholar] [CrossRef]
  11. Nzekoue, F.K.; Borsetta, G.; Navarini, L.; Abouelenein, D.; Xiao, J.; Sagratini, G.; Vittori, S.; Caprioli, G.; Angeloni, S. Coffee silverskin: Characterization of B-vitamins, macronutrients, minerals and phytosterols. Food Chem. 2022, 372, 131188. [Google Scholar] [CrossRef] [PubMed]
  12. Borrelli, R.C.; Esposito, F.; Napolitano, A.; Ritieni, A.; Fogliano, V. Characterization of a New Potential Functional Ingredient: Coffee Silverskin. J. Agric. Food Chem. 2004, 52, 1338–1343. [Google Scholar] [CrossRef] [PubMed]
  13. Napolitano, A.; Fogliano, V.; Tafuri, A.; Ritieni, A. Natural Occurrence of Ochratoxin A and Antioxidant Activities of Green and Roasted Coffees and Corresponding Byproducts. J. Agric. Food Chem. 2007, 55, 10499–10504. [Google Scholar] [CrossRef] [PubMed]
  14. Pourfarzad, A.; Mahdavian-Mehr, H.; Sedaghat, N. Coffee silverskin as a source of dietary fiber in bread-making: Optimization of chemical treatment using response surface methodology. Lebensm. Wiss. Technol./Food Sci. Technol. 2013, 50, 599–606. [Google Scholar] [CrossRef]
  15. Dauber, C.; Romero, M.; Chaparro, C.; Ureta, C.; Ferrari, C.; Lans, R.; Frugoni, L.; Echeverry, M.V.; Calvo, B.S.; Trostchansky, A.; et al. Cookies enriched with coffee silverskin powder and coffee silverskin ultrasound extract to enhance fiber content and antioxidant properties. Appl. Food Res. 2024, 4, 100373. [Google Scholar] [CrossRef]
  16. Sia, C.E.S.; Yuliantara, A.; Rizkaprilisa, W.; Paramastuti, R. Potential of Dietary Fiber and Antioxidants from Coffee Skin as a Food Product in Preventing Obesity: Systematic Review. Sci. Technol. Manag. J. 2024, 4, 16–21. [Google Scholar] [CrossRef]
  17. Singh, M.; Liu, S.X.; Vaughn, S.F. Effect of corn bran as dietary fiber addition on baking and sensory quality. Biocatal. Agric. Biotechnol. 2012, 1, 348–352. [Google Scholar] [CrossRef]
  18. Longato, E.; Lucas-González, R.; Peiretti, P.G.; Meineri, G.; Pérez-Alvarez, J.A.; Viuda-Martos, M.; Fernández-López, J. The Effect of Natural Ingredients (Amaranth and Pumpkin Seeds) on the Quality Properties of Chicken Burgers. Food Bioprocess Technol. 2017, 10, 2060–2068. [Google Scholar] [CrossRef]
  19. Angeloni, S.; Scortichini, S.; Fiorini, D.; Sagratini, G.; Vittori, S.; Neiens, S.D.; Steinhaus, M.; Zheljazkov, V.D.; Maggi, F.; Caprioli, G. Characterization of Odor-Active Compounds, Polyphenols, and Fatty Acids in Coffee Silverskin. Molecules 2020, 25, 2993. [Google Scholar] [CrossRef] [PubMed]
  20. Kim, J.H.; Lee, H.J.; Lim, E.-J.; Imm, J.-Y.; Suh, H.J. Physical and sensory characteristics of fibre-enriched sponge cakes made with Opuntia humifusa. Lebensm. Wiss. Technol./Food Sci. Technol. 2012, 47, 478–484. [Google Scholar] [CrossRef]
  21. Cantele, C.; Tedesco, M.; Ghirardello, D.; Zeppa, G.; Bertolino, M. Coffee Silverskin as a Functional Ingredient in Vegan Biscuits: Physicochemical and Sensory Properties and In Vitro Bioaccessibility of Bioactive Compounds. Foods 2022, 11, 717. [Google Scholar] [CrossRef] [PubMed]
  22. Peng, X.; Yao, Y. Carbohydrates as Fat Replacers. Annu. Rev. Food Sci. Technol. 2017, 8, 331–351. [Google Scholar] [CrossRef]
  23. Montoya, L.; Quintero, N.; Ortiz, S.; Lopera, J.; Millán, P.; Rodríguez-Stouvenel, A. Inulin as a Fat-Reduction Ingredient in Pork and Chicken Meatballs: Its Effects on Physicochemical Characteristics and Consumer Perceptions. Foods 2022, 11, 1066. [Google Scholar] [CrossRef]
  24. Esquivel, P.; Jiménez, V.M. Functional properties of coffee and coffee by-products. Food Res. Int. 2012, 46, 488–495. [Google Scholar] [CrossRef]
  25. Gemechu, F.G. Embracing nutritional qualities, biological activities and technological properties of coffee byproducts in functional food formulation. Trends Food Sci. Technol. 2020, 104, 235–261. [Google Scholar] [CrossRef]
  26. Gocmen, D.; Sahan, Y.; Yildiz, E.; Coskun, M.; Aroufai, I.A. Use of coffee silverskin to improve the functional properties of cookies. J. Food Sci. Technol. 2019, 56, 2979–2988. [Google Scholar] [CrossRef] [PubMed]
  27. Bertolino, M.; Barbosa-Pereira, L.; Ghirardello, D.; Botta, C.; Rolle, L.; Guglielmetti, A.; Borotto Dalla Vecchia, S.; Zeppa, G. Coffee silverskin as nutraceutical ingredient in yogurt: Its effect on functional properties and its bioaccessibility. J. Sci. Food Agric. 2019, 99, 4267–4275. [Google Scholar] [CrossRef] [PubMed]
  28. Garcia-Serna, E.; Martinez-Saez, N.; Mesias, M.; Morales, F.; del Castillo, M. Use of Coffee Silverskin and Stevia to Improve the Formulation of Biscuits. Pol. J. Food Nutr. Sci. 2014, 64, 243–251. [Google Scholar] [CrossRef]
  29. Martuscelli, M.; Esposito, L.; Mastrocola, D. The Role of Coffee Silver Skin against Oxidative Phenomena in Newly Formulated Chicken Meat Burgers after Cooking. Foods 2021, 10, 1833. [Google Scholar] [CrossRef] [PubMed]
  30. Thangavelu, K.P.; Tiwari, B.; Kerry, J.P.; McDonnell, C.K.; Álvarez, C. Phosphate replacing potential of apple pomace and coffee silver skin in Irish breakfast sausage using a mixture design approach. Meat Sci. 2022, 185, 108722. [Google Scholar] [CrossRef] [PubMed]
  31. Coşkun, M. Bisküvide Yağ Ikamesi Olarak Kahve Çekirdeği Zarı Kullanımı. Available online: http://hdl.handle.net/11452/14887 (accessed on 12 July 2024).
  32. AOAC International. Official Methods of Analysis of AOAC International, 18th ed.; AOAC International: Rockville, MD, USA, 2005; Available online: https://www.researchgate.net/publication/292783651_AOAC_2005 (accessed on 17 January 2024).
  33. Lemon, D.W. An Improved TBA Test for Rancidity; Halifax Fisheries and Marine Service: Ottawa, ON, Canada, 1975. [Google Scholar]
  34. Choi, Y.-S.; Sung, J.-M.; Park, J.-D.; Hwang, K.-E.; Lee, C.-W.; Kim, T.-K.; Jeon, K.-H.; Kim, C.-J.; Kim, Y.-B. Quality and Sensory Characteristics of Reduced-fat Chicken Patties with Pork Back Fat Replaced by Dietary Fiber from Wheat Sprout. Korean J. Food Sci. Anim. Resour. 2016, 36, 799–806. [Google Scholar] [CrossRef] [PubMed]
  35. Guedes-Oliveira, J.M.; Salgado, R.L.; Costa-Lima, B.R.; Conte-Junior, C.A. Washed cashew apple fiber (Anacardium occidentale L.) as fat replacer in chicken patties. Lebens. Wiss. Technol./ Food Sci. Technol. 2016, 71, 268–273. [Google Scholar] [CrossRef]
  36. Choi, Y.-S.; Kim, H.-W.; Hwang, K.-E.; Song, D.-H.; Jeong, T.-J.; Kim, Y.-B.; Jeon, K.-H.; Kim, C.-J. Effect of Dietary Fiber Extracted from Algelica keiskei Koidz on the Quality Characteristics of Chicken Patties. Korean J. Food Sci. Anim. Resour. 2015, 35, 307–314. [Google Scholar] [CrossRef]
  37. Kirkyol, M.; Akköse, A. Effects of animal fat replacement with almond flour on quality parameters of beef patties. Food Sci. Nutr. 2023, 11, 7091–7099. [Google Scholar] [CrossRef]
  38. McGlynn, W. The Importance of Food pH in Commercial Canning Operations. Food Technology Fact Sheet. 2003. Available online: https://shareok.org/bitstream/handle/11244/50205/oksd_fapc_118_2010-07.pdf?sequence=1 (accessed on 17 January 2024).
  39. Botella-Martinez, C.; Lucas-González, R.; Lorenzo, J.M.; Santos, E.M.; Rosmini, M.; Sepúlveda, N.; Teixeira, A.; Sayas-Barberá, E.; Pérez-Alvarez, J.A.; Fernandez-Lopez, J.; et al. Cocoa Coproducts-Based and Walnut Oil Gelled Emulsion as Animal Fat Replacer and Healthy Bioactive Source in Beef Burgers. Foods 2021, 10, 2706. [Google Scholar] [CrossRef]
  40. Murthy, P.S.; Naidu, M.M. Sustainable management of coffee industry by-products and value addition—A review. Resour. Conserv. Recycl. 2012, 66, 45–58. [Google Scholar] [CrossRef]
  41. Kılınççeker, O.; Kurt, S. Effects of inulin, carrot and cellulose fibres on the properties of raw and fried chicken meatballs. S. Afr. J. Anim. Sci. 2018, 48, 39. [Google Scholar] [CrossRef]
  42. Costa, A.S.; Alves, R.C.; Vinha, A.F.; Costa, E.; Costa, C.S.; Nunes, M.A.; Almeida, A.A.; Santos-Silva, A.; Oliveira, M.B.P. Nutritional, chemical and antioxidant/pro-oxidant profiles of silverskin, a coffee roasting by-product. Food Chem. 2018, 267, 28–35. [Google Scholar] [CrossRef]
  43. Wood, J.D.; Richardson, R.I.; Nute, G.R.; Fisher, A.V.; Campo, M.M.; Kasapidou, E.; Sheard, P.R.; Enser, M. Effects of fatty acids on meat quality: A review. Meat Sci. 2004, 66, 21–32. [Google Scholar] [CrossRef] [PubMed]
  44. Campo, M.M.; Nute, G.R.; Hughes, S.I.; Enser, M.; Wood, J.D.; Richardson, R.I. Flavour perception of oxidation in beef. Meat Sci. 2006, 72, 303–311. [Google Scholar] [CrossRef] [PubMed]
  45. Fraqueza, M.J.; Barreto, A.S. The effect on turkey meat shelf life of modified-atmosphere packaging with an argon mixture. Poult. Sci. 2009, 88, 1991–1998. [Google Scholar] [CrossRef] [PubMed]
  46. Choi, M.-S.; Choi, Y.-S.; Kim, H.-W.; Hwang, K.-E.; Song, D.-H.; Lee, S.-Y.; Kim, C.-J. Effects of Replacing Pork Back Fat with Brewer’s Spent Grain Dietary Fiber on Quality Characteristics of Reduced-fat Chicken Sausages. Korean J. Food Sci. Anim. Resour. 2014, 34, 158–165. [Google Scholar] [CrossRef]
  47. Pintado, T.; Herrero, A.; Jiménez-Colmenero, F.; Ruiz-Capillas, C. Strategies for incorporation of chia (Salvia hispanica L.) in frankfurters as a health-promoting ingredient. Meat Sci. 2016, 114, 75–84. [Google Scholar] [CrossRef]
  48. Barros, J.C.; Munekata, P.E.S.; Pires, M.A.; Rodrigues, I.; Andaloussi, O.S.; Rodrigues, C.E.d.C.; Trindade, M.A. Omega-3- and fibre-enriched chicken nuggets by replacement of chicken skin with chia (Salvia hispanica L.) flour. Lebens. Wiss. Technolog./Food Sci. Technol. 2018, 90, 283–289. [Google Scholar] [CrossRef]
  49. A Kalaikannan, D.S.A. The Effect of the Addition of Oat Flour in Low-Fat Chicken Nuggets. J. Nutr. Food Sci. 2014, 4, 2. [Google Scholar] [CrossRef]
  50. Ferjančič, B.; Kugler, S.; Korošec, M.; Polak, T.; Bertoncelj, J. Development of low-fat chicken bologna sausages enriched with inulin, oat fibre or psyllium. Int. J. Food Sci. Technol. 2020, 56, 1818–1828. [Google Scholar] [CrossRef]
Figure 1. Ground and unground coffee silverskin.
Applsci 14 06442 g001
Figure 2. Cooked patty pamples physical appearance of cooked patties produced in different formulations (C: 12% animal fat, CSS1: 2% CSS+ 10% animal fat, CSS2: 4% CSS+ 8% animal fat, CSS3: 6% CSS+ 6% animal fat).
Applsci 14 06442 g002
Figure 3. Changes in pH values of chicken patties during the production stages (Control: 12% fat, SS1: 10% fat + 2% silverskin, SS2: 8% fat + 4% silverskin, SS3: 6% fat + 6% silverskin). a–c: Means marked with different letters in different formulations at the same production stage are statistically different from each other (p < 0.05).
Applsci 14 06442 g003
Figure 4. Changes in moisture contents of chicken patties during the production stages (Control: 12% fat, SS1: 10% fat + 2% silverskin, SS2: 8% fat + 4% silverskin, SS3: 6% fat + 6% silverskin). a–c: Means marked with different letters in different formulations at the same production stage are statistically different from each other (p < 0.05).
Applsci 14 06442 g004
Figure 5. Changes in color properties of chicken patties during the production stages (Control: 12% fat, SS1: 10% fat + 2% silverskin, SS2: 8% fat + 4% silverskin, SS3: 6% fat + 6% silverskin). a–d: Means marked with different letters in different formulations at the same production stage are statistically different from each other (p < 0.05). (a) L*: represents the lightness values, (b) a*: represents the redness/greenness values, and (c) b*: represents the yellowness/blueness values.
Applsci 14 06442 g005
Table 1. Physicochemical properties of chicken patties produced with coffee silverskin. 1
ControlSS1SS2 SS3Significance
pH6.10 ± 0.01 a6.02 ± 0.03 b6.01 ± 0.03 c6.01 ± 0.02 c**
Moisture content (%)62.43 ± 0.78 a61.17 ± 0.69 bc61.44 ± 0.52 b61.09 ± 0.72 c**
aw0.979 ± 0.001 a0.976 ± 0.001 b0.976 ± 0.001 b0.974 ± 0.001 c**
TBARS (μmol MDA/kg)11.75 ± 0.67 d18.48 ± 0.70 c25.91 ± 0.47 b32.92 ± 1.00 a**
Moisture retention (%)81.41 ± 1.30 b85.59 ± 1.27 a87.34 ± 0.58 a86.16 ± 0.91 a**
Color L*72.48 ± 3.16 a60.27 ± 2.10 b53.80 ± 2.29 c50.32 ± 1.80 d**
a*12.50 ± 0.52 a8.97 ± 0.27 b7.56 ± 0.17 c6.46 ± 0.20 d**
b*37.14 ± 0.65 a26.58 ± 0.91 b21.64 ± 1.31 c18.20 ± 1.52 d**
1 Presented values are means ± standard error; Control: 12% fat, SS1: 10% fat + 2% silverskin, SS2: 8% fat + 4% silverskin, SS3: 6% fat + 6% silverskin; a–d: Means marked with different letters in the same line are statistically different from each other (p < 0.05); **: p < 0.01.
Table 2. Physicochemical properties of chicken patties at the production stages.
Before CookingAfter CookingSignificance
pH5.98 ± 0.02 a6.09 ± 0.01 b**
Moisture content (%)63.73 ± 0.17 b59.34 ± 0.16 a**
aw0.978 ± 0.001 b0.974 ± 0.001 a**
TBARS (μmol MDA/kg)20.69 ± 1.70 a23.84 ± 1.70 b**
ColorL*51.69 ± 1.55 a66.74 ± 2.08 b**
a*9.31 ± 0.65 b8.43 ± 0.33 a**
b*22.74 ± 1.84 a29.04 ± 1.20 b**
a–b: Means marked with different letters in the same line are statistically different from each other (p < 0.05); **: p < 0.01.
Table 3. Texture profile parameters of chicken patties produced with coffee silverskin. 1
ControlSS1SS2SS3Significance
Hardness (N)55.08 ± 1.39 a69.85 ± 1.22 b71.10 ± 1.32 b78.21 ± 2.19 c**
Adhesiveness (mJ)0.24 ± 0.05 a0.16 ± 0.03 a0.22 ± 0.05 a0.12 ± 0.03 ans
Resilience0.13 ± 0.00 d0.12 ± 0.00 c0.10 ± 0.00 b0.09 ± 0.00 a**
Cohesiveness0.42 ± 0.01 c0.42 ± 0.00 c0.37 ± 0.01 b0.35 ± 0.01 a**
Springiness (mm)5.64 ± 0.07 b5.04 ± 0.05 a4.72 ± 0.24 a5.06 ± 0.06 a*
Chewiness (mJ)132.09 ± 4.50 a147.46 ± 3.15 b130.03 ± 3.35 a137.13 ± 4.60 a*
1 Presented values are means ± standard error; Control: 12% fat, SS1: 10% fat + 2% silverskin, SS2: 8% fat + 4% silverskin, SS3: 6% fat + 6% silverskin; a–d: Means marked with different letters in the same line are statistically different from each other (p < 0.05); **: p < 0.01; *: p < 0.05; ns: not significant.
Table 4. Sensory properties of chicken patties produced with coffee silverskin. 1
ControlSS1 SS2 SS3 Significance
Odor4.08 ± 0.17 b3.75 ± 0.14 b3.04 ± 0.11 a2.75 ± 0.15 a**
Color3.71 ± 0.22 c4.00 ± 0.15 c3.17 ± 0.17 b2.58 ± 0.20 a**
Taste4.33 ± 0.16 d3.38 ± 0.16 c2.50 ± 0.16 b2.04 ± 0.15 a**
Texture3.92 ± 0.17 b3.67 ± 0.10 b3.13 ± 0.16 a2.75 ± 0.20 a**
General Acceptability4.13 ± 0.14 c3.54 ± 0.12 b2.71 ± 0.14 a2.42 ± 0.15 a**
1 Presented values are means ± standard error; Control: 12% fat, SS1: 10% fat + 2% silverskin, SS2: 8% fat + 4% silverskin, SS3: 6% fat + 6% silverskin; a–d: Means marked with different letters in the same line are statistically different from each other (p < 0.05); **: p < 0.01.
Disclaimer/Publisher’s Note: The statements, opinions and data contained in all publications are solely those of the individual author(s) and contributor(s) and not of MDPI and/or the editor(s). MDPI and/or the editor(s) disclaim responsibility for any injury to people or property resulting from any ideas, methods, instructions or products referred to in the content.

