
Field Observation and Settlement Prediction Study of a Soft Soil Embankment under Rolling Dynamic Compaction


Abstract
1. Introduction
2. Field Test
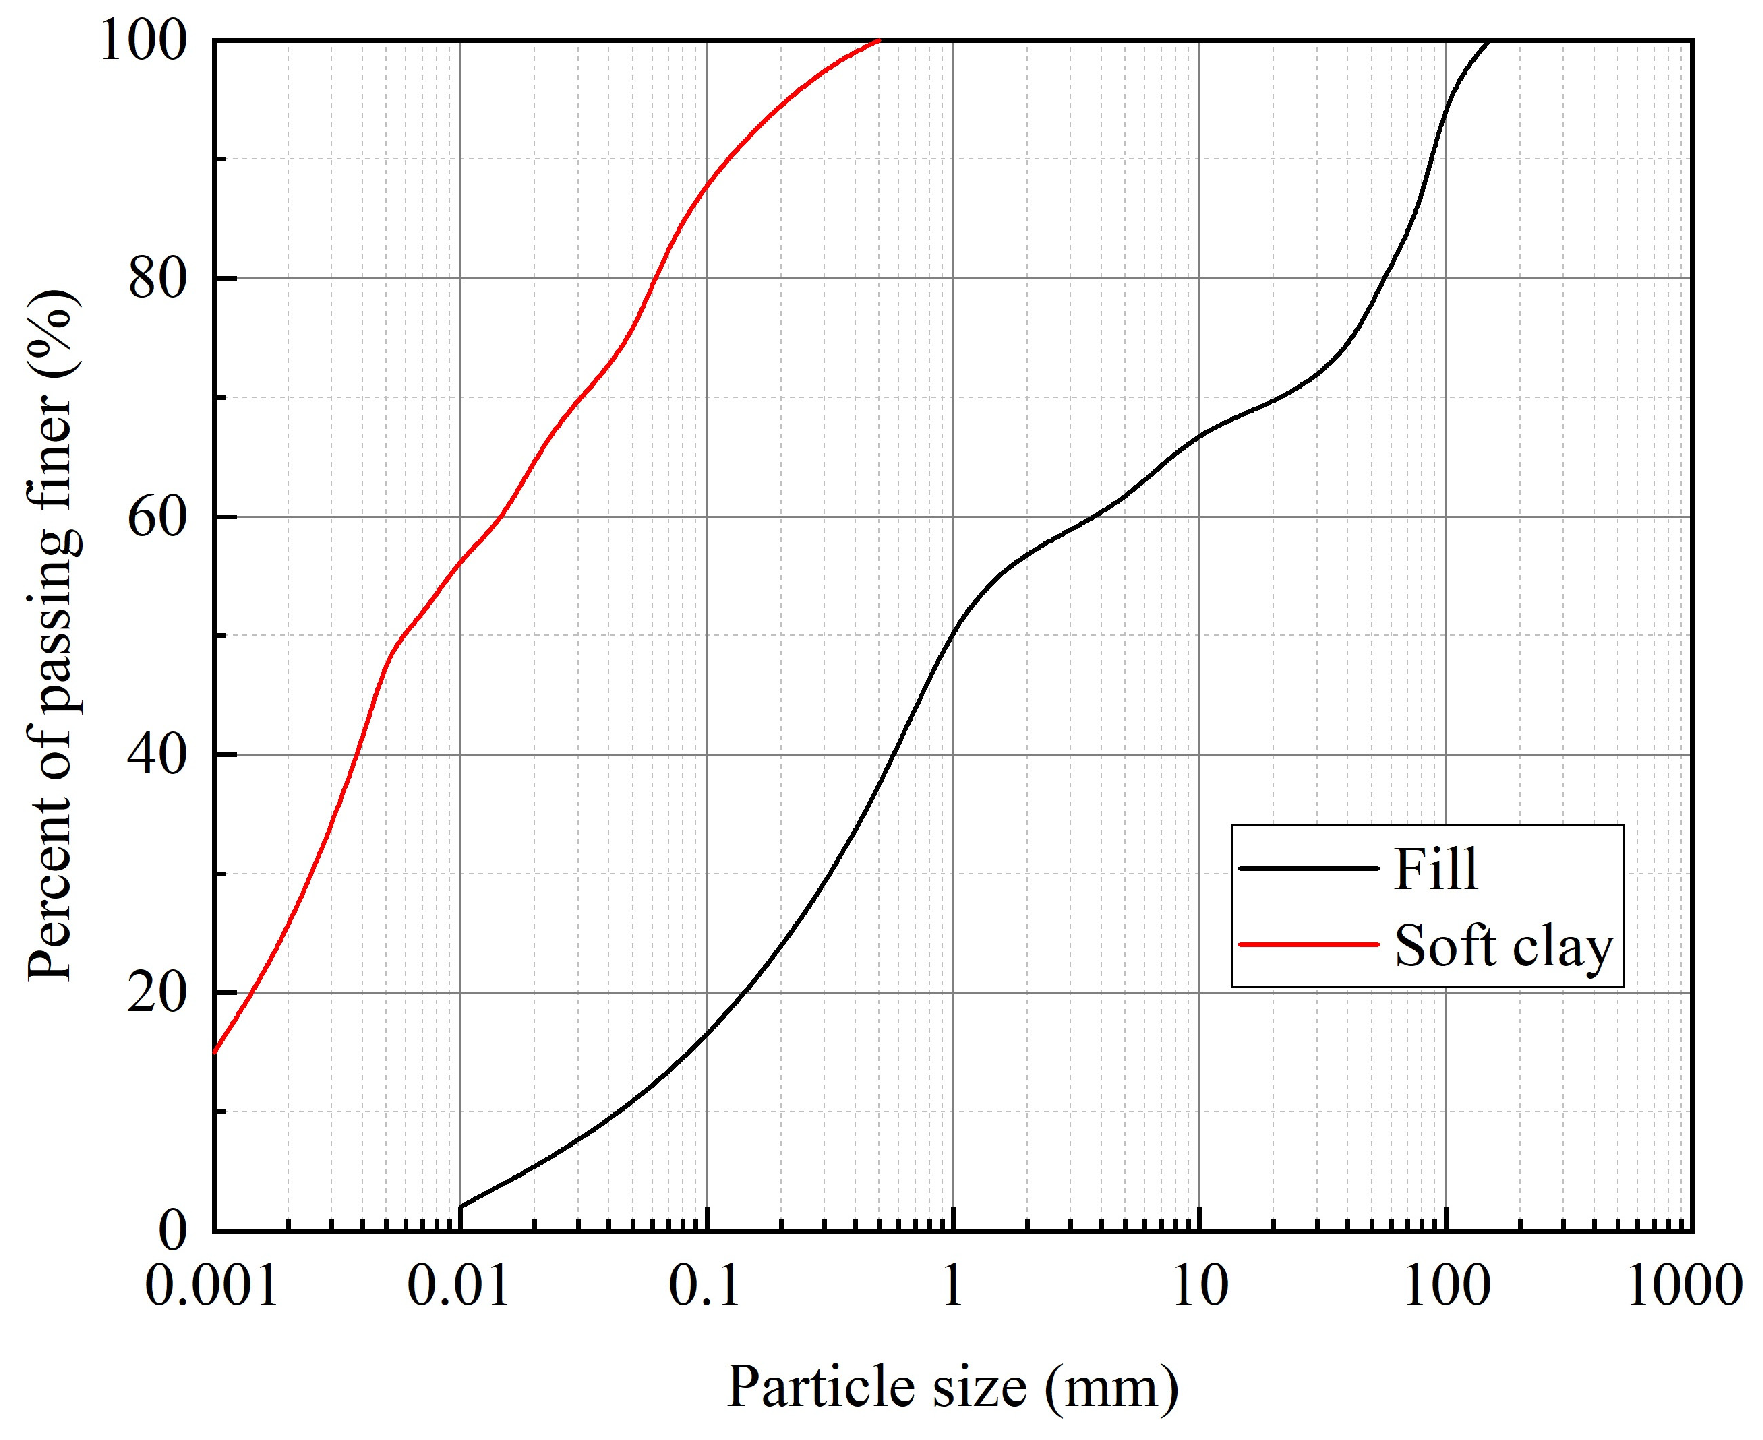
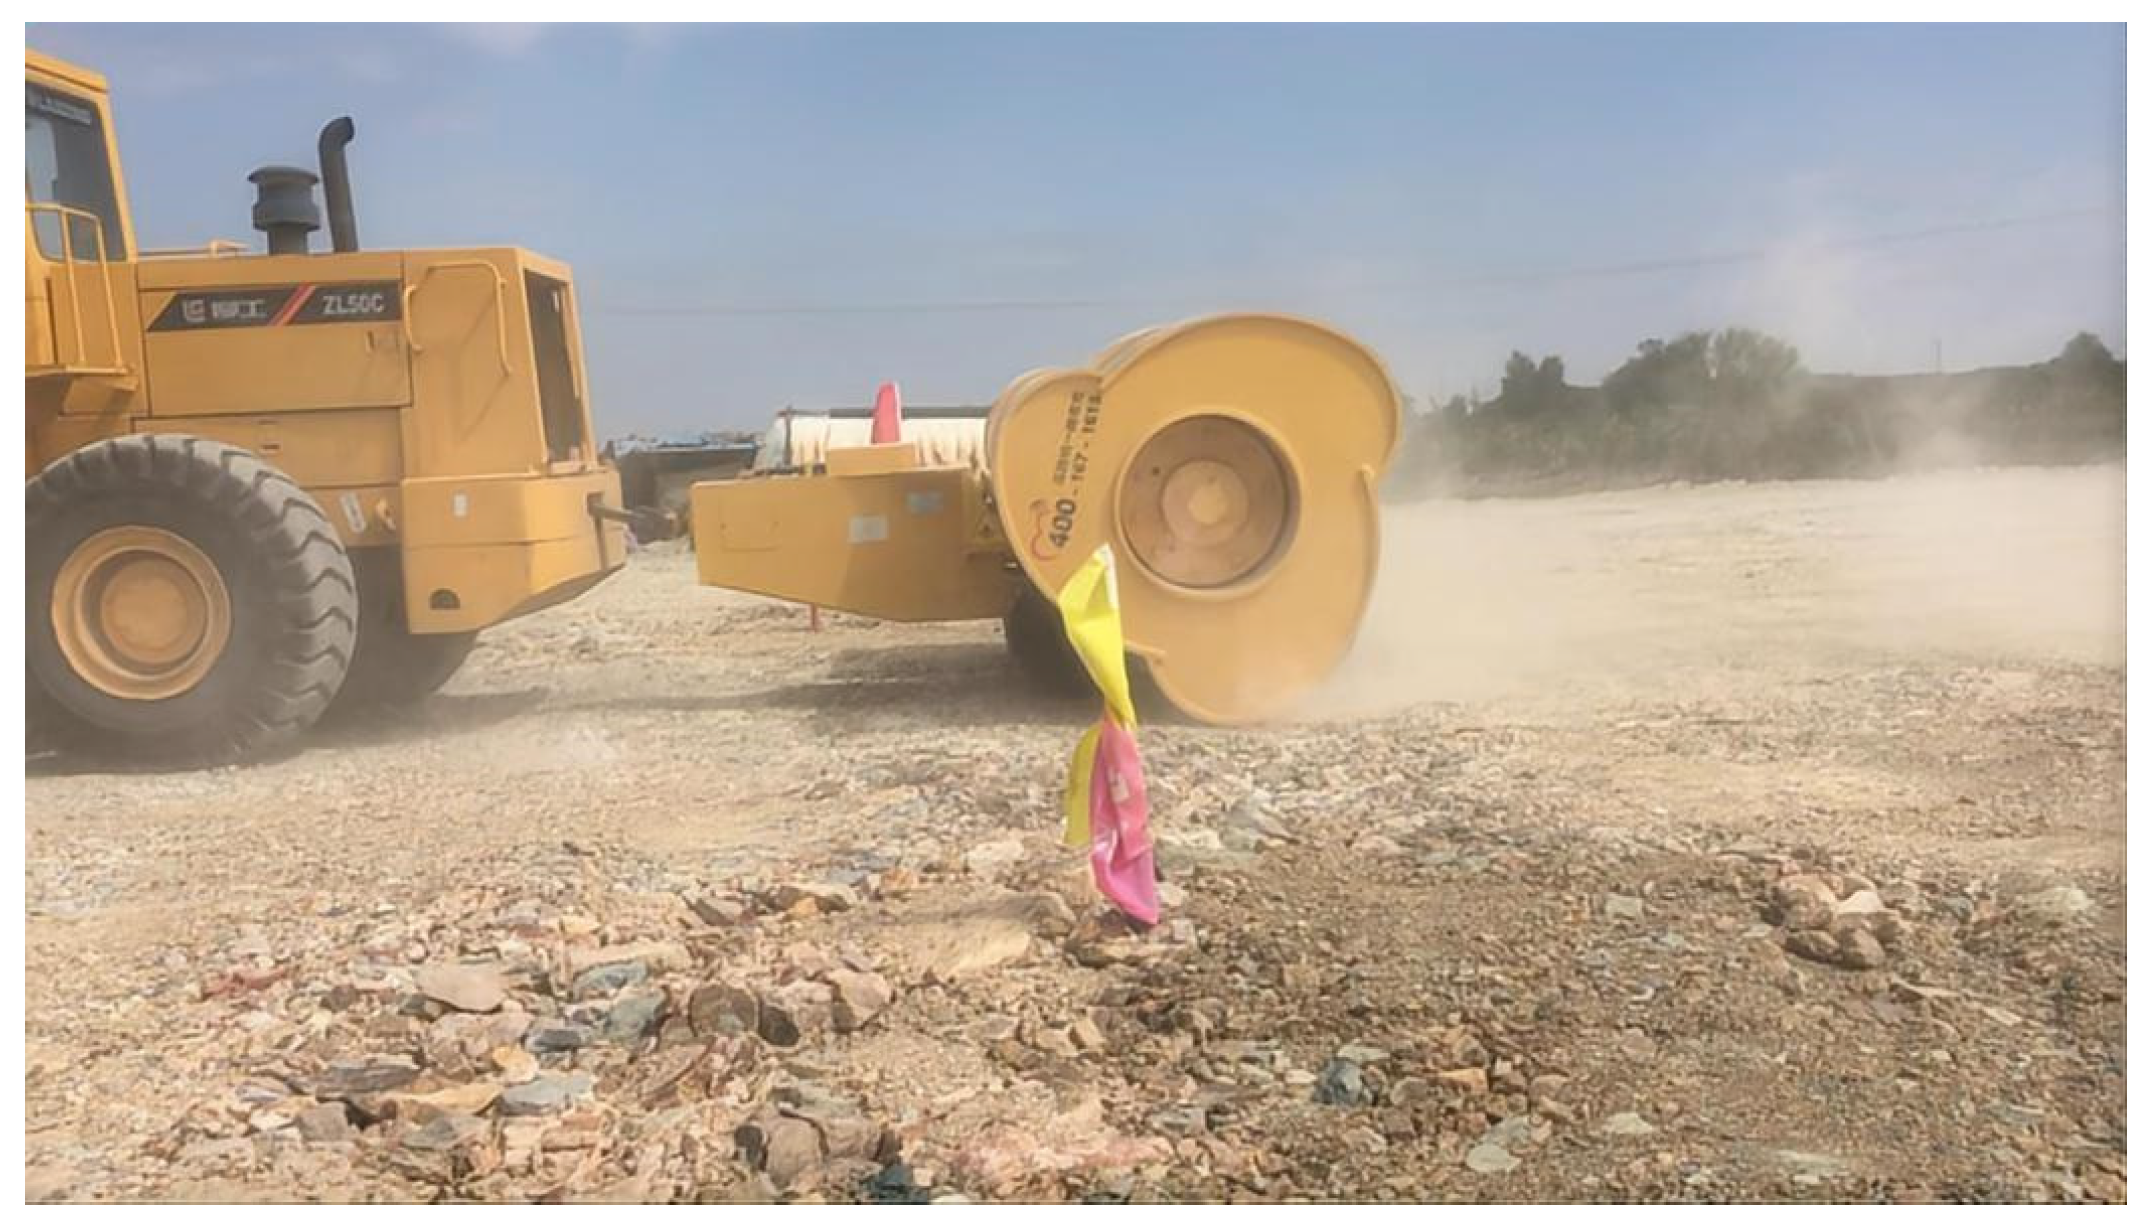
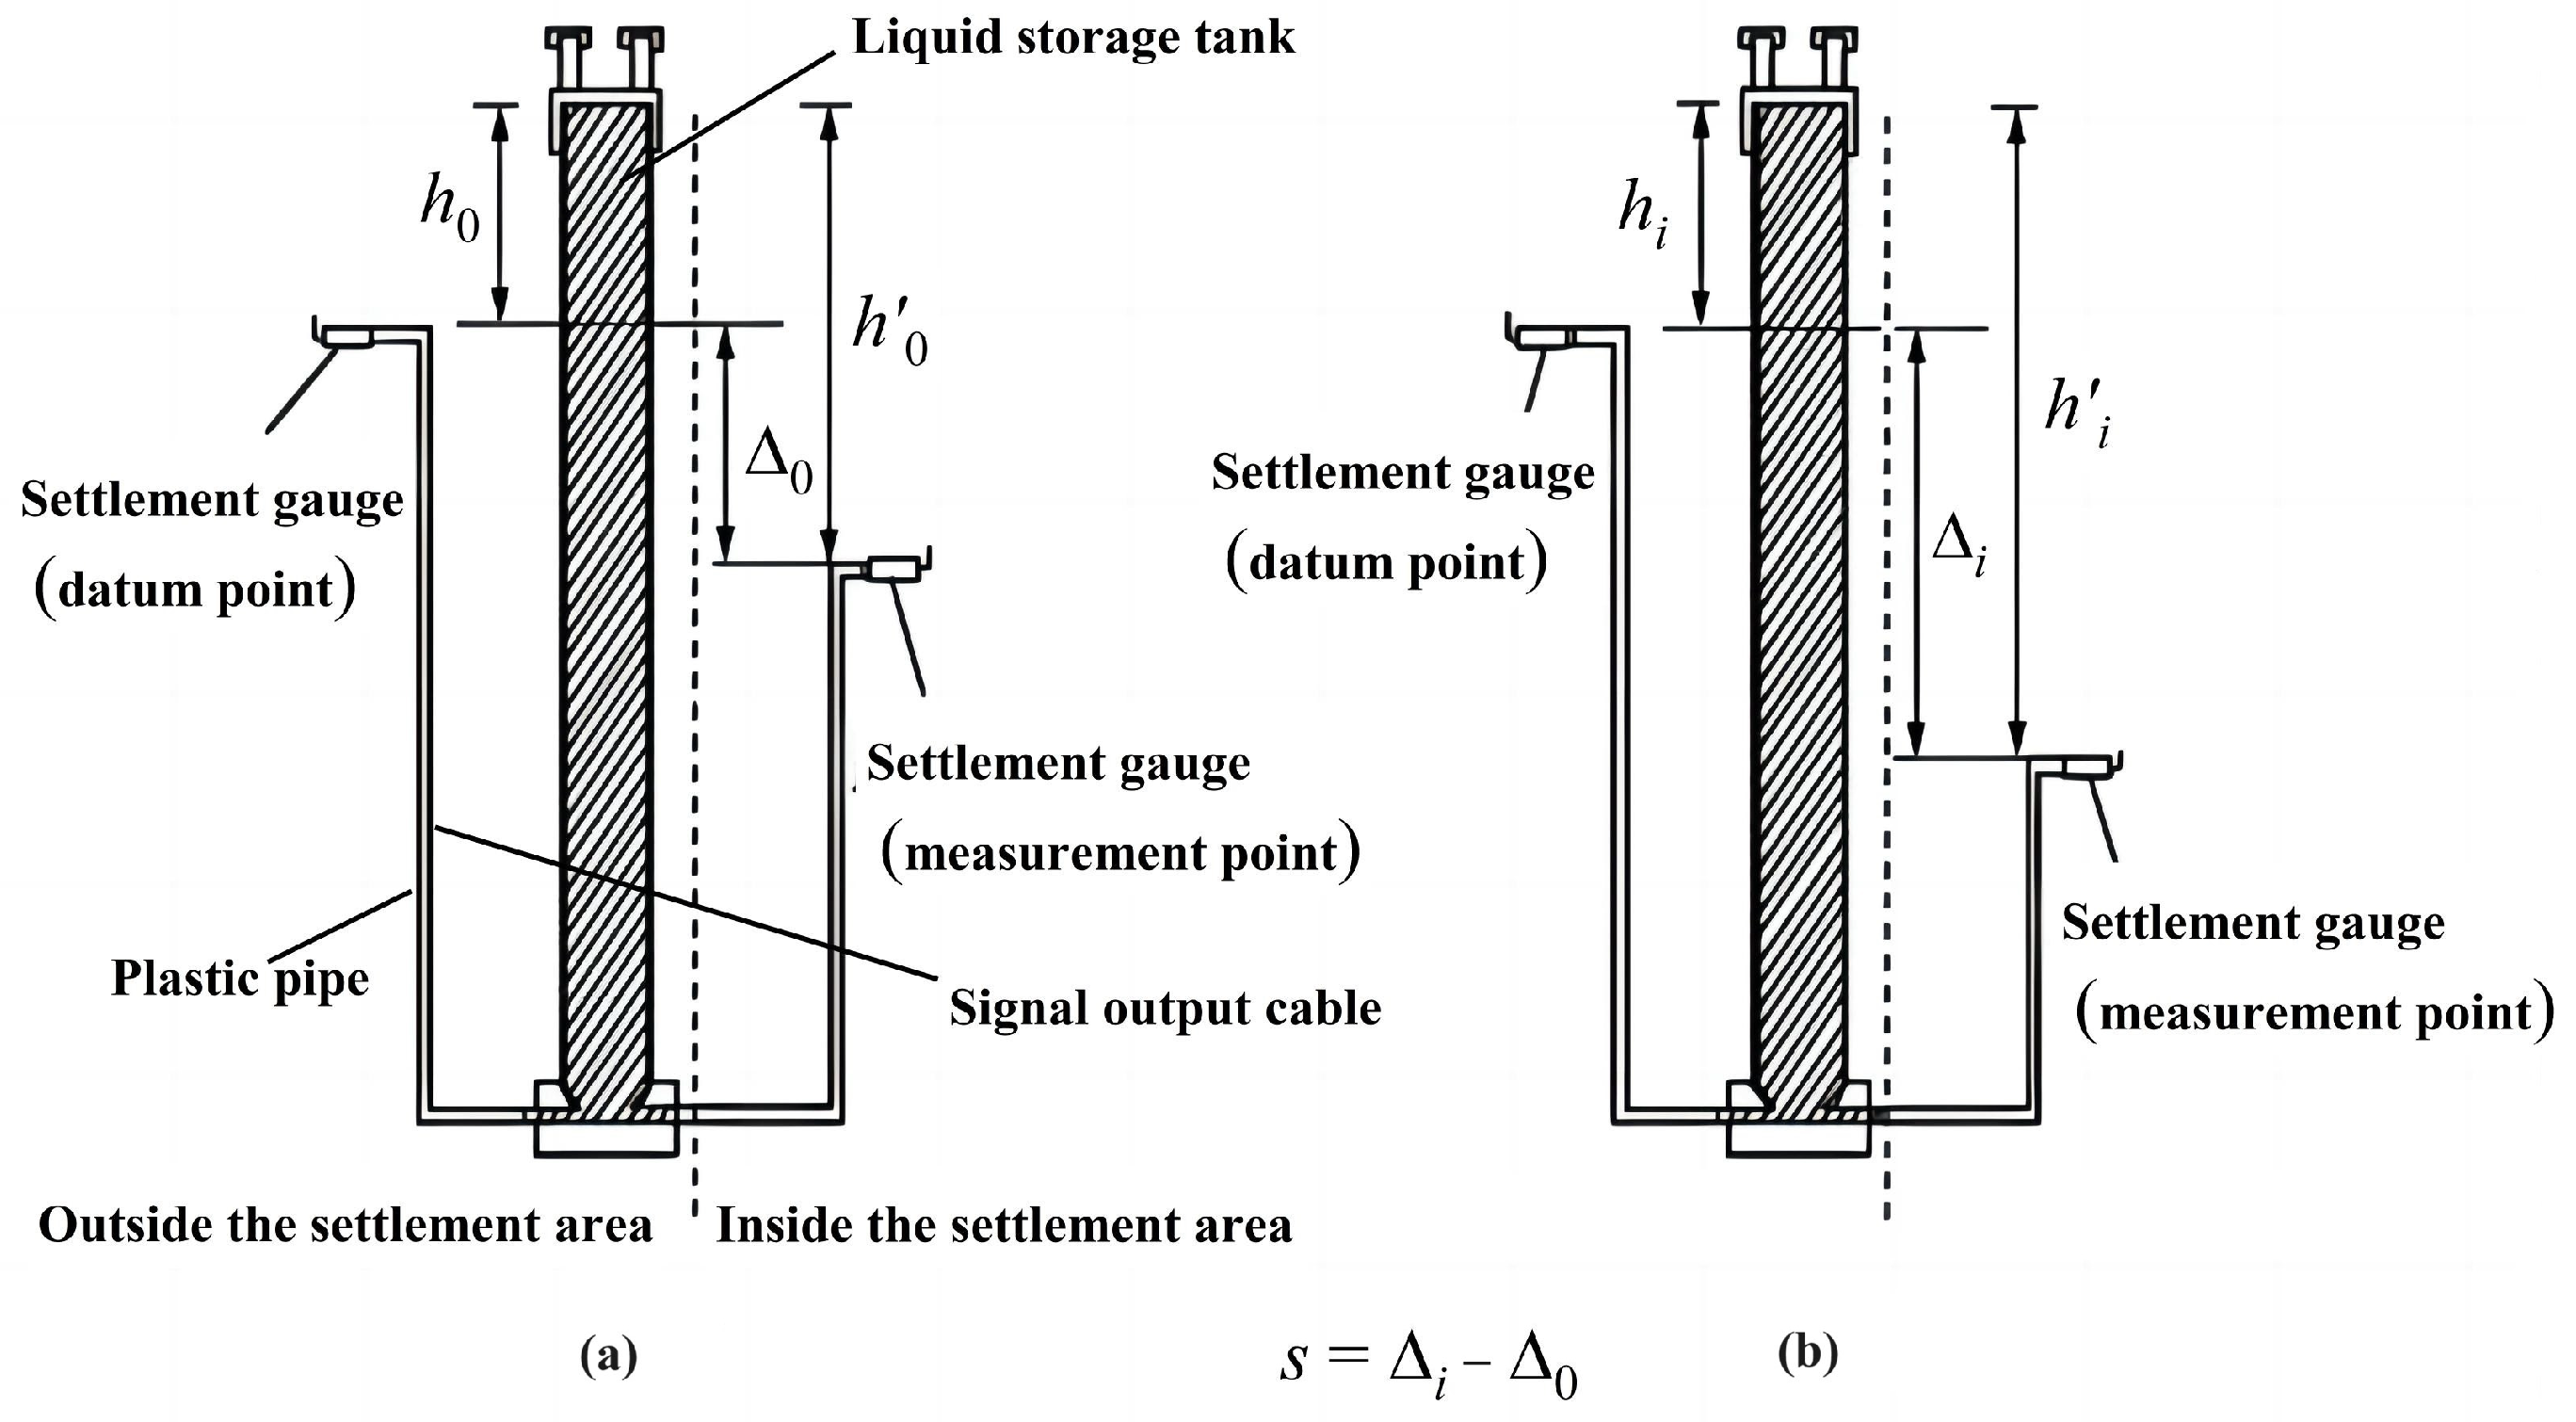
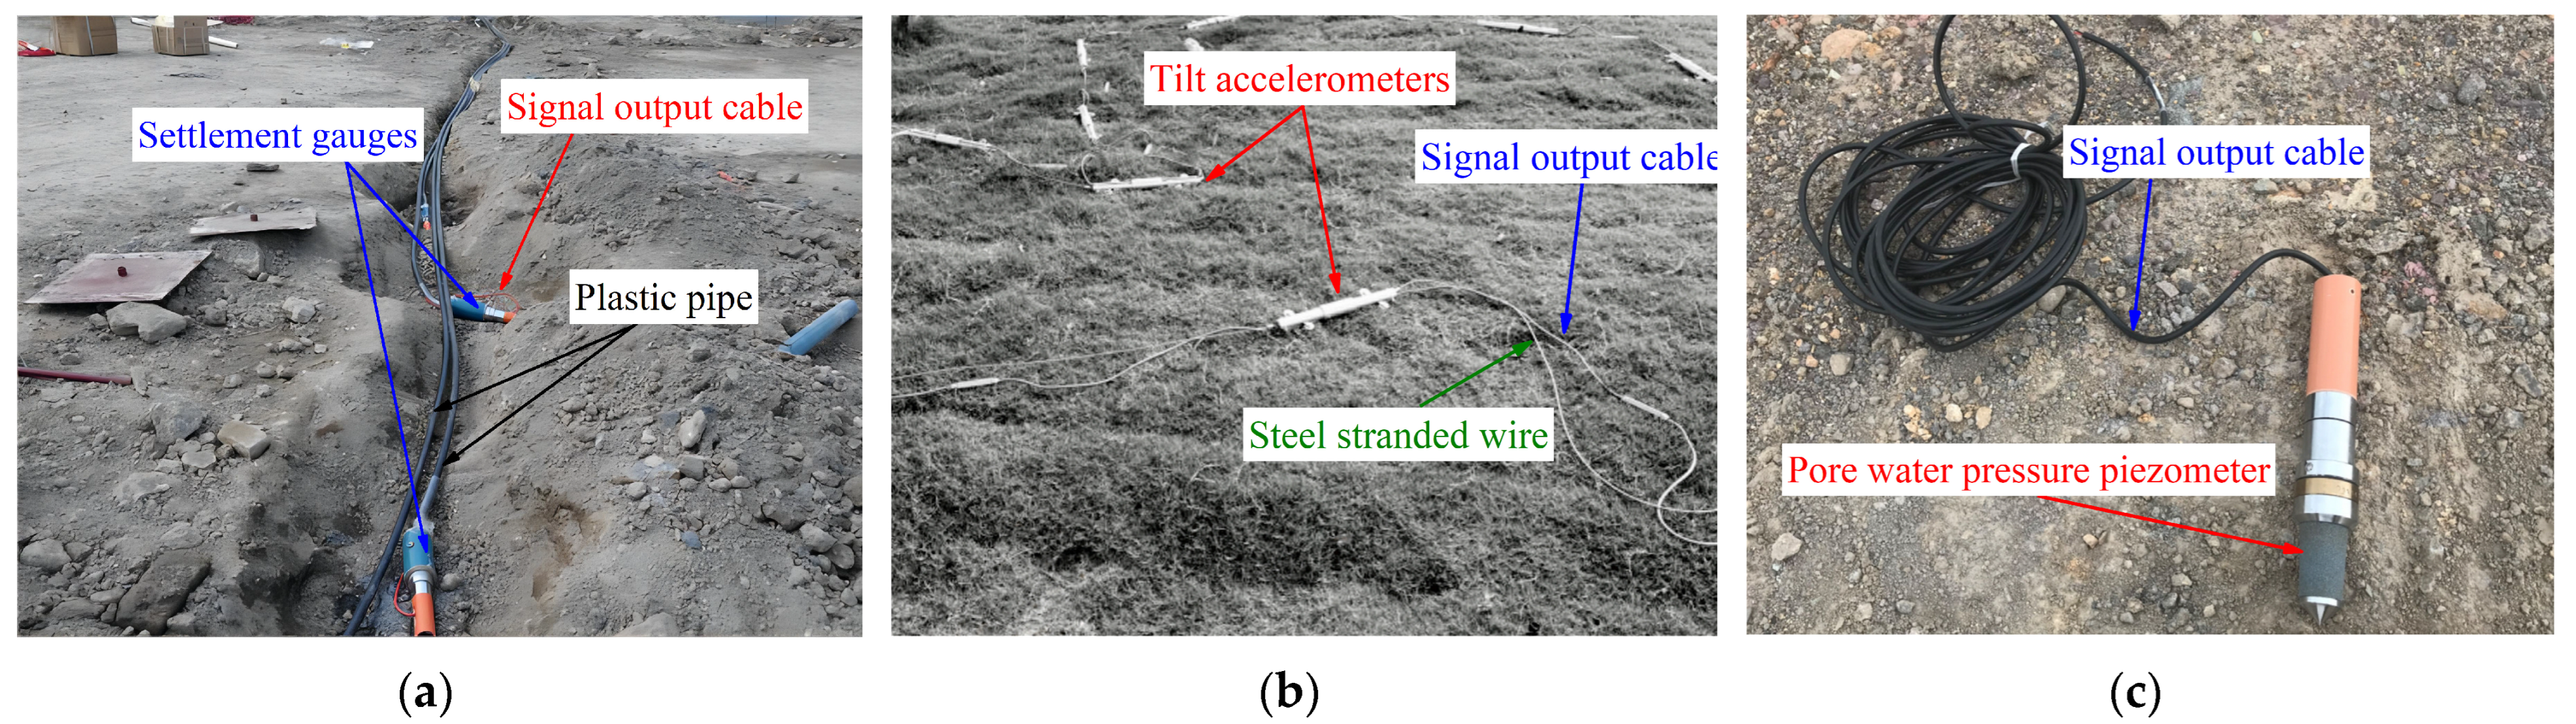
2.1. Test Setup
2.2. Monitoring Results
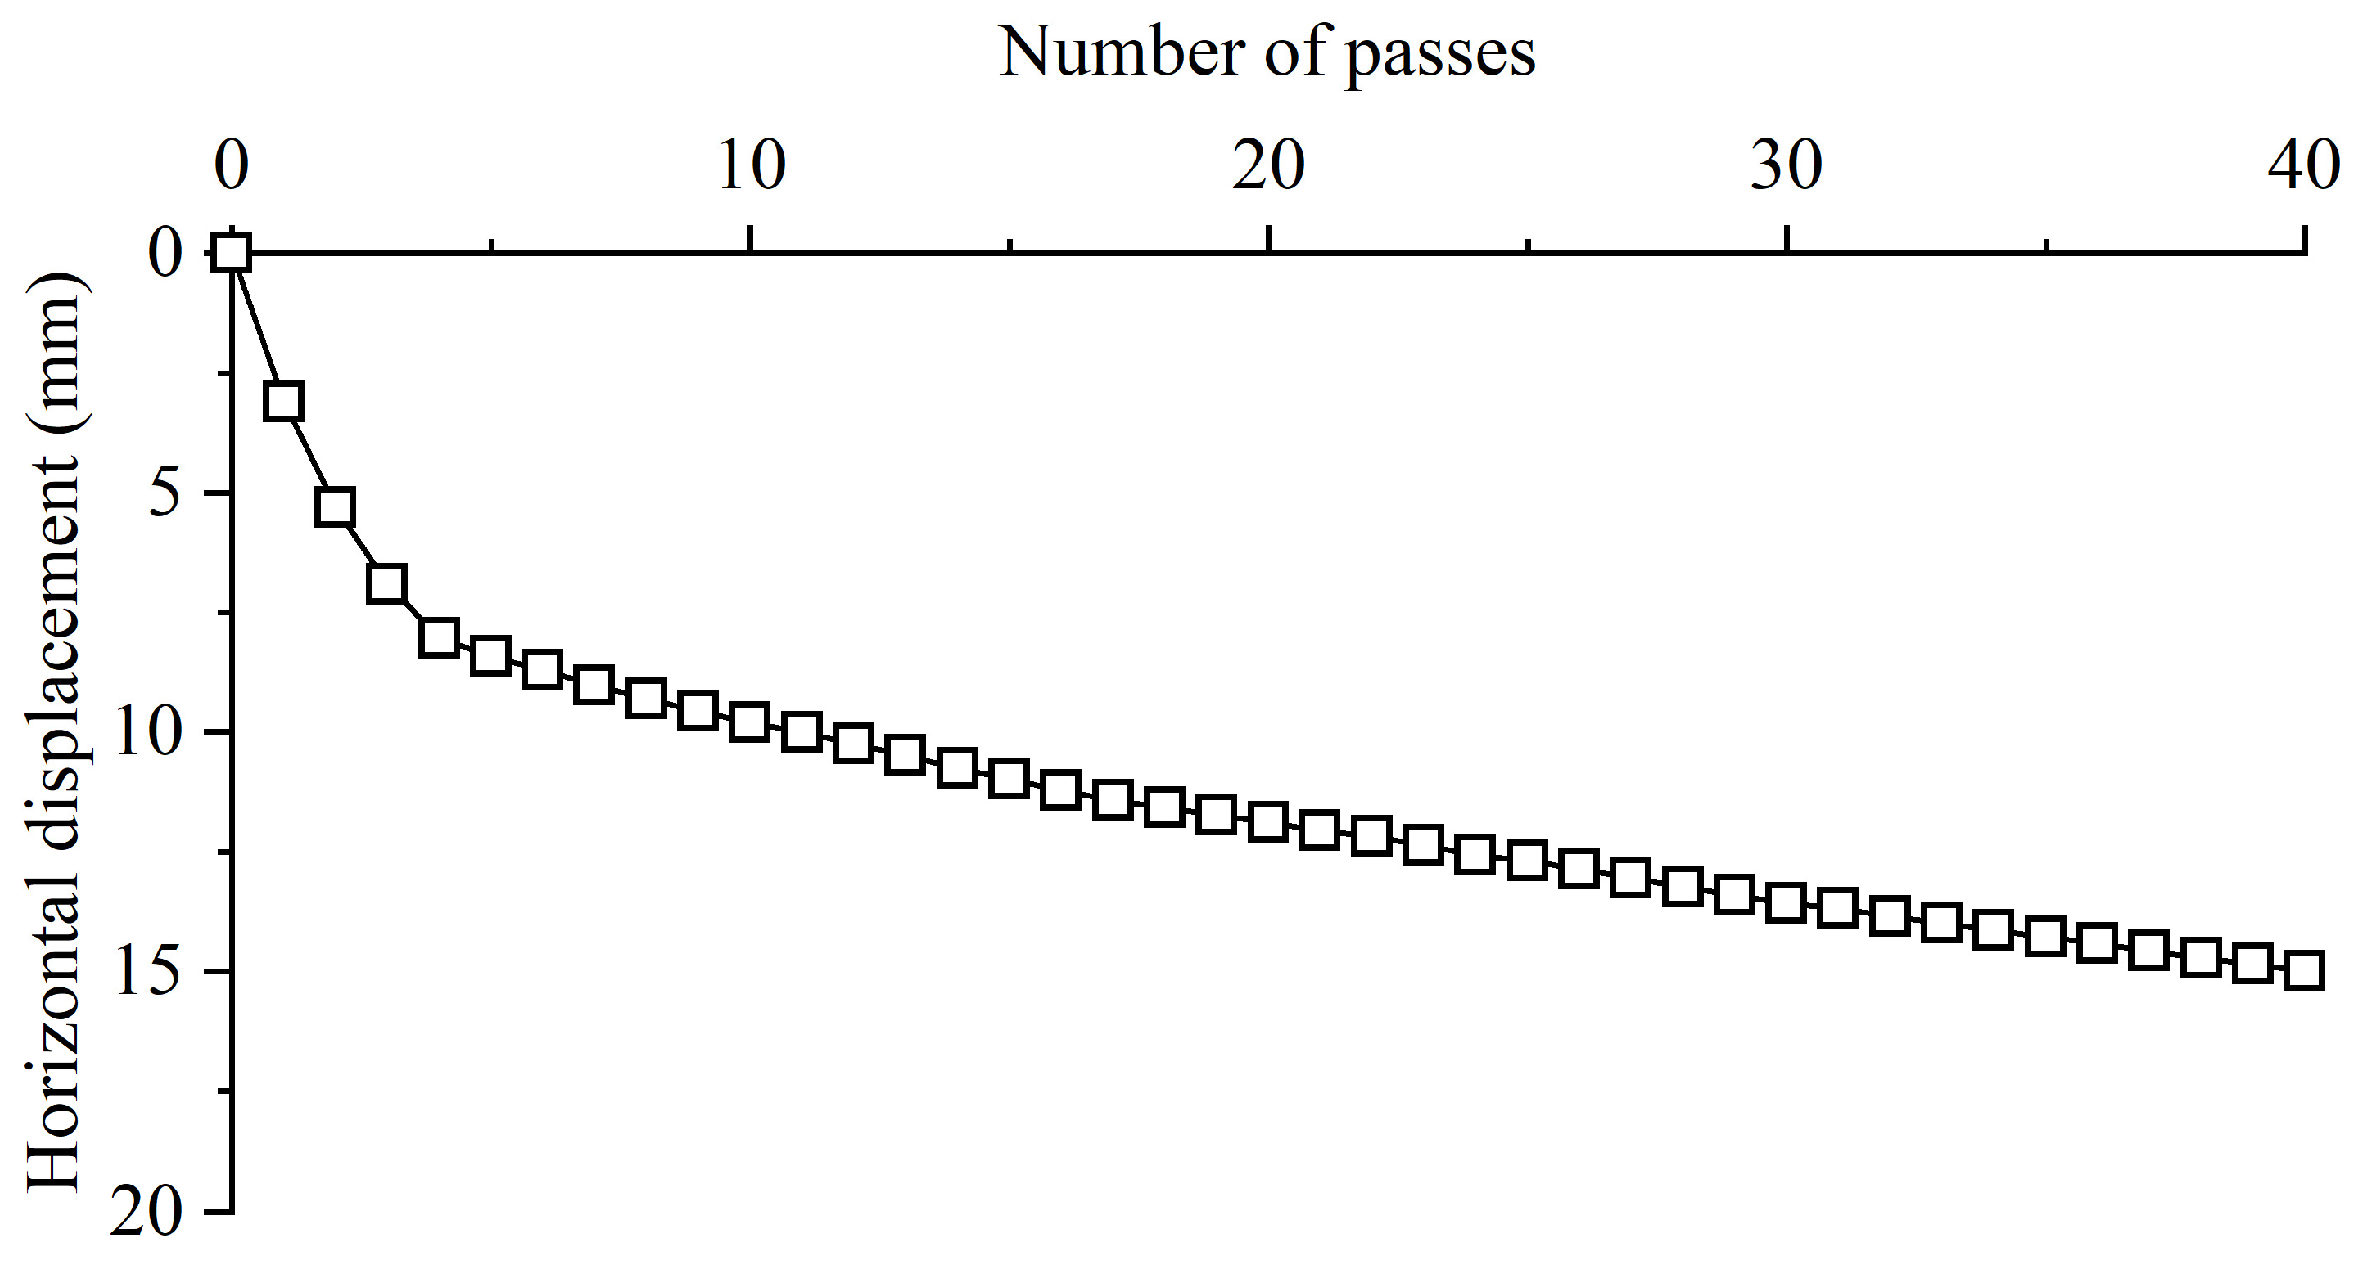
2.2.1. Settlement
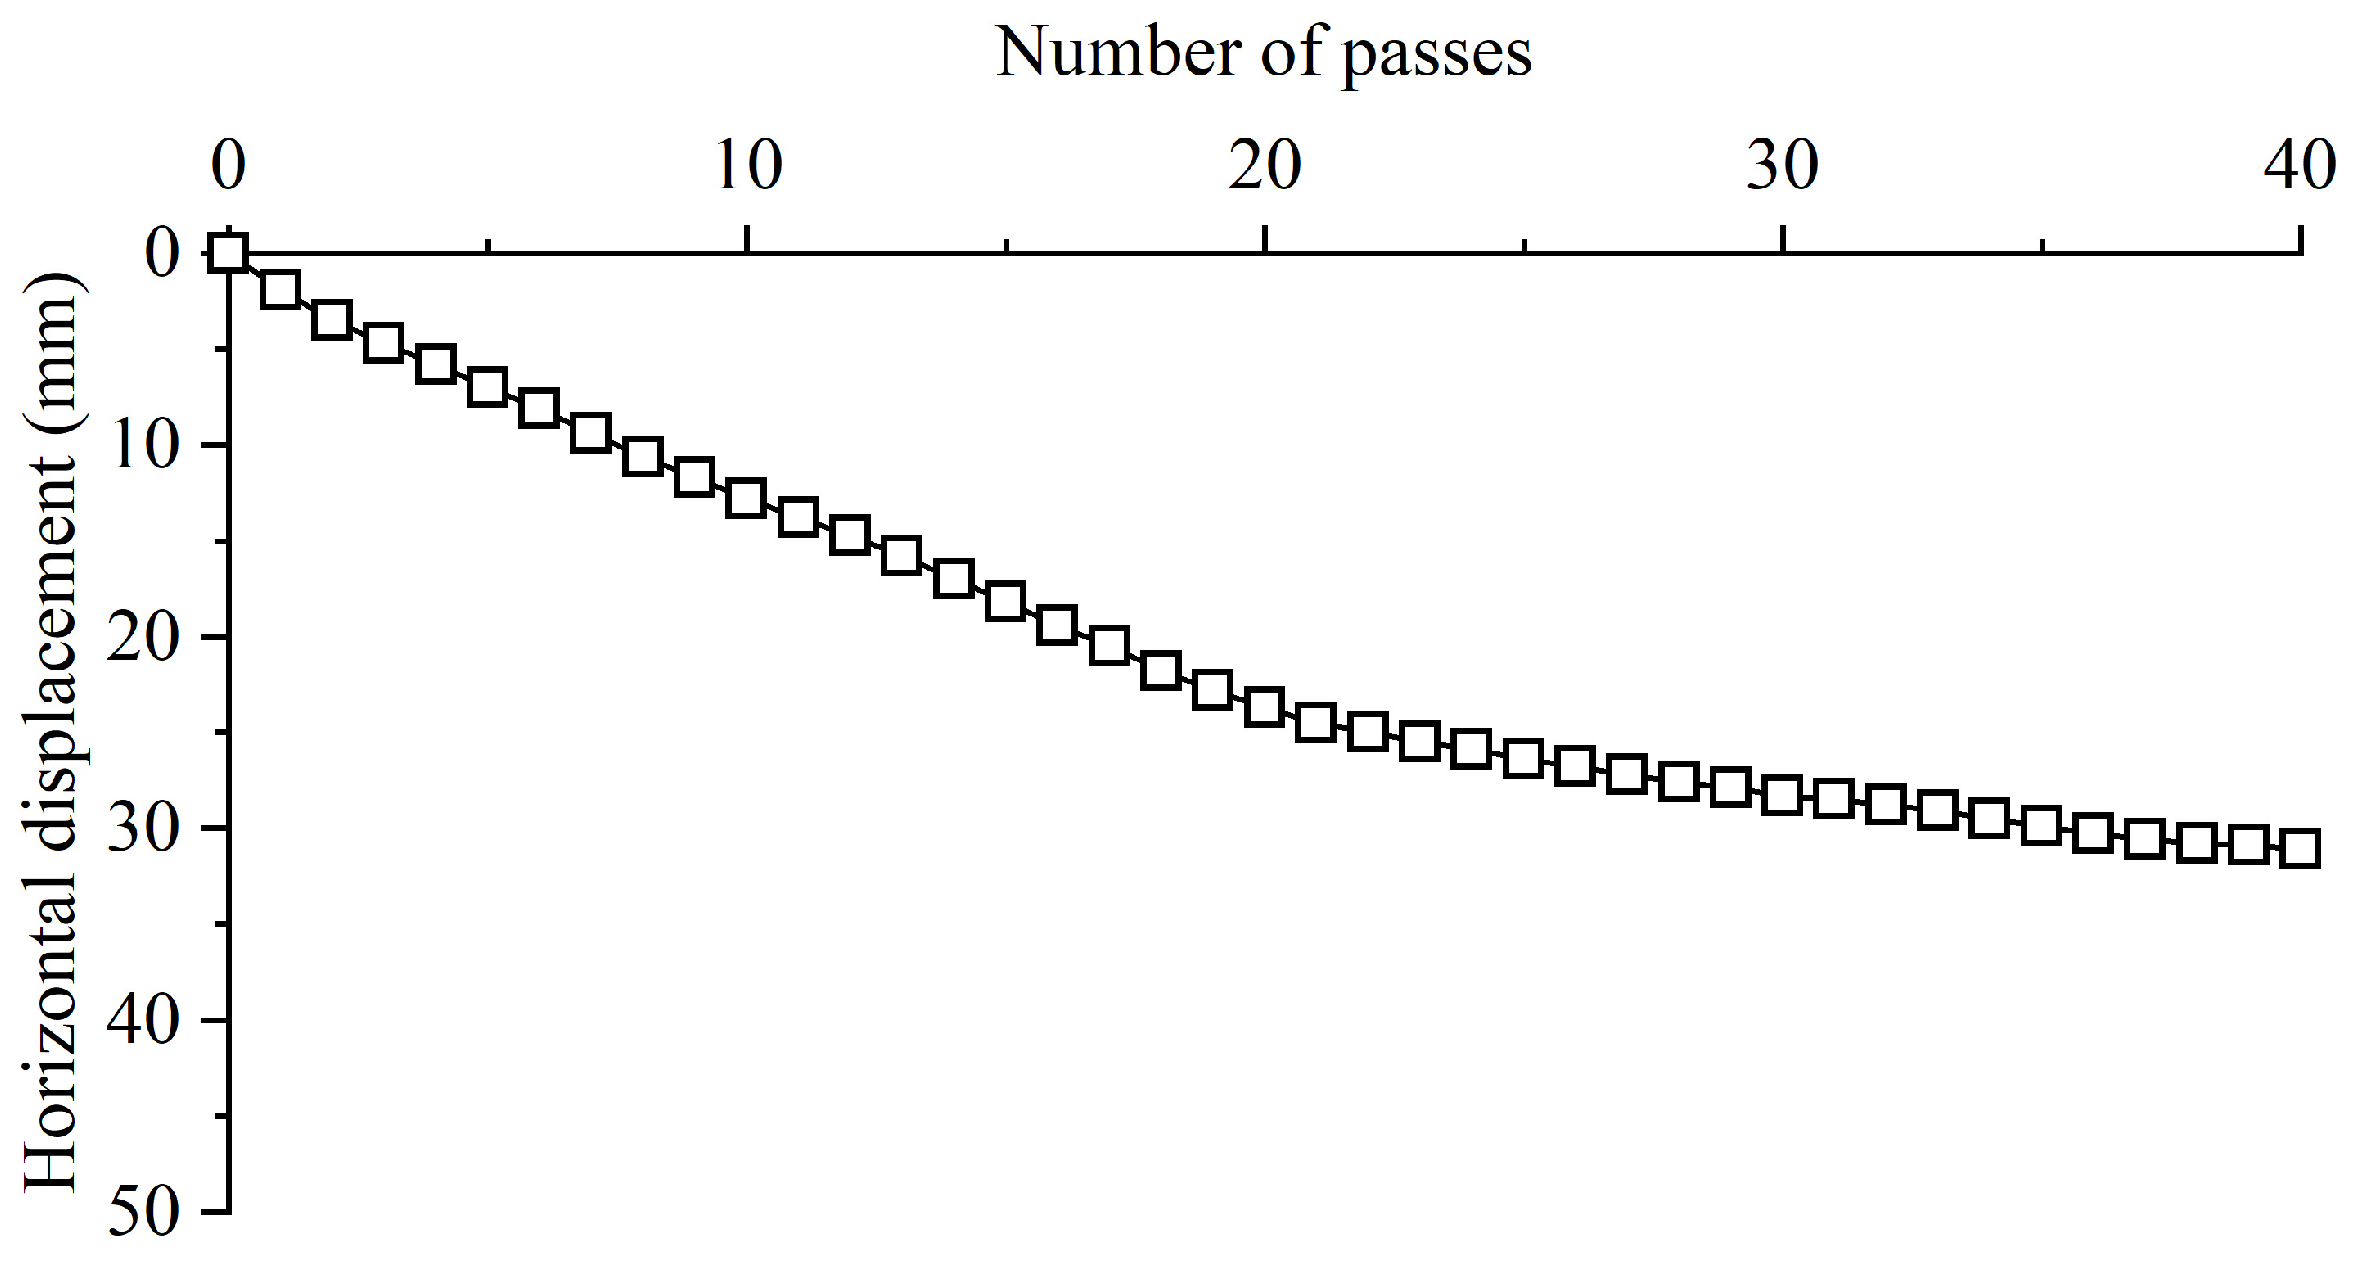
2.2.2. Horizontal Displacement
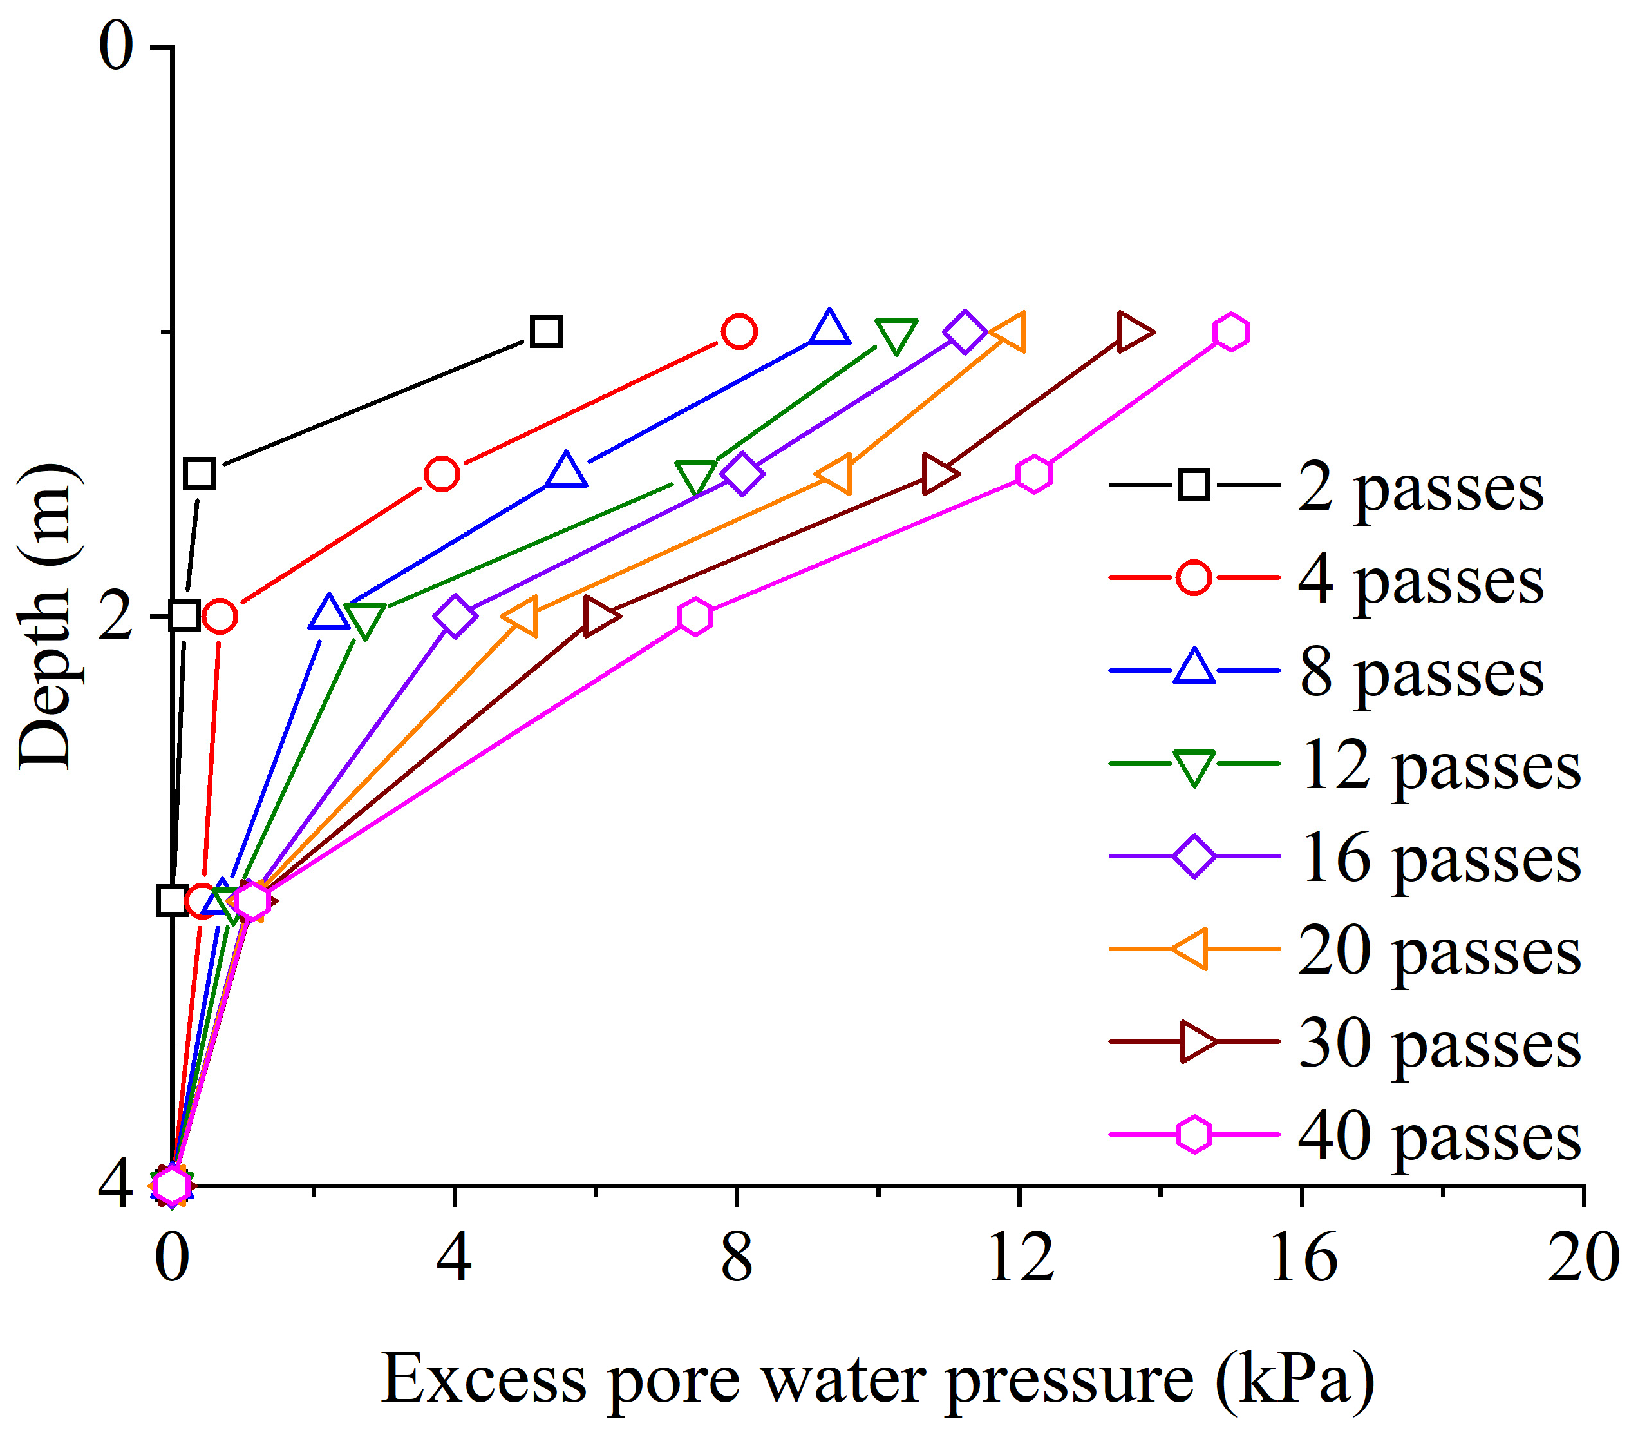
2.2.3. Pore Water Pressure
3. Overview of ML Algorithms
3.1. RFR
3.2. MLP
3.3. XGBoost
4. Predictions Using ML Algorithms
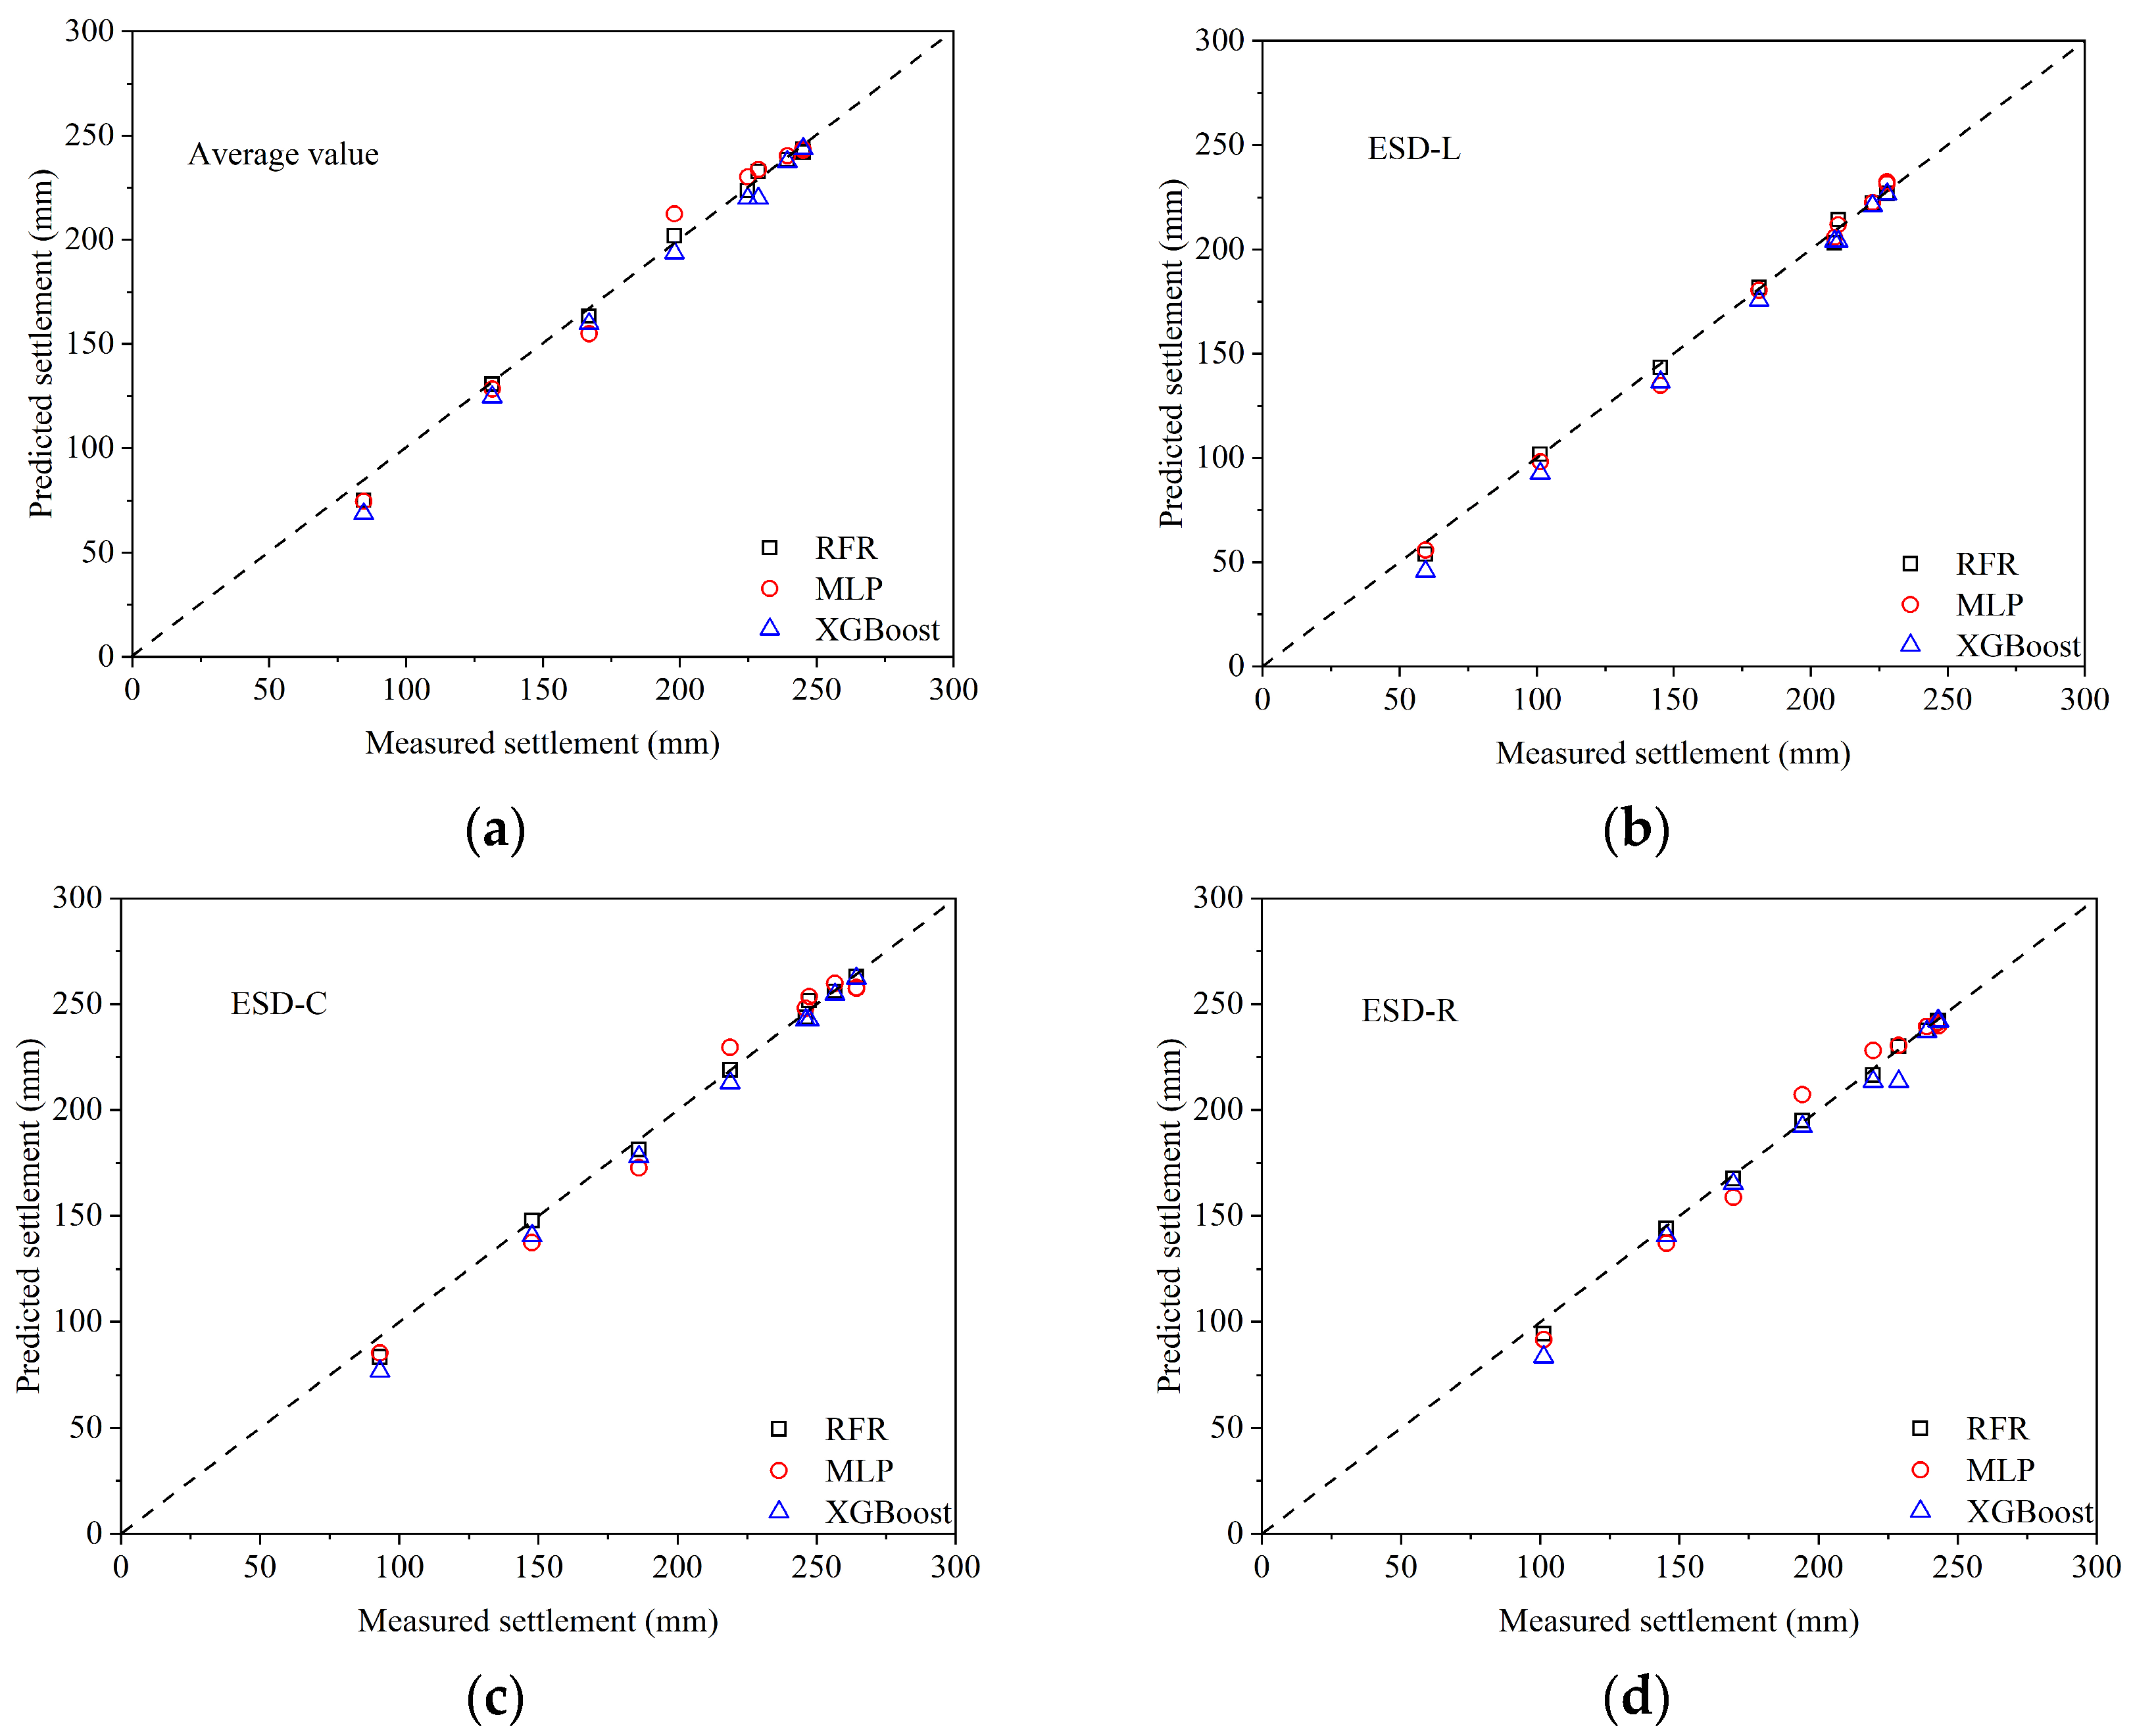
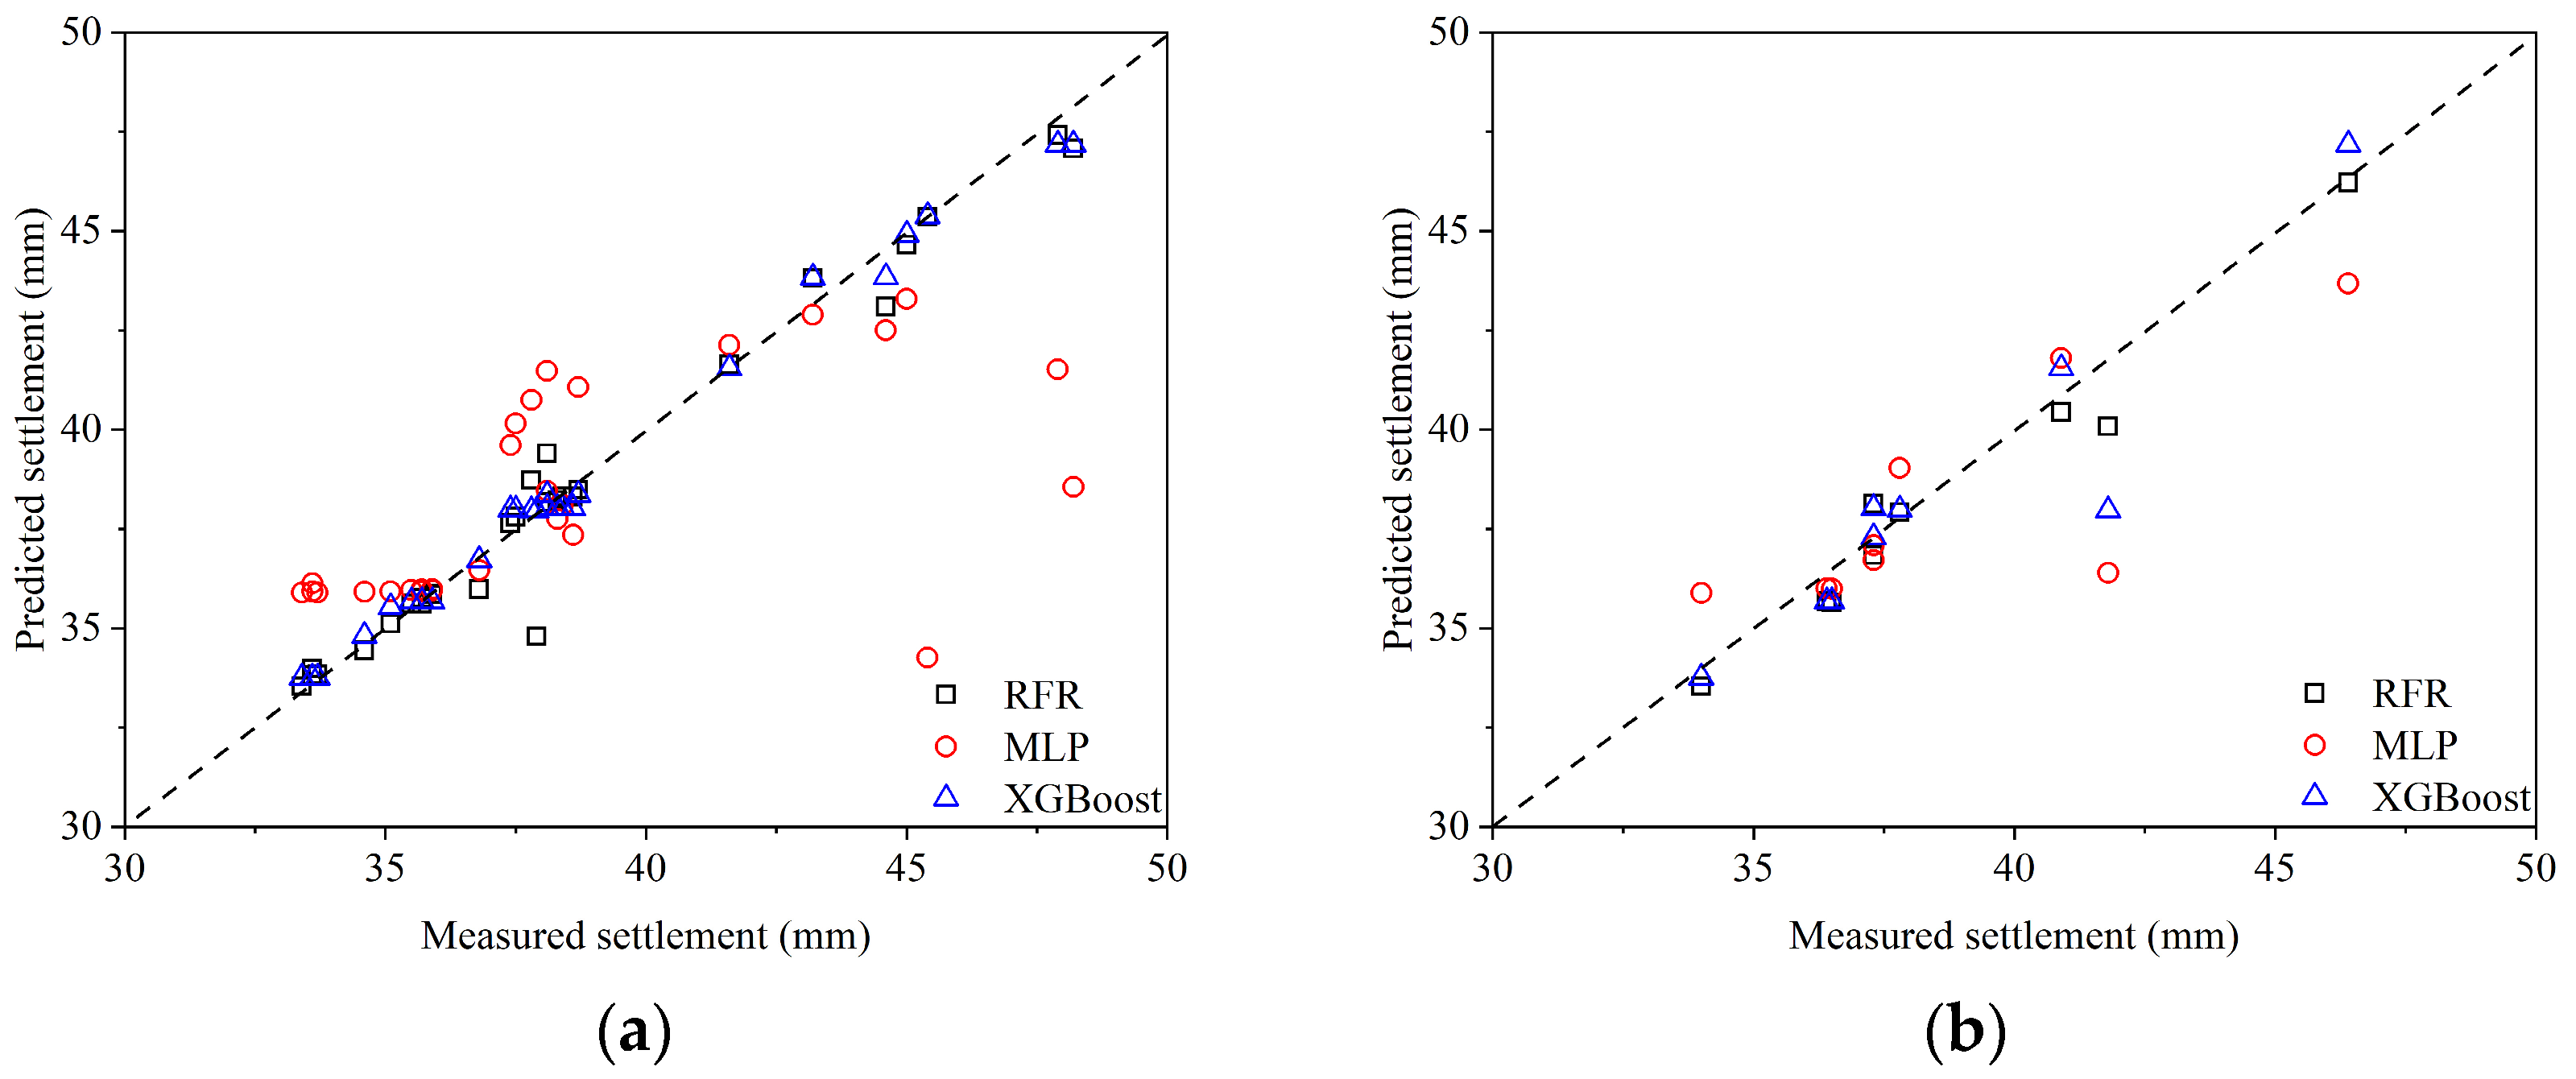
4.1. Predictions for Settlement
4.2. Predictions for Uneven Settlement
5. Conclusions and Future Research Directions
- (1)
- Analysis of the monitoring data revealed that the response of the soil occurred mainly in the first 20 passes. After 20 passes, the settlement of the soil gradually stabilized.
- (2)
- The deformation of soil caused by RDC is more significant in soft clay than in coarse-grained materials such as sand and gravel soils under the same conditions.
- (3)
- Field monitoring revealed a strong correlation between settlement, horizontal displacement, and pore water pressure. Based on the horizontal displacement and PWP monitoring results, the depth of impact of the RDC on the soft soil embankment was between 3 and 3.5 m.
- (4)
- In the prediction of settlement and uneven settlement caused by RDC, the XGBoost and RFR models were found to outperform the MLP model. As a reliable tree-based tool, XGBoost and RFR methods can strike a balance between predictive accuracy and robustness. This study demonstrates the feasibility of using the XGBoost and RFR models for predicting the settlement of soft soil embankments due to RDC and suggests that ensemble learning methods have great potential to predict RDC-induced settlement of complex foundations.
Author Contributions
Funding
Data Availability Statement
Conflicts of Interest
References
- Ranasinghe, R.A.T.M.; Jaksa, M.B.; Pooya, N.F.; Kuo, Y.L. Genetic programming for predictions of effectiveness of rolling dynamic compaction with dynamic cone penetrometer test results. J. Rock Mech. Geotech. 2019, 11, 815–823. [Google Scholar] [CrossRef]
- Bradley, A.C.; Jaksa, M.B.; Kuo, Y.L. Ground response of rolling dynamic compaction-a finite element modelling approach. Front. Built Environ. 2024, 9, 1334090. [Google Scholar]
- Chen, Y.; Jaksa, M.B.; Kuo, Y.L.; Airey, D.W. Experimental analysis of rolling dynamic compaction using transparent soils and particle image velocimetry. Can. Geotech. J. 2022, 59, 254–271. [Google Scholar] [CrossRef]
- Davies, M.; Mattes, N.; Avalle, D. Use of the impact roller in site remediation and preparation for heavy duty pavement construction. In Proceedings of the 2nd International Geotechnical and Pavements Engineering Conference, Melbourne, Australia, 19–21 May 2004. [Google Scholar]
- Avalle, D.L.; Carter, J.P. Evaluating the improvement from impact rolling on sand. In Proceedings of the 6th International Conference on Ground Improvement Techniques, Coimbra, Portugal, 18–19 July 2005. [Google Scholar]
- Avalle, D.L.; Scott, B.T.; Jaksa, M.B. Ground energy and impact of rolling dynamic compaction e results from research test site. In Proceedings of the 17th International Conference on Soil Mechanics and Geotechnical Engineering, Alexandria, Egypt, 5–9 October 2009; IOS Press: Alexandria, Egypt, 2009. [Google Scholar]
- Bouazza, A.; Avalle, D.L. Effectiveness of rolling dynamic compaction on an old waste tip. In Proceedings of the 5th ICEG Environmental Geotechnics: Opportunities, Challenges and Responsibilities for Environmental Geotechnics, Cardiff, Wales, UK, 30 June 2006. [Google Scholar]
- Jaksa, M.B.; Scott, B.T.; Mentha, N.; Symons, A.; Pointon, S.; Wrightson, P.; Syamsuddin, E. Quantifying the zone of influence of the impact roller. In Proceedings of the ISSMGE-TC 211 International Symposium on Ground Improvement IS-GI Brussels, Brussels, Belgium, 31 May–1 June 2012. [Google Scholar]
- Scott, B.T.; Jaksa, M.B.; Mitchell, P.W. Ground response to rolling dynamic compaction. Geotech. Lett. 2019, 9, 99–105. [Google Scholar] [CrossRef]
- Scott, B.T.; Jaksa, M.B.; Mitchell, P.W. Influence of towing speed on effectiveness of rolling dynamic compaction. J. Rock Mech. Geotech. 2020, 12, 126–134. [Google Scholar] [CrossRef]
- Bradley, A.C.; Jaksa, M.B.; Kuo, Y.L. Examining the kinematics and energy of the four-sided impact roller. Proc. Inst. Civ. Eng-Gr. 2019, 172, 297–304. [Google Scholar] [CrossRef]
- Li, Y.; Airey, D.; Jaksa, M. Evaluating the effective depth of rolling dynamic compaction with a three-sided compactor. Int. J. Phys. Model. Geo. 2021, 22, 128–142. [Google Scholar] [CrossRef]
- Liang, C.Y.; Wu, Y.D.; Liu, J.; Zang, L.; Lin, L.H.; Chen, D.S. Influence of calcareous nodules content on scaling effect in shear strength of cohesive soil containing calcareous nodules. Sci. Rep. 2022, 12, 361. [Google Scholar] [CrossRef] [PubMed]
- Bradley, A.C.; Jaksa, M.B.; Kuo, Y.L. Finite element modelling of rolling dynamic compaction. Comput. Geotech. 2023, 157, 105275. [Google Scholar] [CrossRef]
- Chen, Y.; Jaksa, M.B.; Kuo, Y.L.; Scott, B.T. Discrete element modelling of the 4-sided impact roller. Comput. Geotech. 2021, 137, 104250. [Google Scholar] [CrossRef]
- Chen, Y.; Jaksa, M.B.; Kuo, Y.L.; Airey, D.W. Investigating the effectiveness of Rolling Dynamic Compaction (RDC) using Discrete Element Method (DEM). Granul. Matter 2021, 23, 94. [Google Scholar] [CrossRef]
- Chen, Y.; Jaksa, M.B.; Scott, B.T.; Kuo, Y.L. Numerical investigation of the performance of the 3-sided impact roller. Comput. Geotech. 2023, 157, 105331. [Google Scholar] [CrossRef]
- Jiang, M.; Dai, Y.; Cui, L.; Shen, Z.; Wang, X. Investigating mechanism of inclined CPT in granular ground using DEM. Granul. Matter 2014, 16, 785–796. [Google Scholar] [CrossRef]
- Jing, X.Y.; Zhou, W.H.; Zhu, H.X.; Yin, Z.Y.; Li, Y. Analysis of soil-structural interface behavior using three-dimensional DEM simulations. Int. J. Numer. Anal. Meth. Geomech. 2018, 42, 339–357. [Google Scholar] [CrossRef]
- Chen, Y.; Deng, A.; Wang, A.; Sun, H. Performance of screw–shaft pile in sand: Model test and DEM simulation. Comput. Geotech. 2018, 104, 118–130. [Google Scholar] [CrossRef]
- Ranasinghe, R.A.T.M.; Jaksa, M.B.; Kuo, Y.L.; Pooya, N.F. Application of artificial neural networks for predicting the impact of rolling dynamic compaction using dynamic cone penetrometer test results. J. Rock Mech. Geotech. 2017, 9, 340–349. [Google Scholar] [CrossRef]
- Ranasinghe, R.A.T.M.; Jaksa, M.B.; Pooya, N.F.; Kuo, Y.L. Predicting the effectiveness of rolling dynamic compaction using genetic programming. Proc. Inst. Civ. Eng-Gr. 2017, 170, 193–207. [Google Scholar] [CrossRef]
- Park, H.I.; Kim, K.S.; Kim, H.Y. Field performance of a genetic algorithm in the settlement prediction of a thick soft clay deposit in the southern part of the Korean peninsula. Eng. Geol. 2015, 196, 150–157. [Google Scholar] [CrossRef]
- Wen, L.F.; Li, Y.L.; Zhang, H.Y.; Liu, Y.H.; Zhou, H. Predicting the Crest Settlement of Concrete Face Rockfill Dams by Combining Threshold Regression and Support Vector Machine. Int. J. Geomech. 2022, 22, 1–12. [Google Scholar] [CrossRef]
- Han, Y.L.; Wang, Y.; Liu, C.Y.; Hu, X.M.; Du, L.Z. Application of regularized ELM optimized by sine algorithm in prediction of ground settlement around foundation pit. Environ. Earth Sci. 2022, 81, 413. [Google Scholar] [CrossRef]
- Wen, L.; Kong, G.Q.; Li, Q.S.; Zhang, Z.D. Field tests on axial behavior of grouted steel pipe micropiles in marine soft clay. Int. J. Geomech. 2020, 20, 06020006. [Google Scholar] [CrossRef]
- Yin, J.; Lu, Z.J.; Geng, W.J.; Han, W.X.; Hudu, A.A. Effect of porewater salinity on compression behaviors and hydraulic conductivity of soft marine clay. Mar. Georesour. Geotec. 2022, 40, 813–822. [Google Scholar] [CrossRef]
- Wu, Y.D.; Li, T.D.; Diao, H.G.; Zhang, P.; Wu, C.B. Development and application of a new embedded settlement gauge based on dual-pressure sensors. Chin. J. Geotech. Eng. 2017, 39, 38–42. [Google Scholar]
- Song, X.G.; Zhuang, P.Z.; Zhang, H.B.; Yang, Y. Research on Digital Subgrade Settlement Device And Performance Testing. In Proceedings of the First International Conference on Transportation Information and Safety, Wuhan, China, 2 July 2011. [Google Scholar]
- Ng, C.W.W.; Wong, H.N.; Tse, Y.M.; Pappin, J.W.; Sun, H.W.; Millis, S.W.; Leung, A.K. A field study of stress-dependent soil-water characteristic curves and permeability of a saprolitic slope in Hong Kong. Géotechnique 2011, 61, 511–521. [Google Scholar] [CrossRef]
- Leung, A.K.; Sun, H.W.; Millis, S.W.; Pappin, J.W.; Ng, C.W.W.; Wong, H.N. Field monitoring of an unsaturated saprolitic hillslope. Can. Geotech. J. 2011, 48, 339–353. [Google Scholar] [CrossRef]
- Leung, A.K.; Ng, C.W.W. Seasonal movement and groundwater flow mechanism in an unsaturated saprolitic hillslope. Landslides 2013, 10, 455–467. [Google Scholar] [CrossRef]
- Leung, A.K.; Ng, C.W.W. Field investigation of deformation characteristics and stress mobilisation of a soil slope. Landslides 2016, 13, 229–240. [Google Scholar] [CrossRef]
- Wang, G.; Zhang, X.W.; Liu, X.Y.; Chang, Z.X.; Liu, Z.H. Large-scale Field Tests of the Performance of Geogrid-reinforced Piled Embankment over Soft Soil. KSCE J. Civ. Eng. 2024, 28, 655–672. [Google Scholar] [CrossRef]
- Scott, B.T.; Jaksa, M.B.; Syamsuddin, E. Verification of an impact rolling compaction trial using various in situ testing methods. In Proceedings of the 5th International Conference on Geotechnical and Geophysical Site Characterisation, Gold Coast, Australia, 5–9 September 2016. [Google Scholar]
- Canala, G.S.; Gauro, C.A.; March, J.C.; Strapps, R.W. Final Research Project Report: Quantifying the Effectiveness of the Four-Sided Impact Roller with Operating Speed; University of Adelaide: Adelaide, Australia, 2014. [Google Scholar]
- Avalle, D.L.; McKenzie, R.W. Ground improvement of landfill site using the “square” impact roller. Aust. Geomech. J. 2005, 40, 15–21. [Google Scholar]
- Avalle, D.; Grounds, R. Improving pavement subgrade with the “Square” Impact Roller. In Proceedings of the 23rd Annual Southern African Transport, Pretoria, South Africa, 12–15 July 2004. [Google Scholar]
- Breiman, L. Random forests. Mach. Learn. 2001, 45, 5–32. [Google Scholar] [CrossRef]
- Zhang, W.; Wu, C.; Li, Y.; Wang, L.; Samui, P. Assessment of pile drivability using random forest regression and multivariate adaptive regression splines. Georisk 2019, 15, 27–40. [Google Scholar] [CrossRef]
- Zhou, J.; Shi, X.Z.; Du, K.; Qiu, X.Y.; Li, X.B.; Mitri, H.S. Feasibility of randomforest approach for prediction of ground surface settlements induced by the construction of a shield-driven tunnel. Int. J. Geo. Mech. 2017, 17, 4016129. [Google Scholar]
- Xie, Q.; Peng, K. Space-time distribution laws of tunnel excavation damaged zones (EDZs) in deep mines and EDZ prediction modeling by random forest regression. Adv. Civ. Eng. 2019, 2019, 6505984. [Google Scholar] [CrossRef]
- Ghiasi, V.; Koushki, M. Numerical and artificial neural network analyses of ground surface settlement of tunnel in saturated soil. SN Appl. Sci. 2020, 2, 939. [Google Scholar] [CrossRef]
- Nguyen, N.V.; Le, L.V.; Nguyen, T.N.; Park, S.S.; Tran, T.D. Prediction of Liquefied Soil Settlement Using Multilayer Perceptron with Bayesian Optimization. Indian Geotech. J. 2024, 2024, 1–11. [Google Scholar] [CrossRef]
- Ramchoun, H.; Amine, M.; Idrissi, J.; Ghanou, Y.; Ettaouil, M. Multilayer perceptron: Architecture optimization and training. Int. J. Interactive Multi. 2016, 4, 26–30. [Google Scholar] [CrossRef]
- Chen, T.; Guestrin, C. Xgboost: A scalable tree boosting system. In Proceedings of the 22nd Acm Sigkdd International Conference on Knowledge Discovery and Data Mining; Springer: San Francisco, CA, USA, 2016; pp. 785–794. [Google Scholar]
- Wang, L.; Wu, C.; Tang, L.; Zhang, W.G.; Lacasse, S.; Liu, H.L.; Gao, L. Efficient reliability analysis of earth dam slope stability using extreme gradient boosting method. Acta Geotech. 2020, 15, 3135–3150. [Google Scholar] [CrossRef]
- Zhang, W.G.; Li, H.R.; Wu, C.Z.; Li, Y.Q.; Liu, Z.Q.; Liu, H.L. Soft computing approach for prediction of surface settlement induced by earth pressure balance shield tunneling. Undergr. Space 2020, 6, 353–363. [Google Scholar] [CrossRef]
- Zhang, W.G.; Zhang, R.H.; Wu, C.Z.; Goh, A.T.C.; Lacasse, S.; Liu, Z.Q.; Liu, H.L. State-of-the-art review of soft computing applications in underground excavations. Geosci. Front. 2020, 11, 1095–1106. [Google Scholar] [CrossRef]
- Zhang, W.G.; Li, Y.H.; Wu, C.Z.; Li, H.R.; Goh, A.T.C.; Zhang, R.H. Prediction of lining response for twin-tunnel construction in anisotropic clays using machine learning techniques. Undergr. Space 2020, 7, 122–133. [Google Scholar] [CrossRef]


| Soil Type | Index | Value |
|---|---|---|
| Fill soil | Natural moisture content: % | 4.8 |
| Volume moisture content: % | 6.7 | |
| Optimum moisture content: % | 10.2 | |
| Maximum dry density: g/cm3 | 1.50 | |
| Unit weight: kN/m3 | 16.5 | |
| Silt content: % | 12.5 | |
| Soft clay | Natural moisture content: % | 45.0 |
| Volume moisture content: % | 54.0 | |
| Liquid limit: % | 50.2 | |
| Plastic limit: % | 30.5 | |
| Unit weight: kN/m3 | 17.9 | |
| Compression index | 0.48 |
| Model | R2 | MAE | RMSE | ||||
|---|---|---|---|---|---|---|---|
| Traing | Testing | Traing | Testing | Traing | Testing | ||
| ESD-L | RFR | 99.2% | 99.7% | 2.42 | 2.30 | 6.43 | 3.11 |
| MLP | 98.9% | 99.4% | 4.63 | 3.46 | 7.24 | 4.46 | |
| XGBoost | 99.8% | 98.5% | 1.08 | 5.82 | 2.23 | 7.04 | |
| ESD-C | RFR | 99.5% | 99.5% | 1.93 | 2.72 | 5.42 | 4.01 |
| MLP | 95.5% | 97.9% | 9.30 | 7.45 | 15.82 | 8.18 | |
| XGBoost | 99.9% | 98.4% | 1.25 | 5.79 | 2.80 | 7.21 | |
| ESD-R | RFR | 98.4% | 99.7% | 2.50 | 2.04 | 8.37 | 2.78 |
| MLP | 94.2% | 97.3% | 8.82 | 6.38 | 15.76 | 7.71 | |
| XGBoost | 99.8% | 96.8% | 1.14 | 6 | 2.68 | 8.42 | |
| average value | RFR | 99% | 99.4% | 2.64 | 3.15 | 7.17 | 4.05 |
| MLP | 95.8% | 98% | 7.88 | 6.02 | 14.33 | 7.58 | |
| XGBoost | 99.8% | 98% | 1.15 | 5.87 | 2.58 | 7.32 | |
| Model | R2 | MAE | RMSE | |||
|---|---|---|---|---|---|---|
| Traing | Testing | Traing | Testing | Traing | Testing | |
| RFR | 0.94 | 0.95 | 0.86 | 0.65 | 2.21 | 0.79 |
| MLP | 0.68 | 0.64 | 3.07 | 2.10 | 5.07 | 3.69 |
| XGboost | 0.99 | 0.84 | 0.40 | 0.89 | 0.67 | 1.40 |
Disclaimer/Publisher’s Note: The statements, opinions and data contained in all publications are solely those of the individual author(s) and contributor(s) and not of MDPI and/or the editor(s). MDPI and/or the editor(s) disclaim responsibility for any injury to people or property resulting from any ideas, methods, instructions or products referred to in the content. |
© 2024 by the authors. Licensee MDPI, Basel, Switzerland. This article is an open access article distributed under the terms and conditions of the Creative Commons Attribution (CC BY) license (https://creativecommons.org/licenses/by/4.0/).
Share and Cite
Chen, D.; Wu, Y.; Liu, J.; Wu, H.; Ren, Y. Field Observation and Settlement Prediction Study of a Soft Soil Embankment under Rolling Dynamic Compaction. Appl. Sci. 2024, 14, 6454. https://doi.org/10.3390/app14156454
Chen D, Wu Y, Liu J, Wu H, Ren Y. Field Observation and Settlement Prediction Study of a Soft Soil Embankment under Rolling Dynamic Compaction. Applied Sciences. 2024; 14(15):6454. https://doi.org/10.3390/app14156454
Chicago/Turabian StyleChen, Dashuo, Yuedong Wu, Jian Liu, Huiguo Wu, and Yuzhe Ren. 2024. "Field Observation and Settlement Prediction Study of a Soft Soil Embankment under Rolling Dynamic Compaction" Applied Sciences 14, no. 15: 6454. https://doi.org/10.3390/app14156454
APA StyleChen, D., Wu, Y., Liu, J., Wu, H., & Ren, Y. (2024). Field Observation and Settlement Prediction Study of a Soft Soil Embankment under Rolling Dynamic Compaction. Applied Sciences, 14(15), 6454. https://doi.org/10.3390/app14156454