
Optical Study on Temperature-Dependent Absorption Edge of γ-InSe-Layered Semiconductor

 ,
,
Abstract
1. Introduction
2. Experimental Techniques
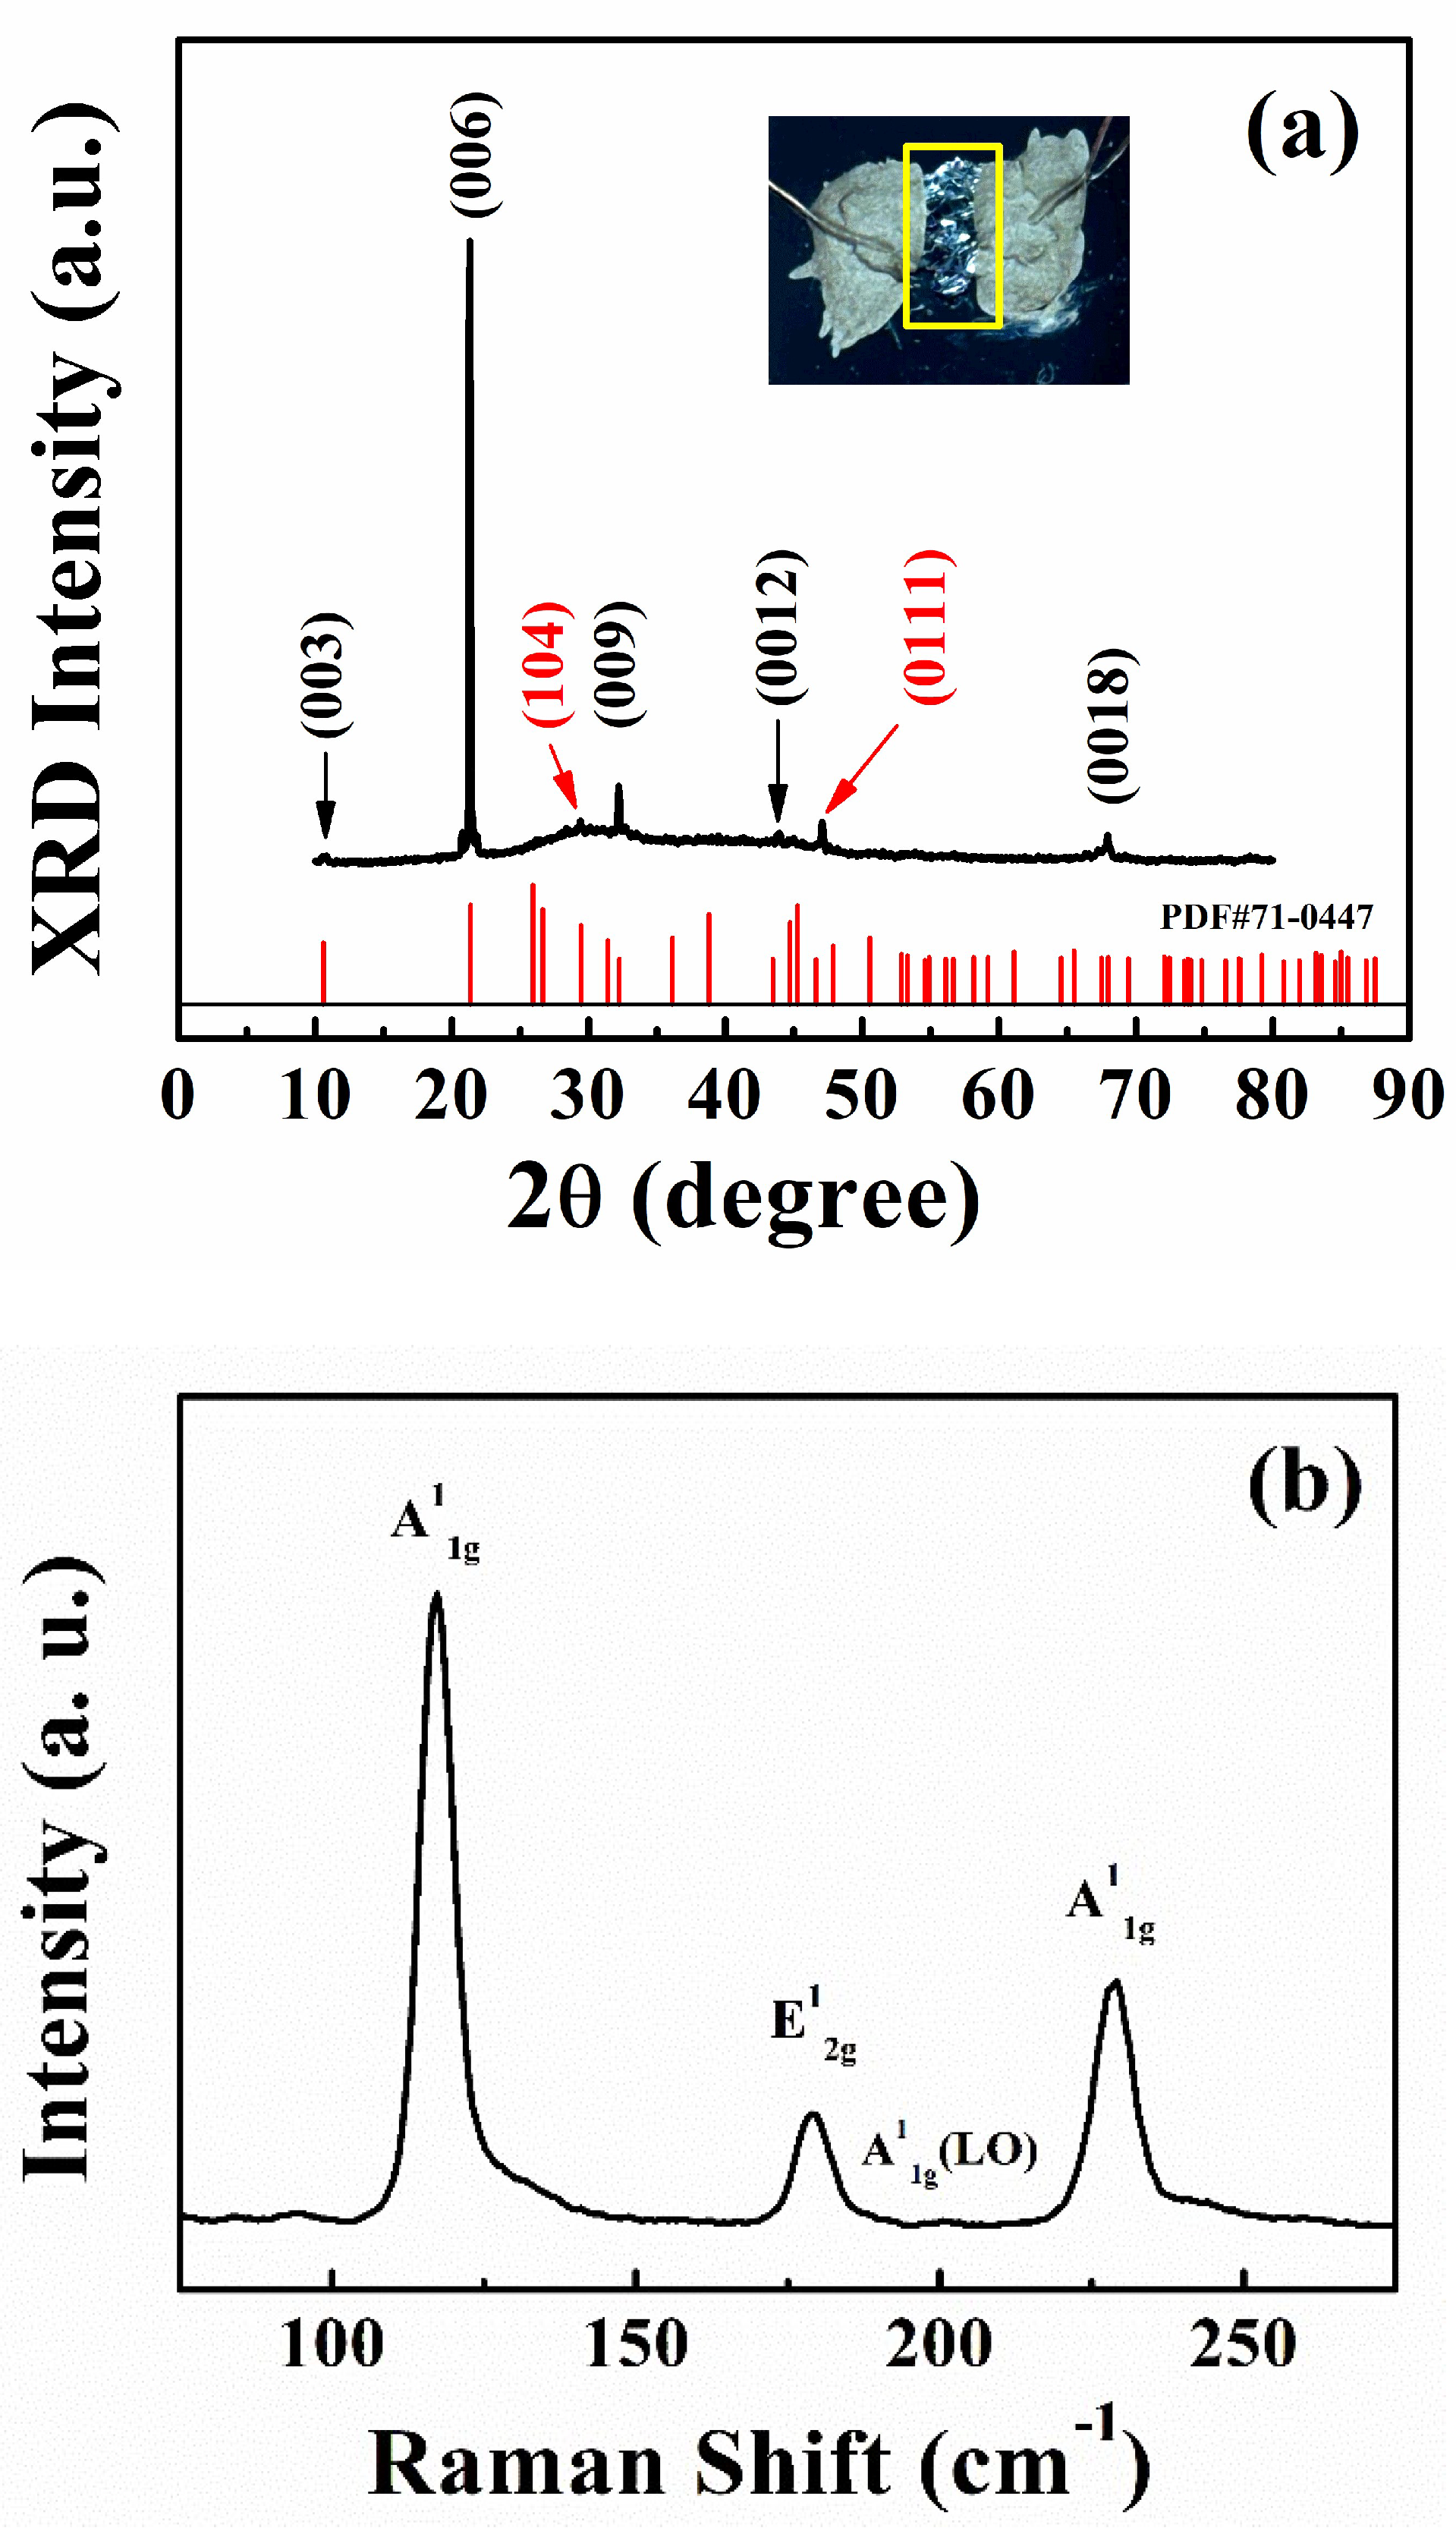
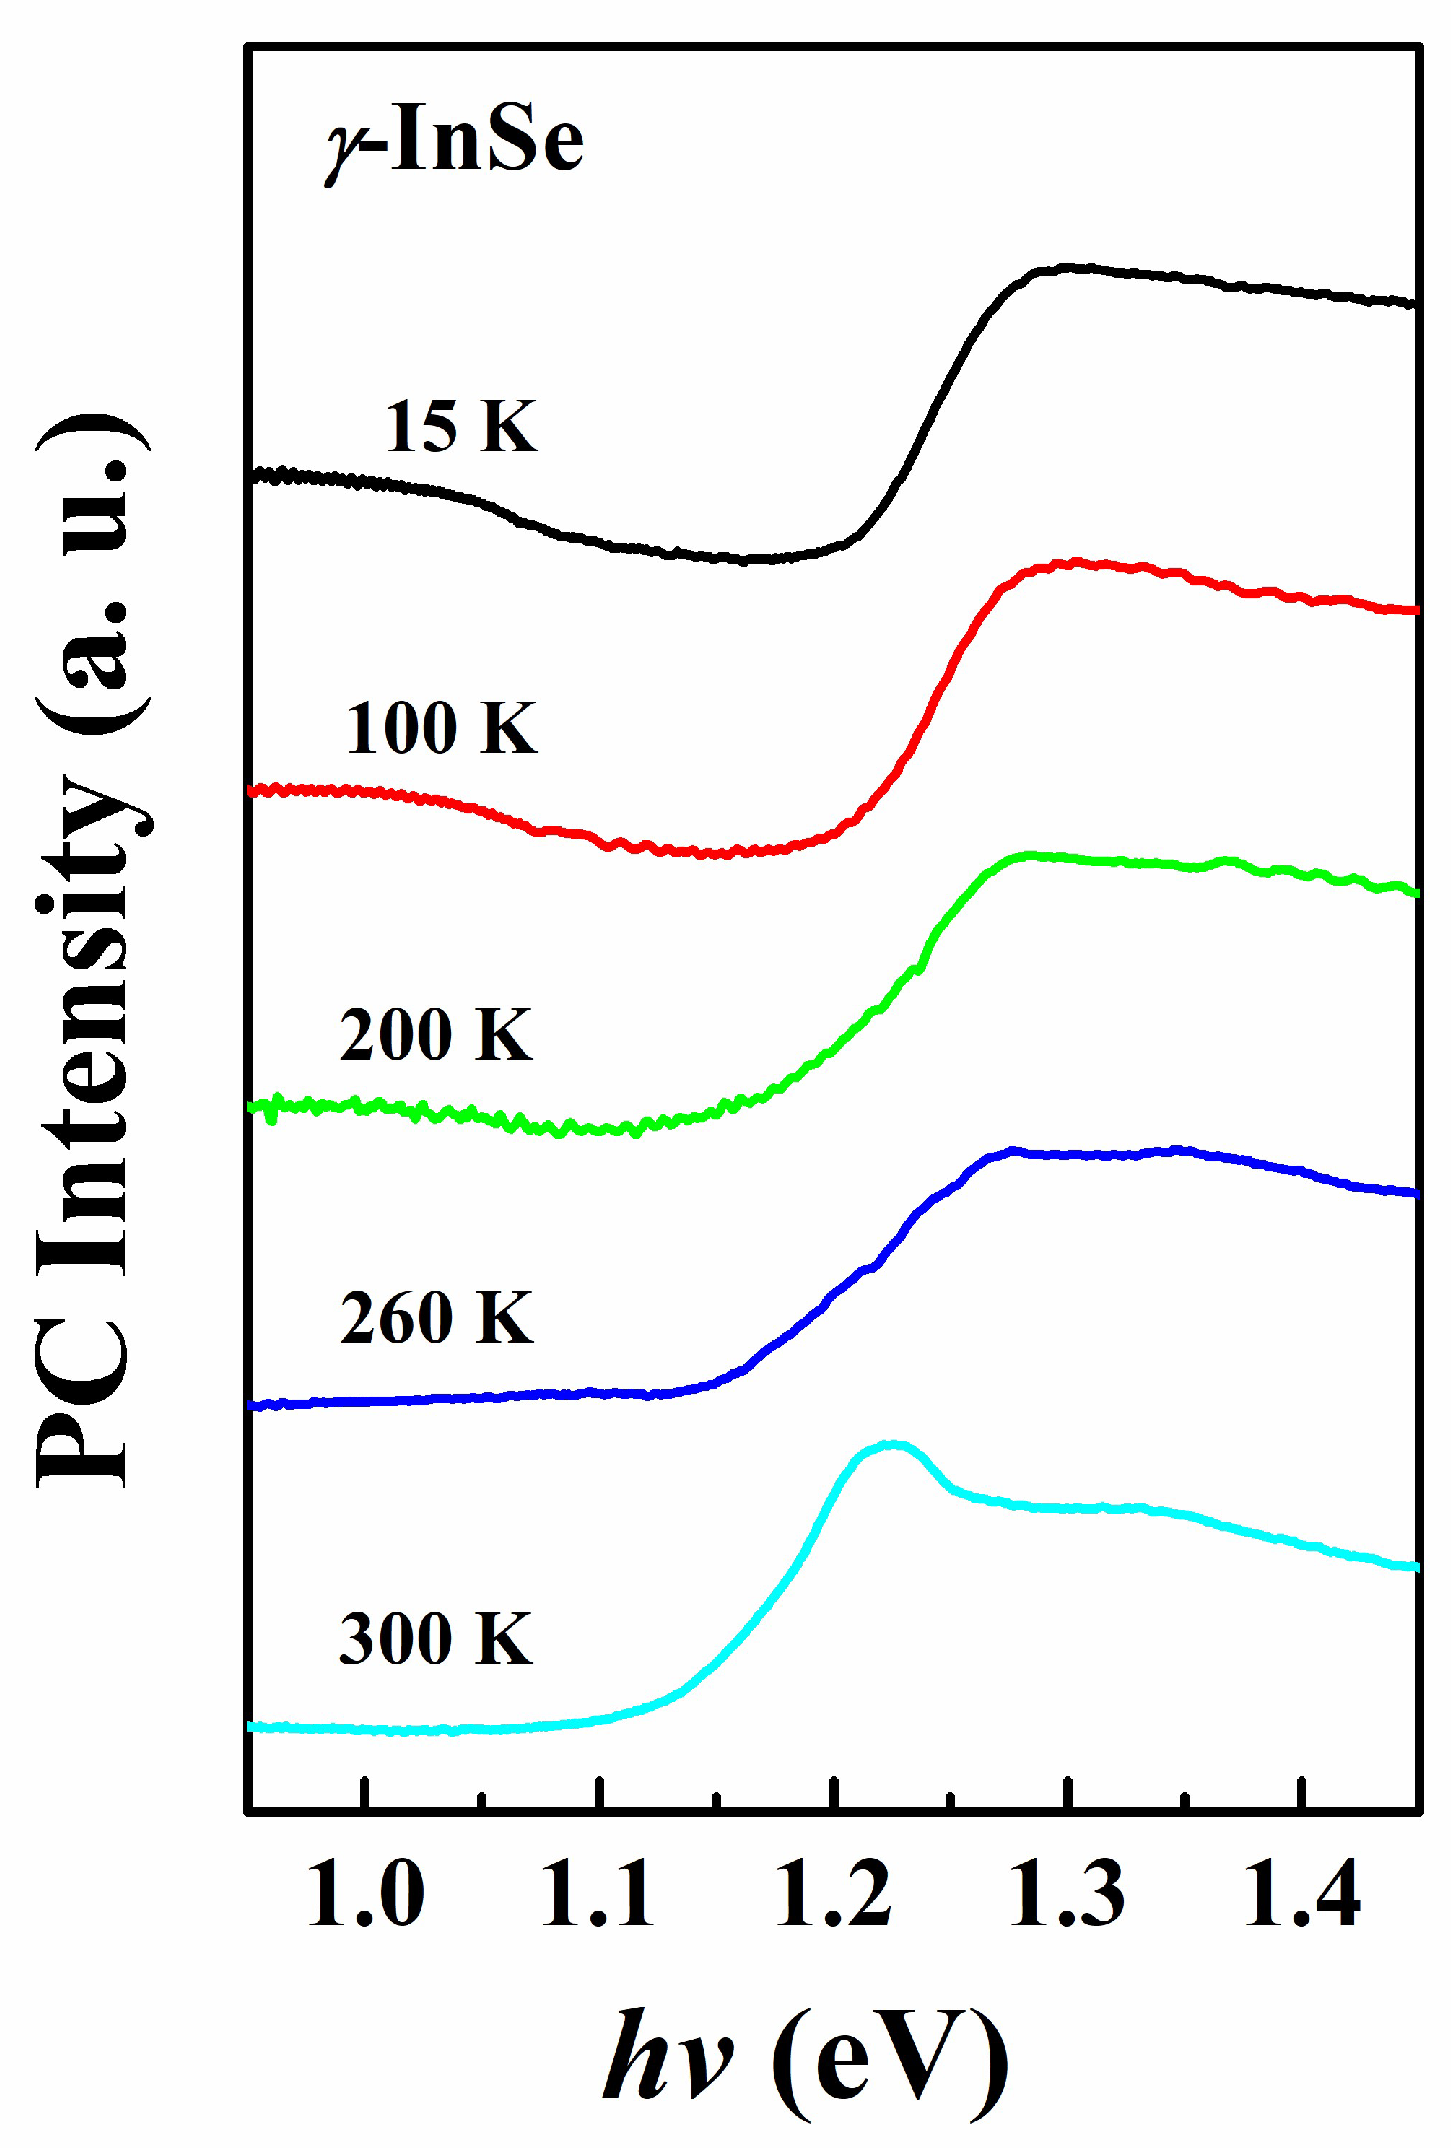
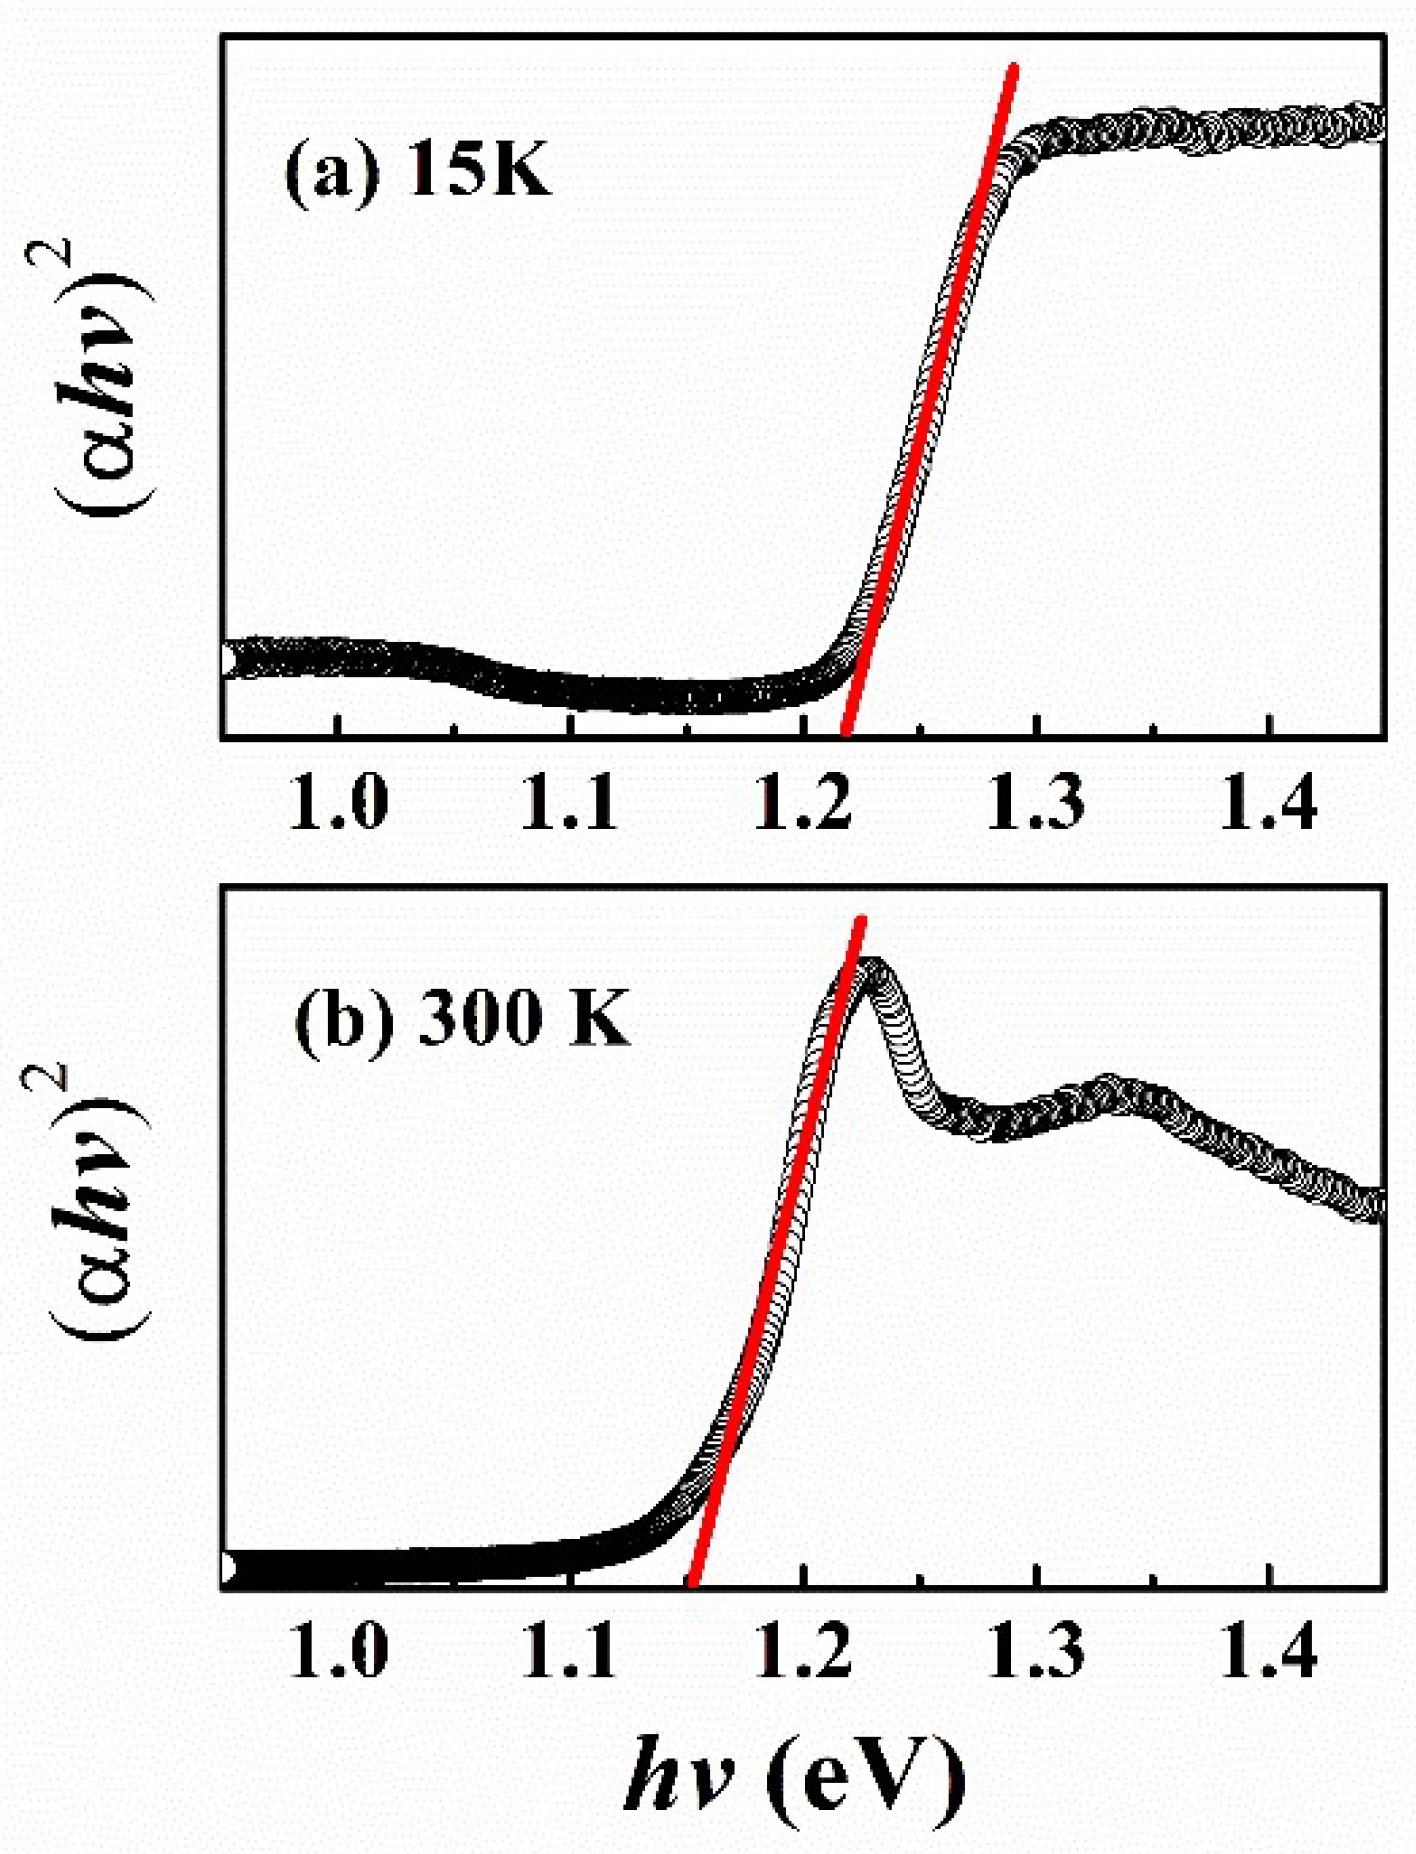
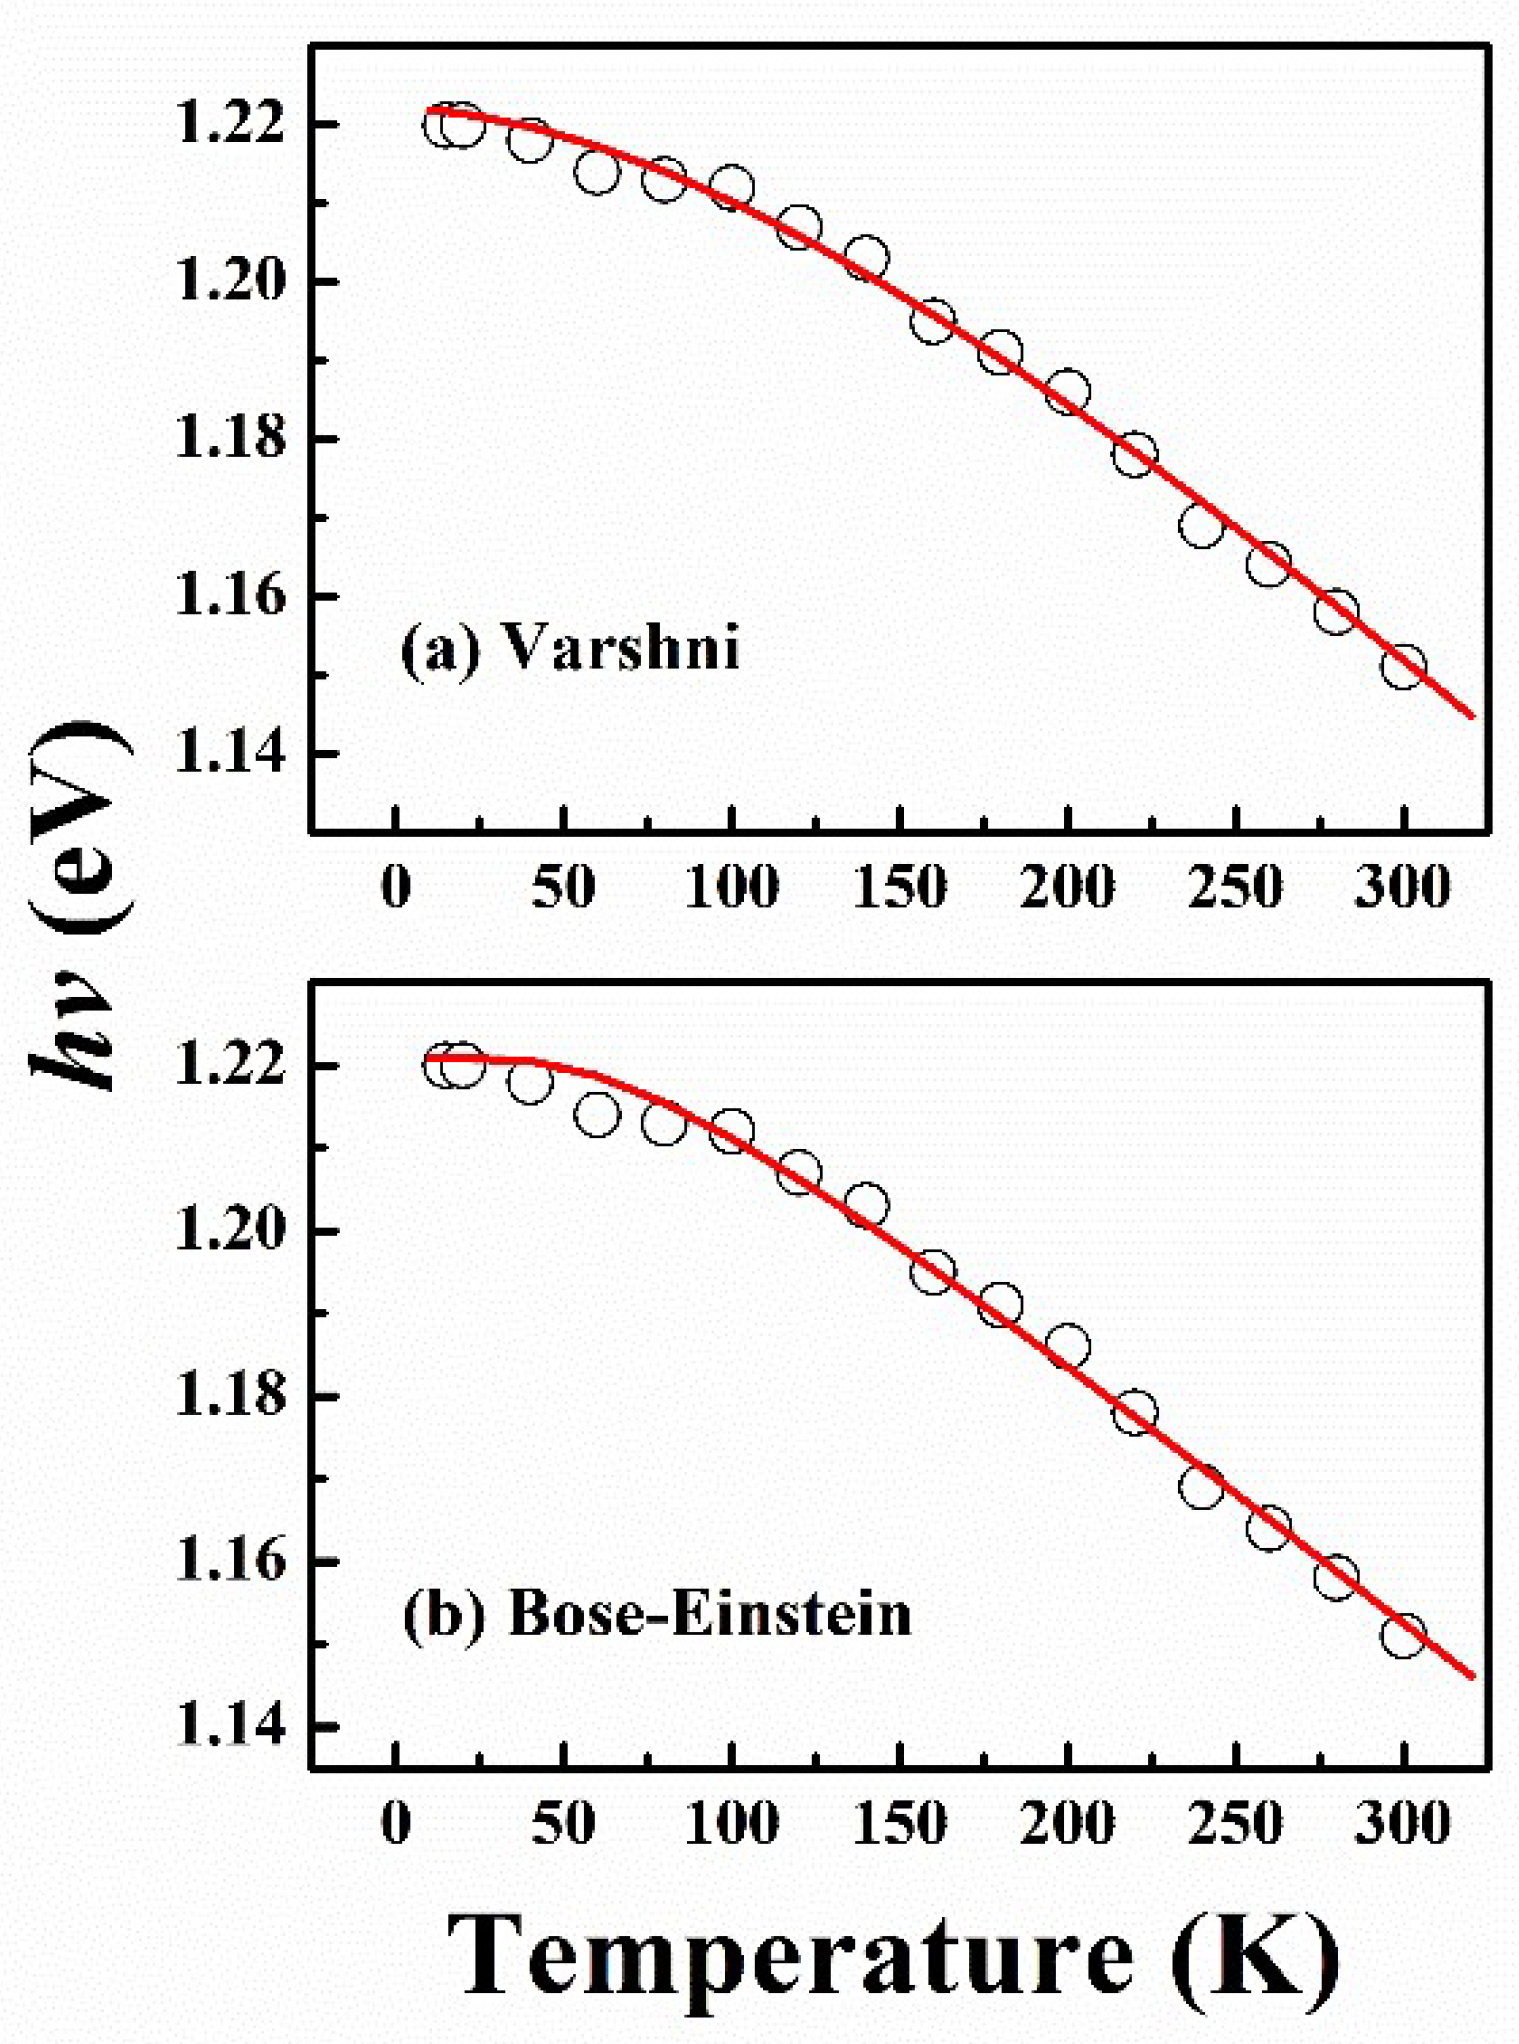
3. Results and Discussion
4. Conclusions
Author Contributions
Funding
Data Availability Statement
Conflicts of Interest
References
- Boukhvalov, D.W.; Gürbulak, B.; Duman, S.; Wang, L.; Politano, A.; Caputi, L.S.; Chiarello, G.; Cupolillo, A. The advent of indium selenide: Synthesis, electronic properties, ambient stability and applications. Nanomaterials 2017, 7, 11–372. [Google Scholar] [CrossRef]
- Shubina, T.V.; Desrat, W.; Moret, M.; Tiberj, A.; Briot, O.; Davydov, V.Y.; Platonov, A.V.; Semina, M.A.; Gil, B. InSe as a case between 3D and 2D layered crystals for excitons. Nat. Commun. 2019, 10, 3479. [Google Scholar] [CrossRef] [PubMed]
- Wu, M.; Xie, Q.; Wu, Y.; Zheng, J.; Wang, W.; He, L.; Wu, X.; Lv, B. Crystal structure and optical performance in bulk γ–InSe single crystals. AIP Adv. 2019, 9, 025013. [Google Scholar] [CrossRef]
- Grimaldi, I.; Gerace, T.; Pipita, M.M.; Perrotta, I.D.; Ciuchi, F.; Berger, H.; Papagno, M.; Castriota, M.; Pacilé, D. Structural investigation of InSe layered semiconductors. Solid State Commun. 2020, 311, 133855. [Google Scholar] [CrossRef]
- Aitzhanov, M.; Guseinov, N.; Nemkayeva, R.; Tolepov, Z.; Prikhodko, O.; Mukhametkarimov, Y. Inse crystals obtained by stoichiometric fusion for optoelectronic device application. J. Nano-Electron. Phys. 2021, 13, 05037. [Google Scholar] [CrossRef]
- Liu, W.; Yang, X.; Wang, Z.; Li, Y.; Li, J.; Feng, Q.; Xie, X.; Xin, W.; Xu, H.; Liu, Y. Self-powered and broadband opto-sensor with bionic visual adaptation function based on multilayer γ-InSe flakes. Light Sci. Appl. 2023, 12, 180. [Google Scholar] [CrossRef] [PubMed]
- Kundakçi, M.; Gürbulak, B.; Doğan, S.; Ateş, A.; Yildirim, M. Urbach tail and electric field influence on optical properties of InSe and InSe:Er single crystals. Appl. Phys. A 2008, 90, 479. [Google Scholar] [CrossRef]
- Gürbulak, B. Urbach Tail and Optical investigations of Gd doped and undoped InSe single crystals. Phys. Scr. 2004, 70, 197. [Google Scholar] [CrossRef]
- Cody, G.D.; Tiedje, T.; Abeles, B.; Brooks, B.; Goldstein, Y. Disorder and the optical-absorption edge of hydrogenated amorphous silicon. Phys. Rev. Lett. 1981, 47, 1480. [Google Scholar] [CrossRef]
- Abay, B.; Güder, H.S.; Efeoğlu, H.; Yoğurtçu, Y.K. Temperature dependence of the optical energy gap and Urbach Martienssen’s tail in the absorption spectra of the layered semiconductor Tl2GaInSe44. J. Phys. Chem. Solids 2001, 62, 747. [Google Scholar] [CrossRef]
- Moddel, G.; Anderson, D.A.; Paul, W. Derivation of the low-energy optical-absorption spectra of a-Si:H from photoconductivity. Phys. Rev. B 1980, 22, 1918. [Google Scholar] [CrossRef]
- Loveland, R.J.; Spear, W.E.; Al-Sharbaty, A. Photoconductivity and absorption in amorphous Si. J. Non-Crystal. Solids 1973, 13, 55. [Google Scholar] [CrossRef]
- Varshni, Y.P. Temperature dependence of the energy gap in semiconductors. Physica 1967, 34, 149. [Google Scholar] [CrossRef]
- Lantenschlager, P.; Garriga, M.; Logothetidis, S.; Cardona, M. Interband critical points of GaAs and their temperature dependence. Phys. Rev. B 1987, 35, 9174. [Google Scholar] [CrossRef] [PubMed]
- Hao, Q.; Yi, H.; Su, H.; Wei, B.; Wang, Z.; Lao, Z.; Chai, Y.; Wang, Z.; Jin, C.; Dai, J.; et al. Phase identification and strong second harmonic generation in pure ε-InSe and its alloys. Nano Lett. 2019, 19, 2634. [Google Scholar] [CrossRef] [PubMed]
- Quereda, J.; Ghiasi, S.T.; van Zwol, F.A.; van der Wal, C.H.; van Wees, B.J. Observation of bright and dark exciton transitions in monolayer MoSe2 by photocurrent spectroscopy. 2D Mater. 2018, 5, 015004. [Google Scholar] [CrossRef]
- Patil, P.D.; Wasala, M.; Ghosh, S.; Lei, S.; Talapatra, S. Broadband photocurrent spectroscopy and temperature dependence of band gap of few-layer indium selenide (InSe). Emerg. Mater. 2021, 4, 1029. [Google Scholar] [CrossRef]
- Trapalis, A.; Farrer, I.; Kennedy, K.; Kean, A.; Sharman, J.; Heffernan, J. Temperature dependence of the band gap of zinc nitride observed in photoluminescence measurements. Appl. Phys. Lett. 2017, 111, 122105. [Google Scholar] [CrossRef]
- Zhu, J.; Xia, Y.; Li, G.; Zhou, S.; Wimmer, S.; Springholz, G.; Pashkin, A.; Helm, M.; Schneider, H. Absorption edge, urbach tail, and electron-phonon interactions in topological insulator Bi2Se3 and band insulator (Bi0.89In0.11)2Se3. Appl. Phys. Lett. 2019, 114, 162105. [Google Scholar] [CrossRef]
- Rincón, C.; Wasim, S.M.; Marín, G.; Márquez, R.; Nieves, L.; Sánchez Pérez, G.; Medina, E. Temperature dependence of the optical energy gap and Urbach’s energy of CuIn5Se8. J. Appl. Phys. 2001, 90, 4423. [Google Scholar] [CrossRef]
- Hwang, Y.; Choi, J.; Ha, Y.; Cho, S.; Park, H. Electronic and optical properties of layered chalcogenide FeIn2Se4. Curr. Appl. Phys. 2020, 20, 212. [Google Scholar] [CrossRef]
- Wasim, S.M.; Marín, G.; Marquez, R.; Rincón, C. On the effect of structural disorders on the Urbach’s tails of ternary chalcopyrite semiconductors and related ordered defect compounds. J. Appl. Phys. 2020, 127, 035703. [Google Scholar] [CrossRef]
- Pejova, B.; Abay, B.; Bineva, I. Temperature dependence of the band-gap energy and sub-band-gap absorption tails in strongly quantized ZnSe nanocrystals deposited as thin films. J. Phys. Chem. 2010, C114, 15280. [Google Scholar] [CrossRef]
- Rudenko, A.N.; Katsnelson, M.I.; Gornostyrev, Y.N. Dislocation structure and mobility in the layered semiconductor InSe: A first-principles study. 2D Mater. 2021, 8, 045028. [Google Scholar] [CrossRef]


| Varshni | Eg(0) (eV) | (eV/K) | β (K) |
| 1.221 ± 0.002 | 4.6 × 10⁻⁴ | 279 ± 10 | |
| Bose–Einstein | Eg(0) (eV) | (meV) | (K) |
| 1.220 ± 0.002 | 20.6 ± 0.5 | 205 ± 10 |
Disclaimer/Publisher’s Note: The statements, opinions and data contained in all publications are solely those of the individual author(s) and contributor(s) and not of MDPI and/or the editor(s). MDPI and/or the editor(s) disclaim responsibility for any injury to people or property resulting from any ideas, methods, instructions or products referred to in the content. |
© 2024 by the authors. Licensee MDPI, Basel, Switzerland. This article is an open access article distributed under the terms and conditions of the Creative Commons Attribution (CC BY) license (https://creativecommons.org/licenses/by/4.0/).
Share and Cite
Wu, W.-T.; Tiong, K.-K.; Tan, S.-W.; Hu, S.-Y.; Lee, Y.-C.; Chen, R.-S.; Wu, C.-T. Optical Study on Temperature-Dependent Absorption Edge of γ-InSe-Layered Semiconductor. Appl. Sci. 2024, 14, 6676. https://doi.org/10.3390/app14156676
Wu W-T, Tiong K-K, Tan S-W, Hu S-Y, Lee Y-C, Chen R-S, Wu C-T. Optical Study on Temperature-Dependent Absorption Edge of γ-InSe-Layered Semiconductor. Applied Sciences. 2024; 14(15):6676. https://doi.org/10.3390/app14156676
Chicago/Turabian StyleWu, Wen-Te, Kwong-Kau Tiong, Shih-Wei Tan, Sheng-Yao Hu, Yueh-Chien Lee, Ruei-San Chen, and Chia-Ti Wu. 2024. "Optical Study on Temperature-Dependent Absorption Edge of γ-InSe-Layered Semiconductor" Applied Sciences 14, no. 15: 6676. https://doi.org/10.3390/app14156676
APA StyleWu, W.-T., Tiong, K.-K., Tan, S.-W., Hu, S.-Y., Lee, Y.-C., Chen, R.-S., & Wu, C.-T. (2024). Optical Study on Temperature-Dependent Absorption Edge of γ-InSe-Layered Semiconductor. Applied Sciences, 14(15), 6676. https://doi.org/10.3390/app14156676