Article

Compressive Strength Comparison of Different Orthodontic Metal Bracket Systems

by
Çağan Erkman Şaylan
and
Mehmet Birol Özel
*
Department of Orthodontics, Kocaeli University Faculty of Dentistry, 41190 Kocaeli, Turkey
*
Author to whom correspondence should be addressed.
Appl. Sci. 2024, 14(15), 6692; https://doi.org/10.3390/app14156692
Submission received: 5 July 2024 / Revised: 28 July 2024 / Accepted: 28 July 2024 / Published: 31 July 2024
(This article belongs to the Special Issue Advanced Dental Materials and Its Applications)

Abstract

:
Rebonding of orthodontic brackets to new positions during treatment with fixed orthodontic appliances is a common practice and it is important not to cause plastic deformation during bracket removal. The aim of this study was to evaluate the resistance of various brackets to compression and assess their thresholds for plastic deformation. 5 different groups of metal brackets (BioQuick, Damon Q, Experience, Mini Diamond, Mini Sprint II) were bonded to 85 extracted human central incisor teeth utilizing the same adhesive system (Transbond XT). Compressive forces were applied via Weingart forceps in order to mimic clinical setting with the Shimadzu Universal tester. Kruskall-Wallis and Mann-Whitney U tests were used for comparing groups. Damon Q group exhibited the highest yield point value (549.35 N), the highest ultimate strength value (764.50 N) and the highest failure/debonding point value (721.89 N). The lowest yield point value (211.73 N), the lowest ultimate strength value (224.07 N) and the lowest failure/debonding point value (121.71 N) were found in the Mini Diamond group. The ultimate strength point values of Damon Q and Experience brackets were higher compared to Mini Diamond, BioQuick and Mini Sprint II brackets (p < 0.05). No statistically significant difference between Damon Q and Experience brackets in terms of yield strength and ultimate strength values (p > 0.05) were observed. Adhesive Remnant Index (ARI) score was 3 for all debonded samples. It may be concluded that Damon Q brackets were more resistant to plastic deformation than Mini Diamond, BioQuick and Mini Sprint II brackets (p < 0.05).

1. Introduction

In orthodontic clinical practice, the rebonding process of brackets to their new positions is a commonly utilized technique, nearly ubiquitous in orthodontic treatment. Clinicians may remove and rebond brackets to achieve better positioning [1]. Various methods are employed for the removal of orthodontic brackets, including mechanical, ultrasonic, electrothermal, and laser techniques. Among these, mechanical debonding methods are most commonly preferred in clinical practice [2]. Debonding orthodontic brackets can cause enamel damage, even if it is not evident clinically or under microscopic examination [3]. The procedures for debonding and clean-up that result in the minimal enamel volume loss remain a topic of debate [4]. A successful debonding procedure is based on the principle of preserving a sound enamel structure without causing iatrogenic damage.
Instruments used for the mechanical removal of metal brackets include Weingart pliers, Howe pliers, band removing pliers, ligature cutters, debonding pliers, and the Lift Off Debonding Instrument (LODI). Hand instruments like Weingart pliers typically apply compression force in the mesio-distal direction to facilitate bracket debonding from the tooth surface. It is believed that with this method, a significant portion of the adhesive resin remains on the tooth surface, minimizing stress on the enamel [5,6].
Biomechanical analyses using finite element method have investigated shear, compression, frontal torque, and lateral torque forces, common in debonding procedures, and have found bracket wing compression to be the gentlest method in terms of enamel and periodontal ligament preservation. It has been concluded that undesired torque during bracket detachment can be easily prevented with bracket wing compression, thus avoiding additional loading on the periodontal ligament or alveolar bone [7,8].
When subjected to force, all solid materials can undergo deformation. Up to a certain force, a material returns to its original dimensions when the load is removed. The return to the original dimensions upon removal of the load is known as elastic behavior. The load beyond which the material no longer exhibits elastic behavior is called the elastic limit. If the elastic limit is exceeded, the material undergoes permanent deformation or a change in shape. A material that has undergone permanent deformation is said to have undergone plastic deformation.
Considering rising costs and sustainability, it is imperative for brackets to be resilient and resistant to plastic deformation when being debonded from teeth. Deformation during bracket removal can occur in the wings, base, or slot of the bracket. In any of these cases, reuse of the bracket and subsequent reworking with the respective bracket become impossible [9]. Therefore, the resistance of brackets to plastic deformation is crucial during rebonding procedures.
In the literature, numerous studies have measured the bond strengths of different brackets and adhesives during bracket debonding and compared them with different debonding techniques [10,11,12,13,14,15,16]. Additionally, there are studies examining plastic deformations resulting from torque forces applied by orthodontic wires [17,18]. However, no studies investigating the plastic deformation incurred by different metal brackets during compression force application for removal could be found in the literature.
In our study, we aim to compare the compression strengths and resistance to plastic deformation of different metal brackets, and to determine which bracket system is more preferable for rebonding and reusability. This research is anticipated to contribute to the national and international literature on the plastic deformation characteristics of brackets.
Null Hypothesis (H0).
There is no significant difference in the resistance to plastic deformation and compressive strengths among the five different types of metal brackets tested in this study.

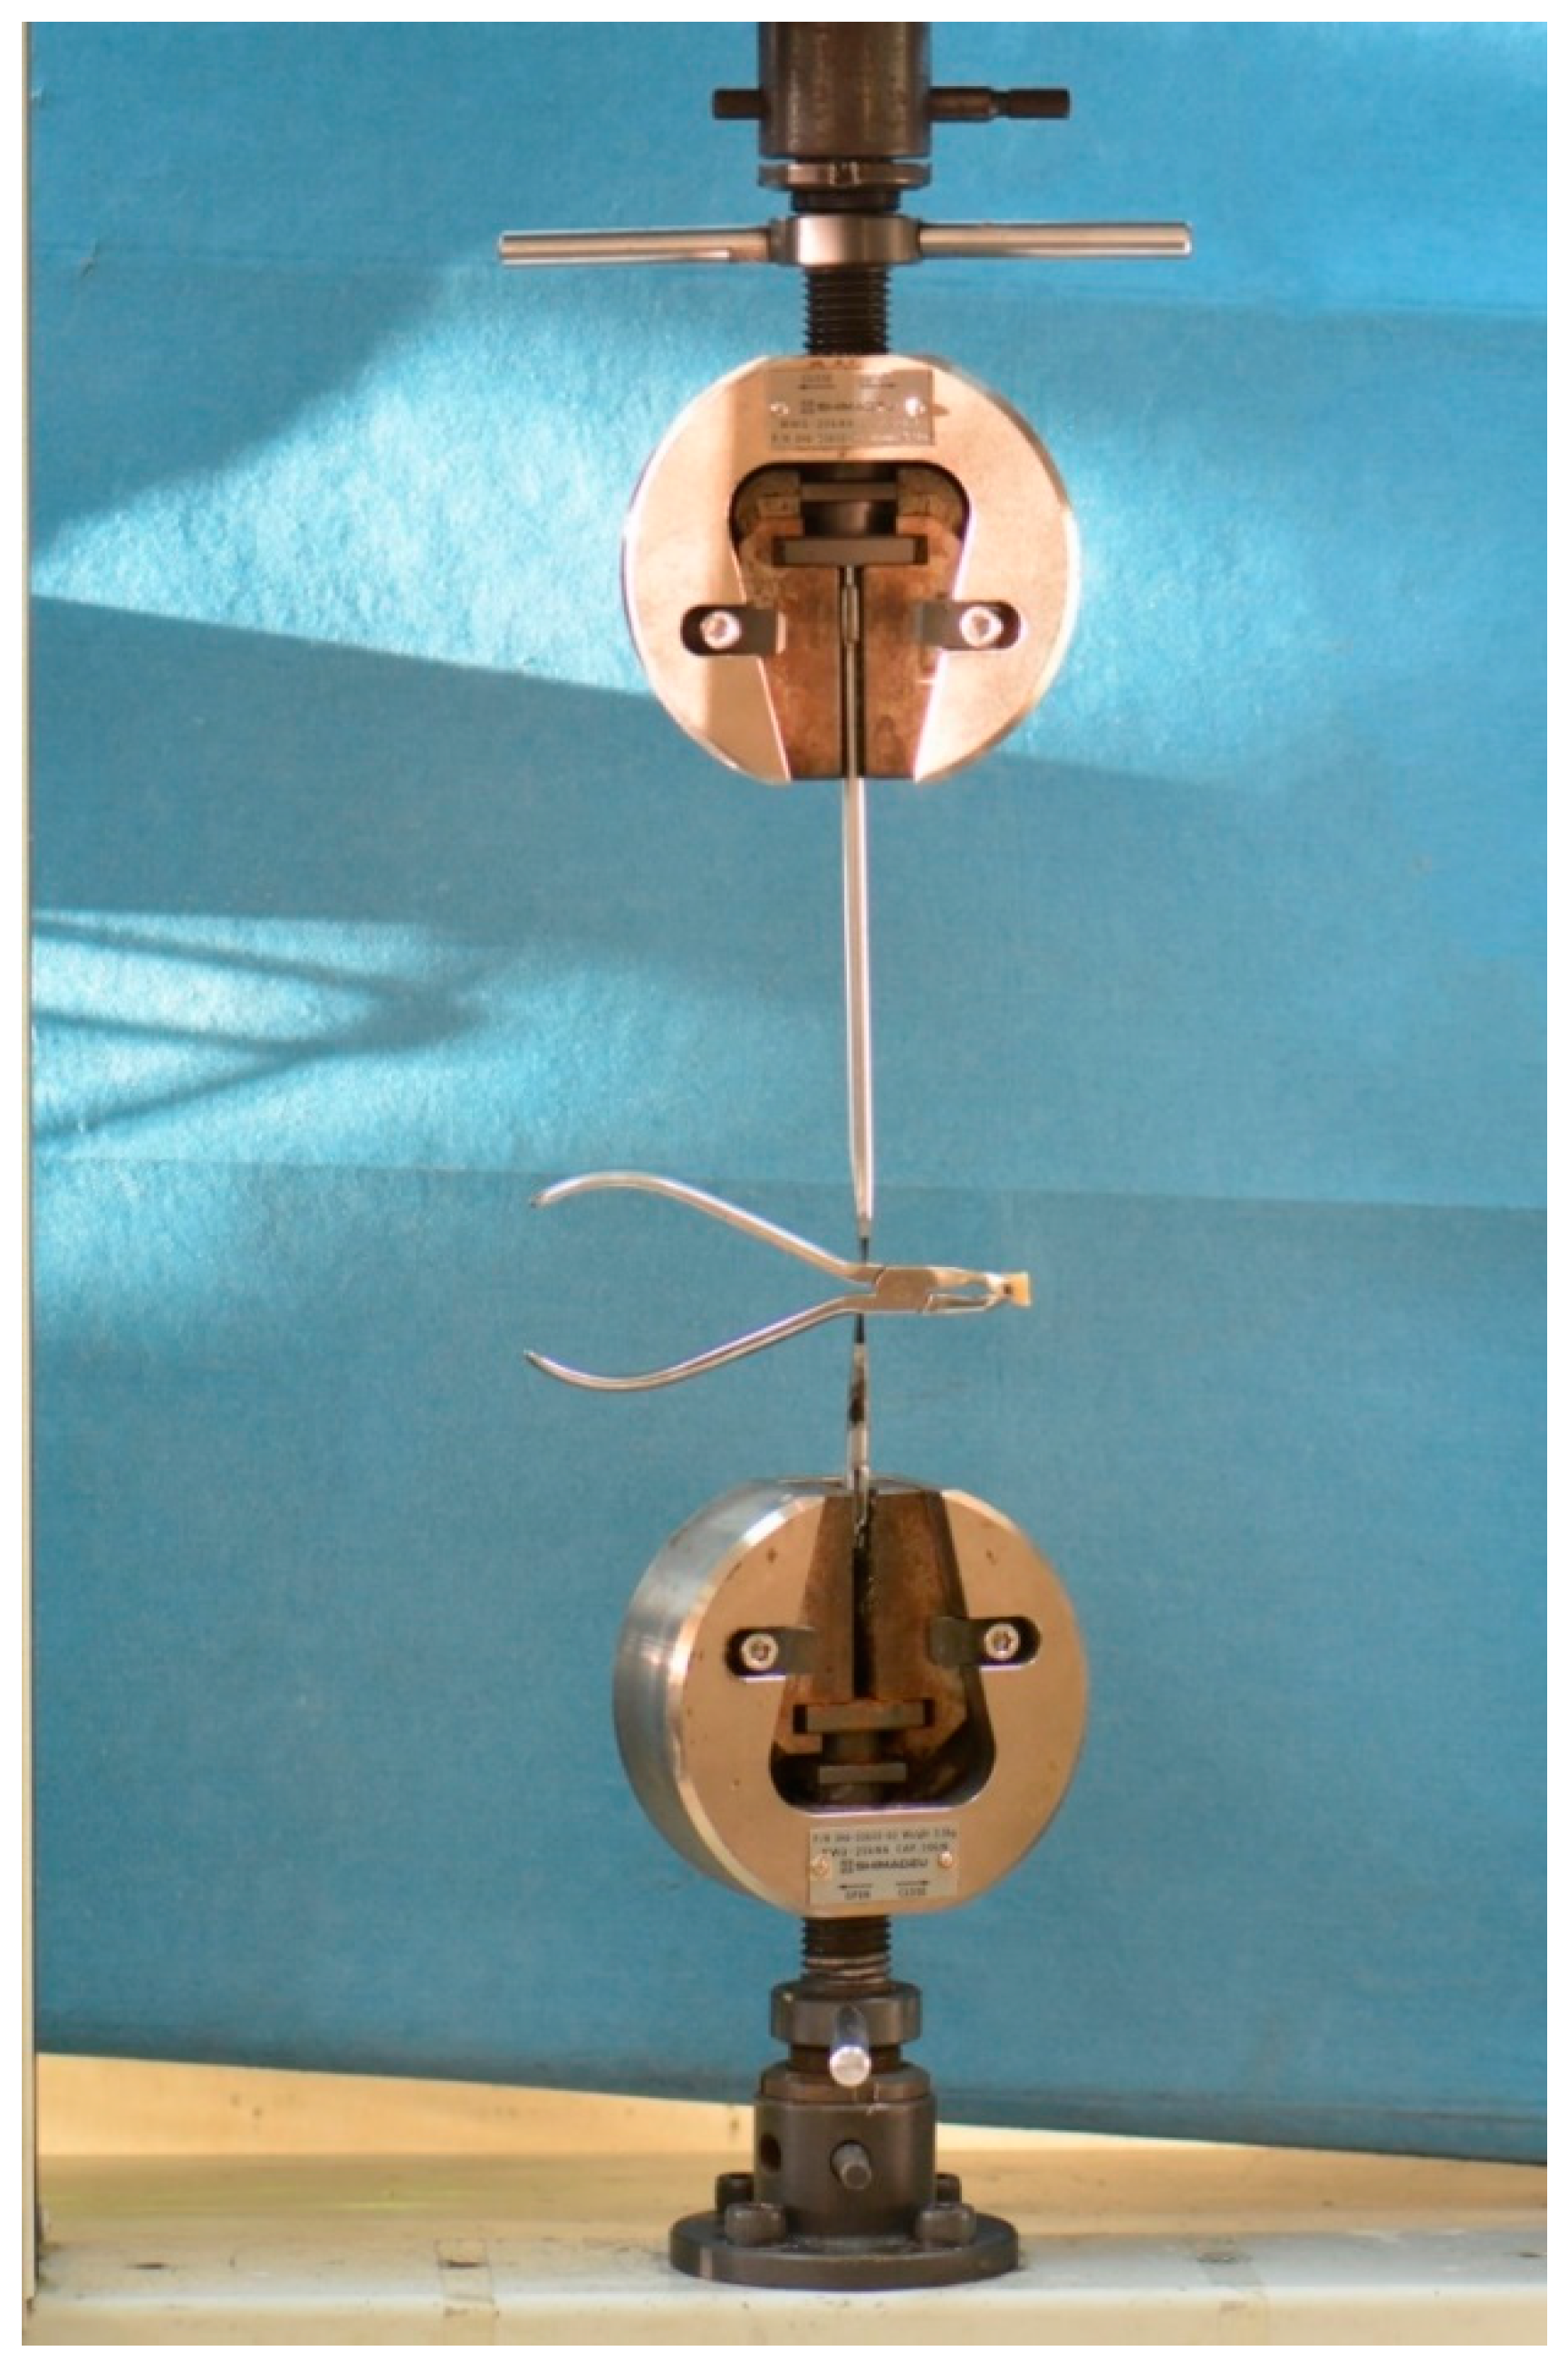
2. Materials and Methods

This study received approval from the Kocaeli University Non-Interventional Clinical Research Ethics Committee on 21 September 2023, with approval number KÜ GOKAEK-2023/15.20.
Our research was designed as an in vitro experimental study modeling the application of compression forces and orthodontic debonding methods in living tissues.
Samples for our study were collected from patients who applied to the Department of Oral and Maxillofacial Surgery at Kocaeli University Faculty of Dentistry for treatment purposes. A total of 85 upper central incisors were used, with 17 teeth in each group. Inclusion criteria for teeth in the study were as follows:
  • No cracks or fractures in the enamel
  • No fillings or restorations on the teeth
  • Teeth should not have undergone root canal treatment
  • No discoloration due to reasons such as medication usage
  • Teeth should not exhibit major deformations
After extraction, organic debris was removed from the teeth, and they were washed, dried, and stored in a surgical specimen container in a dark and cool environment with a 0.1% thymol solution for up to 4 weeks.
A total of 85 brackets were used in our study, with 17 brackets from each bracket model. These brackets were: BioQuick® (Forestadent, Pforzheim, Germany), Damon Q (Ormco Corp., Orange, CA, USA), Experience M (GC, Breckerfeld, Germany), Mini Diamond (Ormco Corp., Orange, CA, USA), and Mini Sprint®II (Forestadent, Pforzheim, Germany) brackets (Figure 1).
The base areas of the brackets were measured and recorded as follows:
Mini Diamond: 11.73 mm², Damon Q: 10.51 mm², BioQuick: 11.13 mm², Experience: 10.40 mm², Mini Sprint II: 9.61 mm².
The sample size was calculated using G*Power Software (version 3.1.9.7), with an effect size of 0.4, “α” = 0.05, and power of 0.80 for a priori power analysis. Accordingly, the basic sample size for 5 study groups was calculated to be at least 80 (16 × 5). Considering the possibility of losing a sample during procedures, 17 samples were included in each group.
After being removed from the thymol solution, the collected central incisors were rinsed and dried. The vestibular surfaces of the teeth were cleaned using a low-speed polishing cup with a fluoride-free water-pumice mixture for 15 s, followed by rinsing and drying with oil-free air. A 37% phosphoric acid gel was applied to the buccal surfaces of the dried teeth for 30 s. Subsequently, the teeth were rinsed with water for 30 s and dried with oil-free air for 10 s. Once an opaque white surface was observed, a thin layer of TransbondTM XT Light Cure Adhesive Primer (3M Unitek, Monrovia, CA, USA) was applied to the tooth surface.
Individual brackets were then removed from their storage containers. TransbondTM XT adhesive resin was placed on the base of each bracket and positioned on the buccal surface of the tooth. The brackets were aligned on the tooth surface and gently pressed into place (Figure 2).
The brackets were light-cured for thirty seconds using the Light-Emitting Diode (LED) curing unit, model Elipar S10, manufactured by 3M ESPE (3M ESPE, Seefeld, Germany), with a light intensity capacity of 1200 mW/cm². The intensity of the light-curing unit was measured using the built-in radiometer in the EliparTM S10 LED Curing Light’s charging station. This ensures that measurements are taken before each curing session, confirming that the light intensity levels remain consistent. Subsequently, the teeth were stored in distilled water at 37 °C in specimen containers for one week to allow for the final polymerization of the adhesive resin. Prior to the experiment, the specimens were removed from the specimen containers and lined up (Figure 3).
The compression process of the brackets was conducted using a Universal Testing Machine (Shimadzu AG-X, Kyoto, Japan) with a Weingart plier (Dentaurum, Ispringen, Germany). A specially designed apparatus held the Weingart plier in the testing machine. To prevent slippage of the specially designed tips transferring compression force from the test device to the Weingart plier and to ensure its stability, a minimal groove was created on the Weingart plier. The tips of the Weingart plier were positioned mesio-distally on the wings of the brackets. Thus, the Universal Testing Machine applied compression force to the Weingart plier.
The Weingart plier applied compression force to the specimens until debonding or forceps dropped the sample due to plastic deformation (Figure 4). The crosshead speed was 1 mm per minute. Compression forces were recorded in Newtons. The onset of plastic deformation (yield point), maximum resistance point, and failure/debond points were recorded. The experimental set up is displayed on Figure 5 and Figure 6. Force was applied along the green line. The red line denotes the center of rotation. The distance “a” indicates the moment arm between the applied force and the center of rotation, while “b” represents the moment arm between the center of rotation and the sample. The actual force applied was calculated by comparing the distance between the point of force application and the point of force application. For samples resulting in debonding, the adhesive remnant index (ARI) scoring was performed using a Leica MZ16FA stereomicroscope (Leica Microsystems Ltd., Heerbrugg, Switzerland) to determine the location of fracture post-debonding.

3. Results

The average yield point of the obtained groups from the experiments is presented in Figure 7.
Descriptive statistics of the experiment results are provided in Table 1. Upon examining Table 1, it can be observed that the highest yield point value, the highest ultimate strength value, and finally the highest failure/debonding value belong to the Damon Q group, while the lowest values are observed in the Mini Diamond group.
The %0.02 offset yield point values, which represent the onset of significant plastic deformation in the stress-strain curves of the samples, were calculated as shown in Figure 8.
Following the analysis of descriptive statistics, Z-Score analysis was conducted to detect outliers in the datasets. Outliers in each dataset were identified and removed, minimizing the potential adverse effects during the test of group means. In datasets where no outliers were found, the value closest to the mean was removed to maintain the distribution, ensuring that all sets contained the same number of data points.
To assess whether the obtained data followed a normal distribution, the Shapiro-Wilk test was performed. The results of the normality test for the experiment outcomes are presented in Table 2.
The hypothesis that the data follows a normal distribution was tested at a 95% confidence interval. When examining the Yield Point experiment sets, the p-values for groups E, MS, and D fell into the rejection region (<0.05), indicating that they did not exhibit a normal distribution. Similarly, in the Maximum Strength Point experiment set, the E values did not follow a normal distribution. For the Drop/Debond values, only the BQ set showed a normal distribution. Considering this, the non-parametric Kruskal-Wallis method was chosen instead of the parametric ANOVA method to test the group means.
Separate Kruskal-Wallis (KW) analyses were conducted for each experiment. The KW results for the Yield Point experiment are presented in Table 3. Upon examining the values in Table 3, it is noted that the significance level is well below 0.05, indicating a significant difference between the groups. This test allows the identification of at least one group that is different from the others.
Mann-Whitney U test was applied to examine the differences between the groups separately for the Yield Point experiment. However, applying the Mann-Whitney U test alone may increase the risk of false positives, so a new p-value was obtained using Bonferroni correction. The results of the Mann-Whitney U test for pairwise comparisons of the five different groups in the Yield Point experiment are provided in Table 4.
Upon examining the pairwise comparisons, significant differences were found between the MD-MS, MD-E, MD-D, BQ-E, MS-D, and BQ-D groups. No significant differences were found between the MD-BQ, BQ-MS, E-D, and MS-E groups for the Yield Point values.
The Kruskal-Wallis analysis results for the Ultimate Strength Point experiment data are presented in Table 5. Since the p-value after the Kruskal-Wallis test is less than 0.05, at least one group in this experiment set shows a difference in means.
Mann-Whitney U test was conducted for pairwise analysis of the groups, and the results are provided in Table 6. Upon examining Table 6, no significant difference was found between the MD-BQ, BQ-MS, and E-D groups. However, significant differences were observed between the MD-MS, MD-E, MD-D, BQ-E, BQ-D, MS-E, and MS-D groups.
The Kruskal-Wallis analysis results for the Debond/Failure experiment data are presented in Table 7. The obtained p-value is less than 0.05, indicating that there is at least one group with a statistically significant difference in mean within this experiment set.
Pairwise comparisons of the groups are presented in Table 8. Upon examination of Table 8, significant differences were observed among the MD-MS, MD-E, MD-D, BQ-E, BQ-D, and MS-D groups.
Although most of the samples fell off from the tip of the forceps due to plastic deformation, some of them experienced debonding at the adhesive interface. The bond strength results obtained from the tests completed by the debonding of the bracket from the enamel surface are presented in Table 9.
The results of this study led to the rejection of the null hypothesis, indicating that there are significant differences in the resistance to plastic deformation and compressive strengths among the five types of metal brackets tested.
In experiments resulting with debonding, the Adhesive Remnant Index (ARI) scoring was conducted based on the amount of adhesive remaining on the tooth surface. All debonded samples exhibited an ARI score of 3 (Figure 9), and the relevant scores were evaluated using the Chi-square test. There was no statistically significant difference found among the groups (100% ARI 3, p = 1.000).

4. Discussion

To ensure reproducible results, standardization, and the isolated measurement of compression forces for accurately assessing the plastic deformation of metal brackets, our study was designed as in vitro research. In our study, the compression of bracket wings using Weingart forceps (Dentaurum, Ispringen, Germany) was selected as the method to compare bracket debonding. This approach was supported by Holberg et al.’s study results showing unwanted torque forces could be avoided through compression debonding, which does not exert additional loads on the periodontal ligament and alveolar bone [7,8], which was found to be the healthiest method for enamel and periodontal tissues.
In our study, compressive debonding forces were investigated, and no previous studies were found evaluating plastic deformation and yield point using this method. Considering that mesiodistal compression of the bracket wings creates a relatively bilateral tensile force in the bracket-adhesive-enamel system before debonding, only the Mini Diamond bracket in our study exhibited a lower average debonding force than the OmniArch bracket in Valletta et al.’s study (121.71 N ± 20.52 N) [19]. All other brackets demonstrated higher bond strength. The onset of plastic deformation was less than half the average of the Mini Diamond model, the lowest in our study. These higher values in our study could be attributed to the use of different teeth, brackets, and debonding methods. Consistent with Valletta et al.’s results, all specimens in our study exhibited an ARI Score of 3, indicating that resin remained entirely on the enamel surface under the influence of a relative tensile force.
The bond strength values obtained in our study differ from Ahmed et al. [20] results. In our study, isolated compression forces were applied in vitro, so the forces calculated in Newtons did not fully impact the bracket-adhesive-enamel system, with a significant portion absorbed by plastic deformation. Considering the differences in teeth, bracket brands, separation tools, and the application of isolated compression forces, the higher bond strength values in our study can be understood.
In this research, forces were applied to the bracket wings in the mesiodistal direction. Although most samples dropped due to plastic deformation, the average values were much higher for the samples that resulted in debonding in our study. Unlike Linjawi et al.’s findings [21], all samples in our study that debonded under compression force had an ARI Score of 3. However, these values must be considered in the context of different experimental settings, brackets, devices, and debonding instruments. In addition, Olsen et al. found that an ARI Score of 3 caused the least damage to the enamel [22], and Oliver [5] noted that the amount of residual composite resin depends on the method used for bracket removal. Although it may not be clinically feasible to remove brackets with isolated compression as in an in vitro environment, it appears to be a safe method for preserving enamel surfaces.
In addition, the results we obtained are different from the results of an average debonding strength of 107.8 kg/cm2) (10.57 MPa) for the shear group and 67.8 kg/cm2 (6.64 MPa) for the diametral compression group found by Bishara et al. [23]. This difference can be attributed to the use of metal brackets in our study instead of ceramic brackets and the ductility of metal materials. Additionally, in our study, isolated compression forces were applied using a Weingart Plier (Dentaurum, Ispringen, Germany). Therefore, the tests resulted more in plastic deformation than debonding. Hence, the assumption that diametral compression in metal brackets would correspond proportionally to tensile forces is invalid for our brackets. Therefore, the values of samples resulting in failure in our study were much higher than those of Bishara et al. [23].
In another study using the Mini Diomond bracket, Jonke et al. [24] bonded Mini Diamond bracket upper lateral brackets to extracted human third molars and measured an average shear bond strength of 20.39 MPa. In contrast, the average bond strength in the Mini Diamond group in our study was 11.73 MPa. These differing bond strength results may be due to Jonke et al.’s use of third molars with smaller lateral incisor brackets and shear force testing. Further research is needed to compare both shear and compression strengths of the Mini Diamond bracket. Furthermore, the shear bond strength (SBS) of five different metal brackets bonded to bovine incisor enamel surfaces was compared by Cozza et al. [25] using Transbond XT (3M Unitek, Monrovia, CA, USA). They reported an average SBS of 200.60 N, 33.00 MPa for Mini Sprint brackets (Forestadent, Pforzheim, Germany). In our study, we used the modified version; Mini Sprint II bracket. Although different debonding methods were applied, and the next generation of the bracket was used, the average values for the Mini Sprint II group in our study were similar, at 318.72 N and 33.18 MPa for the samples that debonded.
Additionally, in a study conducted by Jabr et al. [26], they found the shear bond strength for the Legend maxillary incisor bracket to be 16.9 MPa, with most samples having an ARI score of 2. In our study, we used the Experience model, a self-ligating metal bracket from the same manufacturer (GC Orthodontics), and found all ARI scores to be 3. The compressive bond strength in samples that resulted in debonding was found to be an average of 56.84 MPa. The differences in our study values appear to be due to the use of compressive force to debond the bracket, as opposed to shear force. Moreover, when we compare our results with the results of Su et al. [27], all brackets in our study exhibited higher debond/drop values, possibly due to differences in brackets, adhesive systems, and debonding pliers used. The average bond strength for compression debonding with How pliers was recorded as 80.4 N in Su et al. [27].
In addition, the average shear bond strengths of BioQuick and Damon Q brackets were examined by Jayakrishnan et al. [28], with values determined as 16.80 MPa and 19.23 MPa, respectively. Lo Giudice et al. [29] found an average tensile strength of 4.52 MPa for the Damon Q group. In our study, only one sample from each of the Damon Q and BioQuick groups resulted in debonding under compression forces. The remaining samples experienced drops due to plastic deformation, so that forceps unable to grip the brackets. The debonded samples exhibited values of 68.21 MPa for the Damon Q group and 20.01 MPa for the BioQuick group. The higher values obtained in our study compared to those of Jayakrishnan et al. and Lo Giudice et al. can be attributed to the partial absorption of isolated compression forces by plastic deformation, resulting in less stress on the bracket-adhesive-enamel system.
Despite the numerous studies on bonding strength available in the literature, there is a lack of data regarding the onset of plastic deformation and the yield point in brackets when subjected to the compressive forces encountered during debonding. However, there are multifactorial aspects in the conducted studies that could influence the experiments. Given the different variations in tooth type, bracket type, bracket geometry, test apparatus, cross head speed, type of plier used, and adhesive type in the tests conducted, directly comparing these tests may yield ambiguous results. To mitigate such situations, standardized experimental procedures have been recommended by Stanford et al. [30].
In our study, while the primary aim was to determine the yield strength, which marks the onset of plastic deformation of the selected bracket types in the experimental setup, the maximum strength and failure points were also calculated at the end of the experiment. Although most samples resulted in falling from the tip of the Weingart forceps due to plastic deformation, which provides more insights into plastic deformation and plier grip, the lower occurrence of debonding reduces the number of data points to be analyzed for bond strength evaluation. Nevertheless, it is noteworthy that the average Newton values of samples resulting in debonding and falling were nearly overlapping. While most studies in the literature have focused on shear bond strength, there is a lack of sufficient data regarding bonding strength under isolated compression forces. To better evaluate this relevant force, it is possible to stabilize the samples with a third arm in the experimental setup, ensuring that the experiment concludes with debonding.
The metal brackets used in our research were evaluated with a single type of adhesive system. However, to gain more comprehensive insights into material behavior, it would be beneficial to identify the differences in plastic behavior exhibited with various adhesive systems. Therefore, the same metal bracket systems can also be subjected to experiments using different adhesive systems.

5. Conclusions

Within the limitations of our study;
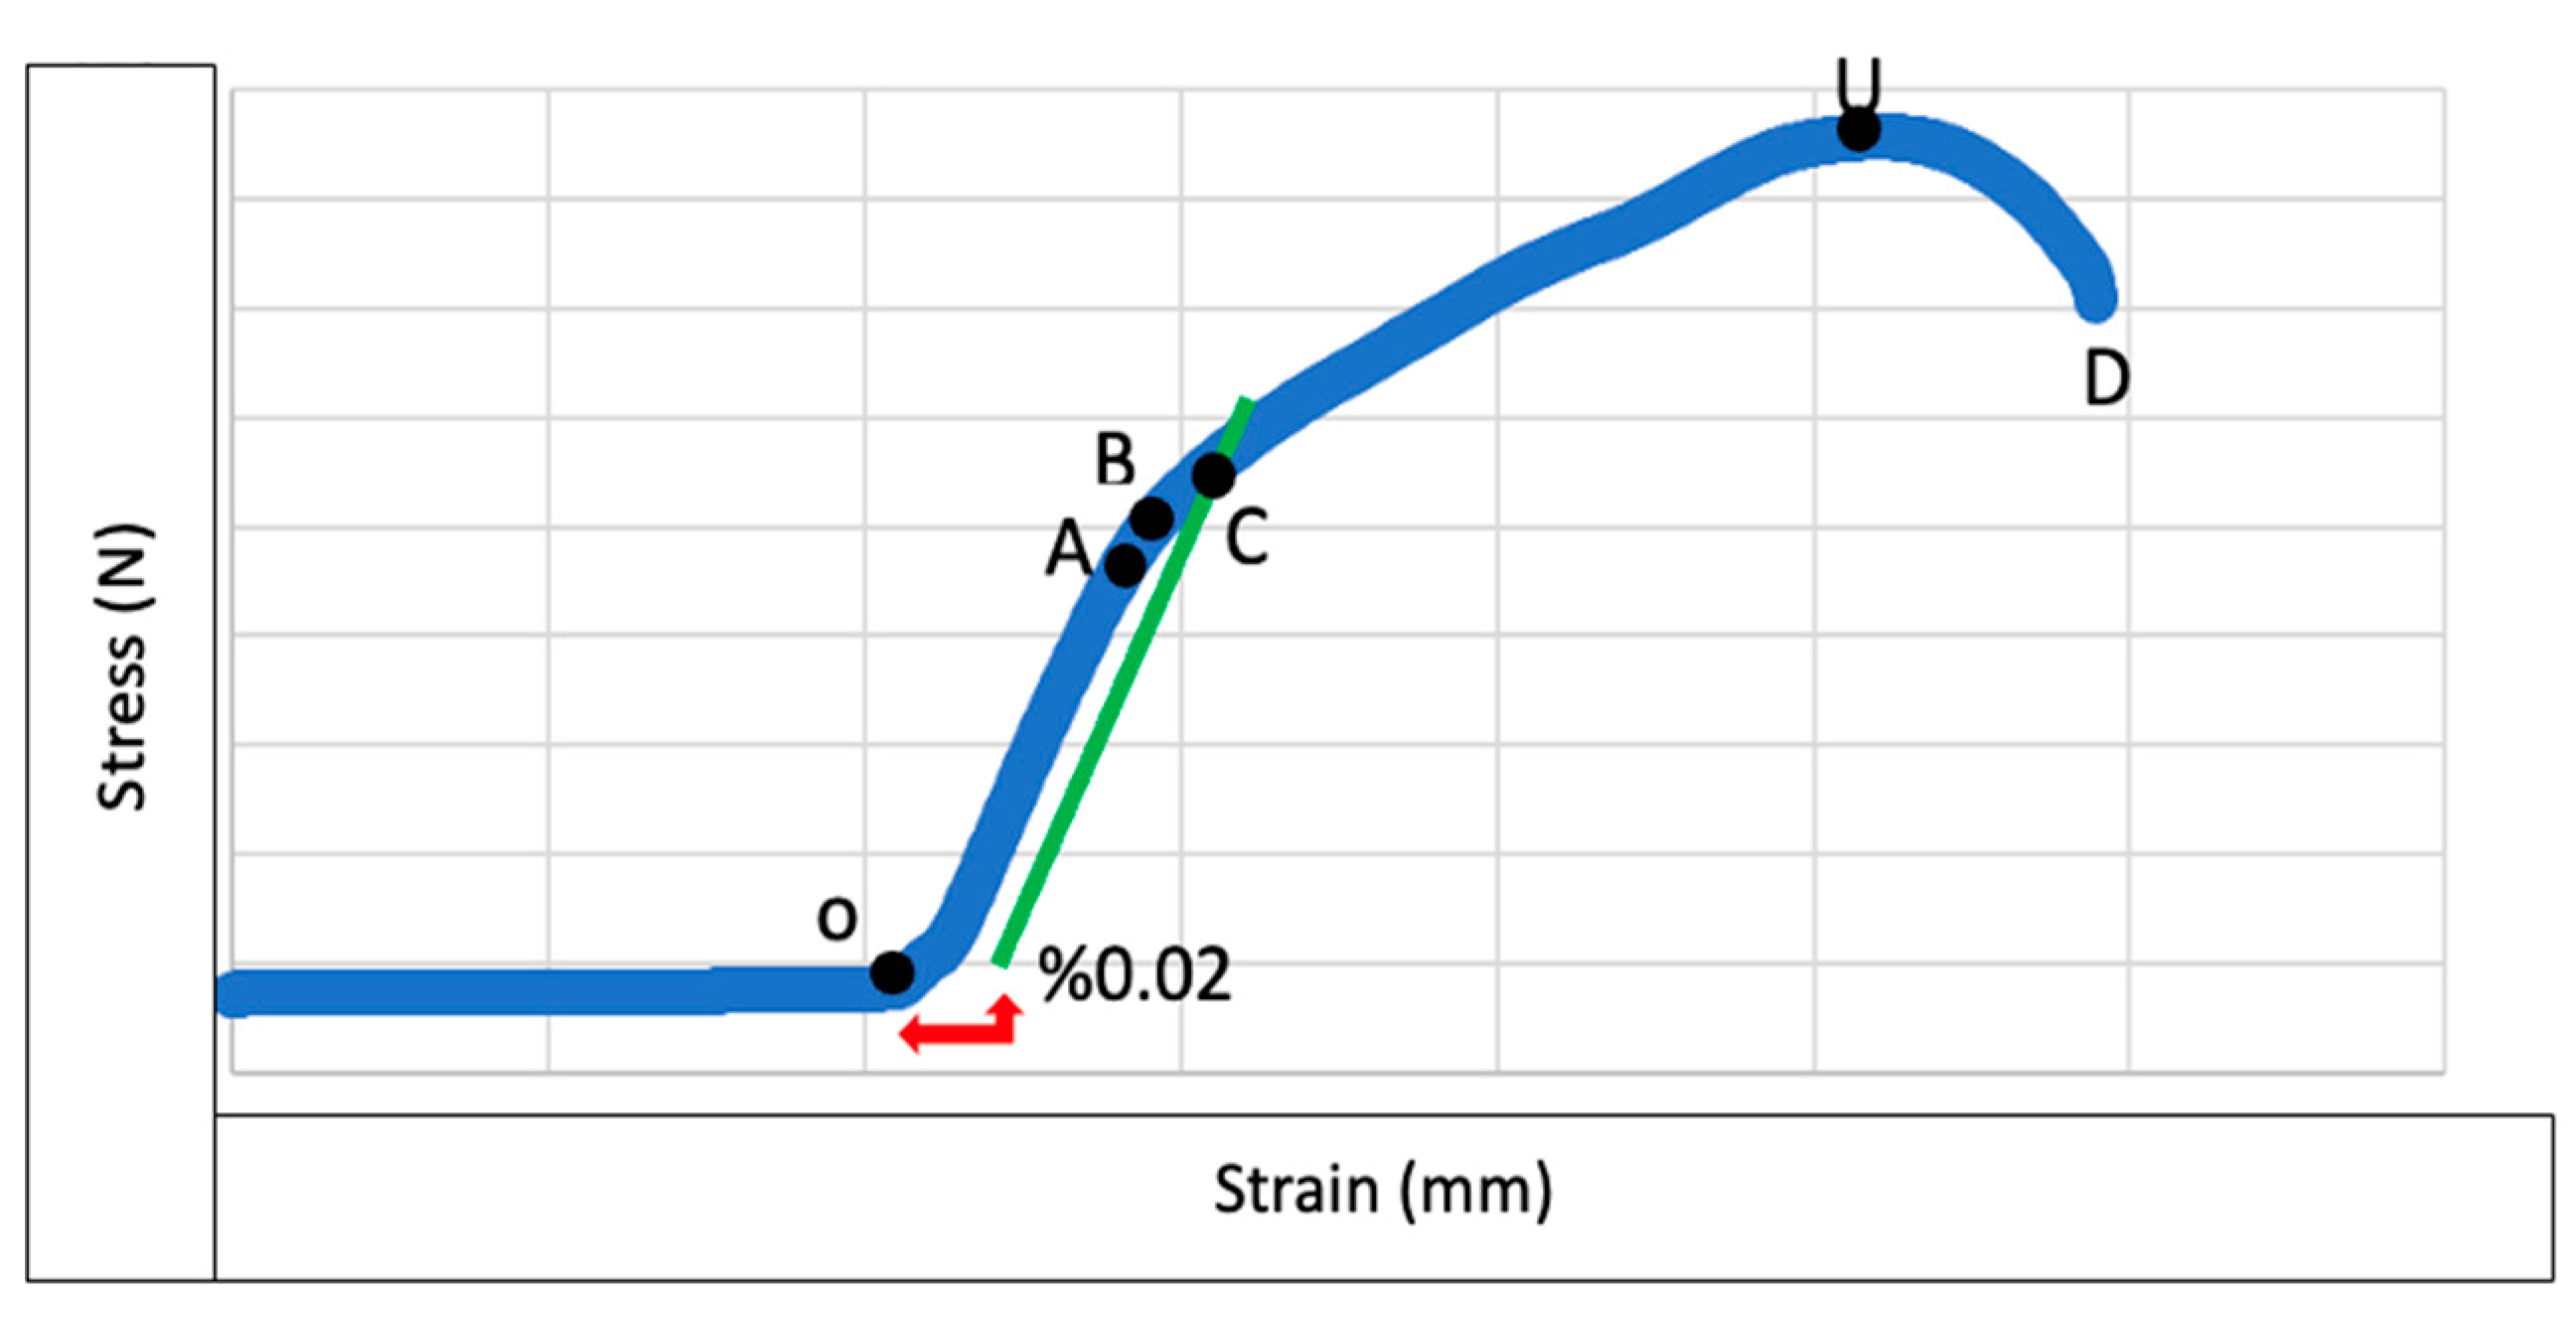
  • Damon Q brackets are more resistant to plastic deformation compared to MiniDiamond, BioQuick, and Mini Sprint II brackets. Although Damon Q brackets exhibited the highest plastic deformation (yield) strength under compression forces, there was no significant difference compared to the Experience group.
  • Damon Q and Experience brackets have higher ultimate strength values compared to Mini Diamond, BioQuick, and Mini Sprint II brackets. Damon Q brackets were the most successful group in terms of ultimate strength values with no significant difference found compared to the Experience group.
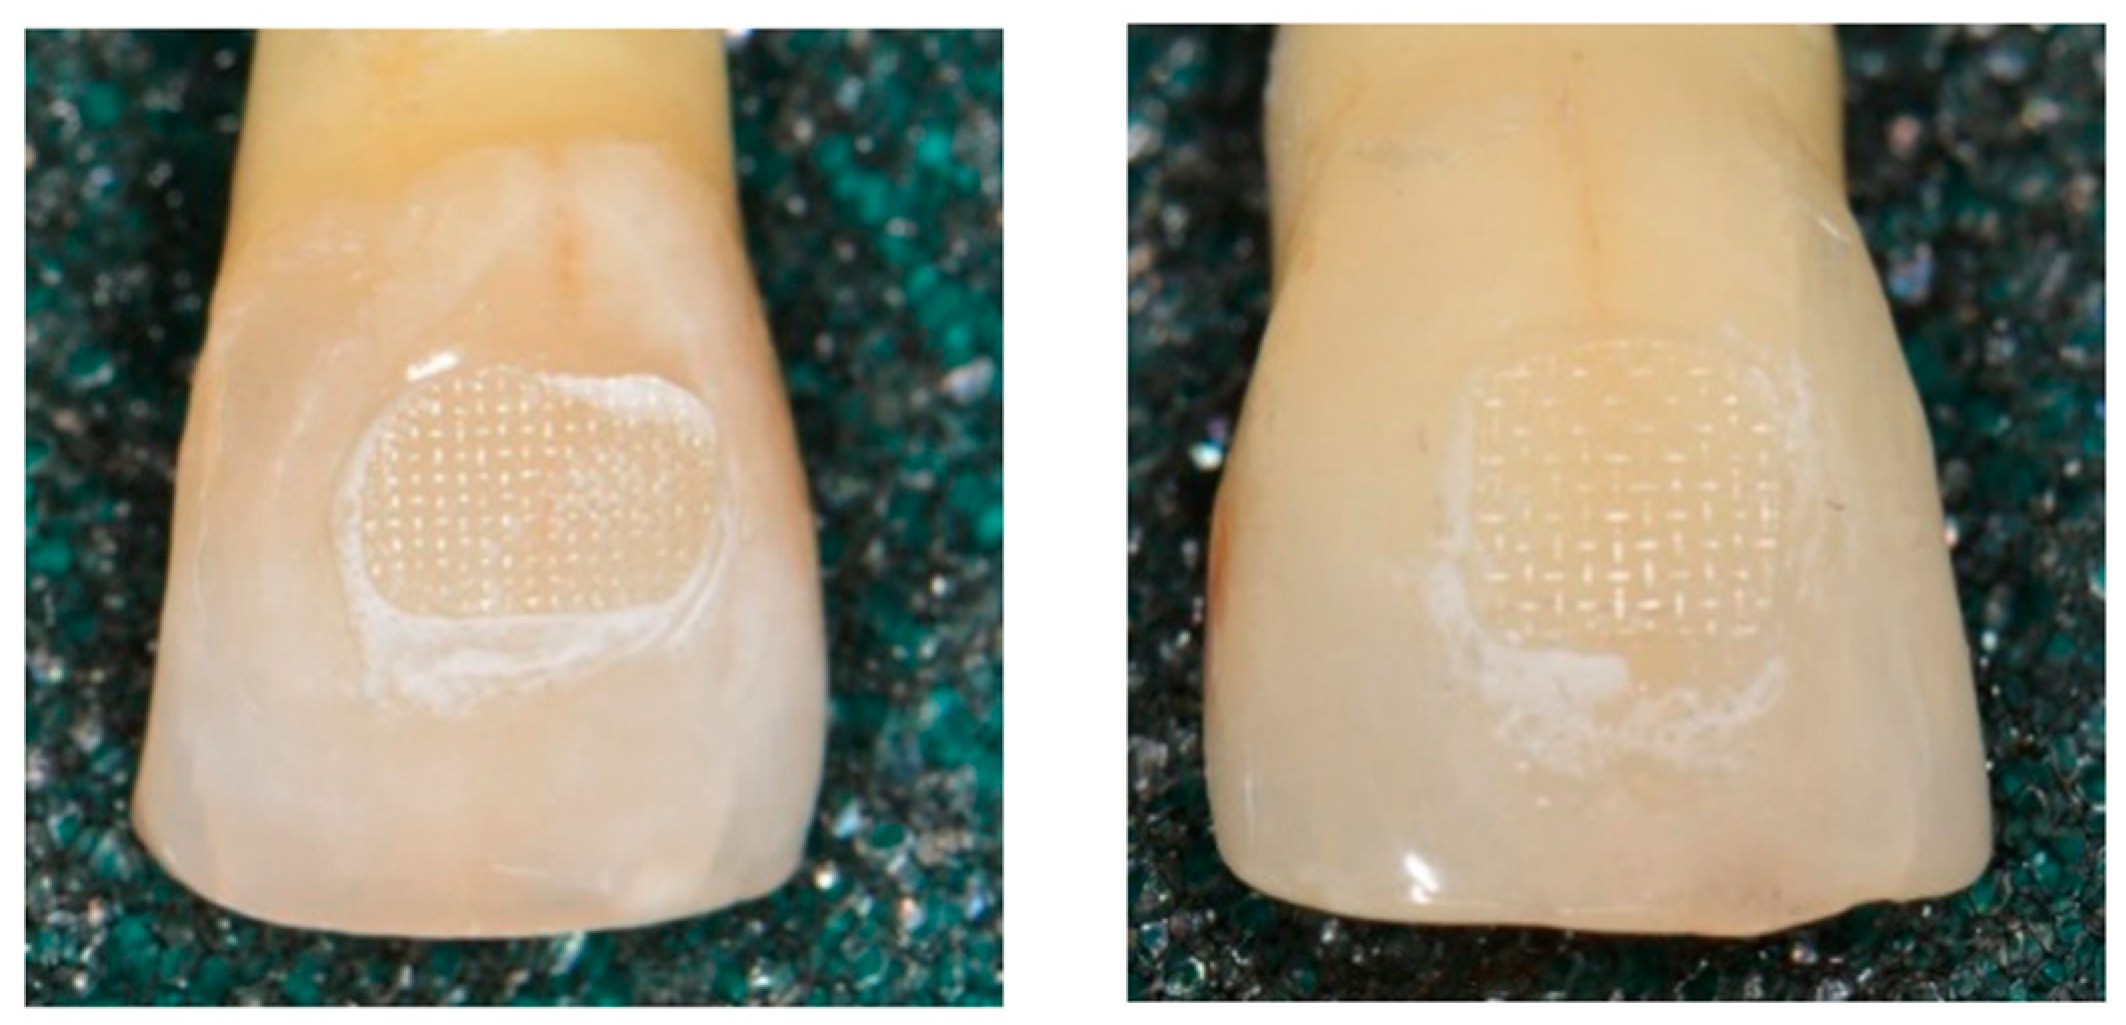
  • There was no significant difference in ARI scores among the brackets used.
Based on the results of this study, clinicians should consider using Damon Q and Experience brackets for treatments where higher resistance to plastic deformation is desired. These brackets may offer better performance in terms of strength and durability during the rebonding process.
In light of our research, conducting more studies on compression forces will provide significant contributions to the orthodontic literature.

Author Contributions

Conceptualization, Ç.E.Ş. and M.B.Ö.; methodology, Ç.E.Ş. and M.B.Ö.; software, Ç.E.Ş.; validation, Ç.E.Ş. and M.B.Ö.; formal analysis, Ç.E.Ş. and M.B.Ö.; investigation, Ç.E.Ş. and M.B.Ö.; resources Ç.E.Ş. and M.B.Ö.; data curation Ç.E.Ş. and M.B.Ö.; writing—original draft preparation, Ç.E.Ş. and M.B.Ö.; writing—review and editing, Ç.E.Ş. and M.B.Ö.; visualization, Ç.E.Ş. and M.B.Ö.; supervision, Ç.E.Ş. and M.B.Ö.; project administration, Ç.E.Ş. and M.B.Ö.; funding acquisition, Ç.E.Ş. and M.B.Ö. All authors have read and agreed to the published version of the manuscript.

Funding

This research received no external funding.

Institutional Review Board Statement

The study was conducted in accordance with the Declaration of Helsinki, and approved by the Ethics Committee of Kocaeli University Non-Interventional Clinical Research Ethics Committee (protocol code KÜ GOKAEK-2023/15.20 and 21 September 2023).

Informed Consent Statement

Not applicable.

Data Availability Statement

The data presented in this study are available on request from the corresponding author.

Acknowledgments

We would like to thank Murat Baydoğan and Erdem Balcı from the Istanbul Technical University Department of Metallurgy and Materials Engineering for their support during the laboratory phase of this study. We also extend our gratitude to Eyyup Ensar Başakın for his contributions to the statistical analysis.

Conflicts of Interest

The authors declare no conflict of interest.

References

  1. Koo, B.C.; Chung, C.-H.; Vanarsdall, R.L. Comparison of the Accuracy of Bracket Placement between Direct and Indirect Bonding Techniques. Am. J. Orthod. Dentofac. Orthop. 1999, 116, 346–351. [Google Scholar] [CrossRef] [PubMed]
  2. Fan, X.-C.; Chen, L.; Huang, X.-F. Effects of Various Debonding and Adhesive Clearance Methods on Enamel Surface: An in Vitro Study. BMC Oral Health 2017, 17, 58. [Google Scholar] [CrossRef] [PubMed]
  3. Pinho, M.; Manso, M.C.; Almeida, R.F.; Martin, C.; Carvalho, Ó.; Henriques, B.; Silva, F.; Pinhão Ferreira, A.; Souza, J.C.M. Bond Strength of Metallic or Ceramic Orthodontic Brackets to Enamel, Acrylic, or Porcelain Surfaces. Materials 2020, 13, 5197. [Google Scholar] [CrossRef] [PubMed]
  4. Paolone, G.; Mandurino, M.; Baldani, S.; Paolone, M.G.; Goracci, C.; Scolavino, S.; Gherlone, E.; Cantatore, G.; Gastaldi, G. Quantitative Volumetric Enamel Loss after Orthodontic Debracketing/Debonding and Clean-Up Procedures: A Systematic Review. Appl. Sci. 2023, 13, 5369. [Google Scholar] [CrossRef]
  5. Oliver, R.G. The Effect of Different Methods of Bracket Removal Onthe Amount of Residual Adhesive. Am. J. Orthod. Dentofac. Orthop. 1988, 93, 196–200. [Google Scholar] [CrossRef] [PubMed]
  6. Brantley, W.A.; Eliades, T. Orthodontic Materials: Scientific and Clinical Aspects. Am. J. Orthod. Dentofac. Orthop. 2001, 119, 672–673. [Google Scholar]
  7. Holberg, C.; Rudzki-Janson, I.; Wichelhaus, A.; Winterhalder, P. Periodontal Ligament Strain Induced by Different Orthodontic Bracket Removal Techniques. J. Orofac. Orthop. Fortschritte Kieferorthopädie 2014, 75, 287–298. [Google Scholar] [CrossRef] [PubMed]
  8. Holberg, C.; Winterhalder, P.; Holberg, N.; Wichelhaus, A.; Rudzki-Janson, I. Orthodontic Bracket Debonding: Risk of Enamel Fracture. Clin. Oral Investig. 2014, 18, 327–334. [Google Scholar] [CrossRef] [PubMed]
  9. Knösel, M.; Mattysek, S.; Jung, K.; Sadat-Khonsari, R.; Kubein-Meesenburg, D.; Bauss, O.; Ziebolz, D. Impulse Debracketing Compared to Conventional Debonding: Extent of Enamel Damage, Adhesive Residues and the Need for Postprocessing. Angle Orthod. 2010, 80, 1036–1044. [Google Scholar] [CrossRef]
  10. Sinha, P.K.; Nanda, R.S. The Effect of Different Bonding and Debonding Techniques on Debonding Ceramic Orthodontic Brackets. Am. J. Orthod. Dentofac. Orthop. 1997, 112, 132–137. [Google Scholar]
  11. Dalaie, K.; Fatemi, S.M.; Behnaz, M.; Ghaffari, S.; Hemmatian, S.; Soltani, A.D. Effect of Different Debonding Techniques on Shear Bond Strength and Enamel Cracks in Simulated Clinical Set-Ups. J. World Fed. Orthod. 2020, 9, 18–24. [Google Scholar] [CrossRef] [PubMed]
  12. Ji, L.; Chen, Z.; Liao, C.-H.; Hu, S.-F.; Luo, Z.-X.; Lian, B.-W.; He, H. Effects of Customized Resin Base on Bonding Strength of Spherical Self-Ligating Brackets. J. Orofac. Orthop./Fortschritte Der Kieferorthopadie 2022, 83, 108–116. [Google Scholar] [CrossRef] [PubMed]
  13. Sfondrini, M.F.; Xheka, E.; Scribante, A.; Gandini, P.; Sfondrini, G. Reconditioning of Self-Ligating Brackets. Angle Orthod. 2012, 82, 158–164. [Google Scholar] [CrossRef] [PubMed]
  14. Bishara, S.E.; VonWald, L.; Laffoon, J.F.; Warren, J.J. Effect of a Self-Etch Primer/Adhesive on the Shear Bond Strength of Orthodontic Brackets. Am. J. Orthod. Dentofac. Orthop. 2001, 119, 621–624. [Google Scholar] [CrossRef] [PubMed]
  15. Bishara, S.E.; Laffoon, J.F.; Vonwald, L.; Warren, J.J. The Effect of Repeated Bonding on the Shear Bond Strength of Different Orthodontic Adhesives. Am. J. Orthod. Dentofac. Orthop. 2002, 121, 521–525. [Google Scholar] [CrossRef] [PubMed]
  16. Thomas, R.L.; de Rijk, W.G.; Evans, C.A. Tensile and Shear Stresses in the Orthodontic Attachment Adhesive Layer with 3D Finite Element Analysis. Am. J. Orthod. Dentofac. Orthop. 1999, 116, 530–532. [Google Scholar] [CrossRef] [PubMed]
  17. Melenka, G.W.; Nobes, D.S.; Major, P.W.; Carey, J.P. Three-Dimensional Deformation of Orthodontic Brackets. J. Dent. Biomech. 2013, 4, 1758736013492529. [Google Scholar] [CrossRef] [PubMed]
  18. Lacoursiere, R.A.; Nobes, D.S.; Homeniuk, D.L.N.; Carey, J.P.; Badawi, H.H.; Major, P.W. Measurement of Orthodontic Bracket Tie Wing Elastic and Plastic Deformation by Arch Wire Torque Expression Utilizing an Optical Image Correlation Technique. J. Dent. Biomech. 2009, 2010, 397037. [Google Scholar] [CrossRef] [PubMed]
  19. Valletta, R.; Prisco, D.; De Santis, R.; Ambrosio, L.; Martina, R. Evaluation of the Debonding Strength of Orthodontic Brackets Using Three Different Bonding Systems. Eur. J. Orthod. 2007, 29, 571–577. [Google Scholar] [CrossRef]
  20. Ahmed, T.; Rahman, N.A.; Alam, M.K. Comparison of Orthodontic Bracket Debonding Force and Bracket Failure Pattern on Different Teeth In Vivo by a Prototype Debonding Device. BioMed. Res. Int. 2021, 2021, 6663683. [Google Scholar] [CrossRef]
  21. Linjawi, A.I.; Abbassy, M.A. Comparison of Shear Bond Strength to Clinically Simulated Debonding of Orthodontic Brackets: An in Vitro Study. J. Orthod. Sci. 2016, 5, 25–29. [Google Scholar] [CrossRef] [PubMed]
  22. Olsen, M.E.; Bishara, S.E.; Damon, P.; Jakobsen, J.R. Evaluation of Scotchbond Multipurpose and Maleic Acid as Alternative Methods of Bonding Orthodontic Brackets. Am. J. Orthod. Dentofac. Orthop. 1997, 111, 498–501. [Google Scholar] [CrossRef] [PubMed]
  23. Bishara, S.E.; Forrseca, J.M.; Fehr, D.E.; Boyer, D.B. Debonding Forces Applied to Ceramic Brackets Simulating Clinical Conditions. Angle Orthod. 1994, 64, 277–282. [Google Scholar] [CrossRef]
  24. Jonke, E.; Franz, A.; Freudenthaler, J.; König, F.; Bantleon, H.-P.; Schedle, A. Cytotoxicity and Shear Bond Strength of Four Orthodontic Adhesive Systems. Eur. J. Orthod. 2008, 30, 495–502. [Google Scholar] [CrossRef] [PubMed]
  25. Cozza, P.; Martucci, L.; De Toffol, L.; Penco, S.I. Shear Bond Strength of Metal Brackets on Enamel. Angle Orthod. 2006, 76, 851–856. [Google Scholar] [CrossRef] [PubMed]
  26. Jabr, L.; Rossouw, P.E.; Michelogiannakis, D.; Malik, S.; Wheeler, T.T.; Barmak, A.B. A Comparative Assessment of the Bonding Characteristics of Three-Dimensional Custom-Printed Polycrystalline Alumina Brackets and Conventional Brackets. Appl. Sci. 2024, 14, 924. [Google Scholar] [CrossRef]
  27. Su, M.-Z.; Lai, E.H.-H.; Chang, J.Z.-C.; Chen, H.-J.; Chang, F.H.-F.; Chiang, Y.-C.; Lin, C.-P. Effect of Simulated Debracketing on Enamel Damage. J. Formos. Med. Assoc. 2012, 111, 560–566. [Google Scholar] [CrossRef]
  28. Jayakrishnan, U.; Sorake, A.; Rai, R.; Shetty, S. Assessment of Shear Bond Strength of Various Self Ligating Systems- An Evaluation of Bonding Efficiency. Saudi J. Oral Dent. Res. 2022, 7, 329–332. [Google Scholar] [CrossRef]
  29. Lo Giudice, G.; Lo Giudice, A.; Isola, G.; Fabiano, F.; Artemisia, A.; Fabiano, V.; Nucera, R.; Matarese, G. Evaluation of Bond Strength and Detachment Interface Distribution of Different Bracket Base Designs. Acta Med. Mediterr. 2015, 31, 585. [Google Scholar]
  30. Stanford, S.K.; Wozniak, W.T.; Fin, P.L. The Need for Standardization of Test Protocols. Semin. Orthod. 1997, 3, 206–209. [Google Scholar] [CrossRef]
Figure 1. Brackets used in our study.
Applsci 14 06692 g001
Figure 2. Placement of the bracket.
Applsci 14 06692 g002
Figure 3. Several samples arranged before testing.
Applsci 14 06692 g003
Figure 4. Plastic deformation of the brackets.
Applsci 14 06692 g004
Figure 5. Moment and moment arm.
Applsci 14 06692 g005
Figure 6. Shimadzu Universal Testing Machine and test setup.
Applsci 14 06692 g006
Figure 7. Mean values and error bars for yield points of bracket groups; Experience: 463.79 ± 56.72 N; Mini Sprint II: 408.75 ± 89.49 N; Mini Diamond: 211.73 ± 56.23 N; BioQuick: 280.64 ± 118.08 N; Damon Q: 549.35 ± 108.97 N.
Applsci 14 06692 g007
Figure 8. Stress-Strain Curve (O–A; Elastic Behavior, B; Proportional Limit, C; Offset Yield Point, U; Ultimate Strength Point, D; Failure Point).
Applsci 14 06692 g008
Figure 9. Sample specimens with ARI score of 3.
Applsci 14 06692 g009
Table 1. Descriptive statistics of the experiments.
Model/Experiment Code Max.Min.MeanStandard
Deviation
Median
Experience M (E)Yield Point (N)536.2311.2463.791856.72822473.85
MiniSprint II (MS)506.8216.45408.752989.48629443.3
Mini Diamond (MD)295.0595.68211.731256.22774217.1
BioQuick (BQ)527.85108.86280.6418118.0751289.8
Damon Q (D)632.95227.8549.3529108.969588
Experience M (E)Ultimate Strength (N)915.5420.9758.6542146.3391778.05
MiniSprint II (MS)511.65263.1442.461863.90439456.9
Mini Diamond (MD)301.497.82224.078857.12496240.8
BioQuick (BQ)554.65114.57313.2097132.2631296.3
Damon Q (D)1041.8396.1764.5051178.1314748.25
Experience M (E)Failure/
DebondingPoint (N)
777.98383.15591.8518111.4679584.95
MiniSprint II (MS)412.6234.34312.108851.95756306.04
Mini Diamond (MD)151.7284.57121.7120.52432127.05
BioQuick (BQ)513.25104.68204.2847111.8101156.05
Damon Q (D)1040.3365.9721.8912163.7221716.95
Table 2. Normal Distribution Results of the Shapiro-Wilk Test.
Groupp Value
Yield Point
(N)
Ultimate Strength Point (N)Failure (Drop/Debond)
(N)
E0.0130.0310.831
MS0.0300.3880.304
MD0.4360.2760.300
BQ0.6370.4860.002
D0.0010.7200.815
Table 3. Kruskal-Wallis Test Results for the Yield Point Experiment.
Total Sample SizeTest StatisticDegrees of FreedomSignificance Value
8053.5440.0001
Table 4. Significance (p) Values and Significance (p) Values with Bonferroni Correction for the Mann-Whitney U Test for the Yield Point Experiment.
GroupsMedian, (Minimum–Maximum) (N)pSignificance (p) with
Bonferroni Correction
Experience
Mini Sprint II
473.85 (311.2–536.2)
443.30 (216.45–506.80)
0.1881.000
Mini Diamond
Experience
217.10 (95.68–295.05)
443.30 (216.45–506.80)
<0.001<0.001
BioQuick
Experience
289.8 (108.86–527.85)
473.85 (311.2–536.2)
<0.0010.004
Damon Q
Mini Sprint II
748.25 (396.1–1041.8)
443.30 (216.45–506.80)
0.0020.019
Mini Sprint II
Mini Diamond
443.30 (216.45–506.80)
217.10 (95.68–295.05)
0.0010.012
Experience
Damon Q
473.85 (311.2–536.2)
748.25 (396.1–1041.8)
0.0730.726
Mini Diamond
Damon Q
217.10 (95.68–295.05)
748.25 (396.1–1041.8)
<0.001<0.001
BioQuick
Mini Diamond
289.8 (108.86–527.85)
217.10 (95.68–295.05)
0.3151.000
Damon Q
BioQuick
748.25 (396.1–1041.8)
289.8 (108.86–527.85)
<0.001<0.001
Mini Sprint II
BioQuick
443.30 (216.45–506.80)
289.8 (108.86–527.85)
0.0250.248
p < 0.05; significant values are shown in bold. N: Newton.
Table 5. Kruskal-Wallis Test Results for the Ultimate Strength Point Experiment.
Total Sample SizeTest StatisticDegrees of FreedomSignificance Value
8060.4340.0001
Table 6. Significance (p) Values and Significance (p) Values with Bonferroni Correction for the Mann-Whitney U Test for the Ultimate Strength Point Experiment.
GroupsMedian, (Minimum–Maximum) (N)pSignificance (p) with
Bonferroni Correction
Experience
Mini Sprint II
778.05 (420.9–915.5)
456.9 (263.1–511.65)
0.0050.045
Mini Diamond
Experience
240.8 (97.82–301.4)
778.05 (420.9–915.5)
<0.001<0.001
BioQuick
Experience
296.3 (114.57–554.65)
778.05 (420.9–915.5)
<0.001<0.001
Damon Q
Mini Sprint II
748.25 (396.1–1041.8)
456.9 (263.1–511.65)
0.0030.029
Mini Sprint II
Mini Diamond
456.9 (263.1–511.65)
240.8 (97.82–301.4)
0.0020.017
Experience
Damon Q
778.05 (420.9–915.5)
748.25 (396.1–1041.8)
0.0730.726
Mini Diamond
Damon Q
240.8 (97.82–301.4)
748.25 (396.1–1041.8)
<0.001<0.001
BioQuick
Mini Diamond
296.3 (114.57–554.65)
240.8 (97.82–301.4)
0.2071.000
Damon Q
BioQuick
748.25 (396.1–1041.8)
296.3 (114.57–554.65)
<0.001<0.001
Mini Sprint II
BioQuick
456.9 (263.1–511.65)
296.3 (114.57–554.65)
0.0600.602
p < 0.05; significant values are shown in bold. N: Newton.
Table 7. Kruskal-Wallis Test Results for the Debond/Failure Experiment.
Total Sample SizeTest StatisticDegrees of FreedomSignificance Value
8068.6740.0001
Table 8. Significance (p) and Bonferroni Corrected Significance (p) Values for Mann-Whitney U Test Results of the Debond/Failure Experiment.
GroupsMedian, (Minimum–Maximum) (N)pSignificance (p) with
Bonferroni Correction
Experience
Mini Sprint II
584.95 (383.15–777.98)
306.04 (234.34–412.6)
0.0120.123
Mini Diamond
Experience
127.05 (84.57–151.72)
584.95 (383.15–777.98)
<0.001<0.001
BioQuick
Experience
156.05 (104.68–513.25)
584.95 (383.15–777.98)
<0.001<0.001
Damon Q
Mini Sprint II
716.95 (365.9–1040.3)
306.04 (234.34–412.6)
<0.0010.005
Mini Sprint II
Mini Diamond
306.04 (234.34–412.6)
127.05 (84.57–151.72)
0.0010.006
Experience
Damon Q
584.95 (383.15–777.98)
716.95 (365.9–1040.3)
0.3231.000
Mini Diamond
Damon Q
127.05 (84.57–151.72)
716.95 (365.9–1040.3)
<0.001<0.001
BioQuick
Mini Diamond
156.05 (104.68–513.25)
127.05 (84.57–151.72)
0.1531.000
Damon Q
BioQuick
716.95 (365.9–1040.3)
156.05 (104.68–513.25)
<0.001<0.001
Mini Sprint II
BioQuick
306.04 (234.34–412.6)
156.05 (104.68–513.25)
0.0440.438
p < 0.05; significant values are shown in bold. N: Newton.
Table 9. Bond Strength Results.
GroupDebonded Sample/Total SampleAverage (MPa)
Experience7/1756.84
Mini Sprint II2/1733.18
Mini Diamond5/1710.93
BioQuick1/1720.01
Damon Q1/1768.21
Disclaimer/Publisher’s Note: The statements, opinions and data contained in all publications are solely those of the individual author(s) and contributor(s) and not of MDPI and/or the editor(s). MDPI and/or the editor(s) disclaim responsibility for any injury to people or property resulting from any ideas, methods, instructions or products referred to in the content.

