Article

Stratification of Older Adults According to Frailty Status and Falls Using Gait Parameters Explored Using an Inertial System

by
Marta Neira Álvarez
1,
Elisabet Huertas-Hoyas
2,*,
Robert Novak
3,
Ana Elizabeth Sipols
3,
Guillermo García-Villamil-Neira
4,
M. Cristina Rodríguez-Sánchez
5,
Antonio J. Del-Ama
5,
Luisa Ruiz-Ruiz
4,6,
Sara García De Villa
7 and
Antonio R. Jiménez-Ruiz
4
1
Department of Geriatrics, Foundation for Research and Biomedical Innovation of the Infanta Sofía University Hospital (FIIB HUIS), 28055 Madrid, Spain
2
Physical Therapy, Occupational Therapy, Rehabilitation, and Physical Medicine Department, Rey Juan Carlos University, 28922 Madrid, Spain
3
Department of Applied Mathematics, Materials Science and Engineering and Electronic Technology, Rey Juan Carlos University, 28933 Madrid, Spain
4
Centre for Automation and Robotics, Spanish National Research Council (CSIC-UPM,) Arganda del Rey, 28500 Madrid, Spain
5
School of Experimental Sciences and Technology, Rey Juan Carlos University, 28933 Madrid, Spain
6
Politécnica Superior School, Electronics Department, Alcalá University, 28805 Madrid, Spain
7
Department of Signal Theory and Communications, Rey Juan Carlos University, 28942 Fuenlabrada, Spain
*
Author to whom correspondence should be addressed.
Appl. Sci. 2024, 14(15), 6704; https://doi.org/10.3390/app14156704
Submission received: 1 July 2024 / Revised: 26 July 2024 / Accepted: 27 July 2024 / Published: 1 August 2024

Abstract

:

Featured Application

The main finding shows that characteristics assessed using the G-STRIDE device can effectively stratify participants according to their state of frailty and occurrence of falls.

Abstract

Background: The World Health Organization recommends health initiatives focused on the early detection of frailty and falls. Objectives: 1—To compare clinical characteristics, functional performance and gait parameters (estimated with the G-STRIDE inertial sensor) between different frailty groups in older adults with and without falls. 2—To identify variables that stratify participants according to frailty status and falls. 3—To verify the sensitivity, specificity and accuracy of the model that stratifies participants according to frailty status and falls. Methods: Observational, multicenter case-control study. Participants, adults over 70 years with and without falls were recruited from two outpatient clinics and three nursing homes from September 2021 to March 2022. Clinical variables and gait parameters were gathered using the G-STRIDE inertial sensor. Random Forest regression was applied to stratify participants. Results: 163 participants with a mean age of 82.6 ± 6.2 years, of which 118 (72%) were women, were included. Significant differences were found in all gait parameters (both conventional assessment and G-STRIDE evaluation). A hierarchy of factors contributed to the risk of frailty and falls. The confusion matrix and the performance metrics demonstrated high accuracy in classifying participants. Conclusions: Gait parameters, particularly those assessed by G-STRIDE, are effective in stratifying individuals by frailty status and falls. These findings underscore the importance of gait analysis in early intervention strategies.

1. Introduction

Population ageing is a reality of recent decades, especially in developed countries. By 2033, people over 65 years old will make up 25.2% of the Spanish population [1]. Biological aging and sociodemographic changes lead to an increase in chronic diseases, functional disability and the use of health resources [2]. In this context, the concept of frailty has gained interest, as its early detection and intervention can promote healthy aging.
Frailty is a clinical condition characterized by reduced capacities in multiple physiological systems, resulting in a state of increased vulnerability and susceptibility to adverse health outcomes, including disability, falls, hospitalization, institutional care, or even death [3]. Around 10% of people aged over 65 years have frailty, rising to between a quarter and a half of those aged over 85 [4], and it is more frequent in women and nursing home residents [5]. There are two major approaches to defining frailty. The first considers frailty as the result of deficit accumulation [6]. The second, proposed by Linda Fried, defines the frailty phenotype according to five criteria [3], with the locomotor system being crucial as three of the criteria depend on it (gait speed, physical activity and muscle strength).
Although the frailty concept is shared by both approaches (physical phenotype and cumulative deficit theory), the two definitions have different ways to identify frail people and this appears to influence the prevalence of frailty and biomarkers identification or key aspects to consider during diagnosis. Both approaches have strengths and limitations, but both are associated with adverse health outcomes as has been proven [7,8], and studies comparing their predictive abilities have shown mixed results [9]. The key point is that both identify frail people allowing an integrated and individual intervention plan to reverse this dynamic process. It seems that they approach frailty from different perspectives, so in clinical practice, it is accepted to use either of them. Regardless of the definition used, there is a growing interest in searching for biomarkers (laboratory, imaging or clinical) that identify those subgroup populations at high risk of complications in order to improve clinical decision making [10].
Falls are one of the main “geriatric syndromes”, representing a complex geriatric syndrome with multifactorial physiopathology as the walking process is the result of neurological, musculoskeletal, nutritional and cardiovascular integration. The relationship between falls and frailty has been widely described [11,12,13,14], falls being one of the first clinical manifestations of frailty adverse events as was described by Linda Fried in 2001 [3,15]. Changes in bone and muscles (osteosarcopenia) are present in both and can explain why frail people have more falls. Deficits in physical activity, energy and gait speed are some of the components of the frailty phenotype and are intrinsically linked to falls; on the other hand, people who suffer falls with consequences (such as fractures, contusions or fear of falling syndrome) or those with recurrent falls are especially vulnerable and, therefore, present a greater risk or probability of frailty, leading to a greater risk of new falls [13,16].
Given this close relationship, the World Health Organization (WHO) recommends implementing public health initiatives focused on the early detection of frailty and falls to increase individual’s resilience by improving their health status [17].
The multidimensional assessment of frail patients or those with falls must pay special attention to physical performance, gait analysis and balance [18]. This is usually carried out by performing tests such as gait speed [19], the time up and go test (TUG) [20] or the Short Physical Performance Battery (SPPB) [21] that are useful tools in frailty or falls assessment and screening [22,23,24,25]. However, all these tests have some limitations; the data are potentially subject to bias due to the subjectivity of the examiner, the patient’s collaboration attitude, and the characteristics of the physical space where the assessments are conducted. Additionally, multidimensional frailty assessment requires a considerable amount of time, which is limited in daily clinical practice.
The use of electronic devices, wearable sensors and other technologies to measure physical activity or evaluate gait functions is relatively new but with a growing interest in the past ten years [26,27,28,29]. These technologies have obtained interesting results regarding falls evaluation [26,30,31,32] and frailty assessment [31,33,34,35], improving clinical information with additional advantages as they are cheap, easy-to-use and accurate [36]. They also provide continuous detailed data on multiple variables and higher sensitivity and specificity for detecting frailty or falls [32,34,37,38]. But they require complex data analysis, so at present, they are used in investigation settings as they need standardization in clinical practice. In conclusion, while wearable sensors show promise in the early detection of frailty, they complement rather than replace traditional tests like TUG, gait speed or SPPB right now [30].
The purpose of this study is to examine spatiotemporal gait parameters with a wearable sensor system (G-STRIDE) in participants with and without falls according to frailty status. The objectives of the study are: 1—To compare clinical characteristics, functional performance and gait parameters (estimated with the G-STRIDE inertial sensor) between different frailty groups in older adults with and without falls. 2—To identify variables that stratify participants according to frailty status and falls. 3—To verify the sensitivity, specificity and accuracy of the model that stratifies participants according to frailty status and falls.

2. Materials and Methods

This is an observational, multicenter case-control study in older adults with and without falls. Participants were recruited from two outpatient clinics in public hospitals and three public nursing homes from September 2021 to March 2022.
The number of subjects to be recruited was calculated from the estimated effect size for a t-test for differences between two independent means based on data from our previous study [28] with a statistical power of 0.8 and an alpha error of 0.05. A sample size of 164 subjects was obtained.
The study protocol was approved by the Ethics Review Committee of University Hospital La Paz (Registration Number: PI-4486) and informed consent was signed by all participants.
Fallers were defined according to the criteria proposed by the American Geriatrics Society (AGS) and the British Geriatrics Society (BGS) [39] and more recently Montero-Odasso [18] in the world guideline of falls “Fallers Group” as those adults over 70 years to whom one of the following circumstances applied: One fall with consequences in the last year (requiring medical attention); two or more falls in the same period. The participants without falls were volunteers over 70 years that gave informed consent. Exclusion criteria for the study were terminal illness with a life expectancy of fewer than six months.
Clinical assessment was carried out in a single visit and the following data were registered: sociodemographic characteristics, physical activity, weight, height, body mass index (BMI), cognitive status using the Deterioration Scale from Reisberg (GDS) [40], gait speed (GS) [19], the time up and go test (TUG) [20], and fear of falling syndrome using the Short Falls Efficacy Scale—International (Short FES-1) [41].

2.1. Frailty Assessment by Standardized Frailty Phenotype Criteria (S-FPC)

Frailty status was defined according to the standardized Fried’s phenotype criteria [42]. This assessment considers five different parameters, which are scored as 1 if they are affirmative or 0 if negative. The final frailty assessment index ranges between 0 and 5. The 0 index indicates a fit person or a non-frail subject, an index of 1 or 2 indicates prefrailty status, and 3 to five criteria indicates frailty status.
There are three questions about unintentional weight loss, low energy or exhaustion and level of physical activity and the other two criteria are gait speed (GS) (stratified by gender and height) and hand grip strength (HGS) (stratified by gender and body mass index).

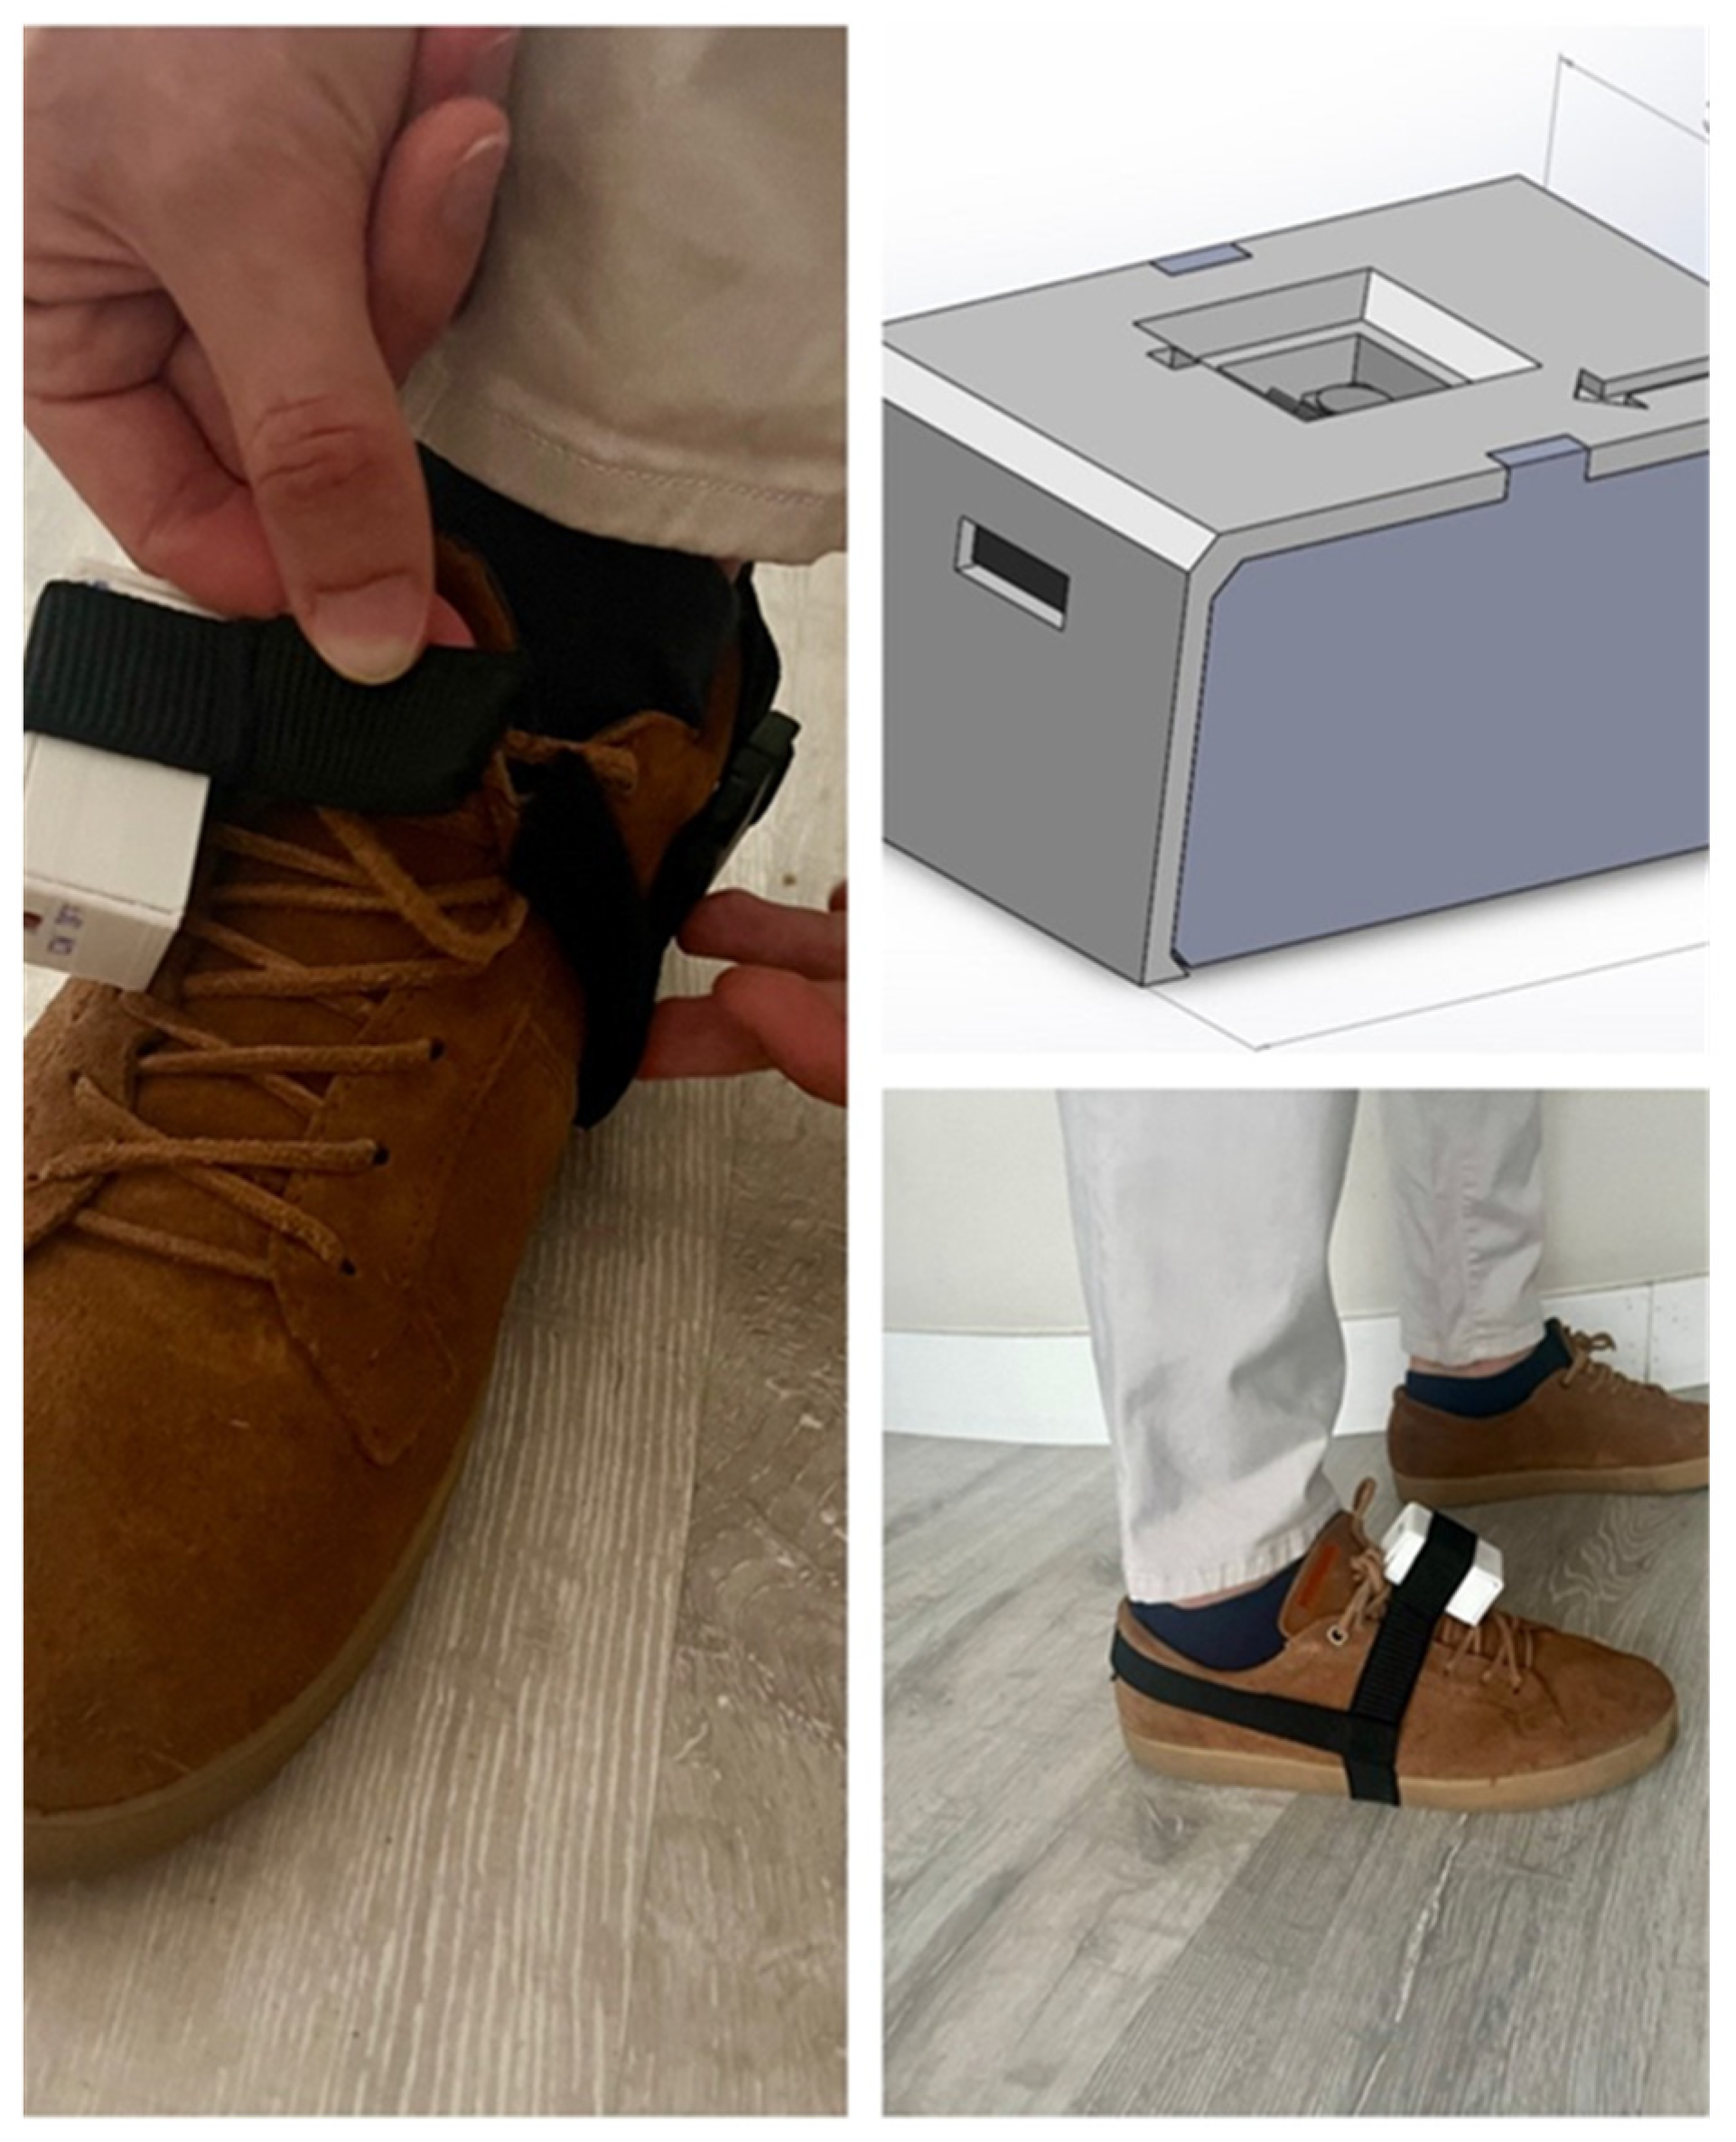
2.2. Gait Analysis: The G-STRIDE System

The G-STRIDE device is based on the device presented in a previous paper [28]. The G-STRIDE device comprises an inertial sensor (IMU) and processing electronics that allow obtaining kinematic gait-related variables when the device is attached to the foot. Raw inertial data are stored in an SD memory card for subsequent off-line processing. These Raw IMU data (accelerations and angular rates) are post-processed for the estimation of spatio-temporal and cinematic parameters, which describe the gait pattern of each subject. The architecture of the G-STRIDE system for gait analysis can be separated into two development blocks: hardware for IMU data registration and software for gait analysis. The device is lightweight with dimensions 57 mm × 27 mm × 32 mm and is attached to the shoe with an elastic band during walking tests; the obtained variables are then stored in a database hosted in the Raspberry itself and are post-processed (removal of outliers, or steps not in straight line) (Figure 1).
The variables estimated by the G-STRIDE are described in Table 1. The parameters are computed as the mean on a step-by-step basis, but we also estimate the standard deviation (STD).
The database containing all the IMU recordings, the estimated parameters in Excel format, and the Python code to process the IMU signals are available in a Zenodo repository [43].

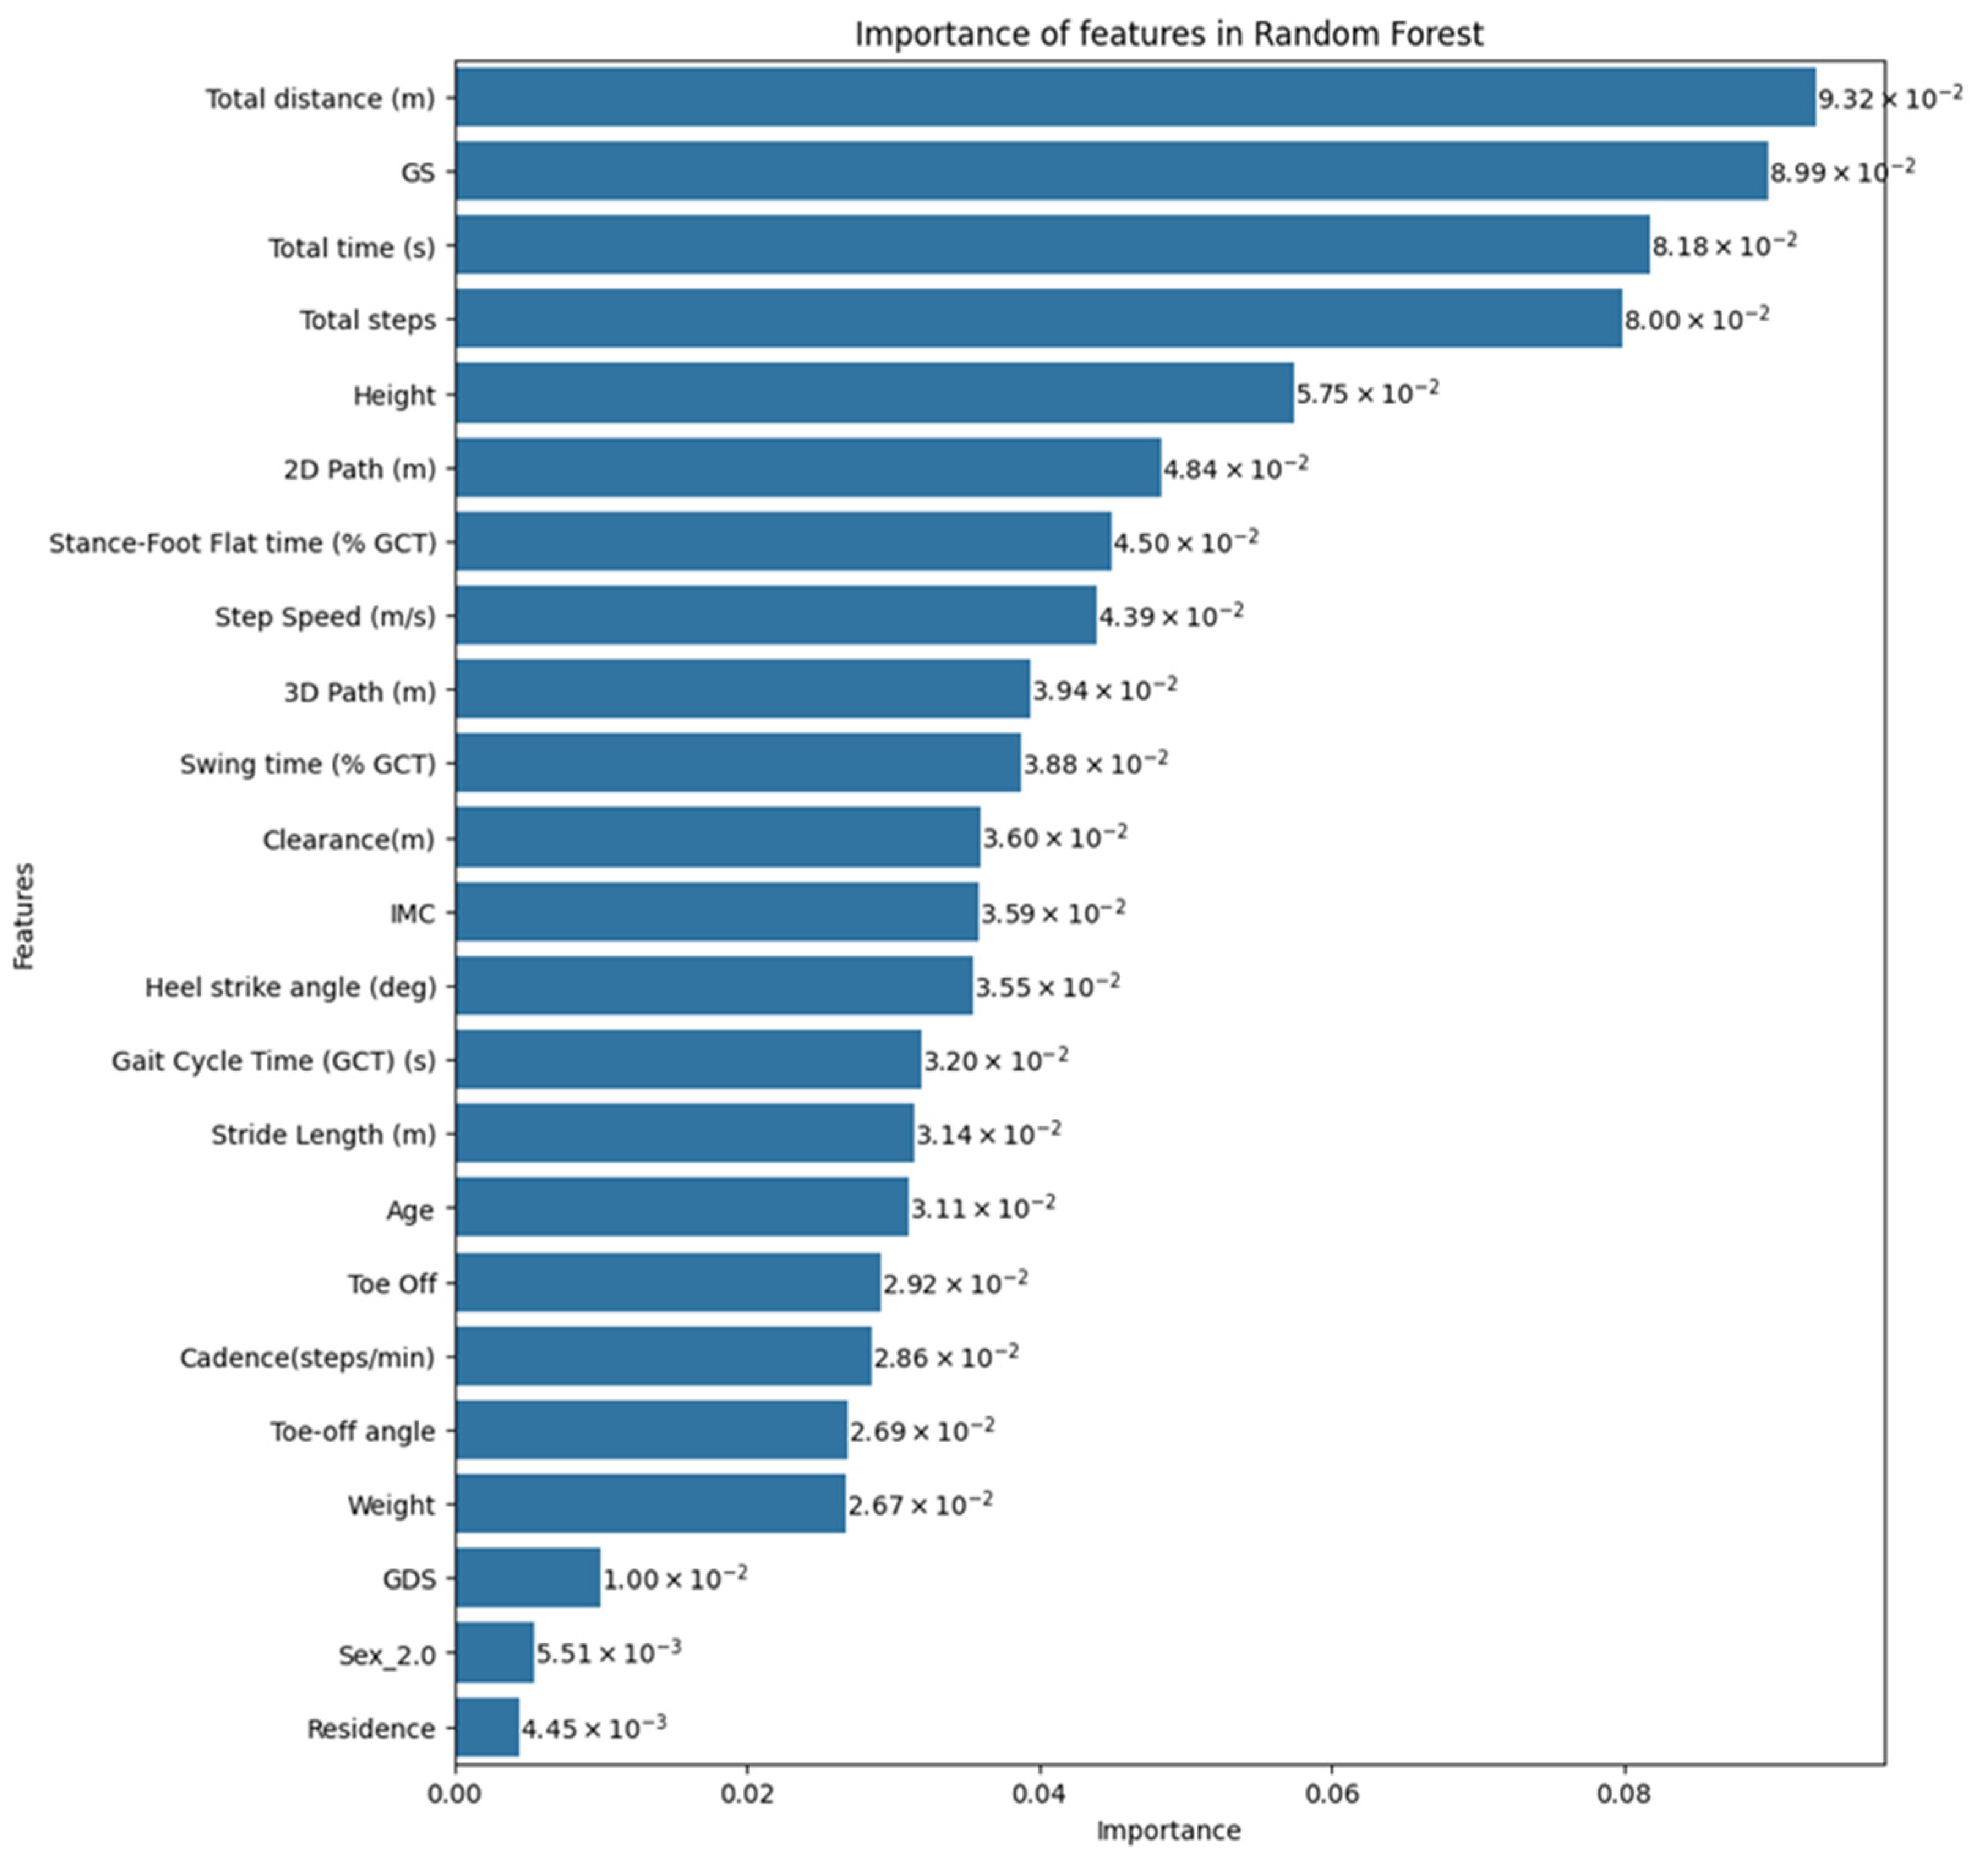
2.3. Classification Model

To evaluate the performance of a classification model, we use several metrics that are based on the counts of true positives (TP), true negatives (TN), false positives (FP) and false negatives (FN):
  • True Positive (TP): The number of correctly predicted positive cases.
  • True Negative (TN): The number of correctly predicted negative cases.
  • False Positive (FP): The number of incorrectly predicted positive cases (Type I error).
  • False Negative (FN): The number of incorrectly predicted negative cases (Type II error).
Using these fundamental components, we can calculate various performance metrics to understand different aspects of the model’s performance:
Precision measures the proportion of true positive predictions (TP) out of the total positive predictions (true positives plus false positives). It indicates how many of the predicted positives are actually positive.
Precision = TP TP + FP
Recall measures the proportion of true positive predictions (TP) out of the total actual positives (true positives plus false negatives). It indicates how many of the actual positives are correctly identified by the model.
Recall = TP TP + FN
The F1-score is the harmonic mean of precision and recall. It provides a single metric that balances both the precision and recall of the model.
F 1 = 2 × Precision × Recall Precision + Recall
Specificity measures the proportion of true negative predictions (TN) out of the total actual negatives (true negatives plus false positives). It indicates how many of the actual negatives are correctly identified by the model.
Specificity = TN TN + FP

2.4. Main Parameters Configuration

For the selection of hyperparameters of the Random Forest, the Leave-One-Out Cross-Validation (LOOCV) method was applied, which is a reliable evaluation technique for assessing unseen data. This method is feasible due to the relatively small sample size
In developing the Random Forest model, the Leave-One-Out Cross-Validation (LOOCV) method combined with GridSearchCV was implemented, utilizing the scikit-learn library in Python. This approach was chosen to optimize and validate the Random Forest Regressor (https://scikit-learn.org/stable/modules/generated/sklearn.ensemble.RandomForestRegressor.html) (accessed on 26 July 2024), allowing for a precise and thorough evaluation of each hyperparameter configuration.
Leave-One-Out Cross-Validation (LOOCV) is a cross-validation technique where each sample in the dataset is used once as the test set, while the remaining samples are used to train the model. This process is repeated such that each sample in the dataset serves as a unique test case in a model trained on all other samples. LOOCV is particularly useful for small datasets as it maximizes the use of available data for training, providing a very detailed and accurate assessment of model performance.
GridSearchCV facilitated a systematic and exhaustive exploration of hyperparameter combinations. The hyperparameters adjusted included the maximum depth of the trees (max_depth), the number of trees (n_estimators), and the minimum thresholds for splitting nodes and forming leaves (min_samples_split and min_samples_leaf).
The application of GridSearchCV, in conjunction with LOOCV, enabled the identification of the optimal hyperparameter configuration that balances model complexity and generalization capability. The optimal hyperparameters identified were:
  • max_depth: 5
  • n_estimators: 100
  • min_samples_split: 3
  • min_samples_leaf: 1

2.5. Statistical Analysis

Statistical analysis was carried out with SPSS v.28 (Copyright© 2013 IBM SPSS Corp., Armonk, NY, USA). The normality of the sample was checked using the Kolgomorov–Smirnov test. Continuous variables were analyzed using the mean and standard deviation and the frequency and percentages of categorical variables. Subsequently, parametric tests were used to measure the differences between independent samples (ANOVA); the chi-square test was used to analyse the differences in percentages. To study the characteristics of participants associated with frailty status and falls and to stratify according to these variables, we applied Random Forest regression using ensemble learning and describing the confusion matrix and metrics: precision (positive predictive value), recall (sensitivity), F1-score (average of precision and recall) and specifity.
We chose the Random Forest regression algorithm due to its strengths in handling complex, nonlinear relationships and its robustness against overfitting, which was particularly important given the variety of gait and frailty variables in our study. Additionally, Random Forest helps us gauge the importance of each variable, which is crucial for interpreting our results. Prior to this, we used principal component analysis (PCA) and factor analysis to reduce dimensionality and uncover the data structure, finding that the first two principal components explained a significant amount of variance. We also applied multinomial logistic regression, which identified significant variables but showed lower accuracy compared to Random Forest. The Random Forest model’s superior performance in classification accuracy and its ability to manage intricate interactions made it the most appropriate choice.

3. Results

There were 163 participants with a mean age of 82.6 ± 6.2 years and 118 (72%) were women.
According to Fried’s phenotype criteria there were 50 fit participants with no falls (36.7%), 70 fit participants with falls (51.5%), 7 frail participants without falls (5.2%), and 36 participants meeting frailty criteria with falls (26.5%).
Table S1 (Supplementary Materials) shows the baseline characteristics of the sample showing significant differences in age, height and type of terrain the device was tested on during free walking. We also found significant differences in all gait parameters both in conventional evaluation and in gait parameters measured by the G-STRIDE device.
Random Forest regression shows the hierarchy of factors contributing to the risk of frailty and falls in our study population (Figure 2).
The results of the Random Forest model’s confusion matrix are shown in Figure 3 and the metrics’ performance in Table 2. We found high accuracy in classifying participants in the four categories of frailty and falls.
The confusion matrix gives information about the capacity of the model to classify participants in the four categories, showing a high number of correct predictions along the main diagonal and very few false positives or false negatives, indicating a high degree of accuracy in the classification. The specificity is equally high in all classes.

4. Discussion

The results reveal that both conventional and G-STRIDE functional evaluations show significant differences between participants with and without falls according to frailty status, falls being more frequent in frail subjects. It is possible to identify gait parameters using the G-STRIDE device that discriminate between fit and frail subjects with and without falls and this is of great interest as it creates the opportunity for early frailty detection.
To our knowledge, this is the first study to stratify participants according to both aspects at the same time to identify people at higher risk of adverse events. The results show significant differences between groups according to frailty status and falls and identifies gait parameters explored by the G-STRIDE device that can stratify participants according to frailty status and falls, which is of great interest as it allows for early intervention. The descriptive variables indicate that fit participants without falls are those who walk on mixed terrain, whereas the percentage of frail participants or those with falls that walk on flat terrain increases, consistent with lower walking difficulty on such surfaces.
Conventional evaluation results show significant differences in gait speed (GS), TUG and Short-FES1 among the four groups studied. Seong-Hi Park’s review of falls assessment tools finds the TUG and Tinetti Test to be the most appropriate in community settings, with a sensitivity > 0.7, recommending the use of multiple tools simultaneously to improve falls prediction [44]. A recent review also found that no single gait, balance or functional mobility assessment can predict fall risk in older adults with high certainty, although moderate evidence suggests gait speed can be useful [45]. Regarding the Short-FES1 scale, similar results have been published, with higher scores in subjects with falls relating to self-perception of risk [46,47]. Current global guidelines for patient care with falls recommend using these three tools with a grade of 1A [18].
The study suggests that variables detected by the G-STRIDE device enhance the ability to distinguish between subjects based on frailty status and fall history, enabling proper differentiation among frail subjects with falls, frail subjects without falls, and fit subjects with or without falls. G-STRIDE quantitative measurements of physical activity (total distance, total time, total number of steps), along with gait speed and step speed, contribute significantly to the model, distinguishing fit from frail subjects. Parameters related to gait characteristics (3D path, swing time, stance-foot flat time, clearance, stride length) contribute to distinguishing between subjects with and without falls. These results support the need for technological data collection systems that enhance clinical evaluation in daily practice.
Other studies have used sensor devices under different testing conditions (sensor location, test duration, variables measured) and with different objectives (some evaluating frailty, others focusing on falls) [29,30,31,32]. Many propose mixed models with functional and sensor parameters, generally finding that technological devices improve diagnosis. We found only one study that analyzed both frailty and falls; Green et al. studied functional and sensor variables in 124 participants to identify a model for classifying participants according to frailty and falls separately, without relating the two variables [48].
A recent review [36] concluded that the parameters that best differentiate between frailty subgroups are gait speed, in particular during habitual walking, cadence, step width variability, step length during habitual walking, and double support time during fast walking, but in general, most studies focused on frailty detection using sensor devices, and recommend number of steps, physical activity, gait speed, cadence or sleep activity [33,34]. They also conclude that more research is needed to identify distinct, clinically interpretable features and develop a general framework for fall and frailty assessment.
In this context, the G-STRIDE device shows good characteristics for implementation in clinical practice for frailty and falls assessment, making it possible to identify frail patients early and implement interventions. It is easy to use, does not require any specialized personnel or knowledge, has no related adverse events, has high accuracy, no subjectivity in interpretation, and no time limitation as it can be used outside the clinic.
Our study has some limitations. Firstly, the sample size is not particularly large; however, the sample’s homogeneity and the type of statistical analysis ensure reliable prediction of results. Additionally, there are more fit subjects, likely due to a higher number of participants from home settings. The frail group without falls is smaller, possibly due to the difficulty in finding frail individuals without adverse events such as falls. These factors may have partly influenced the results. However, the study’s strength lies in analyzing many variables in subjects from diverse environments and with a high average age, which is valuable for research in the elderly population.
Finally, these results suggest new lines of research to confirm current findings and identify cut-off points to distinguish fit from frail subjects and those at higher risk of falls.

5. Conclusions

The study confirms that gait parameters explored by the G-STRIDE device differ significantly between participants according to frailty status and falls history. The device effectively discriminates between fit and frail subjects with and without falls, identifying those at higher risk of adverse events which is of great interest. Future investigations must confirm the best clinical biomarkers of frailty and falls using this inertial system and how to use these clinical biomarkers in clinical practice.

Supplementary Materials

The following supporting information can be downloaded at: https://www.mdpi.com/article/10.3390/app14156704/s1, Table S1: Sample characteristics by categories.

Author Contributions

Conceptualization, M.N.Á. and G.G.-V.-N.; methodology, M.N.Á.; software, G.G.-V.-N., S.G.D.V., L.R.-R. and A.R.J.-R.; validation, R.N.; formal analysis, E.H.-H., R.N. and A.E.S.; investigation, M.C.R.-S. and A.J.D.-A.; resources, M.C.R.-S.; data curation, E.H.-H., R.N. and A.E.S.; writing—original draft preparation, M.N.Á.; writing—review and editing, M.N.Á., E.H.-H. and A.R.J.-R.; funding acquisition, A.R.J.-R. and M.C.R.-S. All authors have read and agreed to the published version of the manuscript.

Funding

This research was funded by G-STRIDE de la Convocatoria Fundación Mapfre—ayudas a la investigación Ignacio Larramendi 2021; MI-CROCEBUS RTI2018-095168-B-C55 (MCIU/AEI/FEDER, UE) for the development of CSIC PDR techniques. Collaboration with laboratories SENIALAB (Laboratorio de sistemas de navegación sensorial y de sistemas de monitorización) of the REDLABU of the Universidad Rey Juan Carlos and CAR-CSIC.

Institutional Review Board Statement

The study was conducted in accordance with the Declaration of Helsinki and approved by Ethics Review Committee of University Hospital La Paz (Registration Number: PI-4486).

Informed Consent Statement

Informed consent was obtained from all subjects involved in the study. Written informed consent has been obtained from the patient(s) to publish this paper.

Data Availability Statement

This database containing all the IMU recordings, estimated parameters in Excel format, and the Python code to process the IMU signals are available in a Zenodo repository [34].

Acknowledgments

We would like to thank all the participants in the study for their time and data sharing.

Conflicts of Interest

The authors declare no conflicts of interest.

References

  1. National Statistical Institute. 2018 Population Projections. 2018. Available online: https://www.ine.es/prensa/pp_2018_2068.pdf (accessed on 1 June 2024).
  2. Mitchell, E.; Walker, R. Global ageing: Successes, challenges and opportunities. Br. J. Hosp. Med. 2020, 81, 1–9. [Google Scholar] [CrossRef] [PubMed]
  3. Fried, L.P.; Tangen, C.M.; Walston, J.; Newman, A.B.; Hirsch, C.; Gottdiener, J.; Seeman, T.; Tracy, R.; Kop, W.J.; Burke, G.; et al. Frailty in older adults: Evidence for a phenotype. J. Gerontol. A Biol. Sci. Med. Sci. 2021, 56. [Google Scholar] [CrossRef] [PubMed]
  4. Rubenstein, L.Z. Falls in older people: Epidemiology, risk factors and strategies for prevention. Age Ageing 2006, 35, ii37–ii41. [Google Scholar] [CrossRef] [PubMed]
  5. Bergen, G.; Stevens, M.R.; Burns, E.R. Falls and Fall Injuries Among Adults Aged ≥65 Years—United States. 2014. MMWR Morb. Mortal. Wkly. Rep. 2016, 65, 993–998. [Google Scholar] [CrossRef]
  6. Rockwood, K.; Mitnitski, A. Frailty in relation to the accumulation of deficits. J. Gerontol. A Biol. Sci. Med. Sci. 2007, 62, 722–727. [Google Scholar] [CrossRef] [PubMed]
  7. Kojima, G. Frailty defined by FRAIL scale as a predictor of mortality: A systematic review and meta-analysis. J. Am. Med. Dir. Assoc. 2018, 19, 480–483. [Google Scholar] [CrossRef] [PubMed]
  8. Chu, W.; Chang, S.F.; Ho, H.Y. Adverse health effects of frailty: Systematic review and meta-analysis of middle-aged and older adults with implications for evidence-based practice. Worldviews Evid.-Based Nurs. 2021, 18, 282–289. [Google Scholar] [CrossRef] [PubMed]
  9. Harmand, M.G.-C.; Meillon, C.; Bergua, V.; Teguo, M.T.; Dartigues, J.-F.; Avila-Funes, J.A.; Amieva, H. Comparing the predictive value of three definitions of frailty: Results from the Three-City study. Arch. Gerontol. Geriatr. 2017, 72, 153–163. [Google Scholar] [CrossRef] [PubMed]
  10. El Assar, M.; Rodríguez-Sánchez, I.; Álvarez-Bustos, A.; Rodríguez-Mañas, L. Biomarkers of frailty. Mol. Asp. Med. 2024, 97, 101271. [Google Scholar] [CrossRef]
  11. Lu, Z.; Er, Y.; Zhan, Y.; Deng, X.; Jin, Y.; Ye, P.; Duan, L. Association of Frailty Status with Risk of Fall among Middle-Aged and Older Adults in China: A Nationally Representative Cohort Study. J. Nutr. Health Aging 2021, 25, 985–992. [Google Scholar] [CrossRef]
  12. Chittrakul, J.; Siviroj, P.; Sungkarat, S.; Sapbamrer, R. Physical Frailty and Fall Risk in Community-Dwelling Older Adults: A Cross-Sectional Study. J. Aging Res. 2020, 2020, 1–8. [Google Scholar] [CrossRef]
  13. Kojima, G. Frailty as a Predictor of Future Falls Among Community-Dwelling Older People: A Systematic Review and Meta-Analysis. J. Am. Med. Dir. Assoc. 2015, 16, 1027–1033. [Google Scholar] [CrossRef] [PubMed]
  14. Cheng, M.H.; Chang, S.F. Frailty as a Risk Factor for Falls Among Community Dwelling People: Evidence from a Meta-Analysis. J. Nurs. Scholarsh. 2017, 49, 529–536. [Google Scholar] [CrossRef] [PubMed]
  15. Gallo da Silva, T.T.; Filho, J.M.; Biesek, S.; Vojciechowski, A.S.; Borba, V.Z.C.; Gomes, A.R.S. Accuracy of Tools to Differentiate Single From Recurrent Fallers Pre-Frail Older Women. Front. Public. Health 2022, 10, 716851. [Google Scholar] [CrossRef] [PubMed]
  16. Zhang, Q.; Zhao, X.; Liu, H.; Ding, H. Frailty as a predictor of future falls and disability: A four-year follow-up study of Chinese older adults. BMC Geriatr. 2020, 20, 388. [Google Scholar] [CrossRef]
  17. World Health Organization. Step Safely: Strategies for Preventing and Managing Falls across the Life-Course. Geneva: World Health Organization; 2021. Licence: CC BY-NC-SA 3.0 IGO. Available online: https://www.who.int/publications/i/item/9789240021914 (accessed on 1 June 2024).
  18. Montero-Odasso, M.; Montero-Odasso, M.; van der Velde, N.; van der Velde, N.; Martin, F.C.; Martin, F.C.; Petrovic, M.; Petrovic, M.; Tan, M.P.; Tan, M.P.; et al. Task Force on Global Guidelines for Falls in Older Adults. World guidelines for falls prevention and management for older adults: A global initiative. Age Ageing 2022, 51, afac205. [Google Scholar] [CrossRef]
  19. Studenski, S.; Perera, S.; Patel, K.; Rosano, C.; Faulkner, K.; Inzitari, M.; Brach, J.; Chandler, J.; Cawthon, P.; Connor, E.B.; et al. Gait speed and survival in older adults. JAMA 2011, 305, 50–58. [Google Scholar] [CrossRef] [PubMed]
  20. Podsiadlo, D.; Richardson, S. The Timed “Up & Go”: A Test of Basic Functional Mobility for Frail Elderly Persons. J. Am. Geriatr. Soc. 1991, 39, 142–148. [Google Scholar] [CrossRef] [PubMed]
  21. Guralnik, J.M.; Simonsick, E.M.; Ferrucci, L.; Glynn, R.J.; Berkman, L.F.; Blazer, D.G.; Scherr, P.A.; Wallace, R.B. A short physical performance battery assessing lower extremity function: Association with self-reported disability and prediction of mortality and nursing home admission. J. Gerontol. 1994, 49, M85–M94. [Google Scholar] [CrossRef]
  22. Abizanda, P.; Romero, L.; Sanchez-Jurado, P.; Atienzar-Núñez, P.; Esquinas-Requena, J.; Garcia-Nogueras, I. Association between Functional Assessment Instruments and Frailty in Older Adults: The FRADEA Study. J. Frailty Aging 2012, 1, 162–168. [Google Scholar] [CrossRef]
  23. Marzetti, E.; Cesari, M.; Calvani, R.; Msihid, J.; Tosato, M.; Rodriguez-Mañas, L.; Lattanzio, F.; Cherubini, A.; Bejuit, R.; Di Bari, M.; et al. SPRINTT Consortium. 2018. The “Sarcopenia and Physical fRailty IN older people: Multi-componenT Treatment strategies” (SPRINTT) randomized controlled trial: Case finding, screening and characteristics of eligible participants. Exp. Gerontol. 2018, 113, 48–57. [Google Scholar] [CrossRef]
  24. Jung, H.-W.; Baek, J.Y.; Jang, I.-Y.; Guralnik, J.M.; Rockwood, K.; Lee, E.; Kim, D.H. Short Physical Performance Battery as a Crosswalk Between Frailty Phenotype and Deficit Accumulation Frailty Index. J. Gerontol. A Biol. Sci. Med. Sci. 2021, 76, 2249–2255. [Google Scholar] [CrossRef]
  25. Ramírez-Vélez, R.; López Sáez de Asteasu, M.; Morley, J.E.; Cano-Gutierrez, C.A.; Izquierdo, M. Performance of the Short Physical Performance Battery in Identifying the Frailty Phenotype and Predicting Geriatric Syndromes in Community-Dwelling Elderly. J. Nutr. Health Aging 2021, 25, 209–217. [Google Scholar] [CrossRef] [PubMed]
  26. Chen, M.; Wang, H.; Yu, L.; Yeung, E.H.K.; Luo, J.; Tsui, K.-L.; Zhao, Y. A Systematic Review of Wearable Sensor-Based Technologies for Fall Risk Assessment in Older Adults. Sensors 2022, 22, 6752. [Google Scholar] [CrossRef]
  27. Brognara, L.; Mazzotti, A.; Di Martino, A.; Faldini, C.; Cauli, O. Wearable Sensor for Assessing Gait and Postural Alterations in Patients with Diabetes: A Scoping Review. Medicina 2021, 57, 1145. [Google Scholar] [CrossRef] [PubMed]
  28. García-Villamil, G.; Neira-Álvarez, M.; Huertas-Hoyas, E.; Jiménez, A.R.; Rodríguez-Sánchez, C. A Pilot Study to Validate a Wearable Inertial Sensor for Gait Assessment in Older Adults with Falls. Sensors 2021, 21, 4334. [Google Scholar] [CrossRef]
  29. Ruiz-Ruiz, L.; Jimenez, A.R.; Garcia-Villamil, G.; Seco, F. Detecting Fall Risk and Frailty in Elders with Inertial Motion Sensors: A Survey of Significant Gait Parameters. Sensors 2021, 21, 6918. [Google Scholar] [CrossRef] [PubMed]
  30. Wang, X.; Cao, J.; Zhao, Q.; Chen, M.; Luo, J.; Wang, H.; Yu, L.; Tsui, K.-L.; Zhao, Y. Identifying sensors-based parameters associated with fall risk in community-dwelling older adults: An investigation and interpretation of discriminatory parameters. BMC Geriatr. 2024, 24, 125. [Google Scholar] [CrossRef]
  31. Greene, B.R.; McManus, K.; Redmond, S.J.; Caulfield, B.; Quinn, C.C. Digital assessment of falls risk, frailty, and mobility impairment using wearable sensors. Npj Digit. Med. 2019, 2, 125. [Google Scholar] [CrossRef]
  32. Li, K.-J.; Wong, N.L.-Y.; Law, M.-C.; Lam, F.M.-H.; Wong, H.-C.; Chan, T.-O.; Wong, K.-N.; Zheng, Y.-P.; Huang, Q.-Y.; Wong, A.Y.-L.; et al. Reliability, Validity, and Identification Ability of a Commercialized Waist-Attached Inertial Measurement Unit (IMU) Sensor-Based System in Fall Risk Assessment of Older People. Biosensors 2023, 13, 998. [Google Scholar] [CrossRef]
  33. Vavasour, G.; Giggins, O.M.; Doyle, J.; Kelly, D. How wearable sensors have been utilised to evaluate frailty in older adults: A systematic review. J. Neuroeng. Rehabil. 2021, 18, 112. [Google Scholar] [CrossRef] [PubMed]
  34. Razjouyan, J.; Naik, A.D.; Horstman, M.J.; Kunik, M.E.; Amirmazaheri, M.; Zhou, H.; Sharafkhaneh, A.; Najafi, B. Wearable Sensors and the Assessment of Frailty among Vulnerable Older Adults: An Observational Cohort Study. Sensors 2018, 18, 1336. [Google Scholar] [CrossRef] [PubMed]
  35. Parvaneh, S.; Mohler, J.; Toosizadeh, N.; Grewal, G.S.; Najafi, B. Postural Transitions during Activities of Daily Living Could Identify Frailty Status: Application of Wearable Technology to Identify Frailty during Unsupervised Condition. Gerontology 2017, 63, 479–487. [Google Scholar] [CrossRef] [PubMed]
  36. Schwenk, M.; Howe, C.; Saleh, A.; Mohler, J.; Grewal, G.; Armstrong, D.; Najafi, B. Frailty and technology: A systematic review of gait analysis in those with frailty. Gerontology 2014, 60, 79–89. [Google Scholar] [CrossRef] [PubMed]
  37. Huang, C.; Nihey, F.; Ihara, K.; Fukushi, K.; Kajitani, H.; Nozaki, Y.; Nakahara, K. Healthcare Application of In-Shoe Motion Sensor for Older Adults: Frailty Assessment Using Foot Motion during Gait. Sensors 2023, 23, 5446. [Google Scholar] [CrossRef] [PubMed]
  38. Álvarez, M.N.; Ruiz, A.R.J.; Neira, G.G.; Huertas-Hoyas, E.; Cerda, M.T.E.; Delgado, L.P.; Robles, E.R.; Del-Ama, A.J.; Ruiz-Ruiz, L.; García-de-Villa, S.; et al. Assessing falls in the elderly population using G-STRIDE foot-mounted inertial sensor. Sci. Rep. 2023, 13, 9208. [Google Scholar] [CrossRef] [PubMed]
  39. Panel on Prevention of Falls in Older Persons, American Geriatrics Society and British Geriatrics Society. Summary of the Updated American Geriatrics Society/British Geriatrics Society clinical practice guideline for prevention of falls in older persons. J. Am. Geriatr. Soc. 2011, 59, 148–157. [Google Scholar] [CrossRef] [PubMed]
  40. Auer, S.; Reisberg, B. The GDS/FAST Staging System. Int. Psychogeriatr. 1997, 9, 167–171. Available online: https://www.cambridge.org/core/product/identifier/S1041610297004869/type/journal_article (accessed on 1 June 2024). [CrossRef]
  41. Kempen, G.I.J.M.; Yardley, L.; Van Haastregt, J.C.M.; Zijlstra, G.A.R.; Beyer, N.; Hauer, K.; Todd, C. The Short FES-I: A shortened version of the falls efficacy scale-international to assess fear of falling. Age Ageing 2008, 37, 45–50. [Google Scholar] [CrossRef]
  42. Alonso Bouzón, C.; Carnicero, J.A.; Turín, J.G.; García-García, F.J.; Esteban, A.; Rodríguez-Mañas, L. The Standardization of Frailty Phenotype Criteria Improves Its Predictive Ability: The Toledo Study for Healthy Aging. J. Am. Med. Dir. Assoc. 2017, 18, 402–408. [Google Scholar] [CrossRef]
  43. García-Villamil, G.; Neira-Álvarez, M.; Huertas-Hoyas, E.; Ruiz-Ruiz, L.; García-de-Villa, S.; Del-Ama, A.; Rodríguez-Sánchez, M.C.; Jiménez-Ruiz, A. GSTRIDE: A Database of Frailty and Functional Assessments with Inertial Gait Data from Elderly Fallers and Non-Fallers Populations. 2022. Available online: https://zenodo.org/records/6883292 (accessed on 1 June 2024). [CrossRef]
  44. Park, S.H. Tools for assessing fall risk in the elderly: A systematic review and meta-analysis. Aging Clin. Exp. Res. 2018, 30, 1–16. [Google Scholar] [CrossRef] [PubMed]
  45. Beck Jepsen, D.; Robinson, K.; Ogliari, G.; Montero-Odasso, M.; Kamkar, N.; Ryg, J.; Freiberger, E.; Masud, T. Predicting falls in older adults: An umbrella review of instruments assessing gait, balance, and functional mobility. BMC Geriatr. 2022, 22, 615. [Google Scholar] [CrossRef]
  46. Esbri-Victor, M.; Huedo-Rodenas, I.; Lopez-Utiel, M.; Navarro-Lopez, J.L.; Martinez-Reig, M.; Serra-Rexach, J.A.; Romero-Rizos, L.; Abizanda, P. Frailty and Fear of Falling: The FISTAC Study. J. Frailty Aging 2017, 6, 136–140. [Google Scholar] [CrossRef] [PubMed]
  47. Gazibara, T.; Kurtagic, I.; Kisic-Tepavcevic, D.; Nurkovic, S.; Kovacevic, N.; Gazibara, T.; Pekmezovic, T. Falls, risk factors and fear of falling among persons older than 65 years of age. Psychogeriatrics 2017, 17, 215–223. [Google Scholar] [CrossRef]
  48. Greene, B.R.; Doheny, E.P.; Kenny, R.A.; Caulfield, B. Classification of frailty and falls history using a combination of sensor-based mobility assessments. Physiol. Meas. 2014, 35, 2053–2066. [Google Scholar] [CrossRef]
Figure 1. G-STRIDE device attached to a participant’s foot.
Applsci 14 06704 g001
Figure 2. Relative variable importance in Random Forest regression.
Applsci 14 06704 g002
Figure 3. Confusion matrix.
Applsci 14 06704 g003
Table 1. Sensor-based gait estimated variables.
ParameterDescription
Total distance (m)The total distance covered during a long free walk.
Total time (s)The total time spent in the free walk.
Total stepsThe total number of steps in the free walk.
Gait cycle time (GCT) (s)The time elapsed during a stride.
Velocity (m/s)The mean walking speed computed over the total detected steps measured in meters per second.
Cadence (steps/min)The number of steps per minute.
Swing time (% GCT)Swing time (from toe-off to heel strike) as percentage of GCT.
Stance-foot flat time (% GCT)Foot-flat (from start to end) time as percentage of GCT. It occurs between toe-strike and heel-off.
Toe Off (% GCT)Percentage of the stride since the mid-stance until the foot is in the Toe Off instant, which corresponds to the Push Off phase.
Heel strike angle (deg)The maximum pitch angle at heel strike measured in degrees.
Toe-off angle (deg)The maximum pitch angle at toe off measured in degrees.
Stride Length (m)Distance from one stance position to the next stance of the same foot.
Step Speed (m/s)The forward speed of the foot only during the swing phase.
2D Path (m)The path length of the foot in the horizontal plane with respect to the stride length, which includes the lateral deviations of the strides.
3D Path (m)The path length of the foot in 3D space during a step with respect to the stride length, which includes the lateral deviations of strides and the foot elevation.
Clearance(m)The clearance or maximum height of the foot with respect to the ground during the swing phase.
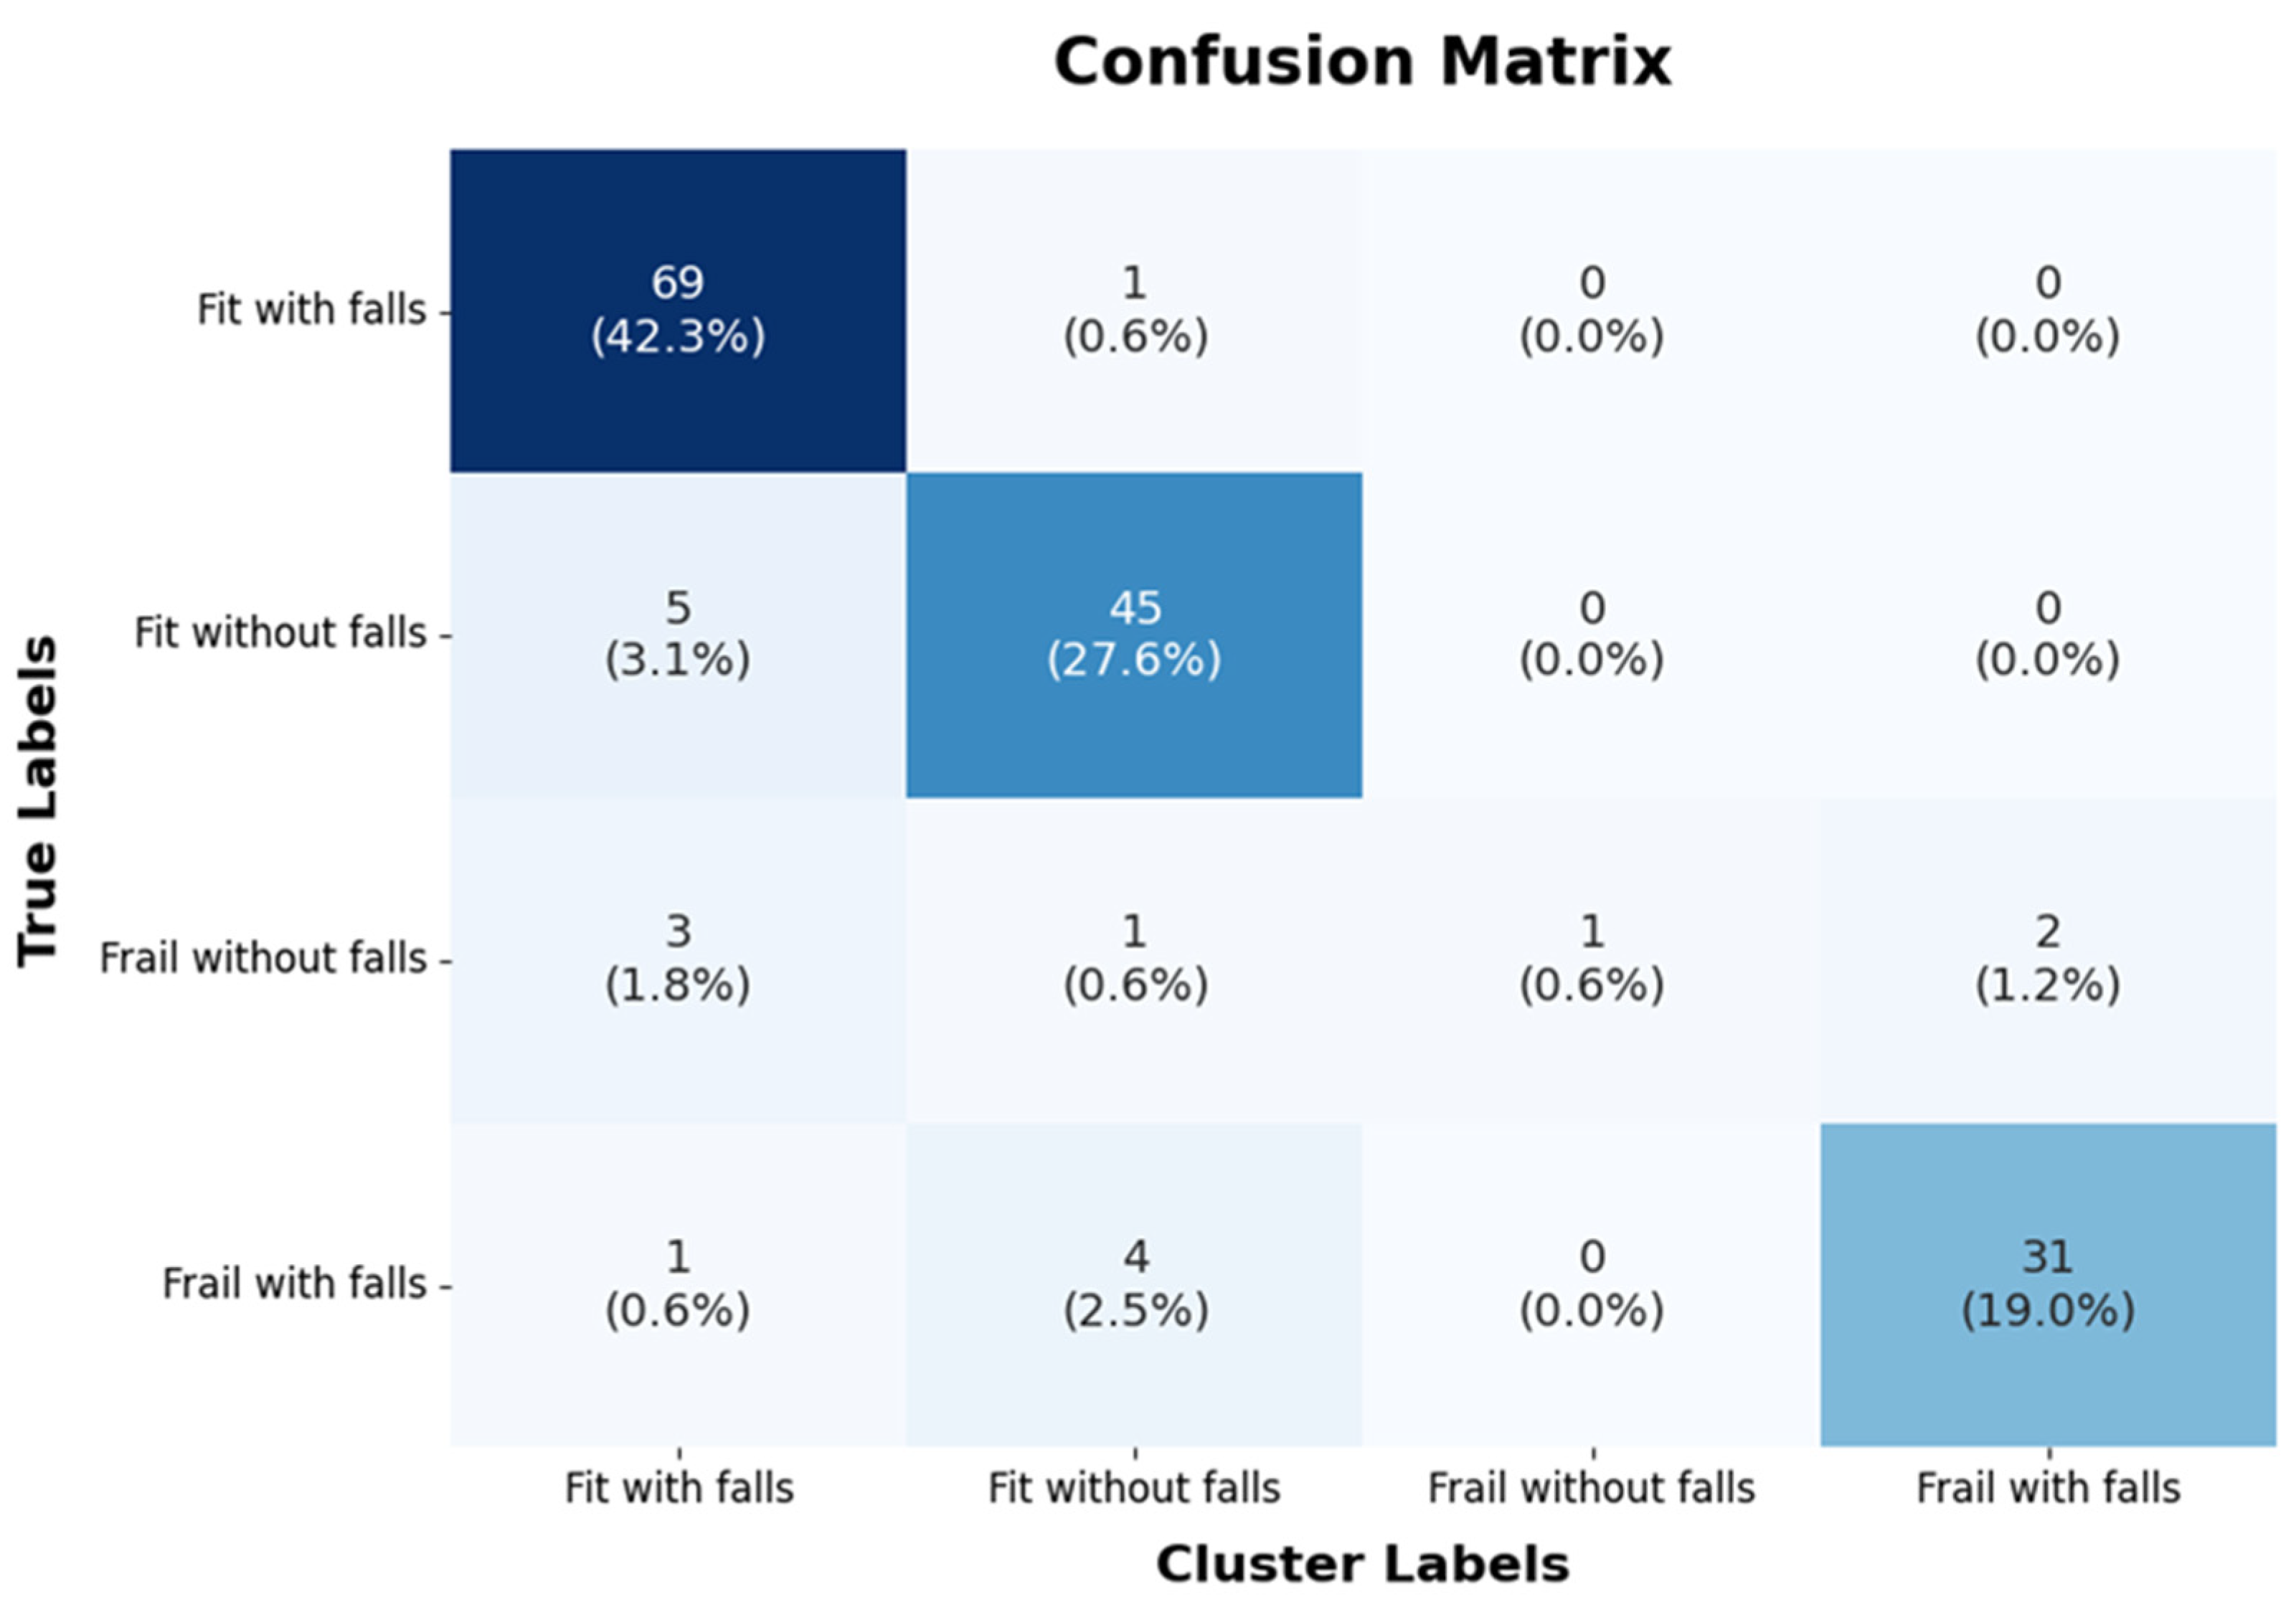
Note: (m) = meters; (s) = seconds; GCT = gait cycle time; (deg) = degrees; (steps/min) = steps per minute.
Table 2. Model performance metrics for Random Forest model predicting the four categories.
ClassPrecisionRecall (TPR)F1 ScoreSpecificity
Fit with falls0.880.980.930.98
Fit without falls0.880.90.890.97
Frail without falls1.00.140.251.0
Frail with falls0.940.860.900.99
Disclaimer/Publisher’s Note: The statements, opinions and data contained in all publications are solely those of the individual author(s) and contributor(s) and not of MDPI and/or the editor(s). MDPI and/or the editor(s) disclaim responsibility for any injury to people or property resulting from any ideas, methods, instructions or products referred to in the content.

