Abstract
The operational state of a rotor system directly affects its working efficiency, and the axis trajectory can accurately characterize this state. Therefore, a method for extracting axis motion trajectory characteristics based on distance sequence representation is established. First, the axis trajectory sample signal is constructed from the original vibration displacement signal. Singular value decomposition (SVD) is performed on the sample signal to obtain effective components, resulting in a purified and denoised axis motion trajectory signal. Next, the axis motion trajectory signal is centralized and normalized. Feature extraction is then performed on the axis motion trajectory signal. Based on the different curvatures of various regions in the axis motion trajectory graph, data points are adaptively selected. The distances between the selected data points and a unique fixed point are calculated in the two-dimensional plane, resulting in a feature signal that characterizes the axis motion trajectory graph. This completes the extraction of the axis motion trajectory characteristics. Different rotational speeds, additional weights, and changes in rotor arrangement types are applied to a multi-disk rotor test rig to obtain measured data for various unbalanced states, validating this method. The results show that this method effectively characterizes the axis motion trajectory with strong generality.
1. Introduction
With the continuous development of industrial processes, rotating machinery has been widely applied in sectors such as aerospace, wind power generation, and rail transportation. As the core component of rotating machinery, the rotor system directly affects the performance of all of the equipment [1]. The axis trajectory can accurately characterize the operational state of the rotor system. For typical rotor systems in rotating machinery, such as turbines, compressors, fans, and rolling mills, the operational state can be directly assessed by observing the axis trajectory. This includes identifying conditions such as rotor imbalance, misalignment, oil film whirl, and rubbing. Analyzing the characteristics of axis motion trajectory is of significant importance in identifying the operational state of rotor systems.
The axis trajectory is derived from two vibration signals collected in perpendicular directions at the same cross section, providing the most direct and comprehensive information about the rotor’s operational state. However, the raw vibration signals collected in practical scenarios often suffer from various interferences and random noise, leading to non-linear and non-stationary characteristics. The intricate nature of the axis trajectory complicates its interpretation and significantly hampers the assessment of the rotor system’s operational condition. Hence, it is crucial to process the axis trajectory by filtering out noise and extracting relevant features before conducting further analysis.
Common methods for axis trajectory purification include morphological filtering [2], wavelet transform [3], Empirical Mode Decomposition (EMD) [4], and singular value decomposition (SVD) [5]. Morphological filtering is a non-linear filtering method successfully applied in power system relay protection for traveling wave noise reduction [6] and power quality detection [7]. It has been introduced into vibration signal denoising [8] and axis trajectory purification [9]. Its principle involves decomposing a complex axis trajectory signal into several parts through mathematical morphological transformations, thereby separating it from the background while preserving the signal’s main shape characteristics. Even with strong noise accompanying the original signal, its basic shape can still be recognized, reconstructed, and enhanced.
Wavelet transform is widely used in bearing fault diagnosis due to its multi-resolution characteristics, which allow for the extraction of the original signal from noise-contaminated signals [10]. Reference [11] introduced wavelet algorithms into axis trajectory purification, using harmonic wavelet algorithms to purify rotor displacement signals at specified frequency characteristics and synthesize axis trajectories. However, wavelet transform parameters and thresholds greatly influenced the results, making parameter optimization challenging and the method relatively complex.
Time-frequency analysis based on Empirical Mode Decomposition (EMD) is highly suitable for processing non-linear and non-stationary signal sequences and is widely used in signal processing and bearing fault diagnosis [12]. EMD stabilizes non-stationary signals by decomposing their fluctuations and trends at different scales step by step, generating a series of data sequences with different characteristic scales known as Intrinsic Mode Functions (IMFs). In the literature [13], EMD is combined with a Probabilistic Neural Network (PNN) to construct an adaptive filter, achieving efficient noise reduction in bearing fault signals. This is followed by feature extraction and input to the PNN for bearing fault diagnosis. In another study [14], EMD is used to process acceleration vibration signals of mine hoists. The number of IMFs obtained sets the number of modes for Variational Mode Decomposition (VMD). Through correlation analysis, specific IMFs are selected from VMD for feature extraction, and a Support Vector Machine (SVM) is used for equipment monitoring. However, EMD decomposition faces issues such as mode mixing and end effects, which significantly limit its application in the purification and denoising of axis trajectories.
Singular value decomposition is also widely used in the field of fault diagnosis and the feature extraction of rotating machinery [15]. SVD denoising maps a one-dimensional signal into a two-dimensional Hankel matrix, using effective rank to define boundaries between signal and noise spaces. It reduces the dimensionality of the signal space to obtain denoised signals [16]. The dimension of the Hankel matrix directly affects its denoising effect [17], with the maximum dimension method commonly used to determine the dimension [18,19]. References [20,21] applied the maximum dimension method to construct Hankel matrices for SVD, achieving good denoising effects. Reference [5] utilized an improved SVD algorithm to optimize the matrix structure and effective component selection mechanisms, achieving axis trajectory purification. It has been proven that using SVD and determining the Hankel matrix structure with the maximum dimension method enables maximum signal decomposition, resulting in excellent denoising and feature extraction effects suitable for axis trajectory purification.
Common methods for extracting axis trajectory characteristics include invariant moments [22,23,24] and Fourier descriptors [25,26], with the invariant moment method being more widely used. Invariant moments primarily characterize the geometric features of image regions and possess the mathematical properties of invariance to rotation, translation, and scale. The two-dimensional shape invariant moment method identifies shapes by extracting invariant moments from axis trajectory images.
Reference [27] proposed a fault diagnosis model that integrates Hu invariant moments and deep convolutional autoencoder features, achieving high accuracy in axis trajectory recognition. Reference [28] utilized the affine invariant moments of axis trajectories combined with artificial neural networks for axis trajectory recognition. Reference [29] introduced a combination of Hu moments and affine moments as feature vectors and used an improved particle swarm algorithm and BP neural network to recognize axis trajectories. However, the invariant moment method is sensitive to noise and is computationally complex.
Currently, scholars have invested considerable effort in the purification and noise reduction of axis motion trajectories, as well as in feature extraction. Many researchers have applied methodologies from related fields to this area, achieving notable results. However, challenges such as poor noise reduction effects and large data volumes for feature extraction still persist. This paper focuses on analyzing the characteristics of axis motion trajectories to address the issue of identifying the operational state of rotor systems. By constructing axis trajectory sample signals from the original vibration signals and employing singular value decomposition, the axis trajectory sample signals were purified and denoised. The distance sequence representation method was used to achieve the curvature region segmentation of the axis trajectory images, further enabling the accurate extraction of axis motion trajectory features. The experimental data from an imbalance condition were verified using an eddy current displacement sensor on a multi-disk rotor test rig, with results indicating that this method is effective.
2. Feature Extraction Method for Axis Motion Trajectories
This method for extracting axis motion trajectory characteristics is primarily based on the distance sequence representation method, incorporating singular value decomposition. Using SVD, the axis trajectory signals are purified and denoised. Subsequently, the signals undergo centering and normalization. The distance sequence representation method is then employed to derive data sequences that characterize the geometric features of the axis motion trajectory. The methodology consists of three main components: the purification and denoising of axis trajectory signals, the preprocessing of axis trajectory signals, and the extraction of axis trajectory signal features, as illustrated in Figure 1.
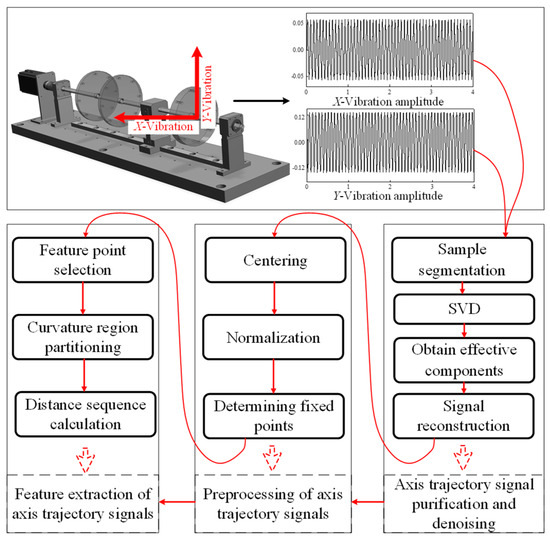
Figure 1.
Feature extraction method for axis motion trajectories.
2.1. Axis Trajectory Signal Purification and Denoising
Before purifying and denoising the data, considering the large number of data in a single sample of the original signal, sample segmentation is performed on the signals in both directions along the time series for easier subsequent calculations. The segmented samples are synthesized to obtain the axis trajectory sample signal.
Figure 2a shows the axis trajectory signal synthesized from the time domain original vibration displacement signals in two directions. It can be observed that the axis trajectory pattern is unclear, the curves are disordered, and there is significant noise interference.
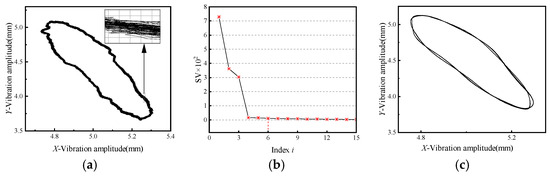
Figure 2.
Axis trajectory purification and denoising process. (a) Original axis trajectory; (b) the trend of the first 15 singular values, with the specific values of each singular value indicated by red “*” in the figure; (c) the axis trajectory after purification and denoising.
After the sample segmentation of the original signal, single sample signals are taken, and a Hankel matrix is constructed using the maximum dimension method. SVD is performed to obtain the singular values arranged in descending order, as shown in Figure 2b. Starting from the sixth singular value, the singular values remain relatively stable. The first six singular values are selected to reconstruct the signal, and the same process is applied to the single sample signals in both directions.
The reconstructed signals in both directions are then synthesized into a single sample axis trajectory. The results of purification and denoising are shown in Figure 2c. Compared to the original axis trajectory pattern, the purified and denoised single sample axis trajectory pattern retains the key geometric features of the axis trajectory to the greatest extent, facilitating the subsequent feature extraction.
2.2. Axis Trajectory Signal Preprocessing
The positions and angles of the data acquisition equipment cannot be expected to remain constant, and the distribution and magnitude of axis trajectory signals in the two-dimensional plane vary under different working conditions. These variations inevitably affect the extraction of axis trajectory characteristics. To eliminate such influences, the axis trajectory data are preprocessed through centering and normalization.
- 1.
- Centering
The axis trajectory signal is synthesized from the vibration displacement signals collected in two perpendicular directions. Let the two sets of collected vibration displacement signals be and , where is the length of the data sequence. The centering process is as follows:
where and are the original vibration displacement signal data and and are the centered data. Here, , , and represent the mean values of the data.
- 2.
- Normalization
Normalization is applied to scale the data to a specific range to avoid the impact of differences in data magnitude. In this paper, the axis trajectory data are mapped to the interval [−1, 1], as follows:
where and are the centered vibration displacement signals and and are the normalized vibration displacement signals.
After centering and normalization, the original axis trajectory pattern is shifted towards the origin and mapped to the interval [−1, 1], as shown in Figure 3. The origin is chosen as the sole fixed point for subsequent calculations in the extraction of axis trajectory signal features.
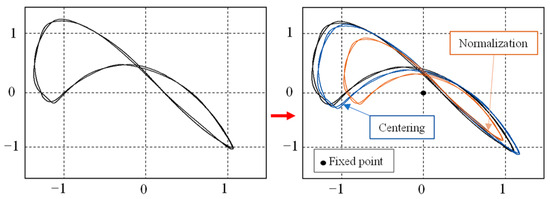
Figure 3.
The preprocessing results of the axis trajectory signals.
2.3. Axis Trajectory Signal Feature Extraction
This paper applies the distance sequence representation method to extract features from axis trajectory signals. Using the adaptive feature point selection method, the axis trajectory pattern is traversed to obtain a series of feature coordinates. The distances between each feature coordinate and the unique fixed point in the two-dimensional plane are then sequentially calculated, resulting in a distance data sequence that characterizes the geometric features of the pattern. The main process includes two parts: feature point selection and distance data sequence calculation. The specific principles and process are as follows.
2.3.1. Feature Point Selection
The curvature changes vary across different regions of the axis trajectory pattern. Therefore, the same feature point selection principle cannot be applied to the entire pattern. Specific feature point selection principles need to be applied to regions with relatively significant curvature changes to maximize the retention and highlighting of the pattern’s distinguishing features. The process involves dividing the pattern into regions and selecting feature points based on the curvature of each region.
- 1.
- Pattern region division
The purified and preprocessed axis trajectory sample signal , where and , consists of a series of coordinates. If any point is selected, and a second point and a third point are selected, the vectors , , and are formed with the origin . The vectors and can be obtained, and the angle between the two vectors is calculated as follows:
where represents the dot product, represents the angle between the vectors and , and represents the magnitude of the vector .
By setting an angle threshold and comparing the value of with , the type of point can be determined. If , the point is classified as a high curvature point; otherwise, it is classified as a general curvature point. By processing all coordinate points in the pattern in this manner, the pattern can be divided into two regions, designated as the high curvature region and the general curvature region, as shown in Figure 4.
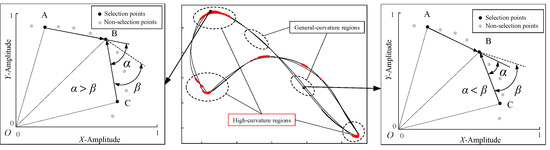
Figure 4.
Pattern region division.
- 2.
- Feature Point Selection Principles
For the entire axis trajectory pattern, the overall principle is to select feature points at equal intervals, but different intervals are chosen for different regions. In the general curvature region, feature points are selected using a large interval principle, while in the high curvature region, a small interval principle is applied. After multiple parameter adjustments, the final intervals are determined as follows:
Figure 5 shows the feature point selection results for a set of measured axis trajectory sample signals. It can be seen that the pattern regions are effectively divided, and there are clear differences in the feature point selection principles between the high curvature and general curvature regions.
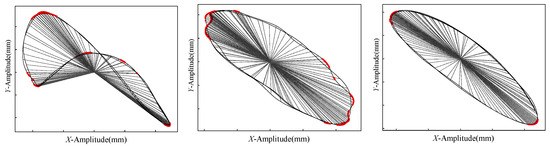
Figure 5.
Feature extraction results.
2.3.2. Distance Data Sequence Calculation
After selecting the feature points, a series of feature coordinates and are obtained. These feature coordinates form a shape in the two-dimensional plane that approximates the original axis trajectory pattern.
Taking the coordinate , the distance from this point to the origin is calculated as follows:
where represents the distance between the first coordinate point and the origin .
By traversing all the feature coordinates and performing the calculation in Equation (5), a distance data sequence is obtained, as shown in Figure 6.
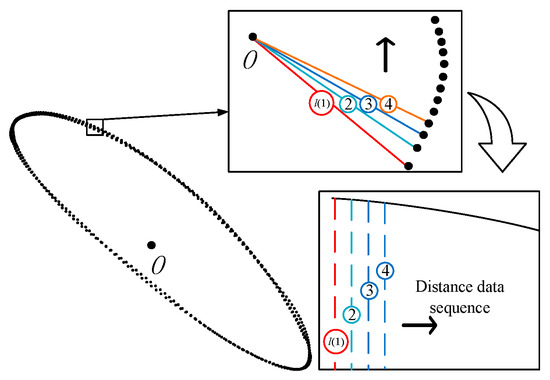
Figure 6.
Calculation of distance data sequences, where “ l(1), 2, 3, 4” in the figure correspond to L(1), L(2), L(3), L(4) in Equation (5).
After the axis trajectory signal has been purified, denoised, preprocessed, and feature extracted, the original axis trajectory signal is transformed into a concise data sequence that characterizes the geometric features of the axis trajectory.
The next step is to obtain measured data through a rotor test bench for method validation, as illustrated in Figure 7.
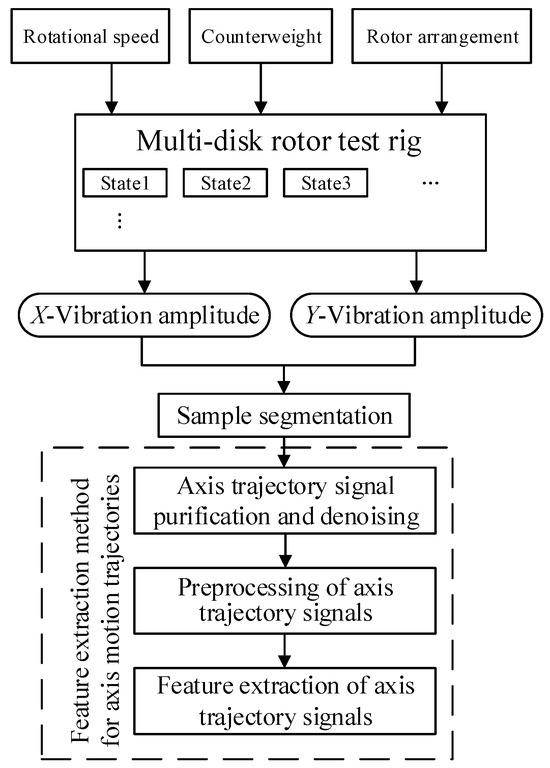
Figure 7.
Calculation of distance data sequences.
3. Application Example
3.1. Experimental Equipment
This study validates the axis motion trajectory feature extraction method using data obtained from a custom-built multi-disk rotor test bench. As depicted in Figure 8a, the test bench comprises a servo motor, disk rotors, a base, and supports. It can achieve a maximum speed of 1300 r/min and supports three different rotor configurations, with each rotor disk capable of holding up to eight weights.
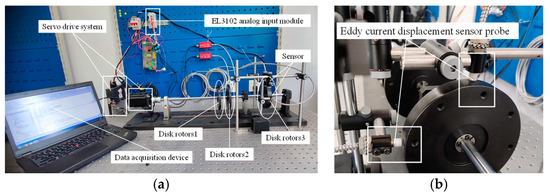
Figure 8.
Test bench details. (a) Multi-disk rotor test rig; (b) arrangement of eddy current displacement sensors.
During the experiment, two sets of eddy current displacement sensors collected vibration displacement signals at a sampling frequency of 16 kHz. For each experimental condition, a single sensor recorded 65,536 data points per sampling session.
As illustrated in Figure 8b, the sensors were arranged perpendicularly to each other to measure the displacement of the object in the vertical direction. The experiment focused on the third disk rotor to obtain vibration displacement signals representing the operating state of the entire rotor system.
3.2. Axis Trajectory Experimental Data
The detailed experimental conditions are shown in Figure 9. Vibration displacement signals were collected under nine different experimental conditions on the rotor test bench, as detailed in Table 1. The original axis trajectories synthesized from the unprocessed vibration displacement signals are shown in Figure 10.
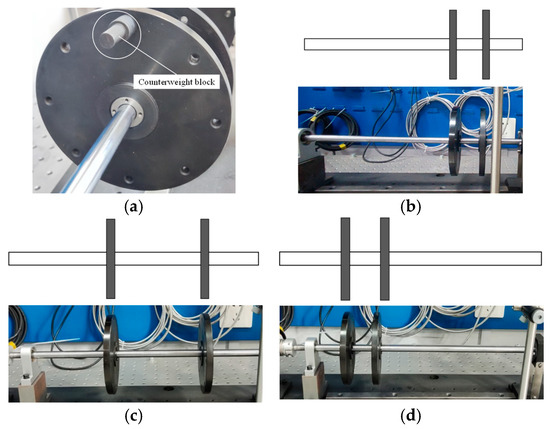
Figure 9.
Experimental operating condition configuration. (a) Adding counterweights; (b) configuration of rotor type 1; (c) configuration of rotor type 2; (d) configuration of rotor type 3.

Table 1.
Specific experimental condition settings.
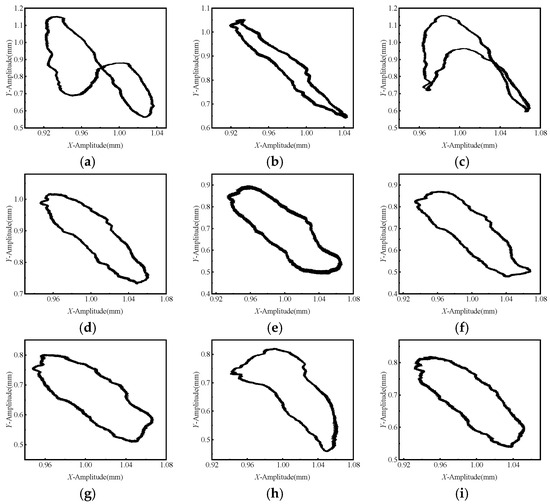
Figure 10.
Original axis trajectory. (a) Experimental condition 1; (b) experimental condition 2; (c) experimental condition 3; (d) experimental condition 4; (e) experimental condition 5; (f) experimental condition 6; (g) experimental condition 7; (h) experimental condition 8; (i) experimental condition 9.
In the first rotor arrangement, increasing speed directly alters the shape of the axis trajectory, exacerbating the unbalanced state. Adding weights makes the axis trajectory more convoluted, further complicating the unbalanced condition. In the second rotor arrangement, changes in speed and weight have a relatively minor effect on the axis trajectory shape. In the third rotor arrangement, changes in speed affect the axis trajectory shape similarly to the first type, altering its shape.
3.3. Axis Motion Trajectory Feature Extraction
The original signals are segmented into samples, with each sample containing 3000 data points. The axis trajectory signals are then purified and denoised. Using the maximum dimension method, a Hankel matrix is constructed and SVD decomposition is performed on the sample signals.
To achieve effective denoising, the effective singular value sequence is selected based on the magnitude relationship of the singular values of the original signal. The results of denoising and purification are presented in Figure 11.
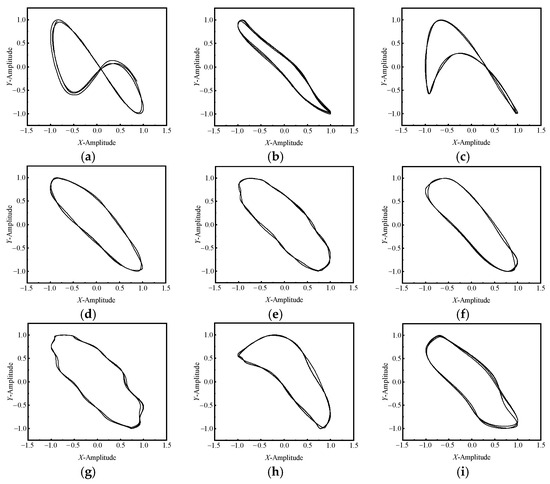
Figure 11.
Axis trajectory purification and denoising results. (a) Experimental condition 1; (b) experimental condition 2; (c) experimental condition 3; (d) experimental condition 4; (e) experimental condition 5; (f) experimental condition 6; (g) experimental condition 7; (h) experimental condition 8; (i) experimental condition 9.
The SVD-processed axis trajectory sample signals yield clear and smooth curves, retaining the main geometric features while eliminating ineffective components. Subsequently, the axis trajectory signals are divided into regions categorized as general curvature regions and abrupt curvature change regions. This division informs the selection of feature points, completing the representation of the axis trajectory pattern using a distance sequence. The distance sequence representation results for each experimental condition are shown in Figure 12.
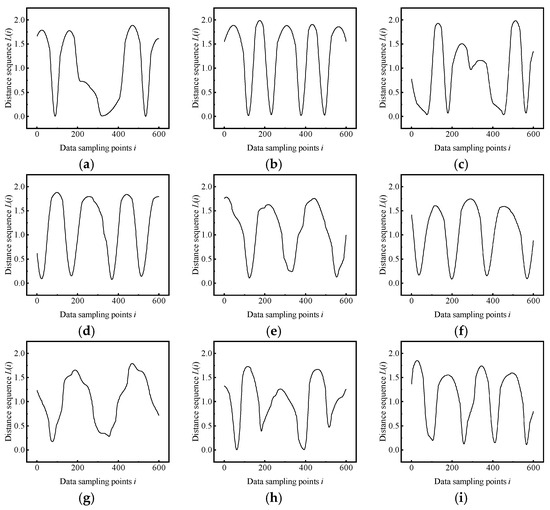
Figure 12.
Results of axis trajectory feature extraction. (a) Experimental condition 1; (b) experimental condition 2; (c) experimental condition 3; (d) experimental condition 4; (e) experimental condition 5; (f) experimental condition 6; (g) experimental condition 7; (h) experimental condition 8; (i) experimental condition 9.
As depicted in Figure 12, with changes in speed and weight, the rotor system’s imbalance worsens and becomes more complex. These changes are captured by the distance sequences and reflected in the final feature signals. It is evident that for different experimental conditions, the distance sequences effectively represent the axis trajectory patterns, reflecting the shape characteristics of the axis trajectory while significantly reducing the data volume.
Figure 13a illustrates the peak-to-peak values of distance sequences under various experimental conditions. It can be observed that, regardless of changes in speed or weight, rotor arrangement type 1 consistently exhibits the highest peak-to-peak values. This indicates that the unbalanced state of rotor arrangement type 1 is more severe and highly sensitive to changes in speed. Similarly, rotor arrangement type 3, which is also in an extreme arrangement position, shows a similar trend to type 1, with changes in speed and weight further exacerbating its unbalanced state. In contrast, rotor arrangement type 2, positioned in the middle, presents an opposite scenario. As seen in Figure 10, the axis trajectory patterns of type 2 tend to be elliptical, suggesting a more stable operating state.
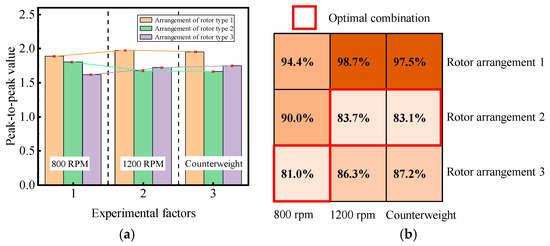
Figure 13.
Analysis of distance sequence representation results. (a) Peak-to-peak values of various experimental conditions; (b) percentage of peak-to-peak values for each experimental condition.
By setting the peak-to-peak value of 2.0 as 100% and using this as a baseline to calculate the percentage of each peak-to-peak value, as shown in Figure 13b, an optimal series of matches can be obtained. Considering the different impacts of speed and weight on the peak-to-peak values, the weight proportions for speeds of 800 RPM, 1200 RPM, and added weight are set at 40%, 40%, and 20%, respectively. The total percentages for each rotor arrangement are calculated as 96.74%, 86.1%, and 67.1%. It is evident that rotor arrangement type 3 has the best general applicability.
4. Conclusions
This study investigates the feature extraction of axis motion trajectories, constructing a method based on distance sequence representation and validating it with measured data from a multi-disk rotor test rig. The conclusions are as follows:
- 1.
- SVD is well suited for purifying and denoising axis trajectories. With a small parameter count, simple parameter determination, and brief processing steps, it effectively achieves the purification and denoising of rotor system axis trajectories by truncating smaller singular values and reconstructing the signals using larger singular values that contain more feature information.
- 2.
- The distance sequence representation method accurately captures the significant geometric features of axis motion trajectories under various operating conditions, including both macroscopic shape features and microscopic texture features, facilitating further research on the classification and identification of axis trajectories.
- 3.
- The axis motion trajectory feature extraction method is applicable to multiple unbalanced states. It can effectively extract significant features of various operating states of the rotor system from the original signals, with an approximately 80% reduction in data volume compared to the initial axis trajectories, making it significant for judging the operating states of the rotor system.
Author Contributions
Conceptualization, F.Y., J.P. and E.D.; Methodology, E.D., F.Y. and Y.S.; Validation, F.Y., J.P. and Z.Z.; Supervision, J.P, F.Y. and Z.Z. All authors have read and agreed to the published version of the manuscript.
Funding
This research was funded by the Key R&D projects in Henan Province (231111222900) and the joint fund (industrial sector) of R&D projects in Henan Province (225101610003).
Institutional Review Board Statement
Not applicable.
Informed Consent Statement
Not applicable.
Data Availability Statement
Data are contained within the article.
Conflicts of Interest
The authors declare no conflicts of interest.
References
- Wang, L.Q.; Cui, L.; Zheng, D.Z.; Gu, L. Nonlinear Dynamics Behaviors of a Rotor Roller Bearing System with Radial Clearances and Waviness Considered. Chinese. Chin. J. Aeronaut. 2008, 21, 86–96. [Google Scholar]
- Zhang, W.B.; Zhou, X.J.; Li, J.S.; Shen, L.; Lin, Y.; Yang, X.Y. Purification of rotor center’s orbit based on generalized morphological filter. J. Zhejiang Univ. (Eng. Sci.) 2010, 44, 893–896. [Google Scholar]
- Guo, M.J.; Li, W.G.; Yang, Q.J.; Zhao, X.Z. Purification of the axis trajectory of a rotor supported by sliding bearings based on the number rule of effective singular values. J. Vib. Shock 2019, 38, 155–161. [Google Scholar]
- Liu, C.; Wu, Y.J.; Zhen, C.G. Rolling Bearing Fault Diagnosis Based on Variational Mode Decomposition and Fuzzy C Means Clustering. Proc. CSEE 2015, 35, 3358–3365. [Google Scholar]
- Su, Z.N.; Ma, J.; Wang, X.D.; Xiong, X. Rapid purification of rotor system axis trajectory based on improved SVD algorithm. J. Vib. Shock 2023, 42, 144–154. [Google Scholar]
- Liu, X.N.; Liu, P.; Liu, S.M.; Yang, C.M. A novel integrated morphology-wavelet filter algorithm used for ultra high-speed protection of power systems. Proc. CSEE 2002, 22, 19–24. [Google Scholar]
- Zhou, J.B.; Shi, W.F.; Lan, Y.; Zhang, W.; Lu, J. Location and Identification of Micro-Grid Power Quality Disturbances Based on Modified Morphological Filter and Arc Length Differential Sequence. Trans. China Electrotech. Soc. 2017, 32, 21–34. [Google Scholar]
- Hu, A.J.; Tang, G.J.; An, L.S. De-noising technique for vibration signals of rotating machinery based on mathematical morphology filter. J. Mech. Eng. 2006, 42, 127–130. [Google Scholar] [CrossRef]
- An, L.S.; Hu, A.J.; Tang, G.J.; Xiang, L. Purification of rotor center’s orbit with mathematical morphology filters. J. Power Eng. 2005, 25, 550–553, 586. [Google Scholar]
- Guo, M.J.; Li, W.G.; Yang, Q.J.; Zhao, X.Z. Sparse Algorithm-Based Purification of Multi-Condition Axis Trajectory of Large Rotor. J. South China Univ. Technol. (Nat. Sci. Ed.) 2020, 48, 45–53. [Google Scholar]
- Li, Z.; Li, W.G.; Zhao, X. Feature Frequency Extraction Based on Principal Component Analysis and Its Application in Axis Orbit. Shock Vib. 2018, 2018, 2530248. [Google Scholar] [CrossRef]
- Qi, K.Y.; He, Z.J.; Zi, Y.Y. Application of Empirical Mode Decomposition Method to Friction Fault Diagnosis for Gas Turbo. J. Vib. Meas. Diagn. 2006, 4, 265–268+329. [Google Scholar]
- Liu, D.; Zeng, H.; Xiao, Z.; Peng, L.; Malik, O.P. Fault diagnosis of rotor using EMD thresholding-based de-noising combined with probabilistic neural network. J. Vibroeng. 2017, 19, 5920–5931. [Google Scholar] [CrossRef][Green Version]
- Jiang, F.; Zhu, Z.; Li, W.; Xia, S.; Zhou, G. Lifting load monitoring of mine hoist through vibration signal analysis with variational mode decomposition. J. Vibroeng. 2017, 19, 6021–6035. [Google Scholar] [CrossRef]
- Guo, M.J.; Li, W.G.; Yang, Q.J.; Zhao, X.Z.; Tang, Y.L. Amplitude filtering characteristics of singular value decomposition and its application to fault diagnosis of rotating machinery. Measurement 2020, 154, 107444. [Google Scholar] [CrossRef]
- Zhang, J.R.; Li, W.G.; Li, Z.; Zhao, X.Z. Purification for a large rotor axis’s orbit based on the difference spectrum theory of singular value. J. Vib. Shock 2019, 38, 199–205. [Google Scholar]
- Zhao, X.Z.; Ye, B.Y. Similarity of signal processing effect between Hankel matrix-based SVD and wavelet transform and its mechanism analysis. Mech. Syst. Signal Process. 2009, 23, 1062–1075. [Google Scholar] [CrossRef]
- Tang, M.X.; Wu, X.J.; Cong, M.; Guo, K. A method based on SVD for detecting the defect using the magnetostrictive guided wave technique. Mech. Syst. Signal Process. 2016, 70, 71601–71612. [Google Scholar] [CrossRef]
- Zhao, X.Z.; Shao, Q.P.; Ye, B.Y.; Cheng, T.J. Matrix Dimension Considering Frequency Factor in Singular Value Decomposition. J. Mech. Eng. 2019, 55, 7–16. [Google Scholar]
- Ding, J.M.; Lin, J.H.; Zhao, J. Detection of the Dynamic Imbalance with Cardan Shaft in High-speed Train Applying EEMD-Hankel-SVD. J. Mech. Eng. 2015, 51, 143–151+159. [Google Scholar] [CrossRef]
- Zhao, X.Z.; Ye, B.Y.; Chen, T.J. Selection of effective singular values based on curvature spectrum of singular values. J. South China Univ. Technol. (Nat. Sci. Ed.) 2010, 38, 11–18+23. [Google Scholar]
- Chen, X.Y.; Zhang, K.W. Application of a new moment invariant to identification of axis orbit in hydro-generator unit. J. South China Univ. Technol. (Nat. Sci. Ed.) 2006, 34, 79–81+84. [Google Scholar]
- Wang, B.S.; Liu, Y.Q.; Zhang, B. Characteristics analysis on bearing rotor system of high-speed train under variable speed conditions. Chin. J. Theor. Appl. Mech. 2022, 54, 1839–1852. [Google Scholar]
- Jia, R.; Zhang, P.G.; Zhang, X.W.; Wu, H.; Lu, Y. Identification of shaft centerline orbit of hydropower units based on neural network improved by genetic algorithm. J. Hydroelectr. Eng. 2013, 32, 277–281. [Google Scholar]
- Boldys, J.; Flusser, J. Extension of moment features’ invariance to blur. J. Math. Imaging Vison 2008, 32, 227–238. [Google Scholar] [CrossRef]
- Fu, B.; Zhou, J.Z.; Chen, W.Q.; Yu, B.H. A method based on Fourier Descriptors to Recognize Shaft Orbit. Autom. Electr. Power Syst. 2004, 28, 40–44+50. [Google Scholar]
- Burla, A.; Haist, T.; Lyda, W.; Osten, W. Fourier descriptors for defect indication in a multiscale and multisensory measurement system. Opt. Eng. 2011, 50, 043603. [Google Scholar] [CrossRef]
- Fu, B.; Zhou, J.Z.; Peng, B.; Zhao, B. Auto-recognition of Shaft Orbits Using Affine Moment Invariants. J. South China Univ. Technol. (Nat. Sci. Ed.) 2007, 35, 119–122. [Google Scholar]
- Chen, X.Y.; Yan, H.Q.; Sun, J.P. Shaft Orbits Identification of Hydroelectric Generators Based on PSO-BP and Combined Moment. J. Vib. Meas. Diagn. 2016, 36, 108–114. [Google Scholar]


Disclaimer/Publisher’s Note: The statements, opinions and data contained in all publications are solely those of the individual author(s) and contributor(s) and not of MDPI and/or the editor(s). MDPI and/or the editor(s) disclaim responsibility for any injury to people or property resulting from any ideas, methods, instructions or products referred to in the content. |
© 2024 by the authors. Licensee MDPI, Basel, Switzerland. This article is an open access article distributed under the terms and conditions of the Creative Commons Attribution (CC BY) license (https://creativecommons.org/licenses/by/4.0/).