Abstract
TEVAR (thoracic endovascular aortic repair) is the preferred approach for treating descending thoracic aortic aneurysm (DTAA). After the procedure, patients require lifelong CTA (computed tomography angiography) follow-up to monitor the aorta’s remodeling process and the possible development of associated complications. With CTA, the aorta is usually measured with maximum diameters taken at specific locations, and even in experienced centers, this type of evaluation is prone to inter-observer variability. We introduce a new volumetric analysis of aortic changes after TEVAR using three-dimensional (3D) anatomical models. We applied the volumetric analysis to 24 patients who underwent TEVAR for DTAA. For each patient, the descending thoracic aorta was evaluated using both the maximum diameter from CTA and the volume from 3D reconstructions, at discharge and 12 months after TEVAR. Both volume and diameter evaluations were then related to the development of TEVAR complications. The group with TEVAR-related complications showed a 10% volume increase in the descending aorta, while the group with no TEVAR-related complications only had a 1% increase. An increase of 40 mL in the descending aorta volume at 12 months seemed to be predictive of complications, with 94% specificity and 75% sensitivity. Volumetric analysis is a promising method for monitoring DTAA remodeling after TEVAR, and it may help in the early identification of high-risk patients who may benefit from a stricter follow-up, even if further evaluations on a larger sample size are required to confirm these preliminary results.
1. Introduction
Thoracic endovascular aortic repair (TEVAR) is a low-invasive, effective technique for the treatment of descending thoracic aortic aneurysms (DTAAs), complicated type B aortic dissection, penetrating aortic ulcers, and traumatic aortic transections [1].
The expected benefit of TEVAR is a positive remodeling of the diseased aorta, whether through the expansion of the true lumen and thrombosis of the false lumen in dissections or by causing thrombosis of the aneurysmal sac while keeping the aortic lumen patent in DTAA [2].
Currently, TEVAR is the preferred approach for the treatment of descending thoracic aortic pathology, with improved early survival and lower rates of perioperative morbidity compared to open surgery [3,4,5].
Although mid-term survival is similar between endovascular and open surgery, patients undergoing TEVAR have a higher rate of mid- to long-term complications and reintervention, and life-term imaging follow-up is needed to monitor the evolution of the stent graft and its relationship with the aorta [6,7].
Possible complications include the development of endoleaks, retrograde dissection, stent-induced new entry tear (SINE), stent graft migration, stent graft fracture, and degenerative aortic changes at the level of the landing zones. Any one of these complications, or a combination thereof, can lead to an increase in the size of the diseased aorta, resulting in negative aortic remodeling [8,9].
Computed tomography angiography (CTA) is the preferred imaging modality for post-TEVAR surveillance, while magnetic resonance angiography (MRA) is a viable alternative despite generally having additional limitations due to metallic artifacts of the stent graft [5]. In patients that undergo TEVAR for DTAA repair, CTA surveillance imaging is recommended after 1 month, 12 months, and, if the disease remains stable, every year after that [10].
In clinical practice, aortic remodeling after TEVAR is evaluated with CTA in the same way a native aorta is evaluated, with diameter measurements taken perpendicularly to the long axis of the aorta, at specific locations as well as at the level of the excluded DTAA and any other aortic pathologic segments, with the maximum diameter usually reported [5,10].
As the thoracic aorta is a cylindrical structure that presents some fixed curvatures at the ascending and proximal descending levels and may be quite tortuous in its descending portion, multiplanar reformats (MPRs) orthogonal to the aortic flow axis should be created for each measurement in order to avoid over- or under-estimation of the aortic diameters [10].
These measurements are subjected to some degree of inter-observer variability even in experienced centers, and a standardized, repeatable measurement method is still to be realized [11].
Three-dimensional (3D) virtual modeling obtained from patient diagnostic imaging represents a new and exciting application in the field of bioengineering, with considerable potential both for patient care and for referring clinicians or surgeons [12]. One of these applications is represented by the possibility of examining volumes of various structures or organs, providing information useful for both the pre-operative planning and disease-related prognosis of cancer lesions [13,14].
The main objective of our study was to use 3D virtual modeling to estimate the volumes of the DTAA after TEVAR and to evaluate any mid-term changes of these volumes after the procedure.
The secondary objective was to compare these results with the standard of care of CTA diameter measurements and to evaluate if this type of analysis can be more accurate in identifying early aortic remodeling in the routine CTA surveillance protocol that these patients undergo.
2. Materials and Methods
Patients who underwent TEVAR for DTAA at our institution between December 2011 and December 2014 were retrieved from the local picture archiving and communication system; all consecutive patients with DTAA treated with TEVAR who underwent follow-up CTA for at least 12 months following the treatment met the inclusion criteria. For the study, a total of 30 patients were included.
This study was approved by the local ethics committee (CE-AVEC, S.Orsola-Malpighi Hospital, Bologna, Italy; study protocol n.101/2011/O/Tess, code GRFE-2011, approved on 13 September 2011). All procedures involving human subjects were performed following the ethical standards of the institutional and national research committee and with the 1964 Helsinki Declaration and its later amendments or comparable ethical standards. Informed consent was obtained from all individual participants included in the study.
Demographic, clinical, and laboratory data were collected, with particular attention given to inflammatory markers.
2.1. CTA Protocol
All CTAs were performed with a 64-row (128 slices) CT scanner (Brilliance iCT SP, Philips Healthcare, Andover, MA, USA). An unenhanced CT scan preceded the CTA. 80 mL of contrast media (Iomeprol 350 mgI/mL, Iomeron 350, Bracco, IT) was administered, followed by a saline chaser (30 mL) using a dual-syringe injector (Medrad Stellant, Bayer, Germany).
Bolus trigger technique was used by placing a region of interest (ROI) in the ascending aorta with a 150 HU threshold and 13 s of fixed delay for the angiographic phase, which was followed by a delayed phase (35 s after the former).
The CTA was performed at 100 kVp to optimize the aortic opacification from the iodinated contrast media, with a pitch of 1.234, a rotation time of 270 ms. Automatic tube current modulation (DoseRight) was used, and the CTA images were reconstructed with 2 mm thick slices at 1 mm increments.
2.2. Diameter Measurement from 2D CTA Imaging
Descending thoracic aortic maximum diameters were taken by manual measurements with MPR reconstructions orthogonal to the aortic flow axis at 5 different regions relative to the stent graft into which the descending aorta was divided (Figure 1):
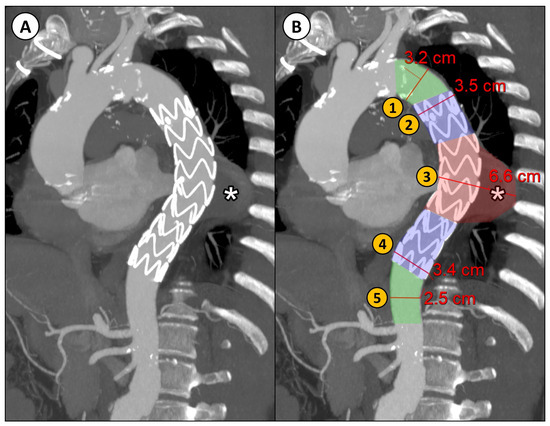
Figure 1.
(A) CTA parasagittal MPR with maximum intensity projection (MIP) reconstruction of the thoracic aorta in a patient with DTAA (*) treated with TEVAR; (B) an example of the manual diameter evaluation of the aorta at five different levels relative to the implanted stent graft: (1) proximal neck (native aorta between the origin of the left subclavian artery and the proximal landing zone of the stent graft); (2) proximal landing zone of the stent graft; (3) aneurysm; (4) distal landing zone of the stent graft; (5) distal neck (native aorta between the distal landing zone of the stent graft and the origin of the celiac trunk).
- Proximal neck (native aorta between the origin of the left subclavian artery and the proximal landing zone of the stent graft);
- Proximal landing zone of the stent graft;
- Aneurysm;
- Distal landing zone of the stent graft;
- Distal neck (native aorta between the distal landing zone of the stent graft and the origin of the celiac trunk).
Maximum aortic diameters were estimated from the CTA images of the retrospectively reviewed patients, both at discharge and 12 months after TEVAR, and the presence of TEVAR-related complications (e.g., endoleak or stent graft migration) were reported, blinded to the outcomes of the patient.
Two variables were considered for this standard 2D CTA-based analysis: the net difference between the estimated maximum diameter at the 12-month follow-up and the one at discharge (Diameterchange NET, see Equation (1)), and the corresponding percentual difference, referred to as the maximum diameter at discharge (Diameterchange REL, see Equation (2)),
2.3. Volumetric Analysis
Volumetric analysis consists of 3D virtual model reconstruction of the patient anatomy, starting with image segmentation of diagnostic images, followed by automatic computation of the volumes of some selected aortic segments. All 3D virtual model reconstructions, based on high-quality CTA scans at discharge and at the 12-month follow-up, were carried out by engineers at our institution.
2.3.1. Image Segmentation
Segmentation of the descending thoracic aorta was achieved using D2P™ software, v. 1.0.2.2055 (‘DICOM to PRINT’; 3D Systems Inc., Rock Hill, SC, USA). D2P™ is a cleared medical device software intended for pre-operative surgical planning and the production of 3D-printed anatomic models for diagnostic purposes. D2P focuses on creating a workflow consisting of as few steps as possible to provide a segmentation tool that is useable for clinicians with limited experience in image processing [15].
A combination of semi-automatic tools (multi-slice interpolation and threshold segmentation) in D2P™ software was used to segment each anatomical structure of interest (aorta, thrombus, and stent graft) in the descending thoracic aorta, from the left subclavian artery to the celiac trunk.
In detail, the contrast containing aorta was automatically segmented using the automatic vascular segmentation option, and the Smart Brush tool was used to manually extend the mask to unmasked areas with the use of a threshold range (HU 100–500). The aneurysm and the intraluminal thrombus were segmented using the Multi-Slice Interpolation tool plus Brush tool and Eraser tool. For the stent graft, the Threshold tool (HU 600–2500) was used.
The segmentation results and the anatomical accuracy of the reconstructed 3D virtual models were reviewed by two experienced radiologists. To validate the reconstructed 3D virtual models, the two radiologists carefully examined the 3D anatomical reconstructions in relation to the CTA scan projections (axial, coronal, and sagittal) that D2P™ software provides contextually for the segmentation masks.
2.3.2. Volume Computation
The segmented aorta was then divided into the same 5 parts, as previously described for the diameter measurements (Figure 2).
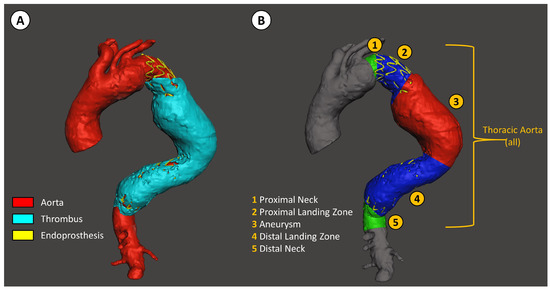
Figure 2.
Descending thoracic aorta volume analysis with D2P software. (A) Segmentation of the aorta, the thrombus inside the aneurysm, and the stent graft. (B) Segmentation of the descending thoracic aorta relative to the position of the stent graft, defined as: (1) the native aorta proximal to the stent graft landing zone, (2) the proximal stent graft landing zone, (3) aneurysm, (4) distal stent graft landing zone, and (5) the native aorta distal to the stent graft landing zone.
The volume of each region was then calculated in Matlab R2019a using the stlVolume function, which, given a surface triangulation, computes the volume enclosed using the divergence theorem. The assumption for this function is having triangle nodes of the surface ordered correctly (i.e., the computed normal is outward). The function outputs the total volume enclosed and the total area of the surface [16].
These segments were then evaluated both separately and grouped as global descending thoracic aorta. All these volumes were analyzed at discharge (DIS) and at the 12-month (12 M) follow-up.
Volumetric analysis was performed blinded to the outcomes and presence of complications.
Two variables were considered for the volumetric analysis: the net difference between the absolute values of the computed volume at the 12 M follow-up and at discharge (Volumechange NET, see Equation (3)), and the corresponding percentual difference, referred to as the volume at discharge (Volumechange REL, see Equation (4)),
2.4. Statistical Analysis
For all the patients included in the study, their demographic, clinical, laboratory, and TEVAR-related data were collected and analyzed.
For the analysis, both net (mm and mL) and relative (%) diameter and volume changes (see Equations (1)–(4)) were evaluated for each segment of the descending aorta and for both groups (i.e., at discharge, and at the 12 M follow-up).
The continuous data are presented as the mean ± SD and were compared using the Student t-test, after preliminarily checking for normal distribution. The categorical data are expressed as frequencies. A p value < 0.05 is considered statistically significant.
The cut-off predictive values for the continuous variables were calculated using the ROC curve method and the Youden index. Statistical analysis of all data was performed using commercially available software (SPSS V.28, IBM, Armonk, North Castle, NY, USA).
3. Results
A total of 6 of 30 patients were excluded from the study due to insufficient quality of the diagnostic imaging (e.g., the origin of the celiac trunk was not visible in the thoracic CTA scan).
Therefore, a total of 24 patients were included; their demographics and clinical data are reported in Table 1. The patients were predominately males (75%), with a mean age of 68 ± 10 years.

Table 1.
Demographic, clinical, and laboratory data of the patients included in our study. CAD, coronary artery disease; COPD, chronic obstructive pulmonary disease; CKD, chronic kidney disease; CRP, c-reactive protein; ESR, erythrocyte sedimentation rate. n.s. = not significant.
Laboratory data and, in particular, inflammatory markers were evaluated at discharge and 12 months after TEVAR; the results are reported in Table 1. Only the D-dimer levels were increased at follow-up, while the other evaluated inflammatory markers were not significantly different.
The mean clinical follow-up time after TEVAR was 55.3 ± 26.6 months. The TEVAR-related data, events, and complications during the total follow-up time are reported in Table 2. A total of 39 stent grafts were implanted, with an average of 1.6 for each TEVAR. The most frequently implanted stent graft was the Medtronic Valiant Captivia (69%); the other used stent grafts were the Bolton Relay (13%), the Gore TAG (10%), the Cook Zenith (5%), and Jotec custom stent grafts (2.5%).
Table 2.
TEVAR-related data, including procedure details and related events in the total follow-up time.
During the follow-up period, 12 patients (50%) had an endoleak, 5 of which were limited to a type II endoleak, while stent graft migration was reported in 6 patients (Figure 3).
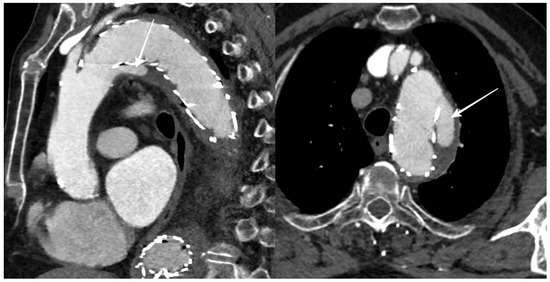
Figure 3.
CTA follow-up after TEVAR for DTAA showing blood flow outside the stent graft at the proximal landing zone (arrows), with an incomplete seal of the DTAA (type Ia endoleak).
A total of eight (33%) patients experienced TEVAR-related complications: seven patients underwent re-TEVAR, two of them acquiring another re-TEVAR in the following months. Re-TEVAR was required for degenerative changes to the distal aortic neck with type Ib endoleak in seven cases (77%), for proximal aortic neck degeneration with type Ia endoleak in one case (11%), and for both proximal and distal aortic neck degeneration in one case (11%).
Four patients died during the total follow-up time, with only one stent-related death. At 14 months after TEVAR, after progressive dilatation of the proximal landing zone, the stent graft slightly migrated downward, creating a type Ia endoleak. As the DTAA increased over time, the patient underwent surgical intervention with ascending aorta and aortic arch replacement. The patient died some days later for bowel infarction and renal ischemia caused by systemic hypotension.
The patients were divided into two groups according to the occurrence or absence of TEVAR-related complications, with 16 patients (66%) without reported TEVAR-related complications during the total follow-up time.
The results of both the diameter and volume analysis of these two groups at discharge and after 12 months are reported in Table 3.
Table 3.
Diameter and volume analyses of the descending aorta after TEVAR related to subsequent complications. Both net (mm and mL) and relative (%) diameter and volume changes are reported for each segment of the descending aorta and for both groups. n.s. = not significant.
An example of the two types of analysis is reported in Figure 4.
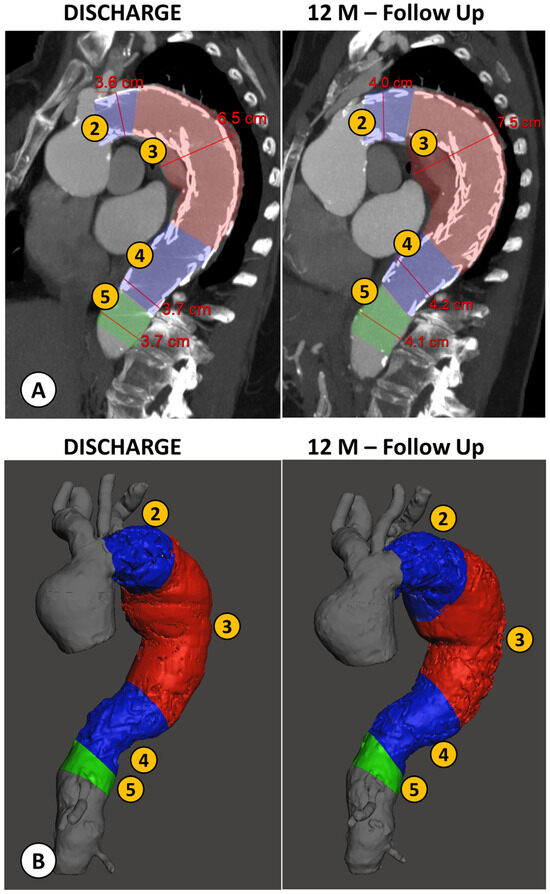
Figure 4.
Example of a patient case analyzed by both methods: the conventional manual measurement from CTA imaging using MPR reconstructions orthogonal to aortic flow axis (A) and the new volumetric analysis (B), both performed at discharge and at the 12 month follow-up (FU) after TEVAR. (1) Proximal Neck; (2) Proximal Landing Zone; (3) Aneurysm; (4) Distal Landing Zone; (5) Distal Neck.
Proximal neck measurements for both the diameter and volume evaluations were not carried out for most patients (81.25%), as the stent graft was positioned right after the origin of the left subclavian artery (landing zone 3), and as such, there was no proximal neck to evaluate.
In the diameter evaluation, only the distal landing zone was different between the two groups, with both a net (4.3 ± 8.4 mm vs. 0.2 ± 3.2 mm, p = 0.049) and relative increase (10.4 ± 18.6% vs. 0.9 ± 8.6%, p = 0.048) in the maximum diameter in patients with TEVAR-related complications compared to substantial stability in the no-complication group.
In the volumetric evaluation, except for the proximal landing zone, all other segments of the descending aorta showed significant increases in net volume changes in the TEVAR-related complication group compared to the no-complication group, which showed substantial stability. The DTAA volume increased in the TEVAR-related complication group (13 ± 33 mL) and decreased in the no-complication group (−21 ± 48 mL, p = 0.043). The distal landing zone had a net volume increase in the complication group compared to the no-complication group (17 ± 15 mL vs. 3 ± 12 mL, p = 0.022).
Both the proximal (6 ± 1 mL vs. 2 ± 1 mL, p = 0.001) and distal (22 ± 23 mL vs. 2 ± 8 mL, p = 0.030) aortic necks showed a higher increase in volume in the TEVAR-related complication group.
When evaluating the global descending thoracic aorta volumes, the patients without complications after 12 months had a mild reduction in their aortic volumes (−11 ± 51 mL), while the patients with complications had a moderate increase in these volumes (55 ± 25 mL, p = 0.001). When evaluating the ROC curve analysis for the net volume change of the descending thoracic aorta, the cut-off point to predict TEVAR-related complications was 40.4 mL (AUC of 0.906, sensibility of 0.750, and specificity of 0.938, p = 0.001) (Figure 5).
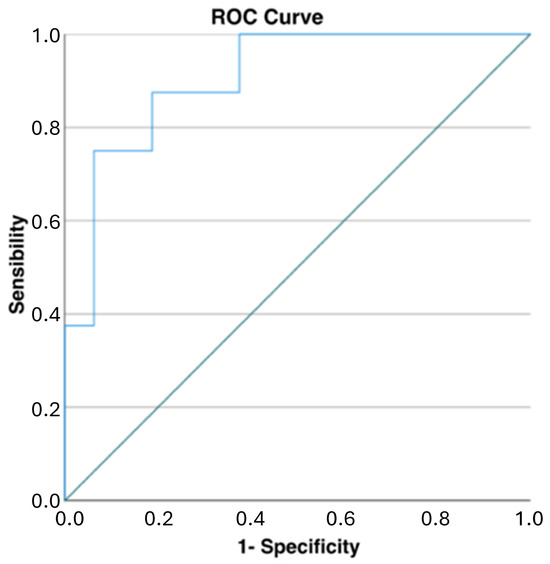
Figure 5.
ROC curve analysis for net changes in descending thoracic aortic volumes: a cut-off of 40 mL demonstrated high specificity and good sensibility in predicting TEVAR-related complications (AUC of 0.906, sensibility of 0.750, and specificity of 0.938, p = 0.001).
Relative changes in the aortic volumes were also evaluated: only the global descending thoracic aortic volumes were significantly different between the two groups, with a 10 ± 5% increase in the complication group and a 1 ± 16% increase in the no-complication group (p = 0.030).
The results of the ROC curve analysis for all diameters and volumes considered in the study are reported in Table 4.
Table 4.
Results of ROC curve analysis for all diameters and volumes considered in the study.
4. Discussion
TEVAR is a minimally invasive endovascular procedure used to treat DTAAs, and it shows several advantages compared to traditional open surgical repair, such as a lower risk of perioperative complications, shorter hospital stays, and lower mortality rates during follow-up. These advantages make TEVAR an attractive option for many patients who have a DTAA [17,18,19].
Stent grafts are designed to cover aneurysms, diverting blood flow away from the weakened, aneurismatic aorta, and restoring normal blood flow.
After the positioning of the stent graft, the aorta and the excluded aneurysm undergo a remodeling process, which ideally leads to thrombosis of the excluded aneurysm sac and reduction in or stability of the aortic aneurismatic dilatation (positive aortic remodeling).
As this remodeling process is complex and takes time, and with it, the relationship between the stent graft and the aorta or its branches can also change, possibly leading to complications like endoleaks or stent graft migration, life-time imaging follow-up of these patients is recommended, while re-TEVAR is not uncommon [10].
In addition to recognizing the appearance or increase in endoleaks, CTA follow-up is routinely used for monitoring the evolution of the aneurysm and the surrounding aorta.
As for any other aortic condition, both in the settings of acute aortic syndromes and chronic conditions, like aneurysm, dissection, or penetrating aortic ulcers, in clinical practice, the aortic dimensions are reported as the maximum diameter perpendicular to the axis of blood flow [20].
Aorta measurements must be repeatable and precise to characterize pre-existent aortic disease and its eventual progression. Measurements should be performed at specific segmental levels, as well as at the site of any aortic pathology. Using multiplanar reformats that are orthogonal to the aortic flow axis is strongly recommended [10].
Still, even in experienced centers, there is some degree of inter-observer variability when reporting aortic diameters, and the need for a more robust and objective way to measure the aortic changes and pathologies has already been expressed in the literature [11,21].
As the aorta is a cylindrical structure subjected to tortuosity and with changing dimensions or degrees of dilatation along its long course inside the body, a volumetric evaluation can be suitable to better analyze its changes both in the case of chronic aortic pathology or post-surgery/endovascular procedures [22].
A DTAA can be stable at its maximum diameter but still increase in dimension along its path, and these differences may be underestimated by a manual diameter evaluation.
As previously suggested by similar experiences of using volumetric analysis to three-dimensionally characterize pathological regions (typically tumors), a 3D-based approach may provide additional information that cannot be extracted from 2D images. Moreover, volumetric analysis, such as the one we propose in this study, allows for objective evaluation of the morpho-dimensional changes in the treated aorta (e.g., the volume of the whole vessel or portions of it), since these parameters are calculated automatically by the implemented algorithms on the 3D reconstructed vascular model (once this is validated by the radiologist). This guarantees repeatable results, regardless of the operator carrying out the assessment.
Volumetric evaluation of the aorta after endovascular aortic repair (EVAR) for abdominal aortic aneurysm has already been reported in the literature, with interesting results [23,24,25,26].
As for TEVAR, some studies have shown promising results in the context of type-B aortic dissection or post-surgery type-A residual dissection [27,28,29].
To the best of our knowledge, only Nomura et al. compared volumetric and diameter analysis in the settings of TEVAR for DTAA correction [30].
They showed that an 11.6% increase in aneurysm volume between pre-operative and follow-up CTA was associated with the development of a type I endoleak, while a pre-operative thrombus volume of 11.3% of the total aneurysm was associated with a type II endoleak. They concluded that for predicting the presence of a high-pressure endoleak after TEVAR, volume change analysis performed better than diameter change analysis.
Differently from Nomura et al., our study had a fixed range of CTA follow-up time after TEVAR (12 months instead of 6 months as a minimum), with a long clinical follow-up time (55.3 ± 26.6 months).
Compared to Nomura et al., our study specifically compared the diameters and volumes of the descending aorta between discharge and the 12-month follow-up after TEVAR, using the stent graft as a reference. In contrast, Nomura’s study compared the pre-operative volumes with those from the last available follow-up, which was at least six months post-TEVAR.
Moreover, we analyzed both the diameters and volume changes in five different descending aortic segments, and not only at the level of the DTAA, for a more precise evaluation of the complex phenomenon of aortic remodeling after TEVAR, which may impact not only the aneurysmal sac but also other portions of the descending aorta, such as the stent graft landing zones and aortic necks.
Nevertheless, we similarly observed that in patients who developed TEVAR-related complications, there was a net increase in the volume of the descending aorta, aneurysm, distal landing zone, and both the proximal and distal necks, and a relative increase (10%) in the global descending thoracic aorta volume at 12 months after CTA compared to the substantial stability of the same volume in the no-complication group.
As far as segmental analysis is concerned, it is interesting to note that the greatest relative changes in volume were identified at the level of the distal landing zone and aortic neck, suggesting that these segments may be the most susceptible to pathologic remodeling and dilatation after TEVAR. This confirms what has already been expressed in the literature regarding the importance of the optimal selection of the distal landing zone for TEVAR [31,32].
When comparing the results of both the diameter and volume changes, the diameter evaluations showed significant changes only at the distal landing zone of the stent graft, while volume analysis seemed to be more appropriate for identifying even small volume changes that occurred after TEVAR in all segments of the descending aorta, which may have been underestimated by the manual diameter measurements.
Except for the identification of endoleaks or stent graft migration, the CTA follow-up using diameters in patients with TEVAR was based on the same principles of follow-up of native DTAA, with an aneurysm growth threshold of >5 mm/year identified as a feature of high-risk for a rupture aneurysm [33].
Still, there is no consensus on when to treat patients with re-TEVAR, as it is usually a multidisciplinary decision.
Our results show a particularly high AUC score (0.906) for the net volume changes of the descending thoracic aorta (Figure 5, Table 4). Meanwhile, considering the volumetric variables for every single portion of the aorta (1, 2, 3, 4, 5), lower AUC scores were obtained. This indicates that a volume measurement considered as a whole (i.e., the entire descending thoracic aorta volume change) is more predictive than the volumetric changes in the single portions. In general, the AUC and the sensitivity/specificity scores were higher for volumetric parameters (especially for the net volume changes) than for the standard diameter evaluations, as shown in Table 4. In our study, 40 mL increases in the global descending thoracic aorta volumes after 12 months seemed to be predictive of TEVAR-related complications with high specificity (94%) and good sensibility (75%). In this scenario, this parameter could be used as a marker for patients at higher risk for re-TEVAR who may undergo a stricter CTA follow-up and an early multidisciplinary re-evaluation.
Even though this was out of the scope of our study, global descending thoracic aortic volume analysis also has another distinct feature that could represent an attractive opportunity for the follow-up of patients after TEVAR. Since the volume in segmentation analysis of the descending thoracic aorta is defined as the volume between two anatomic landmarks that are the origin of the left subclavian artery and the origin of the celiac trunk, a chest CT without the use of iodinated contrast media should be enough to generate volumetric analysis.
As these patients need life-time imaging follow-up, this could have a favorable impact for reducing both ionizing radiation exposure and iodine contrast media administration, but further studies are needed to confirm our results.
Our study has several limitations. The major limitation is the small sample size and its retrospective nature, which underpowers our analysis, even though both the diameter and volume analysis were performed blinded to the outcomes and presence of complications. The proposed volumetric analysis, which represents a preliminary evaluation, will soon be expanded by adding a greater number of cases and taking into account some patient-specific characteristics, such as the length of the aortic regions, age, body surface area, and body mass index, against which the results can be normalized.
Another limitation is related to the slice thickness of the CTA imaging of 2 mm, which is routinely used at our institution for the CTA acquisition protocol in aortic pathology, being at the upper limit of the recommended range of slice thickness according to the guidelines of our National Radiology Society.
CTA slice thicknesses smaller than 2 mm would allow for more accurate anatomical 3D reconstructions and conventional diameter evaluations.
Moreover, in this study, only the discharge and 12-month follow-up CTAs were evaluated, in contrast to a long clinical follow-up (average 4.5 years) available for these patients. Also, a pre-TEVAR CTA was not included in the analysis.
Finally, a possible limitation of the proposed volumetric analysis could be the total time required for the preparation of the 3D anatomical models. In our experience, a mean time of three hours to segment and validate the 3D reconstructions of the aortic vasculature at both discharge and the 12-month follow-up with the radiologist is required.
5. Conclusions
In this study, we showed that aortic volume analysis after TEVAR is feasible and has the potential to increase the understanding of the complex remodeling process that the aneurysmatic descending aorta undergoes after a stent graft has been deployed.
At 12 months after TEVAR, patients with complications had net and relative increases in the global descending aortic volumes and net increases in aneurysm and both the proximal and distal aortic neck volumes. Volume analysis in the no-complication group confirmed the intended results of TEVAR for DTAA correction, which included a reduction in the aneurysm volume and stability of the dilatated descending aorta.
A net increase of 40 mL in the global descending aortic volumes at 12 months after TEVAR seems to be predictive of TEVAR-related complications, with high specificity and good sensibility, but more studies are needed to confirm our results.
Author Contributions
Conceptualization and writing—original draft preparation, E.R. and L.C.; methodology and data curation: B.B., E.R. and L.C.; validation, L.L., P.L. and M.D.I.; supervision, project administration, and writing—review and editing: E.M. and L.L. All authors have read and agreed to the published version of the manuscript.
Funding
This research received no external funding.
Institutional Review Board Statement
This study was conducted in accordance with the Declaration of Helsinki and approved by the Institutional Ethics Committee CE-AVEC of S.Orsola-Malpighi Hospital, Bologna, Italy; study protocol n.101/2011/O/Tess, code GRFE-2011, approved on 13 September 2011.
Informed Consent Statement
Informed consent was obtained from all subjects involved in the study. Written informed consent was obtained from the patients to publish this paper.
Data Availability Statement
The datasets generated and/or analyzed during the current study are available from the corresponding author upon reasonable request.
Acknowledgments
The authors are grateful to the participants who took part in the study, express condolences to the families of patients who died, and wish the living ones good health.
Conflicts of Interest
The authors declare no conflicts of interest.
References
- Nation, D.A.; Wang, G.J. TEVAR: Endovascular Repair of the Thoracic Aorta. Semin. Interv. Radiol. 2015, 32, 265–271. [Google Scholar] [CrossRef] [PubMed]
- Dake, M.D.; Miller, D.C.; Semba, C.P.; Mitchell, R.S.; Walker, P.J.; Liddell, R.P. Transluminal placement of endovascular stent-grafts for the treatment of descending thoracic aortic aneurysms. N. Engl. J. Med. 1994, 331, 1729–1734. [Google Scholar] [CrossRef] [PubMed]
- Walsh, S.R.; Tang, T.Y.; Sadat, U.; Naik, J.; Gaunt, M.E.; Boyle, J.R.; Hayes, P.D.; Varty, K. Endovascular stenting versus open surgery for thoracic aortic disease: Systematic review and meta-analysis of perioperative results. J. Vasc. Surg. 2008, 47, 1094–1098. [Google Scholar] [CrossRef] [PubMed]
- Fankhauser, K.; Wamala, I.; Penkalla, A.; Heck, R.; Hammerschmidt, R.; Falk, V.; Buz, S. Outcomes and survival following thoracic endovascular repair in patients with aortic aneurysms limited to the descending thoracic aorta. J. Cardiothorac. Surg. 2023, 18, 194. [Google Scholar] [CrossRef] [PubMed]
- Authors/Task Force Members; Czerny, M.; Grabenwöger, M.; Berger, T.; Aboyans, V.; Della Corte, A.; Chen, E.P.; Desai, N.D.; Dumfarth, J.; Elefteriades, J.A.; et al. EACTS/STS Guidelines for Diagnosing and Treating Acute and Chronic Syndromes of the Aortic Organ. Ann. Thorac. Surg. 2024, 118, 5–115. [Google Scholar] [CrossRef] [PubMed]
- Sharples, L.; Sastry, P.; Freeman, C.; Gray, J.; McCarthy, A.; Chiu, Y.-D.; Bicknell, C.; McMeekin, P.; Vallabhaneni, S.R.; Cook, A.; et al. Endovascular stent grafting and open surgical replacement for chronic thoracic aortic aneurysms: A systematic review and prospective cohort study. Health Technol. Assess. 2022, 26, 1–166. [Google Scholar] [CrossRef] [PubMed]
- McCarthy, A.; Gray, J.; Sastry, P.; Sharples, L.; Vale, L.; Cook, A.; Mcmeekin, P.; Freeman, C.; Catarino, P.; Large, S. Systematic review of endovascular stent grafting versus open surgical repair for the elective treatment of arch/descending thoracic aortic aneurysms. BMJ Open 2021, 11, e043323. [Google Scholar] [CrossRef]
- Lederle, F.A.; Kyriakides, T.C.; Stroupe, K.T.; Freischlag, J.A.; Padberg, F.T.; Matsumura, J.S.; Huo, Z.; Johnson, G.R. Open versus Endovascular Repair of Abdominal Aortic Aneurysm. N. Engl. J. Med. 2019, 380, 2126–2135. [Google Scholar] [CrossRef] [PubMed]
- Pantaleo, A.; Jafrancesco, G.; Buia, F.; Leone, A.; Lovato, L.; Russo, V.; Di Marco, L.; Di Bartolomeo, R.; Pacini, D. Distal Stent Graft-Induced New Entry: An Emerging Complication of Endovascular Treatment in Aortic Dissection. Ann. Thorac. Surg. 2016, 102, 527–532. [Google Scholar] [CrossRef]
- Writing Committee Members; Isselbacher, E.M.; Preventza, O.; Hamilton Black Iii, J.; Augoustides, J.G.; Beck, A.W.; Bolen, M.A.; Braverman, A.C.; Bray, B.E.; Brown-Zimmerman, M.M.; et al. 2022 ACC/AHA Guideline for the Diagnosis and Management of Aortic Disease: A Report of the American Heart Association/American College of Cardiology Joint Committee on Clinical Practice Guidelines. J. Am. Coll. Cardiol. 2022, 80, e223–e393. [Google Scholar] [CrossRef]
- Asch, F.M.; Yuriditsky, E.; Prakash, S.K.; Roman, M.J.; Weinsaft, J.W.; Weissman, G.; Weigold, W.G.; Morris, S.A.; Ravekes, W.J.; Holmes, K.W.; et al. The Need for Standardized Methods for Measuring the Aorta: Multimodality Core Lab Experience From the GenTAC Registry. JACC Cardiovasc. Imaging 2016, 9, 219–226. [Google Scholar] [CrossRef]
- Masson, E. Biomodeling and 3D Printing: A Novel Radiology Subspecialty. In: EM-Consulte. Available online: https://www.em-consulte.com/article/1489895/biomodeling-and-3d-printing-a-novel-radiology-subs (accessed on 24 June 2024).
- Bianchi, L.; Schiavina, R.; Bortolani, B.; Cercenelli, L.; Gaudiano, C.; Carpani, G.; Rustici, A.; Droghetti, M.; Mottaran, A.; Boschi, S.; et al. Interpreting nephrometry scores with three-dimensional virtual modelling for better planning of robotic partial nephrectomy and predicting complications. Urol. Oncol. 2021, 39, e1–e836. [Google Scholar] [CrossRef]
- Tarsitano, A.; Ricotta, F.; Cercenelli, L.; Bortolani, B.; Battaglia, S.; Lucchi, E.; Marchetti, C.; Marcelli, E. Pretreatment tumor volume and tumor sphericity as prognostic factors in patients with oral cavity squamous cell carcinoma. J. Cranio-Maxillofac. Surg. 2019, 47, 510–515. [Google Scholar] [CrossRef]
- Wijnen, N.; Brouwers, L.; Jebbink, E.G.; Heyligers, J.M.M.; Bemelman, M. Comparison of segmentation software packages for in-hospital 3D print workflow. J. Med. Imaging 2021, 8, 034004. [Google Scholar] [CrossRef]
- Krishnan Suresh Volume of a Surface Triangulation. 2024. Available online: https://it.mathworks.com/matlabcentral/fileexchange/26982-volume-of-a-surface-triangulation (accessed on 25 June 2024).
- Makaroun, M.S.; Dillavou, E.D.; Kee, S.T.; Sicard, G.; Chaikof, E.; Bavaria, J.; Williams, D.; Cambria, R.P.; Mitchell, R.S. Endovascular treatment of thoracic aortic aneurysms: Results of the phase II multicenter trial of the GORE TAG thoracic endoprosthesis. J. Vasc. Surg. 2005, 41, 1–9. [Google Scholar] [CrossRef]
- Fairman, R.M.; Criado, F.; Farber, M.; Kwolek, C.; Mehta, M.; White, R.; Lee, A.; Tuchek, J.M.; VALOR Investigators. Pivotal results of the Medtronic Vascular Talent Thoracic Stent Graft System: The VALOR trial. J. Vasc. Surg. 2008, 48, 546–554. [Google Scholar] [CrossRef] [PubMed]
- Matsumura, J.S.; Cambria, R.P.; Dake, M.D.; Moore, R.D.; Svensson, L.G.; Snyder, S.; TX2 Clinical Trial Investigators. International controlled clinical trial of thoracic endovascular aneurysm repair with the Zenith TX2 endovascular graft: 1-year results. J. Vasc. Surg. 2008, 47, 247–257; discussion 257. [Google Scholar] [CrossRef] [PubMed]
- Rudarakanchana, N.; Bicknell, C.D.; Cheshire, N.J.; Burfitt, N.; Chapman, A.; Hamady, M.; Powell, J.T. Variation in maximum diameter measurements of descending thoracic aortic aneurysms using unformatted planes versus images corrected to aortic centerline. Eur. J. Vasc. Endovasc. Surg. 2014, 47, 19–26. [Google Scholar] [CrossRef] [PubMed]
- Quint, L.E.; Liu, P.S.; Booher, A.M.; Watcharotone, K.; Myles, J.D. Proximal thoracic aortic diameter measurements at CT: Repeatability and reproducibility according to measurement method. Int. J. Cardiovasc. Imaging 2013, 29, 479–488. [Google Scholar] [CrossRef]
- Wever, J.J.; Blankensteijn, J.D.; Th M Mali, W.P.; Eikelboom, B.C. Maximal aneurysm diameter follow-up is inadequate after endovascular abdominal aortic aneurysm repair. Eur. J. Vasc. Endovasc. Surg. 2000, 20, 177–182. [Google Scholar] [CrossRef]
- Wolf, Y.G.; Tillich, M.; Lee, W.A.; Fogarty, T.J.; Zarins, C.K.; Rubin, G.D. Changes in aneurysm volume after endovascular repair of abdominal aortic aneurysm. J. Vasc. Surg. 2002, 36, 305–309. [Google Scholar] [CrossRef] [PubMed]
- Lee, J.T.; Aziz, I.N.; Lee, J.T.; Haukoos, J.S.; Donayre, C.E.; Walot, I.; Kopchok, G.E.; Lippmann, M.; White, R.A. Volume regression of abdominal aortic aneurysms and its relation to successful endoluminal exclusion. J. Vasc. Surg. 2003, 38, 1254–1263. [Google Scholar] [CrossRef] [PubMed]
- Arsicot, M.; Lathelize, H.; Martinez, R.; Marchand, E.; Picquet, J.; Enon, B. Follow-up of aortic stent grafts: Comparison of the volumetric analysis of the aneurysm sac by ultrasound and CT. Ann. Vasc. Surg. 2014, 28, 1618–1628. [Google Scholar] [CrossRef] [PubMed]
- Ghatwary, T.M.H.; Patterson, B.O.; Karthikesalingam, A.; Hinchliffe, R.J.; Loftus, I.M.; Morgan, R.; Thompson, M.M.; Holt, P.J.E. A systematic review of protocols for the three-dimensional morphologic assessment of abdominal aortic aneurysms using computed tomographic angiography. Cardiovasc. Interv. Radiol. 2013, 36, 14–24. [Google Scholar] [CrossRef] [PubMed]
- Dohle, D.-S.; Laverne, T.; Bavaria, J.; Savino, D.; Vallabhajosyula, P.; Szeto, W.Y.; Siki, M.; Wang, G.; Jackson, B.; Desai, N. Aortic remodelling after thoracic endovascular aortic repair in acute and chronic type B aortic dissections. Eur. J. Cardiothorac. Surg. 2020, 58, 730–737. [Google Scholar] [CrossRef] [PubMed]
- Stanley, G.A.; Murphy, E.H.; Knowles, M.; Ilves, M.; Jessen, M.E.; Dimaio, J.M.; Modrall, J.G.; Arko, F.R. Volumetric analysis of type B aortic dissections treated with thoracic endovascular aortic repair. J. Vasc. Surg. 2011, 54, 985–992; discussion 992. [Google Scholar] [CrossRef] [PubMed]
- Gaudry, M.; Guivier-Curien, C.; Blanchard, A.; Porto, A.; Bal, L.; Omnes, V.; De Masi, M.; Lu, C.; Jacquier, A.; Piquet, P.; et al. Volume Analysis to Predict the Long-Term Evolution of Residual Aortic Dissection after Type A Repair. J. Cardiovasc. Dev. Dis. 2022, 9, 349. [Google Scholar] [CrossRef] [PubMed]
- Nomura, Y.; Sugimoto, K.; Gotake, Y.; Yamanaka, K.; Sakamoto, T.; Muradi, A.; Okada, T.; Yamaguchi, M.; Okita, Y. Comparison of Volumetric and Diametric Analysis in Endovascular Repair of Descending Thoracic Aortic Aneurysm. Eur. J. Vasc. Endovasc. Surg. 2015, 50, 53–59. [Google Scholar] [CrossRef] [PubMed]
- Sharafuddin, M.J.; Bhama, J.K.; Bashir, M.; Aboul-Hosn, M.S.; Man, J.H.; Sharp, A.J. Distal landing zone optimization before endovascular repair of aortic dissection. J. Thorac. Cardiovasc. Surg. 2019, 157, 88–98. [Google Scholar] [CrossRef]
- Kölbel, T.; Panuccio, G. More Attention Needed for the Distal Landing Zone in TEVAR. Eur. J. Vasc. Endovasc. Surg. 2019, 58, 303–304. [Google Scholar] [CrossRef]
- Natural History of Descending Thoracic and Thoracoabdominal Aortic Aneurysms—PubMed. Available online: https://pubmed-ncbi-nlm-nih-gov.ezproxy.unibo.it/31982126/ (accessed on 24 June 2024).


Disclaimer/Publisher’s Note: The statements, opinions and data contained in all publications are solely those of the individual author(s) and contributor(s) and not of MDPI and/or the editor(s). MDPI and/or the editor(s) disclaim responsibility for any injury to people or property resulting from any ideas, methods, instructions or products referred to in the content. |
© 2024 by the authors. Licensee MDPI, Basel, Switzerland. This article is an open access article distributed under the terms and conditions of the Creative Commons Attribution (CC BY) license (https://creativecommons.org/licenses/by/4.0/).